#perf_prof_branch
1 messages · Page 18 of 1
 restive meteor
 bleak coral
restive meteor
How "Stable" runs the newest performance build? Usable for 2-3h sessions without...
bleak coral
restive meteor
How "Stable" runs the newest performance build? Usable for 2-3h sessions without...
In my unit, of about 50 people, I'd say a good 20-30 of us run it without issue, I've been using it for a LONG time and had no issues
restive meteor
I had a couple versions where it would have issues with Dialogs (TFAR/CTAB) so I uninstalled. Since I'm flying guys 100% of the times, I really don't like crashes.
But thanks, will give it a go and just hang around in the training server to see if there are issues.
bleak coral
cTab crashes just seem to happen randomly, had it before I started using profiling, where just opening cTab sometimes hard crashes the game. Never heard of an issue with TFAR in regards to it though
Does your server run the profiling branch too?
restive meteor
Wasnt really CTD with TFAR/CTAB. More like you press the keybindings and nothing happens. 2 Min later you had the interface finally on screen... But you had one instance for every time you pressed the keys...
Was really wierd. Disconnected, went to stable and the issue resolved. I think that was back in V2.1.8 or something
bleak coral
Strange. Not an issue we've noted before.
restive meteor
Ah, you know. Tons of possible reasons. Modpack Issues, Server Issues, Desync.
Apparently thats not an issue anymore, so perfect. I will give it another go then. Had couple Perf. Issues yesterday on Stable (because of some custom gear) so I hope I get some extra performance...
bleak coral
Don't forget to disable shadows in that case, I know some custom gear has shadowLODs that are extremely detailed.
 plain trout
And shadow drawing distance
 whole cloud
restive meteor
Wasnt really CTD with TFAR/CTAB. More like you press the keybindings and nothing...
whole cloud
restive meteor
Wasnt really CTD with TFAR/CTAB. More like you press the keybindings and nothing...
That sounds like the scheduler is overloaded. Happens when you have bad mods run too many scripts
restive meteor
Worth a try on the next session. But the gear in question is already scheduled for internal rework.
 knotty wraith
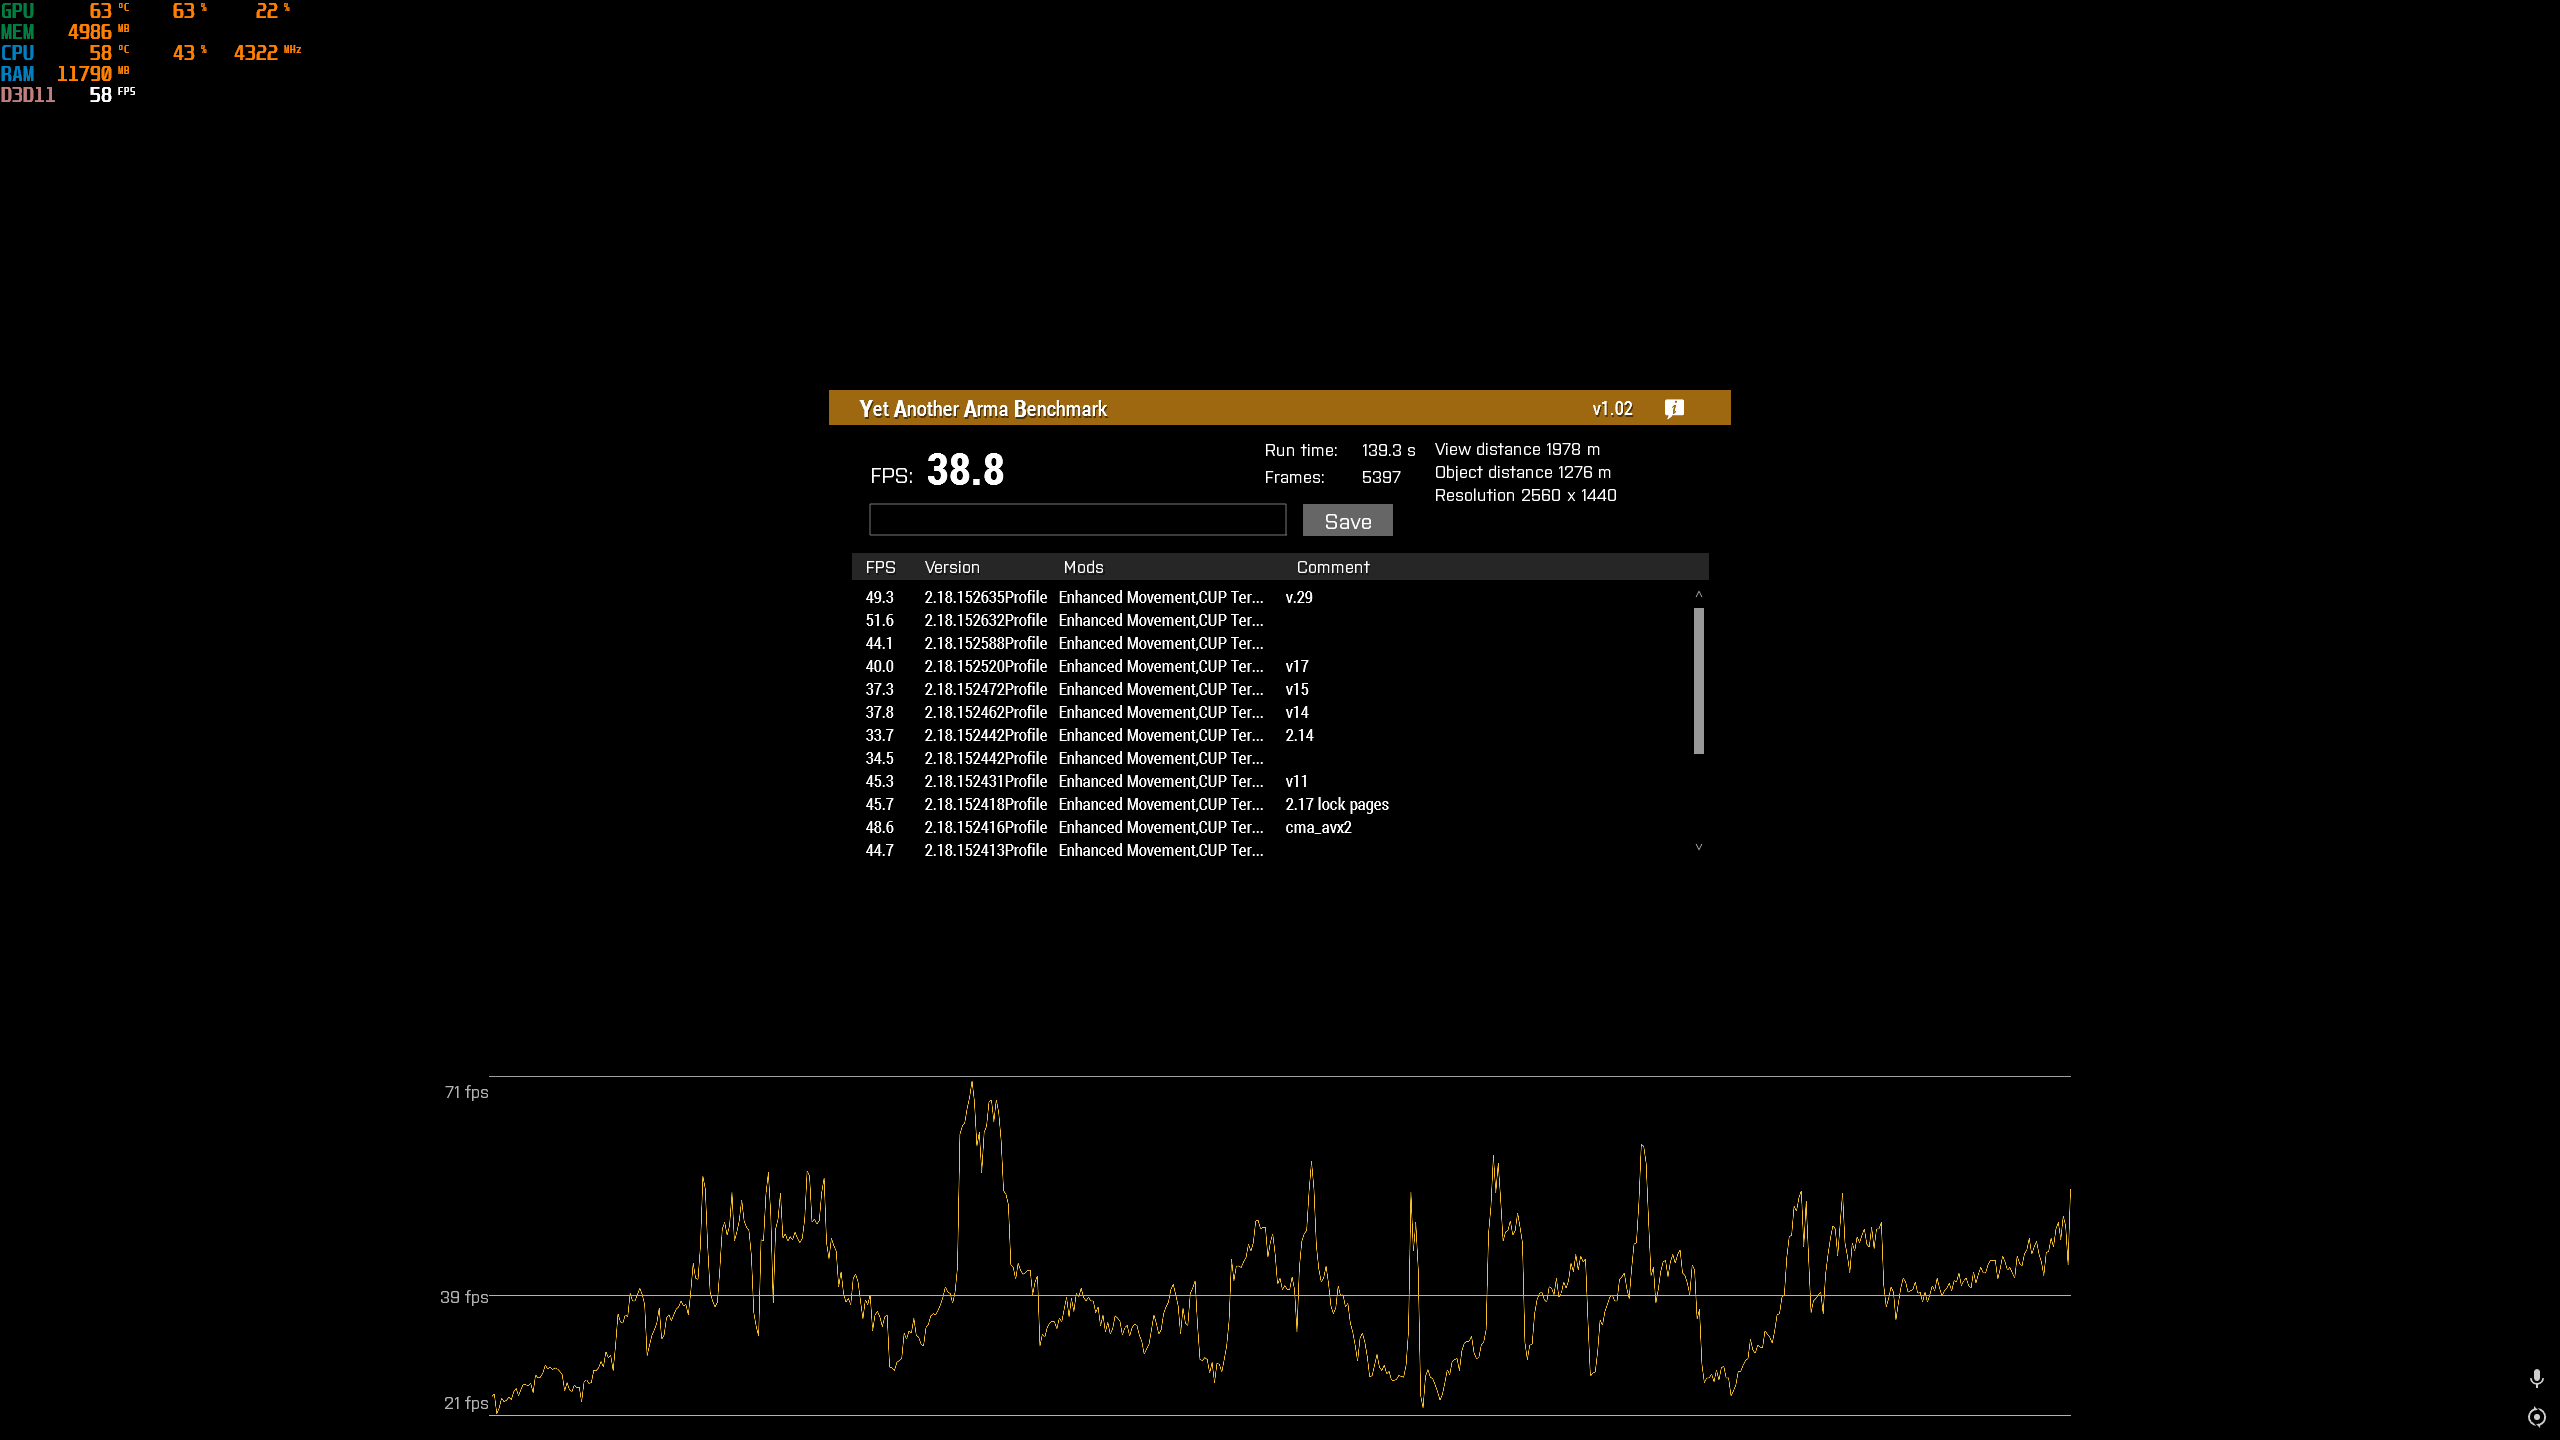
and what happened today? where did my yesterday's fps of 56 units go??!
https://imgur.com/bH7Gpsr
I ran yaab five times
 knotty wraith
I'm just in shock
 magic elm
Thank you! You’re amazing
 tawdry gazelle
By the way, if your game can run at least 50fps and graphics utilization is far from full (I use 4090, Arma 3 only takes 50% max), you may use Lossless Scale to double the fps by AI interpolation.
Cause Arma 3 is not a delay sensitive game, the response delay introduced by AI interpolation is very accetable.
 silk summit
tawdry gazelle
By the way, if your game can run at least 50fps and graphics utilization is far ...
silk summit
tawdry gazelle
By the way, if your game can run at least 50fps and graphics utilization is far ...
Is Ai interpolation == Frame Generation?
tawdry gazelle
silk summit
Is Ai interpolation == Frame Generation?
yes, they are much the same.
silk summit
tawdry gazelle
yes, they are much the same.
I am not a Lossless Scaling user so I don't know the terminology used there but I've seen videos where users set 2X or 4X interpolation so I believe that is what you are referring to
 quartz rampart
whole cloud
That sounds like the scheduler is overloaded. Happens when you have bad mods run...
quartz rampart
whole cloud
That sounds like the scheduler is overloaded. Happens when you have bad mods run...
i remember back in the day the AMD FX CPUs crashing with Arma 3 and CTAB and TFAR loaded.
silk summit
quartz rampart
i remember back in the day the AMD FX CPUs crashing with Arma 3 and CTAB and TFA...
I had one of those FX CPUs, they were dirty cheap but so bad... Arma 2 at 20 FPS tops
 slender lagoon
perf bin v14 seems to be the most performant on my end along side mimalloc 219
 carmine stump
m219 worse than 217
 inland dew
better to discuss mimalloc in #hardware_vs_arma and not here
 spiral eagle
groove
 lilac hearth
tawdry gazelle
By the way, if your game can run at least 50fps and graphics utilization is far ...
lilac hearth
tawdry gazelle
By the way, if your game can run at least 50fps and graphics utilization is far ...
I agree with that! I use and its very functional! 👍
tawdry gazelle
@whole cloud Hi Dedmen, as you are looking into memory things, could you tell me when these four Custom Memory Allocator APIs are actually used? 🤔
MemTotalCommitted, MemTotalReserved, MemFlushCache, MemFlushCacheAll.
(Other APIs' usage are obvious enough.)
mimalloc now omits those APIs. No obvious side effect omitting them.
spiral eagle
adding collects to the flush functions seems to improve the FPS a bit perhaps? ^_^

also, read a bit about the whole intel compiler thing on reddit.. it seems like intel has faced lawsuits for favoring their own CPUs in binaries outputted using the intel c++ compiler
so perhaps some people could use binaries compiled with msvc instead (default)? idk
spiral eagle
seems like 3.0.1 doesnt care about prioritizing huge pages either, but gjk already commented this on the gh issue linked before
whole cloud
tawdry gazelle
<@90532520101183488> Hi Dedmen, as you are looking into memory things, could you...
flushcache only when out of memory. Total committed/reserved only when reporting memory usage, profiling does that on capture frame
tawdry gazelle
whole cloud
flushcache only when out of memory. Total committed/reserved only when reporting...
How does out of memory triggers? malloc failed, or reaches a certain memory consumption? I assume the former? If so, it should be rarely called?
whole cloud
When VirtualQuery/VirtualAlloc fails to find a 16MiB chunk of memory. That really only happens on 32bit.
TotalCommitted seems to be checked every frame, if it detects too much overcommit, it calls flushcache
tawdry gazelle
Okay... then no need to implement that for mimalloc, as mimalloc reuses "overcommited" part internally. 🤔
@whole cloud How is overcommit detectd? TotalReserved vs Total Commited?
whole cloud
some math comparing committed to... used probably with some threshold thing
tawdry gazelle
I believe only part of Arma 3 allocates through CMA API, other parts still use system or compiler default, right?
Are there any typical consumption value or max limit of the CMA one? I am investigating if pre-allocate (or pre-reserve) pages improves performance, and wondering what default reserved size should I choose. 😅
whole cloud
Some parts use VirtualAlloc directly.
Not compiler default, we set the allocator globally
tawdry gazelle
whole cloud
Some parts use VirtualAlloc directly.
Not compiler default, we set the allocator...
Any idea how much memory does that "directly use VirtualAlloc" part usually takes? And does that part allocates/frees frequently? 🤔
Mimalloc now can do a global redirection by just adding one other DLL, I wonder if that worths.
whole cloud
the new pool allocators use it, a couple hundred MB at most.
whole cloud
@ kju
Every car does 4 checks.
For left and right side, the water or land surface (includes pond objects! "cLWSu"), and the road surface (roadway LOD "cLRSu")
I assume for you the water has moer impact, because you have ponds?
Just got this from official server.
Of all vehicle simulation, these checks are indeed quite alot.
But its probably too hard to get out of there

I could optimize it for cars that stand still.
With the downside of making it more expensive for cars that move..
 spiral pond
whole cloud
@ kju
Every car does 4 checks.
For left and right side, the water or land surf...
spiral pond
whole cloud
@ kju
Every car does 4 checks.
For left and right side, the water or land surf...
We use pond objects for the rivers (in Normandy and Mortain terrains)
(posted some more in the #1301458792323743817 thread)
Is the engine calculating "everything" [for vehicles/infantry] every frame/simulation cycle of the object? Or are some things like "FX" calculated only every n-th frame?
For AI i think to recall Ondra/Suma mentioned a slower cycle and also distance based (to nearest player)
 empty goblet
whole cloud
I could optimize it for cars that stand still.
With the downside of making it mo...
empty goblet
whole cloud
I could optimize it for cars that stand still.
With the downside of making it mo...
what about cars which stand still and are w/o AI inside ? unless those are cars with AI inside
prio > just standing vehicles > vehicles standing with AI in > vehicles moving
 fickle geyser
If you're looking at cars, can you take a look at the repro with trucks near rocks I've sent ages ago too?
silk summit
fickle geyser
If you're looking at cars, can you take a look at the repro with trucks near roc...

man I was really hoping we'd get two bangers in a row, but my fears turned out correct. This cDLC really hurts the image of the creator program and the overall perception of ArmA 3. It's clear there needs to be a much stricter QA/quality requirement from Bohemia's end.
Music:
Backing track is 'Wild Nights' - Shy5.
Game:
https://store.steampow...
☝️ Related to the vehicles near rocks issue (repro)
 restive pilot
It's a PhysX issue as I mentioned before (too many roadway surfaces)
I don't think there's anything you can do besides reducing the number of roadway surfaces (PhysX multithreading helps too but the problem happens even with 1 vehicle near 1 rock)
 orchid mesa
have had 3 other friends also mention they initially have no particle effects on v22 profiling after starting the game, and it randomly returns at some point during gameplay
 timber tinsel
Yep like @orchid mesa just said latest profiling on steam has presented an issue for several of our player on C4G KOTH where some people don't get particle effects like explosions or smoke rendering. Some report that verifying game files fix it, one reported that entering editor and using smoke nades there then returning to our servers fixed.
orchid mesa
it doesn't seem to be consistent, sometimes i have particle effects when starting the game, other times i dont and it returns 30 mins later
timber tinsel
Have been playing with profiling all day today and no issues myself. No clue about reproduction steps at this time
 uneven bluff
Is there any chance the getPlayerUID script function is tied to some kind of external service that can choke the server up if it's not responding correctly?
I'm asking because it seems like on multiple instances on the EU#11 server (which is on the profiling branch), that's the command that when executed repeatedly can cause the server to spiral, even though it's supposed to be normally return near-instantly (and works locally without internet).
 tribal pasture
What's really weird is that you can't get your own UID as client and have to wait for server to setup you a player unit first
GIB clientUID
Which should also work in SP
 thin wyvern
About consistency, sometimes game start (use different dxgi flip model) = Hardware Composed: Independent Flip and sometime Composed: GPU Copy


 night ruin
Don't know if there is a more appropriate channel for this, so will post here
@whole cloud
ArmaScriptCompiler does not support getUnitState, assuming it's a bug because it supports other commands from 2.18, it's also the only command from 2.18 that I couldn't find in commandList*cpp
compile E:/ArmaScriptCompiler/getUnitState.sqfc [ERR] [L1|C13|\ArmaScriptCompiler\getUnitState.sqf] Parse Error: syntax error, unexpected OPERATOR_N, expecting END_OF_FILE
getUnitState player;
Yes. I am considering going through and replacing every instance of getPlayerUID in the entire mission with a custom generated uid that eventually updates when the get uid service isn't choking, but that might be overkill. The reason I think this issue is surfacing recently is because of certain services under attack, but that's a total guess.
tribal pasture
uneven bluff
Yes. I am considering going through and replacing every instance of getPlayerUID...
I very much doubt getPlayerUID does any networking, makes no sense for it to
uneven bluff
tribal pasture
I very much doubt `getPlayerUID` does any networking, makes no sense for it to
Then why does it hang?
tribal pasture
Something else probably
empty goblet
thin wyvern
About consistency, sometimes game start (use different dxgi flip model) = Hardwa...
are you using tripleBuffering=1; in arma3.cfg ? (or enforcing various vsync or similar via some driver panel or tweaker tool like MSI afterburner etc.) ?
 heavy vortex
With fullscreen windowed I don't think Arma gets to pick the flip mode.
The variance is still interesting though.
If it's fullscreen exclusive then... uh.
thin wyvern
empty goblet
are you using `tripleBuffering=1;` in arma3.cfg ? (or enforcing various vsync o...
No but perf.exe have it at 144 I think in main menu 🤔
thin wyvern
heavy vortex
If it's fullscreen exclusive then... uh.
It is
 vivid bear
Crashed this evening on the latest build
empty goblet
thin wyvern
No but perf.exe have it at 144 I think in main menu 🤔
that's something completely unrelated then
uneven bluff
Any idea why there'd be this AI call that freezes the server for >5 seconds?
 aiWIS; 2.13262; 5810.00879;""
  tgNewS; 2.13278; 5809.73975;""
  tgNewS; 2.13296; 5809.96289;""
   tgTrk; 5.28275; 0.13029;""
    TrCxt; 5.28280; 0.00705;""
    tgTrE; 5.29015; 0.00017;"I_Soldier_exp_F"
    tgTrU; 5.29055; 0.00724;"I_Soldier_exp_F"
    tgTrF; 5.29788; 0.10729;"I_Soldier_exp_F"
   tgTrk; 5.61943; 0.08010;""
    TrCxt; 5.61950; 0.00647;""
    tgTrE; 5.62612; 0.00008;"I_Soldier_exp_F"
    tgTrU; 5.62640; 0.00284;"I_Soldier_exp_F"
    tgTrF; 5.62939; 0.06387;"I_Soldier_exp_F"
   tgTrk; 5.80840; 0.06472;""
    TrCxt; 5.80849; 0.00550;""
    tgTrE; 5.81413; 0.00016;"I_Soldier_AA_F"
    tgTrU; 5.81440; 0.00492;"I_Soldier_AA_F"
    tgTrF; 5.81949; 0.04756;"I_Soldier_AA_F"
   tgTrk; 5810.65332; 0.15050;""
    TrCxt; 5810.65381; 0.02136;""
    tgTrE; 5810.67627; 0.01197;"I_Soldier_GL_F"
     tgTrU; 5810.68848; 0.00003;"I_Soldier_GL_F"
    tgTrF; 5810.68848; 0.10733;"I_Soldier_GL_F"
   tgTrk; 5811.14551; 0.09564;""
    TrCxt; 5811.14551; 0.01118;""
    tgTrE; 5811.15674; 0.00566;"I_Soldier_AT_F"
    tgTrU; 5811.16309; 0.00004;"I_Soldier_AT_F"
    tgTrF; 5811.16309; 0.07144;"I_Soldier_AT_F"
Oh yeah looks like someone else had a similar problem: #perf_prof_branch message
Why would an AI targeting check call be like 5+ seconds.
 woven loom
I was playing MP today, I was the only one who couldn't hear gunfire from small arms 🤔 was running with CDLC and some small mods
== "G:\Program Files (x86)\Steam\steamapps\common\Arma 3\Arma3_x64.exe" -noSplash -name=SuicideKing -malloc=mimalloc_v217_20250103 -hugePages -showScriptErrors "-mod=RF;WS;CSLA;G:\Program Files (x86)\Steam\steamapps\common\Arma 3\!Workshop\@Selective Hearing;G:\Program Files (x86)\Steam\steamapps\common\Arma 3\!Workshop\@Simple MapTools [FA re-sign];G:\Program Files (x86)\Steam\steamapps\common\Arma 3\!Workshop\@CBA_A3;G:\Program Files (x86)\Steam\steamapps\common\Arma 3\!Workshop\@DUI - Squad Radar;G:\Program Files (x86)\Steam\steamapps\common\Arma 3\!Workshop\@MagRepack;G:\Program Files (x86)\Steam\steamapps\common\Arma 3\!Workshop\@Expeditionary Forces - Compatibility Data For Non-Owners" -beservice
I could hear the bullet cracks and whooshes but no gunshots, except my own
(other people were running the same mod set, so the only difference i can think of was that i was running perf)
heavy vortex
uneven bluff
Why would an AI targeting check call be like 5+ seconds.
I'd have guessed an OS-level issue given the timespan and all the threads apparently jamming equally. Someone else having a similar issue makes it more of a question.
Not sure what sort of logic in Arma would hang for ~five seconds though. Infinite time and short random time seem a lot more plausible.
uneven bluff
heavy vortex
I'd have guessed an OS-level issue given the timespan and all the threads appare...
It happened again in the same area.
I wonder if the AA has something to do with it. As far as I know, there wasn't anything in the air in the first instance (but there was in the second). I'll keep an eye out for that next time though.
heavy vortex
Assuming this only happens in profiling branch, it's unlikely to be a direct issue with the actual check. More likely to be a threading thing.
Also if the check itself was taking ages that ought to show up on the profiling.
There was a known issue where radar could trigger terrain generation outside the map area with expensive results, but it was never that slow.
woven loom
woven loom
I was playing MP today, I was the only one who couldn't hear gunfire from small ...
Hmm some other people were using sound mods like dynasound but that should just affect them
spiral pond
uneven bluff
Any idea why there'd be this AI call that freezes the server for >5 seconds?
```...
You may want to drop the full frame capture log here. However Dedmen likely will need a repro or at least more specifics on the situation to look for the possible root cause
whole cloud
Just realized something looking at a RPT that showed some capture frames..
Ref #perf_prof_branch message
Our old pool allocator, is quite slow when it has to actually allocate new memory, and if its empty, it throws away all memory it had.
Looking at the log, I can see there are many pools with only one or two elements inside them.
When you do a
if (x) then {}, that is two commands.
if (x) returns a temporary If type holding the conditions result.
ifType then {} reads that result, maybe runs the code, and throws away the temporary if type.
That if type, uses our old pool allocator.
The allocator is empty, we allocate one if type, we need to allocate new memory for the pool which is very slow (like 2-3x as slow as using the system allocator, 5x as slow as default allocator, 10x as slow as mimalloc)
We use the if type.
We throw it away again, deleting the last element in the pool, which makes it deallocate the memory it had.
And on the next if statement, we repeat that same crap.
We end up paying ~240us per if statement on root level (this does not happen when we have nested if statements), instead of paying 14-20us if the pool would not release its memory.
restive pilot
240us per if? Are you sure?
If that was true, wouldn't you see it when you do diag_codePerformance [{if...}] for example?
 eternal kraken
the diag_codePerformance result is ms not seconds, right?
 restive pilot
Yes
Which is why I said 240us (or even 20us) doesn't seem right to me
Maybe Dedmen meant something else tho
heavy vortex
Probably meant nanoseconds? Typical fast command is about 400-500ns here.
restive pilot
Yeah that's what I was thinking
woven loom
woven loom
I was playing MP today, I was the only one who couldn't hear gunfire from small ...
I tested... all good... my problems were my own doing, i was running CSLA when i shouldn't have been
whole cloud
I tried the particle effects thing, I just cannot reproduce it 🤔 Tried a handful times
whole cloud
uneven bluff
Is there any chance the `getPlayerUID` script function is tied to some kind of e...
No, it just finds the player who controls that unit, and fetches a stored value.
Its not asking any external service
whole cloud
night ruin
Don't know if there is a more appropriate channel for this, so will post here
<...
ASC has its own channel on my discord.
But I see I forgot to link it on github
whole cloud
uneven bluff
Any idea why there'd be this AI call that freezes the server for >5 seconds?
```...
That is not necessarily correct.
Due to coroutines the flow is not linear, but the profiling data shows only linear flow.
Your problem is one of the jobs that are super slow, not any specific call visible in your snippet or sccreenshot
whole cloud
woven loom
I was playing MP today, I was the only one who couldn't hear gunfire from small ...
"@Selective Hearing" mh
orchid mesa
whole cloud
I tried the particle effects thing, I just cannot reproduce it 🤔 Tried a handfu...
seems to be random for me, sometimes there's particles when i start the game, then other times there isn't and they come back after a bit
whole cloud
whole cloud
That is not necessarily correct.
Due to coroutines the flow is not linear, but t...
In the other case, it was the scheduler being apparently frozen up
But that doesn't make sense. The code cannot do that. If there was something wrong with it, it could freeze forever.
It could be slow and take a few milliseconds instead of microseconds.
But not freeze for 6 seconds
 whole cloud
restive pilot
240us per `if`? Are you sure?
whole cloud
restive pilot
240us per `if`? Are you sure?
Oh yeah that's wrong, its 240us for 2048 allocations, not for one.
Versus 14us for 2048 allocations on the new allocator.
in the 240us there would be 204 new pages allocated. (it runs in about 20us for the 2048 allocations, if no pages need to be allocated first, so about 200us of that is new pages, for 204 pages, about 1 us per)
So its more like 1us per allocation.
As opposed to... ~7 nanoseconds per with the new alloc
The slowdown only happens when no other if's are currently allocated.
So
[] spawn { if (true) then {Sleep 500;}; }
Now there is a if allocated, and the slowdown doesn't happen.
whole cloud
lol, oops

Something is weird with the allocators though.
Even the ones that are empty (like TeamMember variables, which practically don't exist), have 1 element allocated inside them 🤔
Mh guess its not a thing, it fakes its allocation count and thinks it always has 1 allocated even when it doesn't.
That way its never empty and never drops its last chunk, so that's not a thing :sad:
whole cloud
whole cloud
In the other case, it was the scheduler being apparently frozen up
But that doe...
I'll add a scope to that one, maybe that gives a bit more insight, but over 3 months only 2 people running into it.. Will it happen again?
whole cloud
vivid bear
Crashed this evening on the latest build

 whole cloud
That moment when you get a lagspike because... rabbits are being spawned

 void badger
Multithread the rabbits!!!
whole cloud
I tried some things with deliberately causing a freeze in the coroutines stuff. And even with that I cannot reproduce the picture kju had back then.
The thing kju had, doesn't even exist anymore.
I need the full capture log to guess what it might be.
woven loom
whole cloud
"@Selective Hearing" mh
Haha. no no that's fine, have run it before, others were running it as well. But shouldn't have been running CSLA so was probably a data mismatch.
woven loom
whole cloud
I tried the particle effects thing, I just cannot reproduce it 🤔 Tried a handfu...
Fwiw I also didn't notice the particle thing while playing, but will pay more attention next time
 fair ore
Anyone else getting application hangs on latest prof? Happened last night while I was doing a gun run in a jet and uhm
Well, it didn't end well
void badger
No issues here, running Blastcore on Ultra settings and all
spiral pond
whole cloud
I tried some things with deliberately causing a freeze in the coroutines stuff. ...
it wasnt mine - I just analyzed and shared frame captures by others. not that it matters (i think)
whole cloud
fair ore
Anyone else getting application hangs on latest prof? Happened last night while ...
if you get a hang you should've gotten a freeze dump that you can send me
fair ore
whole cloud
if you get a hang you should've gotten a freeze dump that you can send me
I got a mdmp after it closed
Would that have the info?
uneven bluff
whole cloud
No, it just finds the player who controls that unit, and fetches a stored value....
Hmm that’s odd. I’m seeing circumstantial evidence pointing to that command choking up the server when run too frequently (a few times a second) even though it’s supposed to be a simple retrieve. And sometimes it returns empty string when the player just joins. Does the first part of it (finding the player) from a dedicated server sometimes potentially become an expensive call?
heavy vortex
That's not very plausible. Look into what else you're doing.
vivid bear
Had another CTAB crash again tonight but it's annoying because the way it crashes it doesn't cause a MDMP - screen just freezes and can only force close it via Windows
 heavy galleon
vivid bear
Had another CTAB crash again tonight but it's annoying because the way it crashe...
heavy galleon
vivid bear
Had another CTAB crash again tonight but it's annoying because the way it crashe...
You can also create a memdump through task manager before you force close it.
 serene widget
Can someone tag me in anything that has the most up to date instructions for the best performance on the profiling build?
 prisma snow
vivid bear
Had another CTAB crash again tonight but it's annoying because the way it crashe...
prisma snow
vivid bear
Had another CTAB crash again tonight but it's annoying because the way it crashe...
What ctab version?
vivid bear
prisma snow
What ctab version?
 whole cloud
uneven bluff
Hmm that’s odd. I’m seeing circumstantial evidence pointing to that command chok...
whole cloud
uneven bluff
Hmm that’s odd. I’m seeing circumstantial evidence pointing to that command chok...
The cost increases when there are more players on the server.
But its still only a few microseconds. That command is not your problem
whole cloud
2.18.152659 new PROFILING branch with PERFORMANCE binaries, v23, server and client, windows 64-bit, linux server 64-bit
- Changed: Rendering of all map controls (Please report if you notice any changes in how map's are being rendered)
- Changed: Increased size of rendering command buffer (for "Rendering command buffer to small" crashes)
- Fixed: getOrDefaultCall was not blacklisted for SimpleVM (Would cause weird behavior when using _x inside a loop with it, thanks @stark falcon)
- Fixed: setPiPEffect, Chromatic Aberration and Film Grain did not work (thanks person who's name I forgot)
- Fixed: Crash when using a SoundSet with "delay" inside a vehicle - https://feedback.bistudio.com/T188707
- Fixed: Weapon muzzle attachments recoilCoef was not applied to player-used weapons - https://feedback.bistudio.com/T167366
- Fixed: inAreaArray/inAreaArrayIndexes would not accept location/marker names (Recently broken on profiling branch)
- Fixed: Crash in AI Pathfinding if building is deleted (Thanks @fast hornet)
- Fixed: thermalResolution config parameter did not work when setting a single resolution instead of a zoom range (Thanks @clever roost)
- Fixed: ui2tex textures would sometimes think they are not visible on screen and never update their image (Thanks @acoustic lynx)
- Fixed: Several minor crashes
If you don't want to use the Steam branch, the files are also available for alternative download here:
https://drive.google.com/drive/folders/15p9j7C2nHUt6NoVfChX4YFuqzFXzblJh
Note: There are separate Dll files that also need to be placed into Game folder.
whole cloud
whole cloud
2.18.152659 new PROFILING branch with PERFORMANCE binaries, v23, server and clie...
 fading elbow
Getting FPS in the single digits and rpt spam when objects are outside map boundaries in the HWS NR6 HAL v1.10.5 dynamic mission series.
It happens in the current profiling version and the previous one. I thought it was already reported or being worked on, but it seems it isn't. The problem isn't present if switching to the current stable version.
14:35:52 StreamSource: tem\tem_kujari\tem_kujari.wrp; TellGFromOffset: 68; WantedOffset: 0; WantedSize: 163498563; ReadedID: 524416; MapGrid: (306,523); ReadedIndex: 13271179 14:35:52 Accessing static object outside landscape (306,523 out of 512,512 - 512,512)
eternal kraken
fading elbow
Getting FPS in the single digits and rpt spam when objects are outside map bound...
maybe this? #1301458792323743817 message
fading elbow
yes, seems about right
whole cloud
Stop putting things outside of map 😠
I know why, I'll fix it 😠
whole cloud
That's something I don't see often lol
 spiral pond
this is done with Intel® VTune™ Profiler, right? we can't as it requires the developer build or can we?
 full nova
whole cloud
Stop putting things outside of map 😠
I know why, I'll fix it 😠
full nova
whole cloud
Stop putting things outside of map 😠
I know why, I'll fix it 😠
is 0,0,0,0 counts as outside the map?
 gritty wasp
whole cloud
That's something I don't see often lol
gritty wasp
whole cloud
That's something I don't see often lol
multithread rabbits?
 fast hornet
one thread per rabbit/critter, easy. 
gritty wasp
crash on yaab run
whole cloud
Both of these chunks, do some task, have the same input and the same output.
One of them runs 4x as many tasks as the other. I won't tell you which one that is.
One of them takes 50x as much time as the other. You can already see which one that is.
More on that tomorrow when I'm done with it. This probably won't lead to any noticable fps improvements, but its quite interesting IMO.
 heavy vortex
Not a whole lot to go on, but maybe noteworthy that the main thread activity is lower in the second run? Like the first run is polling mutexes too often and jamming the workers.
 vale shoal
Question, is this due to the Steam API update on profiling that Steam is not showing anymore what players do in Arma 3?
Usually below "Arma 3" it showed like "In Menu" or "Virtual Arsenal"
 whole cloud
It worked for me yesterday 🤔
inland dew
gritty wasp
crash on yaab run
it also crashes for me.
went back to stable
i have no logs, because they were disabled.
game simply closing, pc rebooting, dx device "removed" etc
on stable everything just works for many many many hrs
fast hornet
pc rebooting doesn't really sound like an arma only problem though
 elder torrent
Yeah PC rebooting is almost certainly a hardware problem, likely memory/psu or both. Perf brach with the optimizations might just stress the system in a new way that reveals underlying hardware instability.
Try doing a prime95 blend test and/or y cruncher that'll be a good check.
fast hornet
yeah, good advice. Can also recommend TestMem5 with the "@1usmus_v3" profile. Arma 3 was always great as a secondary stability test for memory overclocking since it's really really sensitive to errors in that regard compared to most other loads.
But when a3 is crashing your whole system you'll most likely have some underlying problem somewhere that just doesn't get triggered by other software and earlier builds.
All just theory though. 🙂
 deft oak
whole cloud
2.18.152659 new PROFILING branch with PERFORMANCE binaries, v23, server and clie...
deft oak
whole cloud
2.18.152659 new PROFILING branch with PERFORMANCE binaries, v23, server and clie...
Quick question on the weapon muzzle attachment fix, will both the client and server side version need to be applied for this take effect? Basically, if I don't apply it to the server should everyone still have the same recoilCoef with or without the profiling client?
 hearty haven
Profiling with V217 malloc https://github.com/GoldJohnKing/mimalloc/releases
Intel, same lmao,
crashes on new profiling, hard crash(black screen) always
thought i've degraded
y-cruncher passes, but going through TestMem5 already found errors
back to timings settings
found place with reproductible crash(Plane flight on Kurjari map)
woven loom
elder torrent
Yeah PC rebooting is almost certainly a hardware problem, likely memory/psu or b...
This is not necessarily true -- BSODs are unlikely to be triggered by applications but if optimisations include things like multithreading or other low level engine stuff then it's possible to cause issues. C/C++ is low level enough that it can absolutely do funky stuff.
If multiple people are crashing on profiling then it's far more likely that the program is causing the issue and not user hardware
It could be application and driver interactions that are causing issues for example
elder torrent
It depends on what specifically is happening. A BSOD and then the computer restarting automatically yeah it could be many things, but if the PC just straight up reboots without giving any errors before hand it's usually some kind of power/memory issue.
woven loom
Maybe. If there's a sort of shut down and then restart (vs "hot" reboot) then yeah i agree power/memory likely.
Though regarding BSODs, Win 7 onwards it's usually very hard for applications to cause it, usually just hardware or drivers
I'll just test the new profiling build too though
woven loom
OK I am NOT getting crashes with vanilla + current profiling + mimalloc v217
Ryzen 7800X3D + 4070 Ti + DDR5-6000 CL30 (AGESA default EXPO timings)
So yeah Elitehunter is right, y'all have possible hardware issues
I even tried with the extreme preset
No crash with LAMBS either
hearty haven
90% it's hardware(overclock) issue
woven loom
Well no crash for me even with the preset "aggressive" memory timings
hearty haven
Arma just fits into cache😆
woven loom
Haha
Memory speeds definitely affect Arma though... Well at least without X3D stuff, not sure with
hearty haven
i just achkowledge that v217 is kinda bad, need to update that stuff
https://github.com/GoldJohnKing/mimalloc/releases
woven loom
Hmm yeah i should update it
update: v219 didn't really make a difference to avg fps...
hearty haven
@inland dew
y-cruncher pass all tests 25min,
TestMem 0.13.1(DDR5 Intel @anta777 preset)
error on 5 min,
tREFI 262143 to 65535
so far 30 min 0 errors
 stark falcon
map texutres blocky on edge, features like trees, buildings, gridlines all render as solid white
same result with _map ctrlMapSetPosition []; and useRealViewport = 1; this is just RscMapControl

it's somehow related to ambient light, water looks a little more normal at night
spiral pond
5 runs after another. quite consistent - curious what the 4 fps mini freeze of the first run is


 woven loom
what is this system? 😅
hearty haven
@whole cloud
if i attach moded game crash
minidump file from %appdata%, does it help?
or you want only vanilla?
spiral pond
woven loom
what is this system? 😅
reference system to test minimum requirements for A3 as required for CDLCs 😉
whole cloud
deft oak
Quick question on the weapon muzzle attachment fix, will both the client and ser...
The bullets will hit according to what the shooters machine says.
The others may see the bullet flying elsewhere than where it hits
deft oak
whole cloud
The bullets will hit according to what the shooters machine says.
The others may...
so if one shooter is on the profiling branch they'll have a different recoil than a shooter on stable?
assuming the recoilCoef of the attachment isn't 1 at least
whole cloud
stark falcon
map texutres blocky on edge, features like trees, buildings, gridlines all rende...
2D or 3D UI?
You say ambient light, that sounds like 3D
whole cloud
hearty haven
<@90532520101183488>
if i attach moded game crash
minidump file from %appdata%,...
yes, no
whole cloud
deft oak
so if one shooter is on the profiling branch they'll have a different recoil tha...
yes
my yaab is floobin fine

So far I have one crash, that is nowhere near any of the changes in v23.
And a PC reboot on a probably overclocked machine
Seems this is good for the weekend, unless there's more issues today. Besides the map rendering, all the changes are pretty low risk though
stark falcon
3d type = 82;
whole cloud
stark falcon
3d `type = 82;`
3D support for map is completely new and not tested at all 😄
Do you think its fine if we just turn off the lighting there (if we even can..)?
I'll need to repro it sometime next week and then I can see if I can get it better
Does the map move correctly when you angle the 3D area?
Yeah ControlObjectContainer (I assume thats 82), always gives it all active lights.
I can add a config option to give it no lights, maybe thats enough
hearty haven
@inland dew managed to play on latest profiling + malloc kinda stable,
pass that point where i catch guarantee crash
extra +0,01v Vcore to get stable, arma 3 more hungry that y-cruncher tho
totally hardware issue
whole cloud
whole cloud
Both of these chunks, do some task, have the same input and the same output.
One...
The simplest way to do multithreading, is to take some forEach loop, cut it up into chunks and spread it across multiple threads all doing the same stuff, on different elements of the array.
Luckily enfusion came with a way to do that, but it was a bit clumsy to use so I tried to make my own instead.
Lets see how it holds up, when filled with different number of tasks. For testing how much "overhead" it has, just some super simple task calculating sqrt of one number.
Oh. Mh.
How about cpu utilization?
Oh. Mh. (256 enf runs first. Then 1024 "new" runs). Huh!.
And yes, I confirmed that my code gets executed, all the data is being sqrt'ed
The end result is the same, one of them just takes about 50x as long, to run 1/4th of the work.. What's going on here?
A worker thread with the enf system, spends 30.9% of its time, executing the "work" function, the rest is overhead (Finding next job to work on 12%ish, notifying others that the job has completed 49.1% (even though only one job is being waited for, the notifications for all the other 99.9% get thrown into the void)).
But. Due to enf design combined with RV being crappy, 93% of the time inside the work function, is spent looking up array elements..
Only 2.3% of the total cpu time in the worker thread, is spent executing the sqrt, the actual work I want to get done...
The overhead per job is still quite small, it adds up the more jobs you run, but enfusion in general runs only few jobs and distributes their work well, so they don't notice this.
But if I want to throw hundreds of jobs into there, for lineIntersects or particles.

So lets fix up the enfusion jobs a bit.
Step 1, mark jobs that no-one can be waiting for, so they don't try to notify everyone, when no-one is listening.
Well that's a bit better at the top end.
Not notifying also has issues, like waiting threads, might not notice when new tasks become available, and they could spend their time working on them instead of waiting.
So its not that good of a change, but in RV I know situations where no new tasks can come in and where we can do this

Step 2.
For waiting for all jobs to finish, we wait till a counter of running jobs, goes back down to zero.
But, Enfusion uses one counter to do that. All threads hammer on that one counter, and everytime one of them changes it, they need to synchronize that change with all other threads which slows them down quite alot.
Split it into separate counters per thread, so each has their own and they don't compete with others, and once their own counter reaches zero, they bump the final counter.
Now the final counter only gets bumped 12 times, instead of 16 thousand times.

 cloud sky
I hope and guess these improvements will be added to Enfusion itself too 😛
whole cloud
Enfusion is alot better now, but mine still wins..
Enfusion, creates one job for every task. It creates 16 thousand jobs, it initializes 16 thousand jobs, it schedules 16 thousand jobs, the worker thread need to find the "next job" to work on 16 thousand times..
Not good.
So mine sets a max limit of jobs, and makes each job run multiple tasks.
All the overhead of scheduling and running many jobs, just goes away if you simply don't have many jobs.
Which means the improvements I've done to enf itself, are mostly useless 😄
whole cloud
cloud sky
I hope and guess these improvements will be added to Enfusion itself too 😛
Yeah they're looking into doing the separate counters thing. But they don't run as many jobs as I do to bruteforce squeeze multithreading into RV. They are not as impacted by this
fast hornet
woven loom
Haha
Memory speeds definitely affect Arma though... Well at least without X3D st...
with X3D as well .. the things arma loves the most are cpu cache, then memory speed and then (single core) cpu speed 😄
cloud sky
fast hornet
with X3D as well .. the things arma loves the most are cpu cache, then memory sp...
Makes sense once you figure out how much time CPUs spend simply waiting for needed data
fast hornet
the jump from a non-x3d cpu to one with the extra cache is actually insane for the client. Think when that happened i jumped from ~30fps to ~120fps at the worst place on the map (ok, 9600k to 7950X3D wasn't exactly fair to the 9600k even without the extra cache, but still)
uneven bluff
I keep getting these 5+ second hiccups in the AI group stuff:
  aiFSM; 2.09010; 0.01691;"Formation:Next_target__Out"
         aiFSM; 2.10762; 0.01678;"Formation:Next_target__Out"
        aiGCT; 2.12569; 5533.28906;""
         aiCT1; 2.12582; 5533.07422;""
          aiWIS; 2.13992; 5532.97900;""
           aiWIS; 2.13993; 5532.96533;""
          aiWIS; 2.14120; 5533.00635;""
           aiWIS; 2.14127; 5533.00000;""
            aiWIS; 2.14145; 5532.98535;""
            aiWIS; 2.14160; 5532.99219;""
          aiWIS; 2.14215; 5533.01270;""
          aiWIS; 2.14221; 5533.02002;""
          aiWIS; 2.14270; 5533.02637;""
          aiWIS; 2.14273; 5533.03418;""
          aiWIS; 2.14277; 5533.04102;""
          aiWIS; 2.14285; 5533.04688;""
          aiWIS; 2.14362; 5533.05420;""
           TrCxt; 5535.07666; 0.02228;""
           tgTrE; 5535.09912; 0.00026;"I_medic_F"
           TrCxt; 5535.10791; 0.00877;""
            tgTrE; 5535.11670; 0.00018;"I_Soldier_TL_F"
           TrCxt; 5535.12012; 0.00542;""
    aiFSM; 2.07827; 0.01250;"Formation:Next_target__Out"
         aiFSM; 2.09152; 0.02015;"Formation:Next_target__Out"
         aiFSM; 2.11258; 0.00065;"Formation:Search_path__Covering"
         aiFSM; 2.11367; 0.03071;"Formation:Next_target__Out"
         aiFSM; 2.14548; 0.00293;"Formation:Combat"
        aiGCT; 2.15783; 5166.27881;""
         aiCT1; 2.15797; 5166.12500;""
          aiWIS; 2.17027; 5166.02002;""
          aiWIS; 2.17159; 5166.04102;""
           aiWIS; 2.17189; 5166.03125;""
          aiWIS; 2.17240; 5166.04834;""
          aiWIS; 2.17271; 5166.06445;""
           aiWIS; 2.17288; 5166.05664;""
          aiWIS; 2.17299; 5166.07129;""
          aiWIS; 2.17372; 5166.07959;""
          aiWIS; 2.17423; 5166.08496;""
          aiWIS; 2.17438; 5166.08936;""
          aiWIS; 2.17444; 5166.09570;""
          aiWIS; 2.17458; 5166.10010;""
          aiWIS; 2.17485; 5166.10596;""
           TrCxt; 5168.14795; 0.03637;""
           tgTrE; 5168.18408; 0.00031;"I_Soldier_TL_F"
           TrCxt; 5168.19385; 0.00809;""
            tgTrE; 5168.20166; 0.00015;"I_Soldier_SL_F"
I still don't understand how long it took for the CPU manufacturer(s) to start adding extra cache, as it was well known ages ago that it's the most limiting factor when it comes to performance. Intel even tested it with the i7 5775C which proved the point
fast hornet
oh that's very simple to explain: Money.
Most applications don't benefit as extreme as games do.. and for those that do they want people to buy the Server and Workstation CPUs. Those always had more cache.
same reason why nVidia is still only slapping 16GB onto it's 5080 .. anything more and it can be realistically used for AI
cloud sky
fast hornet
oh that's very simple to explain: Money.
Most applications don't benefit as extr...
I thought it would be a big enough market for them to care, but I guess I'm wrong here 😄
fast hornet
maybe it is a big enough market and they just misjudged it... it probably has to be since AMD keeps cranking out X3D-Chips
whole cloud
uneven bluff
I keep getting these 5+ second hiccups in the AI group stuff:
```
aiFSM; 2.090...
As I tried to tell you before, these snippets are useless. One needs to look at the full log.
Send me the full log and I can take a look
uneven bluff
whole cloud
As I tried to tell you before, these snippets are useless. One needs to look at ...
It's now happening consistently to me on the server. There's a job that seems to be running slow but it doesn't show where
job; 1.38255; 0.00012;"mJobM"
job; 3.66989; 5437.61182;"crtSchedM"
 job; 3.67266; 0.00036;"crtSchedM"
job; 5441.28223; 0.00307;"ParallelFor SharedCleanup"
 job; 5441.28369; 0.00065;"crtSchedM sync"
job; 5441.92188; 0.00466;"uRJ"
And
* Thread enfWorkShort 5
job; 3.66969; 5437.60596;"crtSchedM"
 job; 3.67285; 0.00026;"crtSchedM"
Sent you the logs. I'll try to keep gathering data.
spiral eagle
whole cloud
2.18.152659 new PROFILING branch with PERFORMANCE binaries, v23, server and clie...
- Fixed: Crash when using a SoundSet with "delay" inside a vehicle - https://feedback.bistudio.com/T188707
was this problem a recent regression or ?
have had so many sound issues in arma ^_^ always related to audio driver or xaudio
whole cloud
spiral eagle
> - Fixed: Crash when using a SoundSet with "delay" inside a vehicle - https://f...
been broken for years
spiral eagle
giving me hope 🥹
spiral eagle
i just wish there was a reliable way of testing the t90 sound bug
heavy galleon
whole cloud
The simplest way to do multithreading, is to take some forEach loop, cut it up i...
#pragma openmp
 solved
whole cloud
For long time one part of AI pathfinding was an issue. Where we prepare the grid (It says how high it is, what obstacles are on it) before we give it to the actual pathfinding algorithm, that then finds a path on the grid. Finding path is already asynchronous, but creating the grid is not.
Was investigating that on official servers years ago already, where we had lag spikes due to it, and I added a system to limit how many AI's can do it per frame so we don't drop too hard..
I also invested some time trying to make it a bit faster (without multithreading because that was too slow back then)
What I didn't see back then, was what actually was the slow part there.
About half of it, is initializing all the grid cells AND checking if they are under water or not.
That water level check, is actually whats costing most of the performance.
For one, it iterates over all pond objects nearby, which kju often found to be a problem.
Then it calculates the exact sea level, including waves.
And then it checks the terrain height at that spot, to check if the terrain is below water level.
So to check a cell on a mountain top, it first goes below the terrain, to the water level, and calculates if there would be a wave there, and how high it would be. Only to then realize, that water is 200m below ground, I don't care about it.
For one, we have a function where we can pass in the height, and if its above the possible wave level, it skips all the wave calculations, that's a 3 character code change, to make this MUCH cheaper.
Second, we could multithread that, but if I just do the tiny change, its probably enough
 spiral pond
does the cell size matter with this? if so, what terrain/cell size are you testing with?
whole cloud
Every grid has the same number of cells inside it. So this takes about the same time for every grid.
So that little 3 character change? What does it do?
 whole cloud
spiral pond
does the cell size matter with this? if so, what terrain/cell size are you testi...
whole cloud
spiral pond
does the cell size matter with this? if so, what terrain/cell size are you testi...
no
The remaining time, is a loop running over all the objects in the area, doing some basic checks to exclude most objects that don't matter.
The basic checks are multithreadable, but if it finds an object that does matter, it rasterizes it, which is not safe.
But looking at where we spend the time. That rasterizing step is the minority..
So I could just multithread this filtering, and collect all the things to rasterize. But thats too annoying to do it now, maybe another day. I already shaved off a third..
I wasn't even looking for this, I stumbled upon it while investigating that 5 second freeze thing :/
 knotty wraith
I'm shocked - what's wrong with the memory on the server after the new prof update - it's never been less than 10 gigs of RAM
I hope this is a pleasant shock)

 autumn timber
Maybe you ran the 32bit version, by mistake?
knotty wraith
autumn timber
Maybe you ran the 32bit version, by mistake?
maybe it's related to the new map for the mission, we'll have to check that
gritty wasp
I'm happy for the PvE players. I wish PvP got something too
spiral pond
you need to share frame captures for that to identify problematic parts or areas with room for optimization
whole cloud
So much pain... Ugh.
So, we had these recent reports of 0fps on a headless client.
I did not identify what piece of code actually caused the slowdown, but we found the root cause.
The game was ran with its CPU affinity set, to limit the game to only be able to use 2 cpu cores.
BUT, the game had no -cpuCount parameter set, so it automatically detected how many cpu cores the system had, which is 12.
So the game set itself up to run 12 threads, but only got 2. So now it had 12 threads all competing with eachother, which the new multithreading stuff very much doesn't like.
So today, next issue. Big 5 second lag spikes, in the AI coroutines.
Couple hours debugging, can't figure out much. Its super weird, it seems like the main thread just freezes, and in some captures we can also see that some completely independent AI pathfinding thread, is also freezing at the same time.. This doesn't make any sense.
Until a comment just on the side.. "Its a 4 core server". No its not, I can see in the captures that the game is running 12 threads! Oh.. Wait.....
spiral eagle
can you release a3 src code so we all can help you with this? ❤️
whole cloud
I don't think "all" have the ability to write code without making things worse than they already are 😄
spiral eagle
💀
 leaden relic
Put a cryptominer in arma 3 so you can pay new developers
autumn timber
whole cloud
I don't think "all" have the ability to write code without making things worse t...
You just need to accept PRs only from those that have that ability - problem solved 🙃
fast hornet
whole cloud
So much pain... Ugh.
So, we had these recent reports of 0fps on a headless clie...
User error, nothing to fix imho 🤷
If you play with affinities you need to know your CPU and what you're doing in general.. that's true for all applications, not just arma.
hearty haven
whole cloud
So much pain... Ugh.
So, we had these recent reports of 0fps on a headless clie...
just curious, did you test codebase through some static code analyzers?
whole cloud
hearty haven
just curious, did you test codebase through some static code analyzers?
I run clang tidy sometimes.
Takes an hour to scan and finds thousands of problems.
spiral eagle
good GOD
dedmen avoid sonarqube please
put out an internal PSA or something
these mfs have been spamming my phone these past few months just because i signed up for a trial
whole cloud
I "fixed" that issue now. That should hold off people making that mistake from suffering too badly.
It will still perform badly, but not freeze the server for seconds
 autumn timber
Remove the second "s" from the "misconfiguration" while you still can!
whole cloud
But my spellchecker isn't complaining! :U
nvm

Luckily we have profiling branch.
With just dev-branch and local testing, we would never have found this
autumn timber
Out of curiosity: is there no way for linux users to mess this up as well, so that you've enclosed that in the _WIN32 ifdef?
whole cloud
I don't know what the linux equivalent of SwitchToThread is, and I don't care enough to look it up
I trust linux users more to configure stuff properly 😄
heavy galleon
pthread_yield iirc
been a while
uneven bluff
Windows allowing you to configure CPU affinity straight from the task manager is surprisingly config-friendly for Windows. I wouldn't be surprised if they took that away eventually
whole cloud
https://man7.org/linux/man-pages/man2/sched_yield.2.html Ah we already do that
spiral eagle
eh i think its to do with mode of operation
windows users commonly use gui, linux users cli
whole cloud
Each of these loop iterations that I check there, run sched_yield on linux, and _mm_pause on windows.
Because.. someone else decided that should be equivalent a decade or so ago
Seeing what sched_yield does, seems like it would make this perform worse on linux as it will suspend too often
fast hornet
Most of proper windows admin stuff is done via powershell these days
spiral eagle
package installation & configuration yes
autumn timber
fast hornet
Most of proper windows admin stuff is done via powershell these days
With the amount of hate Enfusion Script got here for not being "newbie-friendly" and requiring you to have a skillset close to professional programming, I honestly don't expect statistical people hosting servers to be vastly different from the statistical ones scripting.
whole cloud
Also a funny thing I found today.
Reading the value in a atomic number.
Enfusion: volatile read + reordering barrier
RV: Locked compare exchange 💀
whole cloud
compare with 0, and exchange with 0. Returns the value that was in memory before the compare/exchange was done.
I don't know why, I don't want to look up who decided that over a decade ago
spiral eagle
CAS for reading the value of a variable
no i think you should find the person actually
whole cloud
I found him, he's still there, and he's been informed of his past 🤣
empty goblet
whole cloud
For long time one part of AI pathfinding was an issue. Where we prepare the grid...
glad you removing one of the nightmares which was haunting me/us for so long
empty goblet
whole cloud
So much pain... Ugh.
So, we had these recent reports of 0fps on a headless clie...
i do wonder if this fix, fixes the weird bug i see sometimes on CDLC servers which after self-restart, gets 0 fps and keeps spamming that nonstop
heavy vortex
Hmm, can affinity be detected by the application?
GetProcessAffinityMask apparently
Feels like you should just force cpuCount down with that.
whole cloud
if the affinity is already set at process start, and not set right after by some tool
heavy vortex
ugh
I wonder if any server providers are using affinity, or it's just people tweaking their own boxes.
woven loom
whole cloud
Enfusion is alot better now, but mine still wins..
Enfusion, creates one job for...
man i hope you get a promotion after all this, and get to work on Arma 4 and enfusion things 😄
and honestly the rest of the A3 life support team too
whole cloud
Never gonna give Arma 3 up, never let Arma 3 down
woven loom
lmao i suspected that too
but we also don't want to wait until 2040 for optimized arma 4 😛
(the texture/asset load stuttering in reforger is really annoying... assuming it's not shader compilation stutter -- iirc reyhard said it wasn't)
 obsidian condor
I suspect ARMA 3 will have more longevity than ARMA 2 did when 3 came out...
uneven bluff
ArmA 2 lasted forever. People I played with refused to switch for years.
quartz rampart
whole cloud
Never gonna give Arma 3 up, never let Arma 3 down
obsidian condor
I didn't switch until 2015, though I still play occassionally play ARMA 2 to this day. Pleasing that the number 1 ARMA 2 server is DayZ/Epoch 😉
I just need Dedmen to continue this work so that I don't have to worry about the 322 triggers I need...
uneven bluff
Yeah the near-future setting of A3 was a little offputting for some people. 6.8mm? PCML? Wake up babe, it's time to hunt survivors all day from the top of Elektro fire station with your SR-25.
obsidian condor
uneven bluff
Yeah the near-future setting of A3 was a little offputting for some people. 6.8m...
Heh... I moved in 2015 as I said... because CUP came out...
 median belfry
Arma 3 is amazing and will still be played even after Arma 4 is released. The only things I and many others wish for are dynamic shadows and DayZs wind shader, which makes the leaves move more realistically 
Dedmen said it is possible back then , but they need an full crew for it #other_games_chat message
obsidian condor
AI vision being affected by shadows would be cool too
vale shoal
median belfry
Arma 3 is amazing and will still be played even after Arma 4 is released. The on...
Also particle creation like in DayZ (like the toxic zones) would be awesome, so you can actually create huge zones without using many particles (if I'm wrong and this works already (I played around with the Emitter 3Ditor and didn't made it working), please tell me)
woven loom
Eh i'm ready to move on from A3 to be honest
 inland breach
median belfry
Arma 3 is amazing and will still be played even after Arma 4 is released. The on...
inland breach
median belfry
Arma 3 is amazing and will still be played even after Arma 4 is released. The on...
I agree, Arma 3 has a lot of untapped potential and we seem to be unlocking more and more as the weeks go on. This would definitely make a difference.
woven loom
I still like playing it but i can see some of the things that reforger brings and it would be nice to have those in a more traditional arma sandbox and format
(give me a proper mission editor damn it  )
)
 worn socket
We need dayz dynamic shadow for arma 3
https://youtu.be/nCCSRyyotIk 🙏 🙏 🙏

 shell lion
Taht's not a we need channel, it's a we fix channel
autumn timber
That's not a we fix channel. That's a Dedmen fix channel 😅 (and KK too! 😙 )
obsidian condor
Is interesting though because 0.61 predates Enfusion renderer doesn't it?
whole cloud
I think so yeah
obsidian condor
So anyway, about my 300+ triggers.... 😜
 sharp tangle
Heyo, should the multithreading improvements in the profiling branch apply to me who uses Proton on linux? I would assume so, but I'm not noticing any difference in performance. I have an i9-11900k for my CPU.
I also have CPU count set to 8, extra threads checked for everything, and hyper-threading enabled in the launcher
heavy vortex
You mean YAAB perf is identical?
whole cloud
yes proton.
no cpu count
no extra threads
no hyper threading
woven loom
(he means don't use any of that, let the game auto detect that stuff)
heavy vortex
Won't actually make a difference here though, more general advice.
sharp tangle
heavy vortex
You mean YAAB perf is identical?
It's certainly not identical, but very close. I get 41.8 on the profiling branch is 35.7 on the base branch, and given that YAAB states you should expect plus or minus 3 frames every time, it's only a what, 5% difference?
heavy vortex
More like you don't know whether it's 5% or 25% given a single run of each.
That's in the right ballpark anyway.
This is still a simplification, but think of it more like Arma doing 10 expensive things per frame, and 3-4 of them are now twice as fast.
With some extreme cases doing a lot better, but YAAB doesn't have extreme cases.
 nocturne obsidian
I dont speak that bullshit 🗣️
hearty haven
i still encounter some players in my game community
who have
D:\Users\ArmaPlayerJoe\Documents\Arma 3
refresh=60;
truly mind blowing experience for them when they set it to their native 144+hz
Current implementation, maybe it gets settings from here?
https://i.imgur.com/5yIVoD5.png
instead of here?
https://i.imgur.com/4e6DjpB.png
Player created profile long time ago(like 3 years+) while using 60hz or 75hz monitor,
updates monitor
they still have
refresh=60;
if they not reinstall windows/arma, or manually change refresh value
thin wyvern
hearty haven
i still encounter some players in my game community
who have
D:\Users\ArmaPlaye...
No need to reinstall windows/arma just delet or edit arma3.cfg file
And btw all 3 res in DisplayID 1.3 block is incorrect/have wrong timings/pixel clock
hearty haven
just delete or edit arma3.cfg file
i mean barely anyone knows about this,
buddy with 7950x3d was REALLY happy when he find out
elder torrent
I've found that value gets changed under a lot of circumstances, like for example if I switch from 165hz fullscreen and switch to borderless windowed, but then switch back the monitor goes to 85hz.
Haven't systematically tested, but meant to submit a bug report about it sometime.
Main reason I don't use borderless windowed is gsync doesn't work, I definitely would if it did.
woven loom
huh for me it does 🤔
it doesn't work in borderless windowed just with arma or in general?
elder torrent
Just arma. You sure it works? The gsync indicator you can enable in the nvidia control panel doesnt come up
That and theres tearing, usually pretty subtle though
woven loom
hmm i've never checked that. i have vsync enabled in arma, and i remember checking my monitor's OSD, and the refresh rate was varying with fps. i can double check though. wouldn't surprise me, even adaptive vsync doesn't work in borderless. that mode is funky in arma
elder torrent
No yeah just borderless has issues with Gsync. Gsync works fine in fullscreen
woven loom
Yeah just checked, you're right
In borderless it respects the vsync limit but the monitor refresh rate is just jumping fractionally
I can't really notice the tearing though so i guess it works...but annoying
Weirdly enough even with vsync off in game, in borderless, the game respects the 165 Hz refresh rate (fps doesn't go above)
But in fullscreen it's able to go beyond
Also.... Switching to fullscreen with gsync actually working gives me 5% more FPS in YAAB than with borderless :/
I also learnt that BE was blocking mimalloc v219
And I seemed to get a boost from 219 now, although I'm wondering if that was the effect of turning off BE
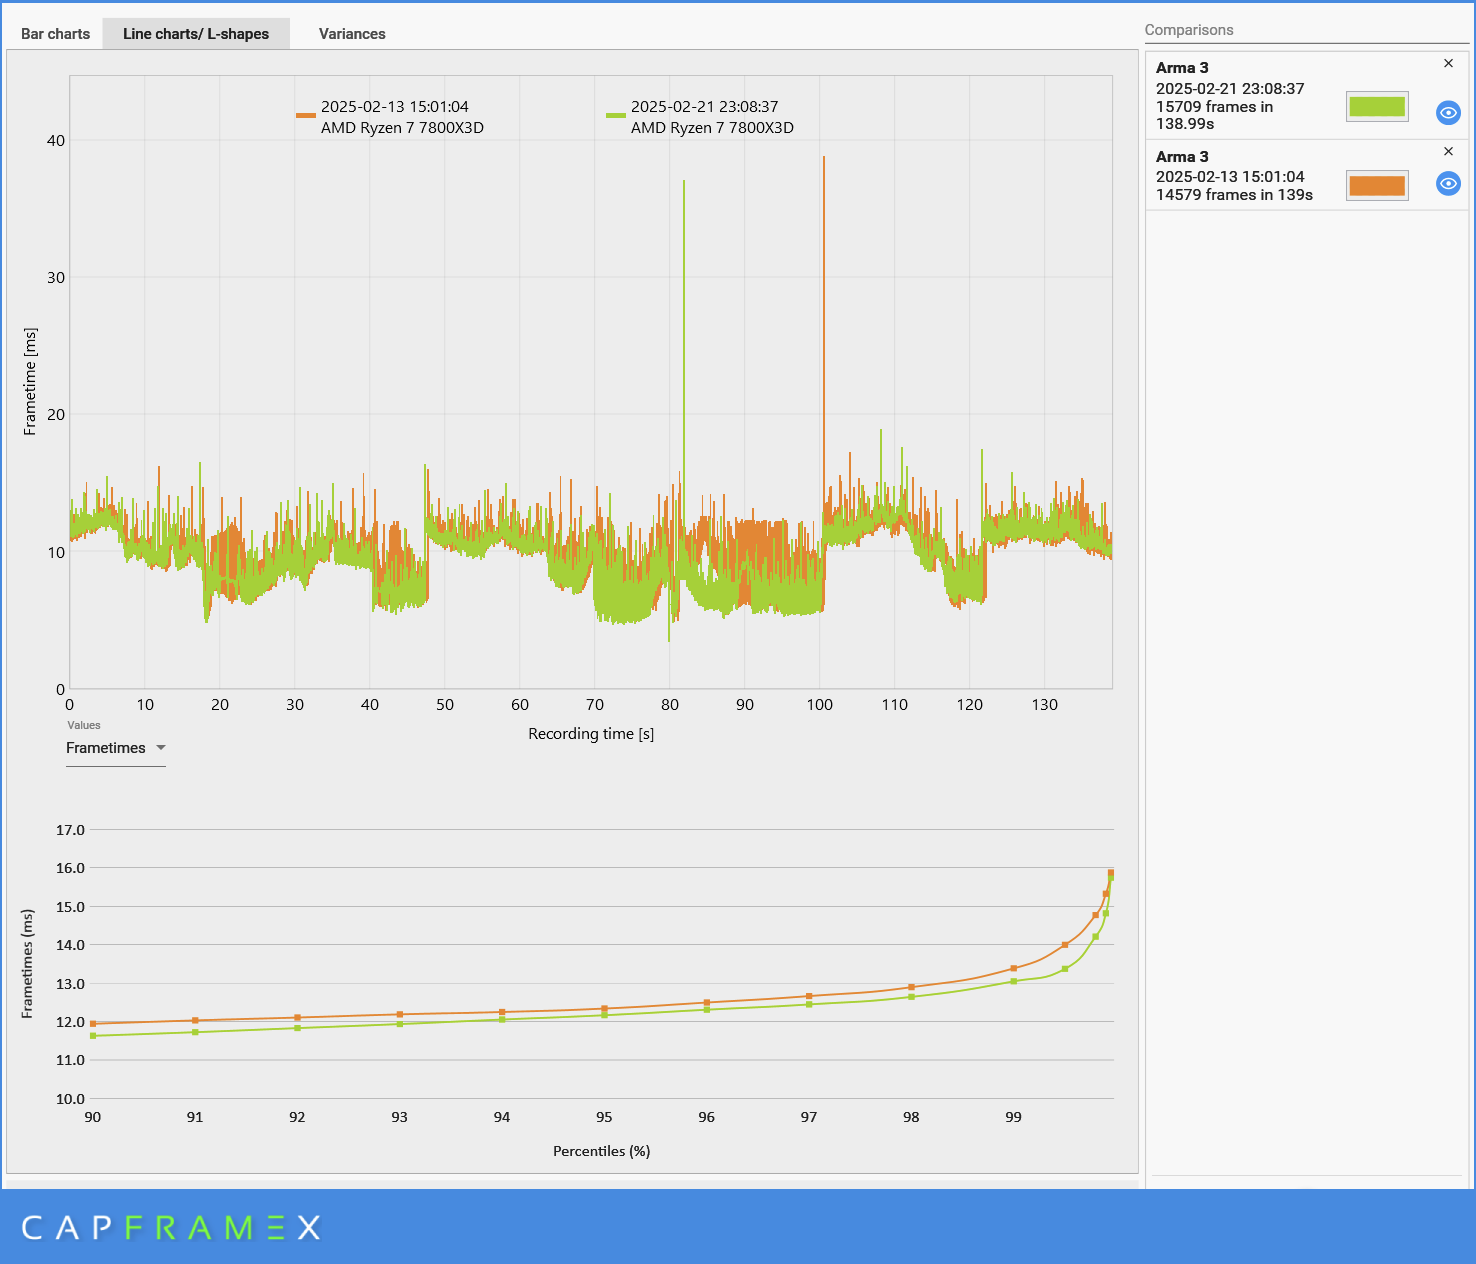
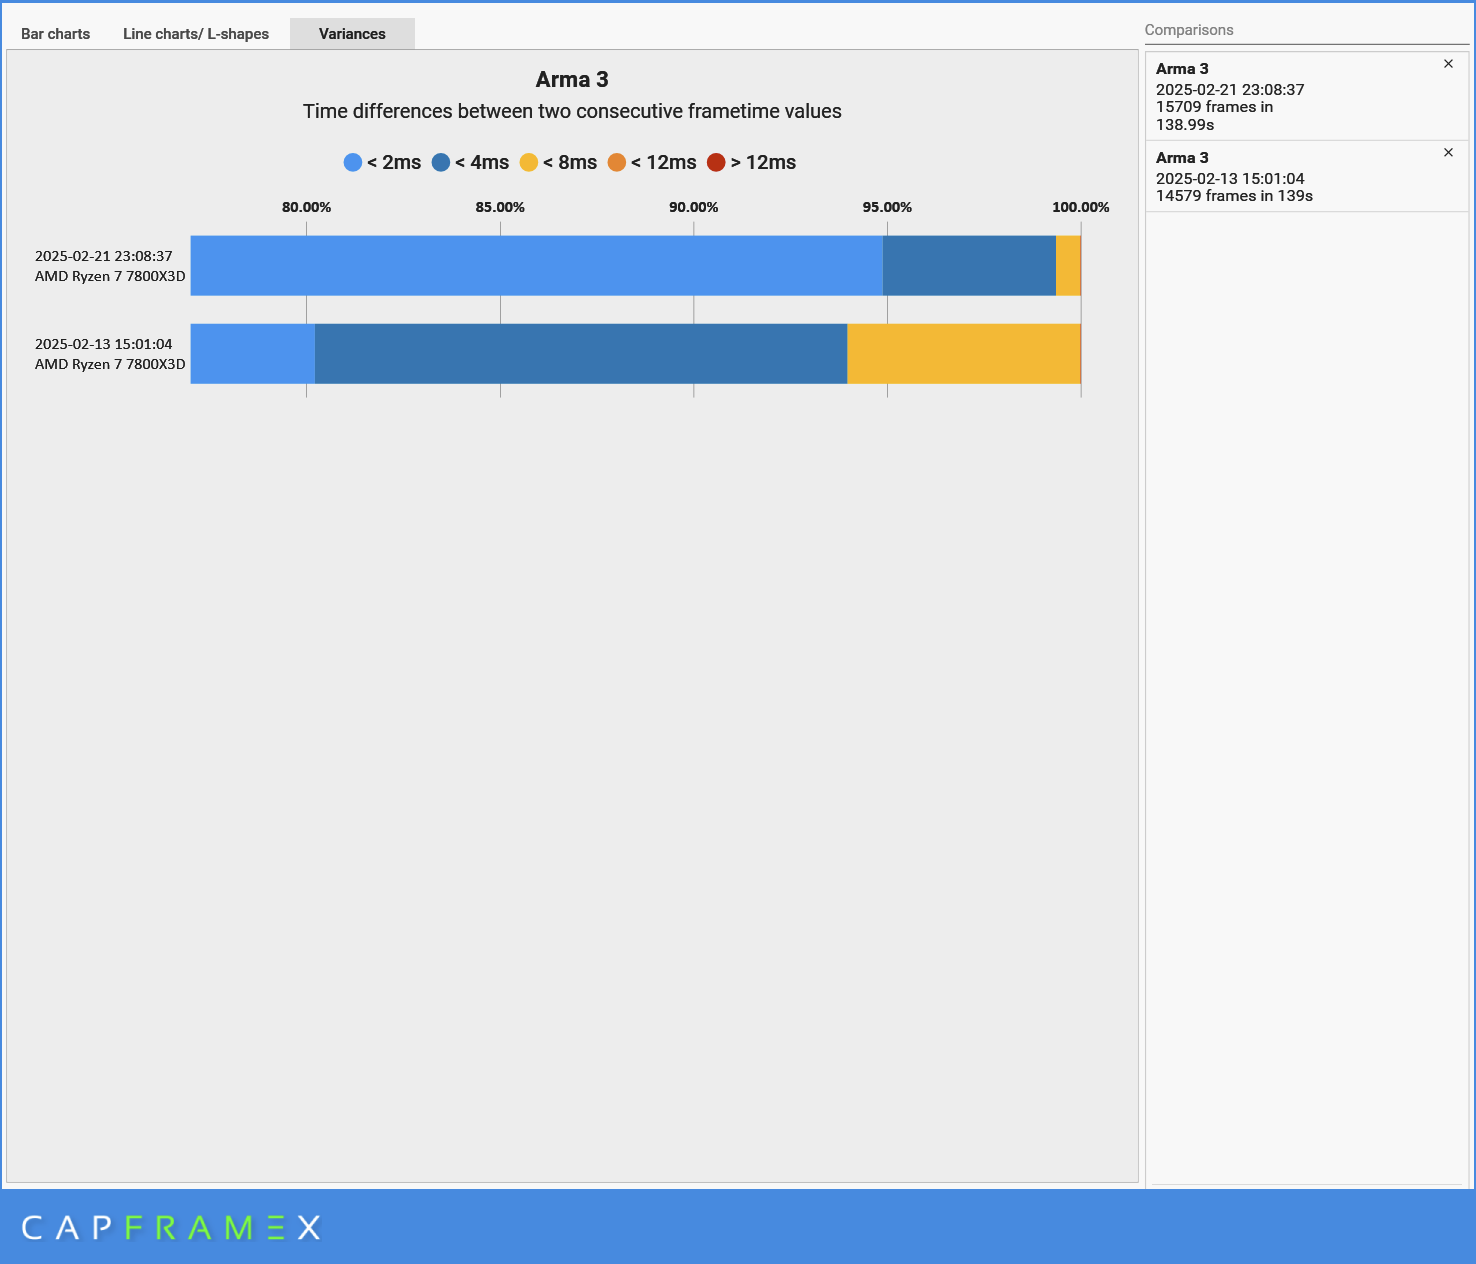
oh...my god... the frame times are drastically different
Green: Fullscreen + Gsync + mimalloc 219 + no BE
Orange: Borderless + Vsync + mimalloc 217 + BE
https://imgur.com/briDdTy
top bar is from just now
https://imgur.com/1CeHARV
 thin wyvern
woven loom
Weirdly enough even with vsync off in game, in borderless, the game respects the...
thin wyvern
woven loom
Weirdly enough even with vsync off in game, in borderless, the game respects the...
w/o vsync in game you have vsync+triple buffer from windows
woven loom
interesting, i didn't know that could happen
(and only happens in borderless, not in fullscreen)
thin wyvern
Yes
woven loom
TIL
well tonight has been enlightening 😄
There appeared to be some gains going from 217 + BE to 219 + BE disabled (~3%).
And then there was a larger 5% improvement just from going fullscreen with gsync
I'm assuming there was vsync related microstuttering going on, which was pulling the FPS down
Will have to test the BE thing separately
actually i just remembered that i also tuned RAM timings a bit 😅
woven loom
woven loom
Will have to test the BE thing separately
okay seems BE was blocking even mimalloc 217 
 vivid rune
Something is wrong with the graphic settings. I had 120 FPS VSync. Then I played with the settings (borderless fullscreen, aspect ratio (btw it jumps every time to the auto settings if i open the menu). Now after I restarted the game with old settings VSync is 60Hz.
after hitting "auto detect HW settings" it is 120Hz again
cloud sky
Have you guys (those having issues with VRR etc.) set this setting in Windows 1x? https://support.microsoft.com/en-us/windows/optimizations-for-windowed-games-in-windows-11-3f006843-2c7e-4ed0-9a5e-f9389e535952
How to improve gaming on your Windows 11 PC by making use of the optimization for windowed games settings.
I think it applies to Windows 10 too
plain trout
Is this in any way perf branch related?
woven loom
vivid rune
Something is wrong with the graphic settings. I had 120 FPS VSync. Then I played...
yeah i'm facing this issue too now, neither gsync or vsync want to work in fullscreen mode anymore (vsync is always enabled in windowed mode). Had to toggle gsync on my monitor for it to work again, but now it stops working on game re-launch 🤔 very weird.
Edit: windows graphics settings has a VRR toggle, this might be causing the issues?
woven loom
cloud sky
Have you guys (those having issues with VRR etc.) set this setting in Windows 1x...
thanks
woven loom
plain trout
Is this in any way perf branch related?
conversation drifted
cloud sky
Oh yeah, we're on the perf channel 😄 Maybe let's continue the discussion in #hardware_vs_arma
whole cloud
Not sure yet what's going on.
Was running v22 last weekend for no issues. Linux.
Today: Place down a bunch of trucks (wheeled vehicles), shoot artillery into it or cause some explosion that damages a vehicle.
Server crashes with something in physx
No-one reported this in the 10 days v22 was up. Its weird. Only difference to last week is ACE Update 
 weak radish
whole cloud
Not sure yet what's going on.
Was running v22 last weekend for no issues. Linux....
weak radish
whole cloud
Not sure yet what's going on.
Was running v22 last weekend for no issues. Linux....
I know ACE update has apparently changed some things…

 indigo anvil
whole cloud
-perfFlags=nopxmt crashes the server at start 🤣 oh well
indigo anvil
whole cloud
-perfFlags=nopxmt crashes the server at start 🤣 oh well
What is that supposed to do?
 opal hound
whole cloud
opal hound
whole cloud
My own crap script that adds all objects to zeus, but even local only ones 🤣 Fixed soon

I recompiled the server and now it doesn't crash 🤷 Magic
 lethal gorge
it works why it works?
↑ ↓
it doesnt work why it doesnt work?
 empty plover
the code has become self aware and is now fixing itself
 red cargo
weak radish
I know ACE update has apparently changed some things…
https://media.discordapp....
red cargo
weak radish
I know ACE update has apparently changed some things…
https://media.discordapp....
Hello i have the same problem do u know why please ?
 glass fossil
red cargo
Hello i have the same problem do u know why please ?
glass fossil
red cargo
Hello i have the same problem do u know why please ?
correct channel #arma3_troubleshooting , and there is discussion of BE issues.
#arma3_troubleshooting message
 red cargo
glass fossil
correct channel <#141866231362879488> , and there is discussion of BE issues.
h...
red cargo
glass fossil
correct channel <#141866231362879488> , and there is discussion of BE issues.
h...
Srry
 light cargo
...
 kind grotto
Dunno where I’d shove this, but clicking on a CfgOrbat marker crashes to desktop on the profiling branch.
 abstract heron
knotty wraith
abstract heron
knotty wraith
Please provide a link to this message? Or is this a private correspondence? Who is responsible?
 worldly badge
Literally mentioned in the image. BattlEye is having some issue
abstract heron
@blackbear995
whole cloud
kind grotto
Dunno where I’d shove this, but clicking on a CfgOrbat marker crashes to desktop...
send me the crash report
kind grotto

kind grotto
As a side note we tested it on a server. Those with stable could view it, those in profiling hard crashed.
knotty wraith
abstract heron
Please provide a link to this message? Or is this a private correspondence? Who ...
deft oak
Is anyone running captureSlowFrame in an automated way on 2.18 profiling v20? I have this simple loop running on the server to catch any full on chokes of the server but it's not outputting anything even with an overload to the point of kicking everyone. My understanding is that this loop running on the server will capture and output some frames in that scenario to a file, even before 2.20 but am I wrong? I had an overload yesterday and no captures were written (I think at least, where do they go and what is their name, nothing in my profile folder next to my RPT where I'd expect it)
 whole cloud
deft oak
Is anyone running captureSlowFrame in an automated way on 2.18 profiling v20? I ...
whole cloud
deft oak
Is anyone running captureSlowFrame in an automated way on 2.18 profiling v20? I ...
on server you want sLoop, not total
 robust parcel
quick question because id assume you guys know best
does the dev branch include the performance updates that the prof branch has?
whole cloud
Dev branch gets everything
deft oak
whole cloud
on server you want sLoop, not total
Got it, what about on headless clients?
Nevermind, I see that's it cLoop for headless
whole cloud
pronounced kluub
opal hound
22:26:22 Emergency memory free, freed 8 KB
22:26:22 Virtual memory total 131072 GiB (140737488224256 B)
22:26:22 Virtual memory free 130960 GiB (140617699217408 B)
22:26:22 Physical memory free 33 GiB (35157016576 B)
22:26:22 Page file free 24 GiB (25961119744 B)
22:26:22 Process working set 6.0 GiB (6441594880 B)
22:26:22 Process page file used 20 GiB (21456396288 B)
22:26:22 Longest free VM region: 1511364192 B
22:26:22 VM busy 112 GiB (reserved 91 GiB, committed 21 GiB, mapped 309 MiB), free 130960 GiB
22:26:22 Small mapped regions: 40, size 176128 B
22:26:22 Emergency memory free, freed 8 KB
22:26:22 Virtual memory total 131072 GiB (140737488224256 B)
22:26:22 Virtual memory free 130960 GiB (140617699217408 B)
22:26:22 Physical memory free 33 GiB (35151228928 B)
22:26:22 Page file free 24 GiB (25967534080 B)
22:26:22 Process working set 6.0 GiB (6440337408 B)
22:26:22 Process page file used 20 GiB (21450219520 B)
22:26:22 Longest free VM region: 1511346912 B
22:26:22 VM busy 112 GiB (reserved 91 GiB, committed 21 GiB, mapped 309 MiB), free 130960 GiB
22:26:22 Small mapped regions: 40, size 176128 B
22:26:22 Emergency memory free, freed 8 KB
<repeat for next 15 seconds>
112 GiB?? and then I crashed, but produced no crash dump
modded + mimalloc v2.1.9
whole cloud
Virtual memory used != real memory used.
It says the working set is 6gib
abstract heron
knotty wraith
https://discord.com/channels/976165959041679380/976224344881655818/1342689967284...
😭 Please specify the discord server
 restive pilot
ACE
worldly badge
#western_sahara message
Seems something related to ctrlMapSetPosition is causing the map to be hidden (or went somewhere outside of the screen)
ctrlMapSetPosition [] does fix, but I don't really know how it does work
spiral eagle
@whole cloud do yall have any analytics set up that you can access to improve performance? ive seen a single mention of analytics and i think it is limited to stuff concerning the launcher only
deft oak
Are there any references for what the frame capture task names mean? For example: tgNewS, aiCT1 etc
deft oak
spiral eagle
<@90532520101183488> do yall have any analytics set up that you can access to im...
Do you beyond the profiling build here: https://community.bistudio.com/wiki/Performance_Profiling
spiral eagle
deft oak
Do you beyond the profiling build here: https://community.bistudio.com/wiki/Perf...
hm interesting. but the collection of these details cant be automated?
deft oak
it can
I use a loop on the server
while {true} do
{
    uiSleep 30;
    if (diag_fpsMin < 20) then { diag_captureSlowFrame ["sLoop", "20fps"]};
};
obviously tweak it however you'd like
spiral eagle
i think my question is more like
shouldnt there be something out of the box
idk if its a button that the user can press or
some automated detection that the game itself uses to collect and submit captures to BI servers
obviously with consent and all that
deft oak
I can't speak for what they're doing but I also do that on our server to track average client performance trends
deft oak
Logs for now, but they're output as JSON. Haven't had time to build the frontend yet. Just collecting historical data for when I do.
deft oak
sidenote for loggers, the new toJSON outperforms any other method of serialization I tried by 2.5x at least
spiral pond
deft oak
Are there any references for what the frame capture task names mean? For example...
you can search in this channel for the scopes - Dedmen mentioned/explained a bunch in #1301458792323743817, #1301452742186766389 and #1303792932314157108
imo the ability to log profiling scopes in sqf land would help a great deal as otherwise the data is too much (and you need custom external tools to filter and visualize)
at this stage after all the optimization done by Dedmen, the remaining relevant cases should be mainly special situations or specific subscopes still worth (and possible) to MT (like he did/does recently)
to find these view the ingame viewer, case by case, or sifting through the logs, is way too inefficient
thus leaves only lucky finds or reproducible situations/events with big fps impact
spiral pond
deft oak
Logs for now, but they're output as JSON. Haven't had time to build the frontend...
potentially graphana is an alternative as frontend
woven loom
@spiral pond i think i saw you mention this at some point, forgive me if it wasn't you though -- but would you know how to capture frame in YAAB?
spiral pond
frame cheat or a mod to have a console
woven loom
thanks!
woven loom
hmm dunno if i'm doing something wrong but i can't get any of the mods to work
no debug console shows up in the esc menu
spiral pond
it should be a cutscene (class intro) and thus the console needs to be exposed to that special pause menu (RscDisplayMovieInterrupt) - only few console mods do
woven loom
hmm
okay i guess i'll just copy YAAB into my missions folder and try that
...well that doesn't work either, YAAB doesn't even start through SP editor
yeahhh i'm at a loss honestly
will try SFRAME cheat again although pressing S seems to always load YAAB standard settings which i don't want
spiral pond
typing a cheat should block (all and eventhandler) input until finished/no longer recognized
sframe may or may not trigger - unless you are after dips specifically
Once the game falls below 30 fps (30 ms / 0.030 (s) duration for for total scope) the diag capture dialog opens
with frame you determine the moment you want it to trigger ("imprecise" ofc) - more for rough samples.
 naive osprey
woven loom
yeahhh i'm at a loss honestly
will try SFRAME cheat again although pressing S se...
naive osprey
woven loom
yeahhh i'm at a loss honestly
will try SFRAME cheat again although pressing S se...
Make sure you hit Shift + Num - before typing the cheat code.
woven loom
Hmm i was but... There's a peculiarity with my keyboard and how I'm doing it, and I think that wasn't working as intended. But I have an alternative keyboard to try lol
woven loom
spiral pond
sframe may or may not trigger - unless you are after dips specifically
> Once th...
Yeah I want dips below 15ms and 20ms (although 30ms will work for the big ones).
I'm seeing periodic spikey 13-15ms frame times in YAAB and a couple of big 40ms frames
woven loom
spiral pond
is this different from the workshop version?
spiral pond
the workshop version is way older
woven loom
ahh thanks, i didn't know there were updates
although this doesn't work for me either... the mission just quits instantly when i run it from either SP editor or self hosted MP
i'm confused how to run it
woven loom
spiral pond
Also A3 launcher says it doesn't recognise this as a mod, says it needs an addons folder 🤔
light cargo
woven loom
Also A3 launcher says it doesn't recognise this as a mod, says it needs an addon...
yeah, make it a mod folder structure
whole cloud
Still issues with particle effects being missing?
void badger
I'm curious, has anyone else been experiencing floating point exceptions?
I just have a hypothesis for mine right now, that being Blastcore / ARMA FXP causing the issue:
20:29:54 Error during evaluation of expression _moveVelocity in mk82_explosion_01
20:29:54 Error during evaluation of expression _moveVelocity in mk82_explosion_02
20:29:54 Error during evaluation of expression _moveVelocity in mk82_explosion_01
20:29:54 Error during evaluation of expression _moveVelocity in mk82_explosion_02
Floating point exception (core dumped)
Blastcore have issues in their configs. They use variables that does not exist in effects where they use them
Don't know if it can ends up not only in log errors but in floating point exception and crash
deft oak
Anyone know if rmtExec in the frame traces includes things like public setVariable? Seeing some long rmtExec runs in some of these captures and I'm aware of a system on the server sending a lot of data with public setVariables that needs to be replaced.


Also, and ideas on what onCIS is? I have a capture here with a 97ms run of it.

 final stump
Not too technical but I'm having some consistently inconsistent performance only on the profiling branch. Dev and live branches are fine but on profiling I jump all around from 119 fps down to 11, up to 38, then to 90, back down to 22 etc. Tried all mallocs and leaving all launcher parameters at default and nothing changes.
woven loom
Windows 11 update 24H2 by any chance? I've heard some people get inconsistent performance in games with that one
Also, what am i doing wrong here?
0 spawn { sleep 30; diag_captureSlowFrame ["total",0.02];};
19:56:10   Error position: <["total",0.02]}>
19:56:10   Error Missing ;```
Even if i just use `diag_captureSlowFrame` it complains about `missing ;`Using the profiling binary
naive osprey
woven loom
Also, what am i doing wrong here?
```sqf
0 spawn { sleep 30; diag_captureSlowFra...
Are you using the steam branch?
If I recall correctly, steam branch defaults to using the performance executable, not profiling.
The code itself runs fine on the profiling exe from the google drive though
final stump
woven loom
Windows 11 update 24H2 by any chance? I've heard some people get inconsistent pe...
Yeah exactly, but it's weird that it wasn't an issue until recently and the other branches are fine
woven loom
naive osprey
Are you using the steam branch?
If I recall correctly, steam branch defaults to...
yeah i switched to the profiling binary, renamed that to arma3_x64
thanks for checking though, i wonder what the issue is 🤔 i've always used the steam branch before
woven loom
final stump
Yeah exactly, but it's weird that it wasn't an issue until recently and the othe...
yeah that's fair.
spiral pond
deft oak
Anyone know if rmtExec in the frame traces includes things like public setVariab...
either hope Dedmen will elaborate or otherwise build a simple demo setup and capture to figure it out (do pV, remoteExec and both)
(afaik) unfortunately we cant define custom scopes for the BI frame capture [setting scriptName may help to some extent tho] - this way you could identify sqf code [if you set such custom marker scope in all (relevant) scripts]
you can do with Dedmen Arma Script Profiler mod (https://community.bistudio.com/wiki?title=Performance_Profiling#Tracy_Live_Viewer - but only a "header" marker afaik. not start and end markers within the script/code
spiral pond
final stump
Not too technical but I'm having some consistently inconsistent performance only...
spiral pond
woven loom
yeah i switched to the profiling binary, renamed that to arma3_x64
thanks for ch...
drop the rpt as it shows the exe type used
woven loom
good call, i forget that the RPT has this info
whole cloud
deft oak
Anyone know if rmtExec in the frame traces includes things like public setVariab...
RemoteExec is not publicVariable.
ArmaScriptProfiler with instruction profiling might show you what the script is doing it while being so slow
whole cloud
deft oak
Also, and ideas on what onCIS is? I have a capture here with a 97ms run of it.
A client joined into the game, it gets the mission file, and its JIP queue.
I see there are a couple scopes missing, I shall add them
whole cloud
final stump
Not too technical but I'm having some consistently inconsistent performance only...
Well with profiling binary you can just check what causes that fps drop down to 11
That would probably be informative
whole cloud
spiral pond
(afaik) unfortunately we cant define custom scopes for the BI frame capture [set...
not start and end markers within the script/code
https://community.bistudio.com/wiki?title=Performance_Profiling#Creating_Your_Own_Subtree
or ASP https://community.bistudio.com/wiki/ArmaScriptProfiler#createProfileScope
spiral pond
whole cloud
> not start and end markers within the script/code
https://community.bistudio.co...
Putting everything in isNil scopes seems hardly practical for wide ranging code profiling.
and for ASP
This value going out of scope defines the end of the current Scope
so doing_currentScope = nil;can be used to limit the scope?
whole cloud
yes
final stump
whole cloud
Well with profiling binary you can just check _what_ causes that fps drop down t...
Yes, I was waiting until morning to send those logs kju mentioned but I can't seem to upload anything to the profiling observations - client thread.
spiral pond
@silk pewter is it a general permission setting or does @final stump still need to accept anything/no longer be a "new" user?
opal hound
The little green thing is just applied for a set amount of time after you join a server, I'm not sure if it even appears as a flag through the API
For file uploads I believe you need the acknowledged-rules role which you get from #rules message
final stump
Strange because I've read and acknowledged the rules, clicked the checkbox and all that
heavy vortex
There is this as well, but I don't know what it does:
- you may use !verify in #offtopic_bot_cmds to obtain extra user-rights in several categories/channels etc.
light cargo
heavy vortex
There is this as well, but I don't know what it does:
> 24. you may use !verify...
that gives the user role i believe
or it's also acknowledged-rules
this has been complained a few times in #discord_server
deft oak
whole cloud
A client joined into the game, it gets the mission file, and its JIP queue.
I se...
I imagine that means the only thing I can do to help with this is bring down the size of the missionFile/JIP queue?
inland dew
don't know what was done to profiling, but framerime is the most stable of all the profiling versions until now. feels really really smouth
whole cloud
deft oak
I imagine that means the only thing I can do to help with this is bring down the...
Next Prof will have more detailed scopes.
But yes, most likely.
It looks like the JIP queue is your main issue
Or it might be number of active objects in the mission
How big is that mission file?
From your capture I'd guess around 30mb?
deft oak
whole cloud
How big is that mission file?
From your capture I'd guess around 30mb?
4.5mb but my JIP queue is definitely quite large. It's an exile server so there's around 15,000 objects including the base building pieces. Also a large amount of containers and custom map objects. I'm also aware of a huge amount of setVariables with makePublic true that can be replaced entirely on the server and quite a few other systems that need to be replaced to lessen the load on the network.
spiral pond
@deft oak did you look into those logs yet? (mpMessageDetails, networkDiagInterval, ipQueue, logEntities)
deft oak
spiral pond
<@107656024755838976> did you look into those logs yet? (mpMessageDetails, netwo...
I've got mpMessageDetails, mpStatistics, and networkDiagInterval
not jipQueue and logEntities though
how can I set those up?
In general, performance is quite good as well. These are just the only frame captures I'm getting of dips below 20fps
 whole cloud
You don't need to fix every small dip you know?
inland dew
so new build this week?
whole cloud
stahp askin :U
whole cloud
deft oak
how can I set those up?
#logEntities and #exportJIPQueue are server commands to run manually
profiling also outputs extra files that I can use to see more detail
deft oak
whole cloud
You don't need to fix every small dip you know?
Fair enough lol. I just got profiling set up recently and I'm just drowning in all this beautiful data and trying to track down, understand, and optimize what I can from it.
deft oak
whole cloud
#logEntities and #exportJIPQueue are server commands to run manually
does exportJIPQueue output something similar to mpStatistics? Nevermind, I found the sqf variant here https://community.bistudio.com/wiki/exportJIPMessages. Gonna try it out
whole cloud
2.18.152674 new PROFILING branch with PERFORMANCE binaries, v24, server and client, windows 64-bit, linux server 64-bit
- Tweaked: Improved performance of AI pathfinding
- Fixed: Lag spike could happen if game was set to more CPU cores than were available (for example limiting via CPU Affinity settings, but not setting -cpuCount parameter to match)
- Fixed: Western Sahara motion detector map control rendering was wrong
- Fixed: Lag spike when AI is outside of terrain bounds
- Fixed: Crash related to new map rendering
If you don't want to use the Steam branch, the files are also available for alternative download here:
https://drive.google.com/drive/folders/15p9j7C2nHUt6NoVfChX4YFuqzFXzblJh
Note: There are separate Dll files that also need to be placed into Game folder.
whole cloud
whole cloud
2.18.152674 new PROFILING branch with PERFORMANCE binaries, v24, server and clie...
eternal kraken


 turbid vortex
whole cloud
2.18.152674 new PROFILING branch with PERFORMANCE binaries, v24, server and clie...
turbid vortex
whole cloud
2.18.152674 new PROFILING branch with PERFORMANCE binaries, v24, server and clie...
Do pathfinding optimizations work on scripted commands like SetDestination for agents and DoMove for unit?
whole cloud
Scripting is irrelevant, its a optimization in the backend
heavy vortex
Is that unit or vehicle pathfinding or both?
whole cloud
both
empty goblet
@whole cloud q, did you noticed #perf_prof_branch message anything of that and what you mention in #perf_prof_branch message in the new build ?
empty goblet
~~so lot of vehicles standing still will still cause those performance issues vs AI? ~~{ye obviously if not touching it ... smack myself}
 dusky spire
" - Fixed: Lag spike could happen if game was set to more CPU cores than were available (for example limiting via CPU Affinity settings, but not setting -cpuCount parameter to match)"
Could someone elaborate on this?
I've read here not to touch -cpuCount parameter.
What is the recommended CPU affinity setting, 'All processors'?
I checked mine and for some reason CPU 0 (of 0-7)was deselected; probably an old optimisation attempt of mine.
But my game is stable.
 kindred radish
You don't touch it at all for client. Only if you run multiple servers on the same machine.
dusky spire
Just to clarify, default setting is 'All processors', correct?
fast hornet
or if you're running a CPU with different cores.. like AMD X3D or newer intel with p/e cores.
But touching affinity always requires that you know what you're doing.
dusky spire
Hm, unfortunately both replies don't answer my question, yet. I'll be patient.
heavy vortex
You simply set cpuCount to the number of cores you set affinity to.
fast hornet
just don't use any of the cpu related parameters. Unless you know what you are doing and why you are doing it.
No affinity, no -cpucount, no -enableht, no -exthreads, nothing.
opal hound
if you're messing with affinity in the first place, which you shouldn't need to do for a standard client, unless you have an odd core setup (e.g. P/E cored processor)
But yes the default affinity for a process should be all of your cores
final stump
final stump
Strange because I've read and acknowledged the rules, clicked the checkbox and a...
So I can upload those files to other channels but not here or in the thread. Just an update on that.
Aaaaand fixed, had to reacknowledge the rules but they're uploaded now
 obtuse bramble
- Fixed: Crash related to new map rendering
The latest prof. branch update (which did something to how gps/layouts work apparently) broke* the BCE (Better CAS Environment) mod. The layout is all over the screen, unlike the position of the actual device like the normal GPS would show. I understand this isn't the place to ask about mods but figured I'd bring it up in case there is some sort of consideration or confirmation so I can give that feedback to him.
First screen is on the stable build.
2nd screen is the profile branch.
Only loaded the mods listed. Again, not looking for a fix, just a confirmation. 😄


 whole cloud
The previous one (where it said map rendering was changed and to please report all problems with map rendering, like this one) was also broken then
obtuse bramble
That is possible, but I haven't noticed that myself today. I also didn't touch the ATAK during my short time the last 24-30 hours so you could be correct. My unit's guys didn't seem to have any issue though. I've reported the problem to the mod maker too, as it's logical you're going to keep the crashfixes/changes in place.
fast hornet
did you change anything possibly related to "my" animation crash from v23 -> v24 dedmen?
stark falcon
is bandwidthAlg=2 still recommended?
whole cloud
fast hornet
did you change anything possibly related to "my" animation crash from v23 -> v24...
yes we switched to a newer compiler, which generates different code in the spot you crashed
whole cloud
stark falcon
is `bandwidthAlg=2` still recommended?
its default on profiling branch
fast hornet
whole cloud
yes we switched to a newer compiler, which generates different code in the spot ...
thanks for the info 🙂
heavy vortex
inAreaArray now prints Bad conversion: string when an array containing objNull is passed in. Would much prefer the previous behaviour of silently dropping objNulls.
 feral harness
heavy vortex
inAreaArray now prints `Bad conversion: string` when an array containing objNull...
feral harness
heavy vortex
inAreaArray now prints `Bad conversion: string` when an array containing objNull...
have you got copy paste example plz
heavy vortex
[objNull, player] inAreaArray [getPosATL player, 1000, 1000];
feral harness
thanks will check tomo
woven loom
eternal kraken
I got these results from the last profiling https://imgur.com/CO0Kf9l
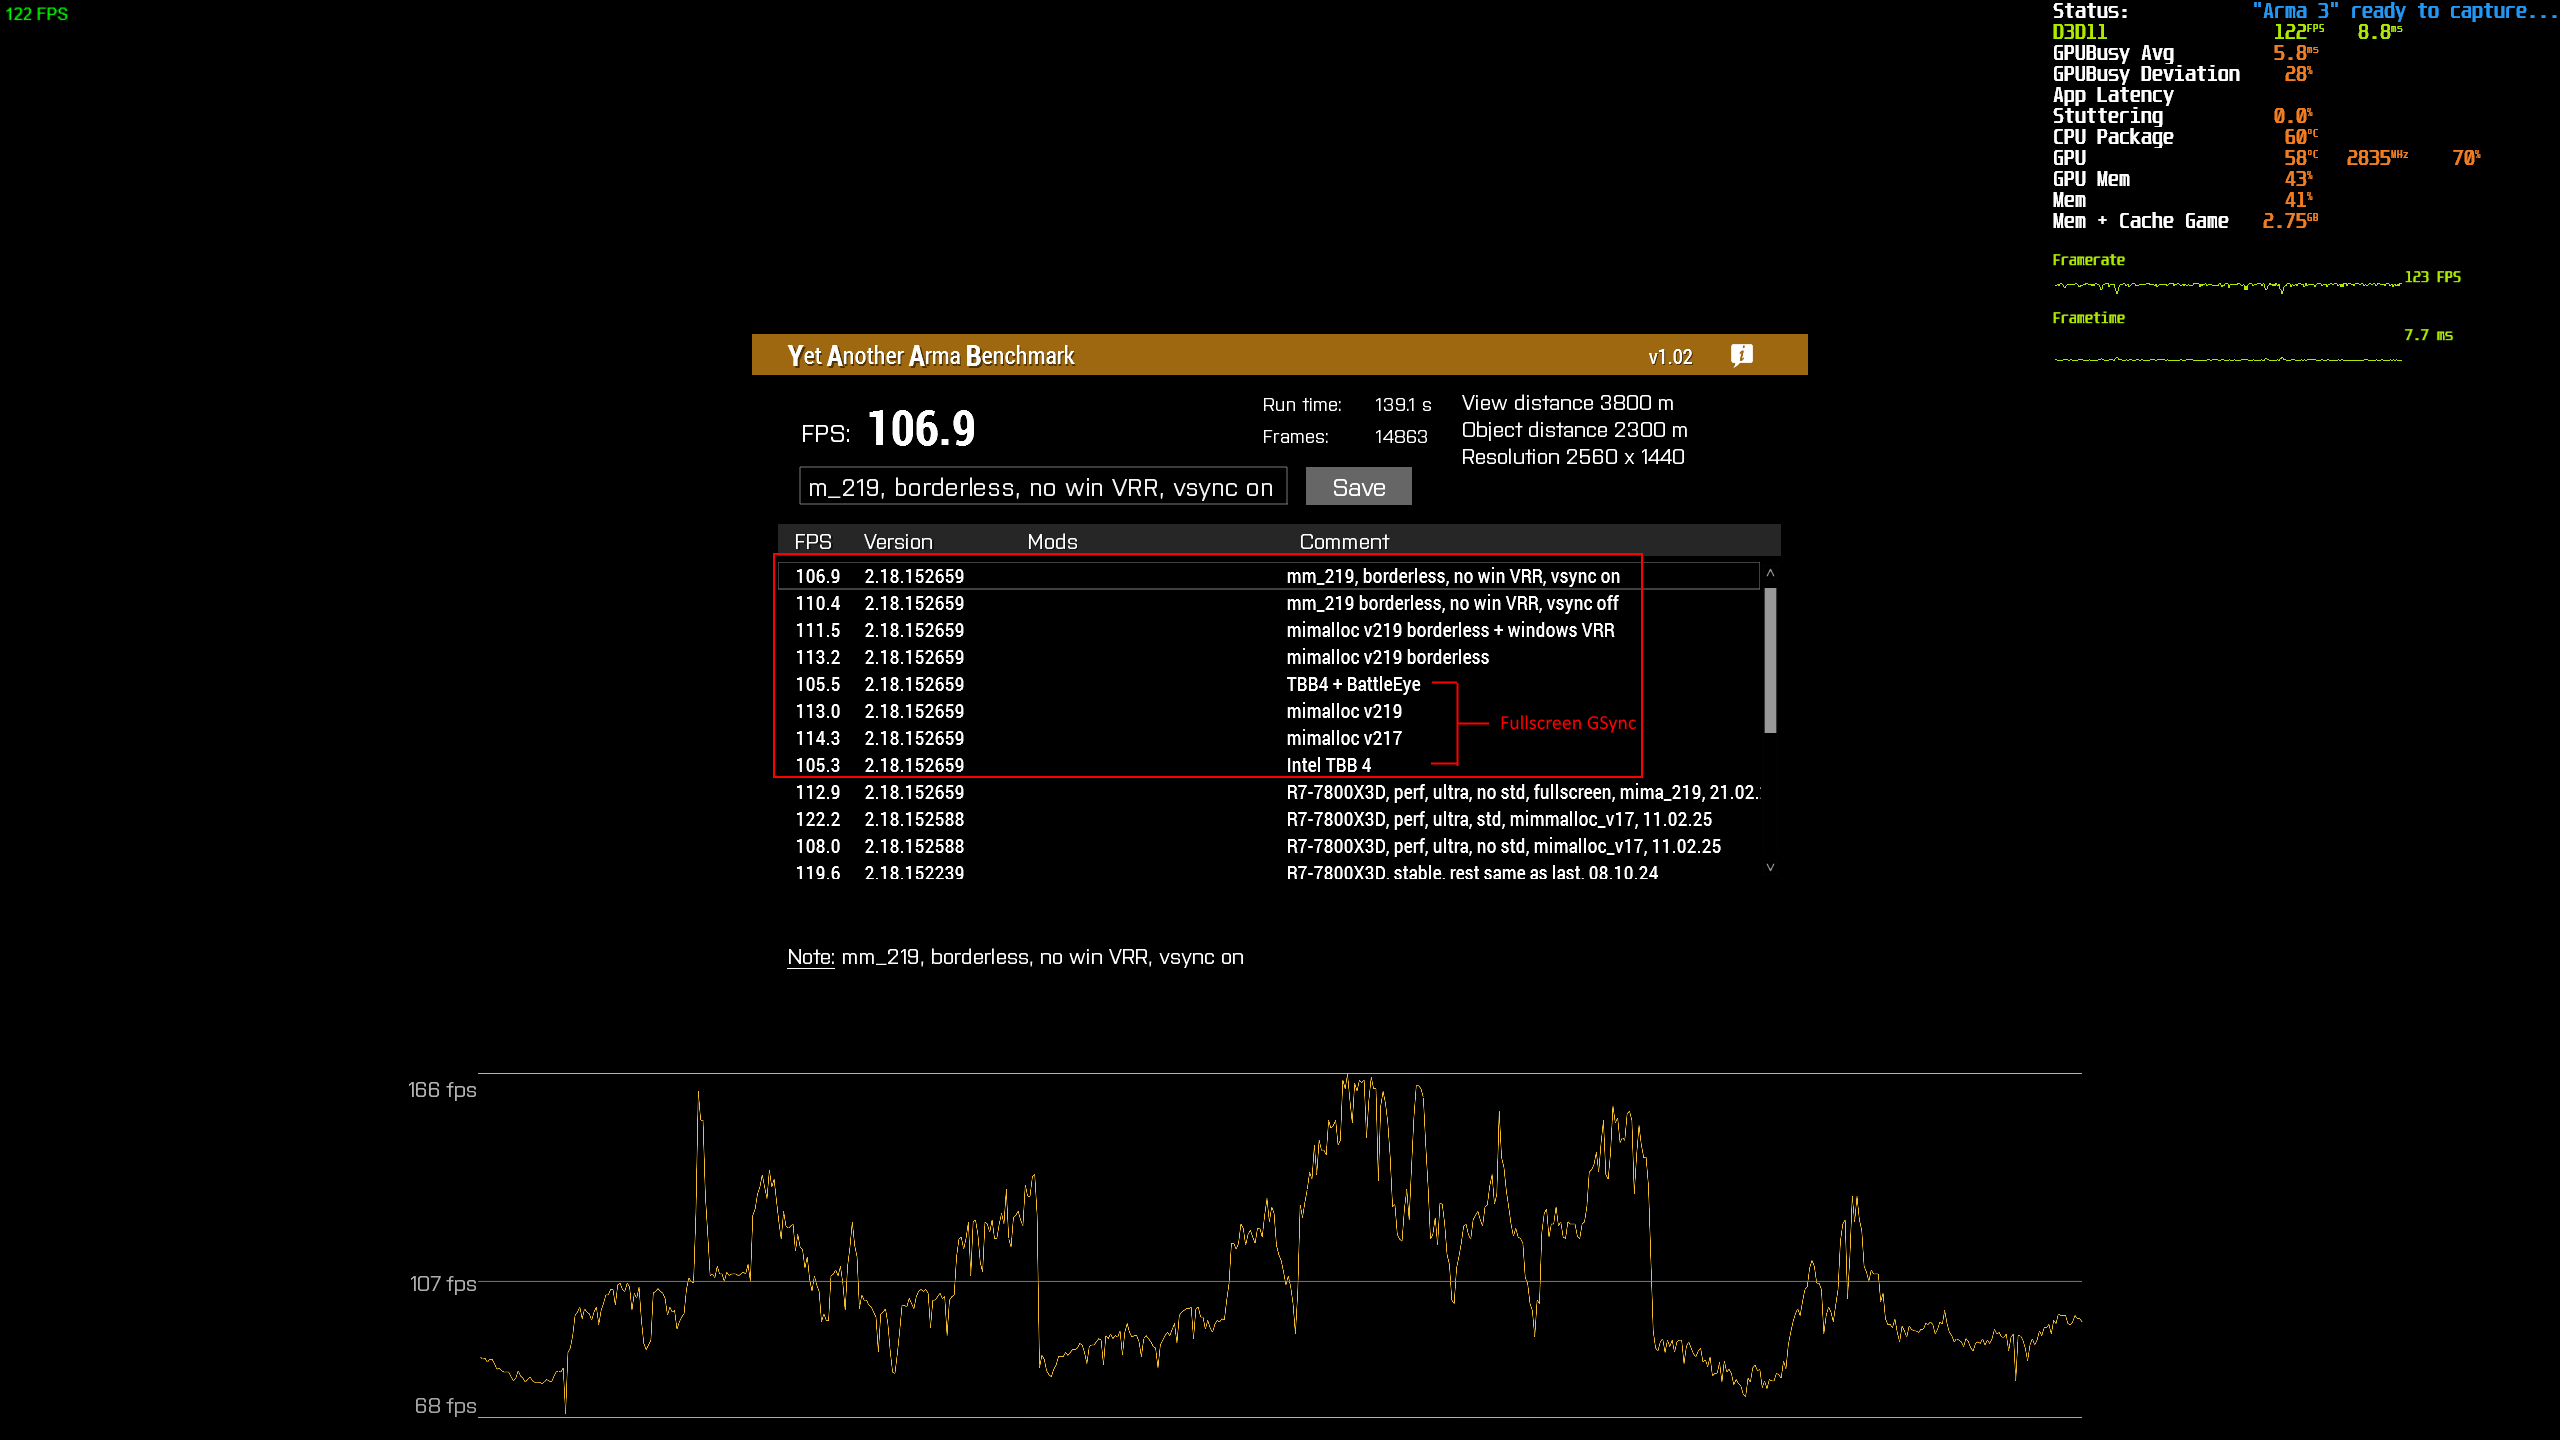
But it's a bit erratic, i didn't find any difference later b/w borderless vsync off/on (it's always forced on by windows regardless, although gsync doesn't work properly).
Clearest signals i got was -- mimalloc > tbb4, and fullscreen+vsync > borderless (i have a 165Hz VRR monitor)
(I don't benchmark with fullscreen+vsync off because it's not relevant to me)
 blazing shuttle
I heard the profiling branch can help figure out problems running arma smoothly, how do i do that?
woven loom
I guess one way may be to switch to profiling branch, rename arma3profiling_x64 to arma3_64 then use diag_captureSlowFrame to capture the details of frames that exceed the specified render time
Speaking of...
woven loom
I wanted to investigate repeated frame time spikes in YAAB, usually ranging from 10-20ms, and very rare big frame spikes >20ms.
wSimUseems to be where the spikes happenwSimU -> wSimAseems to vary between ~2ms to ~16ms, seems to be the source of the frequent/repeated spikes.wSimU -> wSimA -> wSimPXSCovariations in this appear to be the cause for the ~15ms spikeswSimU -> rendrseems to vary between ~5ms and ~16ms, but typically ~7ms. Looks like the cause of the big spikes, probably when it coincides with wSimA spikes.wSimU -> rendr -> oPrep -> oSoSL -> slDoL -> slSeB -> fsARdcaused the big >20ms spike.
See images for frame time plot + frame captures with 15ms threshold. I can dm the capture logs if needed.
fsARd spike
...
fsARd; 7.70668; 10.19149;"(P0) e49000:1000:addons\air_f_beta.pbo/heli_attack_01\heli_attack_01_f.p3d"
       fsARd; 17.90617; 0.03120;"(P0) e4a000:1000:addons\air_f_beta.pbo/heli_attack_01\heli_attack_01_f.p3d"
...
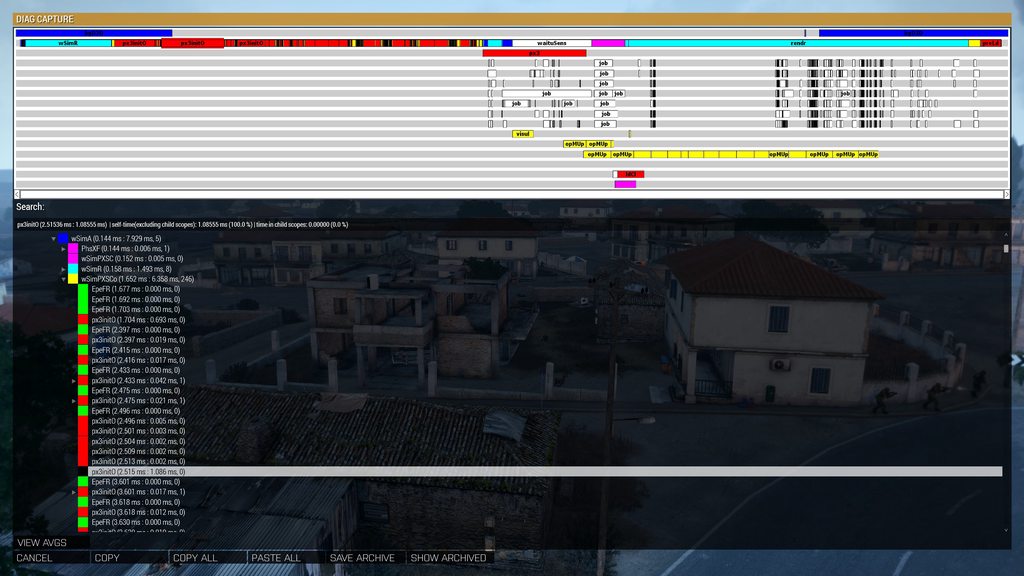 spiral pond
fsARd and lodUL are data loading from disk/SSD/etc
usually these are done async and wont impact the main thread
however at times it is forced to be done as part of main thread scopes and thus easily cause lag/fps spikes
if you could preload all models, animations, sounds and textures, you probably wouldnt have these spikes
can it be done - no clue. RAM/VRAM/CPU cache/OS handling may be limiting factors (or how RV engine handles certain things)
p3d can be 50-100 MB each, yet with enough RAM may be feasible
paa with 4k textures, or even 2k, most likely would too much for VRAM
A3 has some sqf commands and some config definitions to preload different type of data. and preplaced objects are preloaded (to a certain extent at least) vs dynamically spawned (via sqf/Zeus).
heavy vortex
If you knew your mission used a very limited range of content then I guess you could preload. Not reasonable for a lot of stuff though.
spiral pond
from my testing/checking frame captures rtm (and ogg/wss) are surprisingly often causing fsARd spikes in the main thread
however you would need real statistics to give a proper judgement
p3d and (interface/scripted) textures are more to be expected
spiral pond
I heard the profiling branch can help
whole cloud
obtuse bramble
That is possible, but I haven't noticed that myself today. I also didn't touch t...
No, its definitely a bug that will be fixed. We don't break mods with updates.
But the next update will only be next week
feral harness
heavy vortex
`[objNull, player] inAreaArray [getPosATL player, 1000, 1000];`
Confirmed, but also happening in 2.16 for inAreaArrayIndexes
whole cloud
woven loom
I wanted to investigate repeated frame time spikes in YAAB, usually ranging from...
fsARd is loading file from disk.
wSimU is literally everything, the whole game cycle. Everything happens in there. So yeah, if there are spikes, they would be in there too.
There fixed.
Its the cTab mod, not the better cas.
And its been doing something weird, it has been using ctrlMapSetPosition, which is only for fixing issues inside control groups, even though their map is not in any control group.

 jolly jackal
Profiling seems to have a bug with AI subordinates:
If your AI subordinates are on engage at will mode and you order a medic to heal them, they will switch to the "Support" action as they normally do. Once the medic heals them they stay on the support action and refuse to follow the formation. If you order them to return to formation they immediately switch back to supporting.
To fix this I've found you need to tell the AI to disengage, order no target and then return to formation. But then obviously they can't leave formation to engage targets. Ordering them to engage again repeats this bug.
feral harness
heavy vortex
inAreaArray now prints `Bad conversion: string` when an array containing objNull...
Revision: 152681
woven loom
whole cloud
fsARd is loading file from disk.
wSimU is literally everything, the whole game c...
FWIW wSimPXSCo seems to be the spikey part of wSimU/wSimA, everything else looked consistent
fsARd is loading file from disk.
Is there no way to preload queue everything? Arma doesn't even use 3GB of main memory for me when running YAAB with the ultra preset.
Though to be fair once i had run it a few times i was no longer getting those big spikes.
whole cloud
woven loom
FWIW wSimPXSCo seems to be the spikey part of wSimU/wSimA, everything else looke...
In Enfusion things are invisible and pop in, but you stay at high fps.
In RV you get a lag spike because the game needs the asset right now and doesn't want to delay it even to next frame.
That's just how the engine works, that won't change
whole cloud
jolly jackal
Profiling seems to have a bug with AI subordinates:
If your AI subordinates are...
profiling only, stable doesn't have the issue?
There are so many AI bugs
jolly jackal
whole cloud
profiling only, stable doesn't have the issue?
I just launched stable and tried to reproduce it but couldn't, profiling it seems to happen every time I tell my guys to engage at will, give a unit a target, injure them, then order someone to heal them.
Honestly other than that the experience has been pretty good, worth the performance improvement.
I haven't notice anything too game disrupting, but I'm just playing not looking for them haha.
obtuse bramble
whole cloud
There fixed.
Its the cTab mod, not the better cas.
And its been doing something ...
Thank you!
gritty wasp
heavy vortex
If you knew your mission used a very limited range of content then I guess you c...
Interesting how much memory will take all models on mission with all units known for a whole mission(no vehicle/units/items scripted spawn after init)
RV want them right here right now. Is there lazy crawling algorithm that can fill cache of resources for known classes before they appear on screen?
silk summit
whole cloud
There are _so_ many AI bugs
Fixing the most critical ones will significantly enhance both gameplay and performance. Hopefully, you get the green light for some much-needed attention there 🙏
heavy vortex
bridge bug plz :/
heavy vortex
jolly jackal
Profiling seems to have a bug with AI subordinates:
If your AI subordinates are...
How are you seeing what action they're on?
heavy vortex
feral harness
Confirmed, but also happening in 2.16 for inAreaArrayIndexes <:blobdoggoshruggoo...
Silently dropping objNulls is preferred behaviour for both, I think. We just only used it for inAreaArray so far.
spiral pond
heavy vortex
How are you seeing what action they're on?
feral harness
heavy vortex
Silently dropping objNulls is preferred behaviour for both, I think. We just onl...
yeah, it was something else, it is meant to drop nulls and nils silently
jolly jackal
heavy vortex
How are you seeing what action they're on?
The text under the unit bar when you give them orders. "Support" keeps popping up and they say "Supporting" after every order I try to give them.
orchid mesa
whole cloud
Still issues with particle effects being missing?
yes
happened to me just now
 restive turtle
whole cloud
There are _so_ many AI bugs
restive turtle
whole cloud
There are _so_ many AI bugs
well yeah the AI is generally fucked xd
as a gamemode developer, please fix the AI dedmen, idk how but fix 🤣
jolly jackal
Return to Arma 2 AI obviously /s
(I love arma 3 but sometimes combined arms sure felt better in 2)
obsidian condor
It really still does...
 toxic gazelle
Sometimes they even refuse to move
whole cloud
There will be no AI fixes.
Except undoing the things we broke recently
 mighty palm
does the profiling branch have better multi threading? (like dev branch?)
whole cloud
yes
knotty wraith
whole cloud
There will be no AI fixes.
Except undoing the things we broke recently
Please clarify what was broken
whole cloud
I don't know yet
 vivid reef
is it correct i get more fps in yaab with stable vs profiling? 
 patent sky
vivid reef
is it correct i get more fps in yaab with stable vs profiling? <a:aPES_WideEyes:...
patent sky
vivid reef
is it correct i get more fps in yaab with stable vs profiling? <a:aPES_WideEyes:...

make sure you are running with the same settings and do atleast 1-2 warmup runs before looking at the result
vivid reef
was same settings
saved the second run
same settings, 1920x1080, standard preset, pressed S, second yaab run saved
patent sky
and no tabbing out etc during the runs? that 20fps difference is almost impossible
 silk summit
whole cloud
I don't know yet
silk summit
whole cloud
I don't know yet
Ai things that got broken just "recently":
- Ai units now don't go straight for the vehicle when ordered to mount.
- Ai units now go though objects/walls even when they could've easily avoided them.
- Ai units now go prone excessively, even when in tall grass (no view) or inside buildings (inside buildings they should just crouch).
- Ai units' "unstuck" mechanism that detects when they are under/inside buildings, rocks etc and corrects their positions (unstuck) no longer works.
 🤞
🤞
vivid reef
something seems weird
i did another run with my normal settings, first run 57 fps, second run 96 fps
i expect around 120 with these settings
 fiery pawn
I've noticed that even on YAAB the AI behaviour is a bit different, has anyone noticed this as well ?
 fiery pawn
I'm not having your drops @vivid reef I'm having similar results as v23
vivid reef

i did 9 runs, all profiling were way worse than stable
also there is heavy stutter in profiling
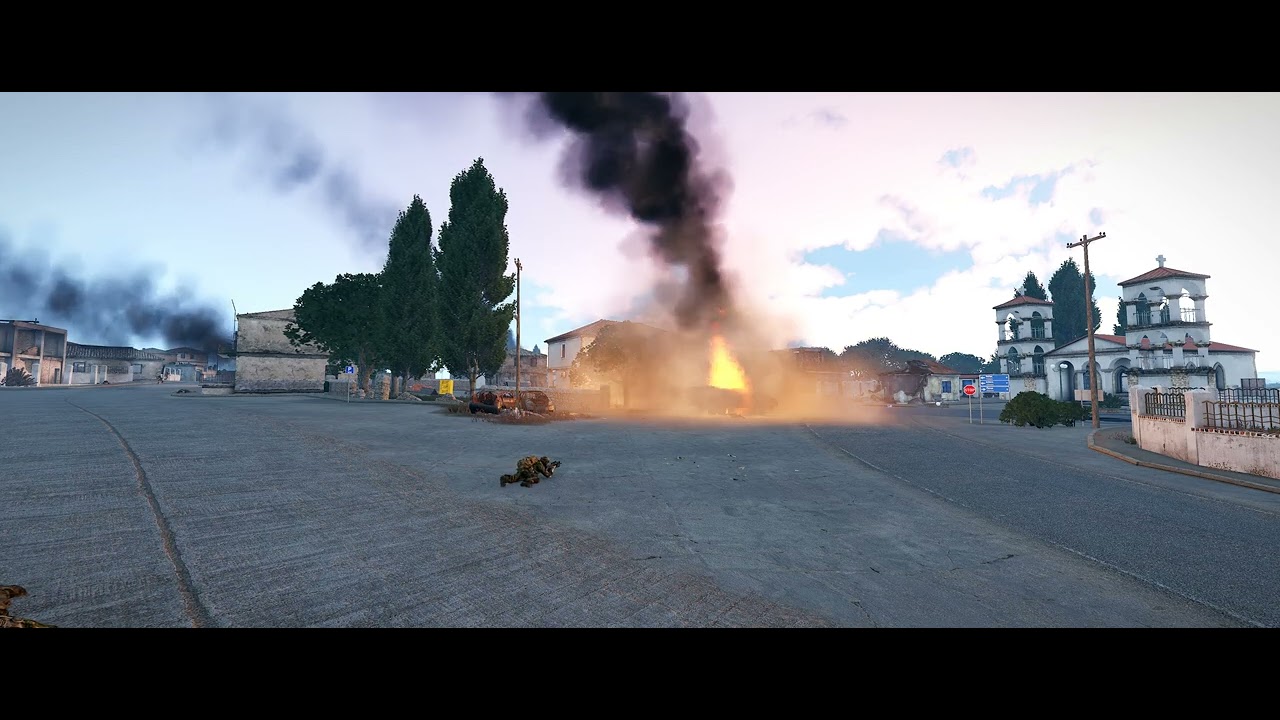 woven loom
System specs and settings?
vivid reef
AMD Ryzen 7 7800x3D
MSI Gaming Plus Wifi X670E
2x32GB Corsair Vengeance DDR5-6000-30
Gigabyte GeForce RTX4070 Ti Gaming OC
Setings the same for all runs
whole cloud
silk summit
Ai things that got broken just "recently":
- Ai units now don't go straight for ...
What is your definition of recently? last 20 years?
whole cloud
vivid reef
also there is heavy stutter in profiling
profiling build and capture slow frame, that should capture the cause of the stutter
vivid reef
whole cloud
profiling build and capture slow frame, that should capture the cause of the stu...
how do i do this?
whole cloud
replace your game exe, with the profiling one thats in game folder
start yaab,
CTRL+SHIFT+Numpad- to activate cheat input mode, then enter
SFRAME
it will capture the next framedrop
vivid reef
ah damn
vivid reef
whole cloud
it will capture the next framedrop
want the screenshot then?
whole cloud
no the copy to clipboard data
vivid reef
whole cloud
no the copy to clipboard data
copy all?
whole cloud
yeah
vivid reef
k, only one of them or a few of the stutters?
whole cloud
multiple probably better
vivid reef
pastebin?
vivid reef
whole cloud
paste in discord and it'll turn it into a file. After you accept <#3684476573096...
woven loom
vivid reef
AMD Ryzen 7 7800x3D
MSI Gaming Plus Wifi X670E
2x32GB Corsair Vengeance DDR5-600...
Interesting, I have almost exactly the same setup, just with 32GB. I don't have noticeable stutter (like I can't see it) with the ultra preset. I see microstuttering on frame time graphs though, see: #perf_prof_branch message
spiral pond
vivid reef
- 10ms to load textures for font
- 9,8ms to load wreck p3d
- 27ms to wait on GPU/3dSwp
- same
- 4,9ms PX stuff (wSimPXSCo)
- 30,6 ms 3dSwp wait
- same (10,6 ms)
- same (32,7 ms)
spiral pond


1, 2 and 5 are normal. the 3dSwp are strange
@vivid reef run YAAB with both and share the graphs
vivid reef
maybe later, im currently full in drinking and playing skribbl io
vale shoal
Not really the same as the sutter thing but, but I switched from v20 to v24 on the server and I have the feeling the CPU usage went up a bit (usually the server is at 60%, now up to 80%). Anyone else also seeing similar things?
patent sky
vale shoal
Not really the same as the sutter thing but, but I switched from v20 to v24 on t...
more fps perhaps?
Could just be utilizing the CPU better in that case
 foggy vine
Task manager reporting 100% GPU usage, frequent stutters for the past 2 hours.
Every 5 seconds at best. fucks up ACRE comms apparently.
leaden relic
Unused resources are wasted resources
woven loom
foggy vine
Task manager reporting 100% GPU usage, frequent stutters for the past 2 hours.
Arma 3 or reforger?
100% gpu usage is a good thing (means cpu isn't holding your gpu back) but i've rarely encountered that in A3
foggy vine
woven loom
100% gpu usage is a good thing (means cpu isn't holding your gpu back) but i've ...
Honestly confusing, took me a whole laptop reboot after switching to stable branch to unfuck my stutters that were happening even after I closed my game
foggy vine
woven loom
Arma 3 or reforger?
Arma 3
woven loom
Interesting. Might have been other things at play then
foggy vine
GeForce drivers received an update yesterday, maybe something related to that. Blind guesses at that point, I'll give profiling build another try later today to double check.
woven loom
Yeah i manually update drivers, i'm still on december's drivers, it's been fine
whole cloud
Server be like "I need more cores"
Also why is server spending 7ms in rendering lol
 whole cloud
spiral pond
1, 2 and 5 are normal. the 3dSwp are strange
whole cloud
spiral pond
1, 2 and 5 are normal. the 3dSwp are strange
Nvidia control panel can configure graphics settings per executable, per exe filename.
Maybe running a different one with some weird settings while on prof.
woven loom
but you have to rename it to arma3_x64 right? so should be the same?
although could be user error, i have at least one RPT file where it looks like it ran the 32-bit version of Arma
light cargo
you can assign/add a new profile for profiling altogether
or use nvidia profile inspector for that
i suggest the latter to fine tune the executable selection better.
the driver can do filename matching and multiple filenames but the control panel only adds absolute paths ime
 analog jolt
We're trying to run the profiling branch of Arma 3 (including Headless Clients), and no matter the mission or mods, the HC's will always be disconnected with the message that it's missing DLC's.
The logs just mention that SteamAPI failed (which then makes sense that it can't check for the DLC's).
=====================================================================
== E:\Steam\steamapps\common\Arma 3 Server\arma3serverprofiling_x64.exe
== "E:\Steam\steamapps\common\Arma 3 Server\arma3serverprofiling_x64.exe" -client -connect=127.0.0.1 -password=***"-profiles=E:\Steam\steamapps\common\Arma 3 Server\Servers\_7e953dd30072479b919b19e27fd78d8e_hc1" -nosound -port=2322 "-mod=<bunch_of_mods>" -enableHT -hugepages -maxMem=24000 -bandwidthAlg=2 -limitFPS=100 -loadMissionToMemory -nologs -malloc=mimalloc_v217_20250103

Original output filename: Arma3RetailProfile_Server_x64
Exe timestamp: 2025/02/25 18:16:02
Current time:  2025/03/01 21:00:01

Type: Public
Build: Profile
Version: 2.18.152674

Allocator: E:\Steam\steamapps\common\Arma 3 Server\Dll\tbb4malloc_bi_x64.dll [2017.0.0.0] [2017.0.0.0]
PhysMem: 64 GiB, VirtMem : 131072 GiB, AvailPhys : 57 GiB, AvailVirt : 131072 GiB, AvailPage : 76 GiB, PageSize : 4.0 KiB/2.0 MiB/HasLockMemory, CPUCount : 12
=====================================================================

21:00:01 Unable to initialize Steam API.
21:00:01 SteamAPI initialization failed. Steam features won't be accessible!
We're seeing some performance degradation on the server from the upgrade from profiling v20 to profiling v24. I'm also seeing this in some captures I haven't seen before this:


Also some other changes during this patch so it's not 100% profiling related.
whole cloud
analog jolt
We're trying to run the profiling branch of Arma 3 (including Headless Clients),...
serverconfig has the ip listed as local client?
whole cloud
deft oak
We're seeing some performance degradation on the server from the upgrade from pr...
I have never seen that scope before
analog jolt
whole cloud
serverconfig has the ip listed as local client?
We use FASTER, server and HC's are on the same machine, and server.cfg has
headlessClients[] =  {
   "127.0.0.1"
};
Stable server does work without a problem, and it did work before (last time check was somewhere in January, figured it would a temporary issue)
deft oak
analog jolt
We use FASTER, server and HC's are on the same machine, and server.cfg has
```
h...
Did you update to the most recent version (v24 that required the dlls)?
whole cloud
it says 674 in rpt, and without latest DLL it should crash at start
deft oak
if you did make sure you're running the headless clients off the profiling exe too, I had this happen last time there was a dll update because the headlesses were on an old exe
analog jolt
Version: 2.18.152674
and is installed from Steam, so I assume all files are updated as it should.
Not to mention that FASTER is always using the same executable as the server itself, so that shouldn't cause any issues either.
deft oak
whole cloud
I have never seen that scope before
It's possible it's related to the EachFrame handler added by vanilla to the dedicated server we spoke about this week. I dug through it with Arma Script Profiler and couldn't find anything so I removed it to see if we saw any bugs. No noticeable bugs but may be the cause of the degradation/strange scope. I'll readd it and see if things change.
whole cloud
its a remoteExec
deft oak
whole cloud
its a remoteExec
oh duh, seems unlikely it was EachFrame handler related then
carmine stump
some times collisions are making my game CTD
heavy galleon
Were you touching something with drones recently~ish?
I have not used them a lot, but today the autonomous functionality was super weird. IIRC you fixed the "land and be stupid" bug, right?
This time, after we packed the darter into a backpack and then upacked it, move waypoint was ignored. Loiter however was not  super weird behaviour overall
spiral pond
deft oak
oh duh, seems unlikely it was EachFrame handler related then

not quite sure if scriptName or a special sqf command/macro is needed to set a header to be picked up by frame capturing
pth should be AI related, yet only Dedmen will be able to say more
the trace is a bit corrupted too

the log equivalent would be interesting to see
deft oak
spiral pond
this is interesting, this was in the trace?
oh yeah, a different one in the other capture too at the end, that's odd
spiral pond
these dont have it
gsEva; 55.61052; 0.22252;"if (local (_this select 0)) then {[(_thi"
probably its coming from a gsEva statement. maybe the escaping/code enclosing is faulty for specific code cases
@deft oak what game mode is it/what type of AI - agents/zombies or regular infantry?
also possible to identify the remoteExec potentially the source or too many functions/code sent via RE?
also is this an one-off/happening at the start/some init phase or mid mission and more often
deft oak
the above were mid mission but I think our issue was coming from something else that were just dragging the entire performance down. I have some changes I'm doing each of our next restarts to get more specific info.
I'll check back when I have more info
The systems in the trace are working fine which is odd
no parser errors and the functionality is used all the time
the server is Exile so it's got patrols (on one headless), missions (on another headless), and zombies (on a third headless)
carmine stump
collision making CTD super confirmed
specially with gorgon
got one time with boat too, when hitting the shore
silk summit
carmine stump
collision making CTD super confirmed
Collision checks seem to wreak havoc on A3's general performance
carmine stump
it started in this latest perf
deft oak
I got a report from a player today of a CTD from hitting a body in a vehicle. He's not back until Wednesday to give me the crash dump though
deft oak
spiral pond
these dont have it
This was caused by limiting the cpuCounts. Dedmen had mentioned a threading issue and suggested limiting our cpuCounts explicitly since we're in a unique situation with the headless clients but had also recommended dropping one of the headlesses. I wasn't able to do it at the time so attempted to limit them with 3 headlesses still and it seems it was choking the server up too much and dropping the average down into the 50s. Removing the limits seemed to resolve it.
spiral pond
good to hear! interesting that seemingly only the AI pathfinding got stuck/was filling up over time.
maybe useful to have a rpt warning for that/threading issues (if doable). i think there is one warning for other AI calcs taking too much time
 minor geode
whole cloud
There fixed.
Its the cTab mod, not the better cas.
And its been doing something ...
minor geode
whole cloud
There fixed.
Its the cTab mod, not the better cas.
And its been doing something ...
which profiling build was this fixed in? I have people, including myself who are still seeing the displaced ctab map on the ATAK, floating in the middle of the screen.
foggy vine
foggy vine
GeForce drivers received an update yesterday, *maybe* something related to that....
Gave it a try last Saturday. What turns out to be the issue is the profiling build after all, stutters remain even after I close my game
Repro'd a very similar if not the same setup with all the programs I usually have in background. Had to swap back to stable build, issue was gone
 uneven kernel
minor geode
which profiling build was this fixed in? I have people, including myself who are...
uneven kernel
minor geode
which profiling build was this fixed in? I have people, including myself who are...
Which cTab mod are you using?
 weary sun
uneven kernel
Which cTab mod are you using?
weary sun
uneven kernel
Which cTab mod are you using?
not him but I can repro this with https://steamcommunity.com/sharedfiles/filedetails/?id=2511318948 + BCE
 weary sun
Also replicatable with https://steamcommunity.com/sharedfiles/filedetails/?id=871504836 + BCE


 weary sun
minor geode
which profiling build was this fixed in? I have people, including myself who are...
weary sun
minor geode
which profiling build was this fixed in? I have people, including myself who are...
the fix is made, but it needs to get pushed, probably within the next few days
minor geode
weary sun
the fix is made, but it needs to get pushed, probably within the next few days
Thanks, I saw the post that Dedman showed with it fixed, but I didn't see that it hadn't been pushed live.
whole cloud
analog jolt
We're trying to run the profiling branch of Arma 3 (including Headless Clients),...
"-loadMissionToMemory" is a server side only option.
Doesn't make sense on HC.
What is the actual full message its giving to say missing DLCs?
whole cloud
deft oak
We're seeing some performance degradation on the server from the upgrade from pr...
The code that runs there is findEmptyPosition script command, probably with a very large maxDistance
In your capture I can see its creating 317 grid cells, so yes, very large radius.
analog jolt
whole cloud
"-loadMissionToMemory" is a server side only option.
Doesn't make sense on HC.
...
Server Console Log only states
15:34:06 headlessclient uses modified data file
15:34:06 Player headlessclient connecting.
15:34:09 Player headlessclient connected (id=HC87692).
15:34:09 Player headlessclient disconnected.
In HC Console Log:
15:33:51 Dedicated client created.
15:34:06 Client connected: 127.0.0.1:2302
15:34:09 > You were kicked off the game. Missing required DLC content.
stripped down logs, only showing relevant info
whole cloud
Main AI code can create all/most of these cells in parallel.
But this code for find empty position, was not adjusted to do that.
[worldSize/2, worldSize/2] findEmptyPosition [37, worldSize/4, "B_Boat_Armed_01_minigun_F"]
On Livonia, creats 16900 fields (uff)
Before: feaAl 2257ms, feaMa 2050ms, feaCh 207ms
After: feaAl 492ms, feaMa 284.4ms, feaCh 206ms
[worldSize/2, worldSize/2] findEmptyPosition [37, 280, "B_Boat_Armed_01_minigun_F"]
Creates 192 fields
Before: feaAl 18.9ms, feaMa 17ms, feaCh 1.9ms
After: feaAl 5.2ms, feaMa 3ms, feaCh 2ms
50m max (16 fields)
First run
Before: 1ms, 1ms, 0.05ms
After: 0.322ms, 0.275ms, 0.05ms
Second run (fields are cached)
Before: 0.06ms, 0.008ms, 0.05ms
After: 0.07ms, 0.02ms, 0.05ms
So on the larger cases thats.. 4x on 16 threads.
Mh 16 threads vs 1 thread, but only 4x faster? Sad.

 whole cloud
There were also a few other parts of AI where they did their own "findEmptyPosition" internally, that also weren't using MT, now they are 🤞
whole cloud
I can multithread the feaCh part too, but not sure if its worth it. For 300m its only 2ms.
I can maybe half or quarter that, but considering the other part still takes 3ms anyway. This whole thing still is "slow" even if I make the second part faster.
Especially now that I made this thing already 4x as fast...
Mh although, with that whole map case that could potentially cut down alot 🤔
mhmhmhmh. Decisions decisions.
Do I want to spend another hour or two on that while its already dinner time? no.
Maybe someday maybe never.
whole cloud
analog jolt
Server Console Log only states
> 15:34:06 headlessclient uses modified data file...
Well the code that does that.
Just skips that kick if the client is a HC.
Not sure why that would not work.... Guess I'll have to repro that tomorrow.
You're doing something so that the HC does a JIP join right? The mission is already running when HC joins in?
 inland dew
whole cloud
I can multithread the feaCh part too, but not sure if its worth it. For 300m its...
inland dew
whole cloud
I can multithread the feaCh part too, but not sure if its worth it. For 300m its...
every little bit counts
once everything put together, the total result is not nothing, i would say
whole cloud
carmine stump
some times collisions are making my game CTD
Please send me crashdumps via DM if you have any
whole cloud
heavy galleon
Were you touching something with drones recently~ish?
I have not used them a lot...
KK is working on drones, afaik some things still WIP
whole cloud
spiral pond
not quite sure if scriptName or a special sqf command/macro is needed to set a h...
game itself just uses first line of script, and strips it to 40 characters
whole cloud
spiral pond
what, did it put that whole thing into the capture frame?
Oh I probably don't handle quotes in there, so the json he's messed up if the string contains a quote? could that be it?
no, I'M stripping qutoes, replacing them with singlequote.
It should not be possible for the whole script to get into the capture
Oh I see how that's happening. AGH I hate this API, its so easy to get wrong. Time to change it 😠
inland dew
🫠
whole cloud
minor geode
which profiling build was this fixed in? I have people, including myself who are...
I fixed it here #perf_prof_branch message
at 27.02.
The last profiling release was at 26.02.
I don't think a release we made one day before I fixed it, would contain the fix
whole cloud
foggy vine
Gave it a try last Saturday. What turns out to be the issue is the profiling bui...
Send me a RPT file, of when you last ran profiling branch please.
just drop into DM
whole cloud
carmine stump
collision making CTD super confirmed
Crashdumps please
whole cloud
deft oak
This was caused by limiting the cpuCounts. Dedmen had mentioned a threading issu...
Also, what fps limits are the HC's running? if you force them to lower fps, that would also lower the chance that server threads are trying to run at same time
analog jolt
whole cloud
Well the code that does that.
Just skips that kick if the client is a HC.
Not su...
Correct, the HC's only join after the mission is loaded at the server.
If I'm correct this is done through Zulu Headless Client.
With stable server (HC's connect without a problem):
15:41:10 Game Port: 2302, Steam Query Port: 2303
15:41:10 Mission 1924.carter_winter read from bank.
15:41:10 Host identity created.
15:41:11 Roles assigned.
15:41:11 Reading mission ...
15:41:14 Mission read.
15:41:14 headlessclient uses modified data file
15:41:14 Game started.
15:41:14 Player headlessclient connecting.
15:41:14 Player headlessclient connected (id=HC87412).
With Perf branch (HC's get kicked out, and even tries 3 times):
15:34:06 Mission 1924.carter_winter read from bank.
15:34:06 Host identity created.
15:34:06 headlessclient uses modified data file
15:34:06 Roles assigned.
15:34:06 Player headlessclient connecting.
15:34:06 Reading mission ...
15:34:09 Mission read.
15:34:09 headlessclient uses modified data file
15:34:09 Game started.
15:34:09 Player headlessclient connected (id=HC87692).
15:34:09 Player headlessclient disconnected.
15:34:14 headlessclient uses modified data file
15:34:14 Player headlessclient connecting.
15:34:14 headlessclient uses modified data file
15:34:14 Player headlessclient connected (id=HC87692).
15:34:14 Player headlessclient disconnected.
15:34:14 headlessclient uses modified data file
15:34:14 Player headlessclient connecting.
15:34:14 Player headlessclient connected (id=HC87372).
15:34:14 Player headlessclient disconnected.
You're not testing how it behaves with missmatch? like perf on client but stable server, or other way around.
To know if the issue is on the client or on the server
but I'll test it maybe tomorrow or so anyway
analog jolt
It's server only, and both the server and HC's are using the same executable.
And no clients are connecting at all (mission starts at server boot and HC's automatically connect).
Only difference in the .rpt files that I can see is that the Perf branch is unable to connect to the Steam API.
The server itself is running without a problem; haven't tried connecting with a client myself yet.
heavy galleon
whole cloud
KK is working on drones, afaik some things still WIP
I'll try to get a repro then. Navigating the drone using loiter was fun though
deft oak
whole cloud
In your capture I can see its creating 317 grid cells, so yes, very large radius...
Interesting, none of my AI systems use findEmptyPosition (there are no AI systems on the server that I didn't write from scratch). Even just searching for findEmptyPosition there's only 8 results in my entire codebase and only the longest range is 125. Although I haven't traced the Zupa Capture Points (their AI is disabled) all the way back so it's possible they have an issue. I'll dig into them more.
deft oak
whole cloud
Also, what fps limits are the HC's running? if you force them to lower fps, that...
Funnily enough I have this queued for our next update. They (and the server) are currently limited at 100 fps. I'm gonna bump them back down to 50 and see if there's any noticeable degredation.
 brazen goblet
Is the profile branch compatible with multiplayer on a dedicated server?
inland dew
yes
brazen goblet
Are there any "How-To" guides on how to set this up with FASTER?
worldly badge
Install the branch (exe itself) and launch it normally
heavy vortex
In the Updater tab, click on the "profiling" button and then update.
From here, note the caveat:
https://github.com/Foxlider/FASTER/wiki/Setup-Guide-(1.8)
brazen goblet
heavy vortex
In the Updater tab, click on the "profiling" button and then update.
Apparently, I have this turned on already. I'm not sure when I did this. I think maybe I thought it would allow me to use FASTER profiles. What is the profile branch anyway? Is it like a BETA version before public client version?
Is there a way to see which version/branch you are using?
brazen goblet
Type: Public
Build: Stable
Version: 2.18.152405
Public means not profile I assume.
 analog acorn
Public means it isn't an internal private build; this version is available to the public.
The part that means "not profiling" is where it says "stable". That means it's on the stable (main) branch. Dev and profiling branches are not "stable" - they contain changes that haven't been through the full QA process and are more likely to have bugs, and are updated much more frequently.
heavy vortex
Actually perf is "Stable" as well, but that version number is the stable version.
brazen goblet
Do you all know if its easy to switch back and forth between branches with FASTER? I really want to try these performance enhancers I hear about but maybe it's not a good idea if it breaks the server and I need to reinstall everything.
heavy vortex
I imagine you toggle that button back and run update again.
brazen goblet
Is there a profile button on the Arma 3 launcher as well. Or maybe only like Polpox said it's a separate .exe?
heavy vortex
It's a separate exe. You can specify the server exe in the FASTER profile.
brazen goblet
Ah so that's the one I need to make sure is file pathed correctly to the profile build. Then of course all player clients will also need to make sure they are on the profile branch.
heavy vortex
Well no. Profile branch & stable branch are network-compatible.
If someone doesn't want the extra suffering then they don't have to deal with it.
brazen goblet
Oh wow so the Server can run on stable and clients on profile and all is well?
heavy vortex
Yes, or vice versa.
deft oak
whole cloud
Crashdumps please
I can grab one of these for you. It happens in any physx collision as far as I can tell to all involved (units in the vehicle performing the ram and units in the vehicle being rammed)
Also seems to be 100% of the time
deft oak
Got some more info while trying to get the crash dump. It seems to not happen in collisions between physx objects which are both controlled by clients running the steam profiling build. We had it happen consistently enough last night though that I suspect it's happening for collisions between profiling and stable clients. I can get something more definitive when my testers are back.
gritty wasp
deft oak
~~Also seems to be 100% of the time~~
I tried to spawn dozens of cars and boats in air and watch them to drop. Tried to ram. No CTD for me.
deft oak
gritty wasp
I tried to spawn dozens of cars and boats in air and watch them to drop. Tried t...
Agreed, we found some cases when I went to get the crash dump where it didn't happen but we had it happen in every collision in our 4 hour session last night which is why I thought it was 100%. In all our collision crashes it was between two player controlled physx objects.
After some testing with a few players while trying to get the crash dump earlier it seems to not happen if both clients are on the profiling branch. I suspect it happens with the players on stable but I couldn't grab one for testing yet.
whole cloud
deft oak
Interesting, none of my AI systems use findEmptyPosition (there are no AI system...
isFlatEmpty maybe?
whole cloud
analog acorn
Public means it isn't an internal private build; this version is available to th...
Performance build is also a stable build.
You'd check the build number to know
whole cloud
Oh I think I know what the collision crashes are.
I think they only happen if the collision you are doing, ends up killing somebody or something.
There's a bug where if you kill something, but the killer is null, it crashes. Since v24 due to the steam game recording integration.
It's already fixed but I'm waiting for one feature for v25
Yes all 3 crashes from The Hound are that one
whole cloud
Profiling server, profiling HC and a profiling player, all on server, HC is not being kicked
 restive turtle
whole cloud
<:blobdoggoshruggoogly:748124048025714758>
Profiling server, profiling HC and a...
restive turtle
whole cloud
<:blobdoggoshruggoogly:748124048025714758>
Profiling server, profiling HC and a...
whole cloud
both internal and prof v24, works fine for me.
It also doesn't make any sense, the only way that kick message could happen, were if the HC would not tell the server that they are a HC, and the server assumes they are a "normal" client.
And afaik there is no way to start a HC and make it connect, without it doing that. The -client parameter, does that.
SteamAPI failed also does not matter, because steam auth is also ignored if the client identifies as a HC.
whole cloud
While testing server stuff, I found this, thread utilization with many AI units doing visibility checks is garbage..
The tasks are split into 64 batches, but it turns out, the first batches all run super fast, and the last half dozen batches take super long.
I have 16 threads, but only 7 are working.

I already had code for this in the past, but it was disabled when we had issues with AI not seeing units.
It ended up not being the problem, but forgot to turn it back on.

 gusty viper
Dedmen firing on all cilinders as usual
carmine stump
please fix the CTD due to collisions asap, I got it 3 times while in a match.
carmine stump
whole cloud
Oh I think I know what the collision crashes are.
I think they only happen if th...
not necessarily.
whole cloud
not necessarily.
If you want to show me what it is, why are you not sending me any crash reports then?
whole cloud
Your game is crashing without creating any crash reports?
carmine stump
I dont have profiling enabled, just perf
whole cloud
That is irrelevant, all builds create crashreports
whole cloud
The prof with that crash fix is planned for tomorrow 🤞
But I still need to test a feature which might not work out in time
gritty wasp
carmine stump
please fix the CTD due to collisions asap, I got it 3 times while in a match.
use stable
deft oak
whole cloud
isFlatEmpty maybe?
This is my only usage of isFlatEmpty
params [
    ["_position", nil, [[]]],
    ["_radius", nil, [0]],
    ["_maxGradientAngle", nil, [0]]
];

// Convert max gradient angle to percentage
private _maxGradient = _maxGradientAngle / 45;

// Will return a position if flat enough. Will return an empty array if it fails
private _isPositionFlatEnough = _position isFlatEmpty [-1, -1, _maxGradient, _radius, -1, false];
if (_isPositionFlatEnough isEqualTo []) exitWith { false };

true;
I'll double check and make sure there's no rogue calls of this with a huge radius
deft oak
whole cloud
Oh I think I know what the collision crashes are.
I think they only happen if th...
Both our collision crashes killed the player in the receiving vehicle so this lines up for us.
empty goblet
1.54.133841 profiling & performance v8 server and client, windows, linux
- more debug traps to catch/log unresolved crashes
https://www.dropbox.com/sh/582opsto4mmr8d8/3BSy9PdRGm
 whole cloud
2.18.152703 152706 new PROFILING branch with PERFORMANCE binaries, v25, server and client, windows 64-bit, linux server 64-bit
- Added: Mission file downloading over HTTP
- Tweaked: Performance optimizations to findEmptyPosition
- Fixed: Crash when killing units/vehicles with collisions
- Fixed: Bad Conversion error inAreaArray* commands
- Fixed: Map controls sometimes rendering in wrong position
- Fixed: skipLobby parameter could not assign players into Virtual Spectator or Zeus slots and could get stuck if no other slots are free (Thanks Dimon UA)
- Fixed: Functions Viewer did not populate list of functions when opening
If you don't want to use the Steam branch, the files are also available for alternative download here:
https://drive.google.com/drive/folders/15p9j7C2nHUt6NoVfChX4YFuqzFXzblJh
Note: There are separate Dll files that also need to be placed into Game folder.
whole cloud
whole cloud
2.18.~~152703~~ 152706 new PROFILING branch with PERFORMANCE binaries, v25, serv...
patent sky
For the HTTP Downloads:
In server.cfg add the following entry
missionHTTPDownloadBaseURL = "https://website.com/missionfiles/"
- It MUST be http or https and end with a /
- The game will append the mission file name (same casing as file on server) + .pbo (Resulting in "https://website.com/missionfiles/MissionName.Altis.pbo"
- Current file size limit for download has been set at 512MB.
- Only clients also on profiling V25+ will be able to download this way, older prof and main branch client are unaffected.
The client will first try to download from the URL, if the download fails for any reason the client will fall back to the old method.
This is still very early and any of the above requirements/limits may change at any point.
whole cloud
patent sky
For the HTTP Downloads:
In server.cfg add the following entry
`missionHTTPDownlo...
heavy galleon
Is there any kind of check if the missions are actually the same?
knotty wraith
- Fixed: skipLobby parameter could not assign players into Virtual Spectator or Zeus slots and could get stuck if no other slots are free
Is it enough to have this only on the server or does the player also have to have the latest version of the prof?
whole cloud
knotty wraith
> - Fixed: skipLobby parameter could not assign players into Virtual Spectator ...
Server side enough
whole cloud
heavy galleon
Is there any kind of check if the missions are actually the same?
U think we amateurs :u
heavy galleon
I'd rather not answer
But very cool. Is there a speed improvement for download?
With 200 players waiting for a 10MB mission, it could play a part 
whole cloud
heavy galleon
But very cool. Is there a speed improvement for download?
Well obvi, http downloads are whatever speed it can give you.
Not limited by Armas message count or bandwidth limit or processing or netcode mess
Also no server lag spikes when it's loading and cutting up the mission file
It should even support gzip compressed download via http, but we didn't test that yet
(Maybe someone else can test that :3)
fickle geyser
I wish we had something like that http stuff for Reforger mods.
vale shoal
Would it also be possible to load the mission file into memory (like in DayZ) instead of saving it into MPMissionCache?
light cargo
yeah maybe make -loadmissionintomemory work for clients that way
whole cloud
vale shoal
Would it also be possible to load the mission file into memory (like in DayZ) in...
yes, no. What for? save disk space?
feral harness
canFitUnderADoor = true;
good?
patent sky
feral harness
canFitUnderADoor = true;
good?
Better than good, perfect
opal hound
opposableThumbs = true;
feral harness
@fickle geyser @spiral pond @analog acorn Please test it when next profiling is out
Revision: 152704
spiral pond
@feral harness in reference to what/why tag me here?
feral harness
rat/small animal config
spiral pond
You probably were mixing me up with Kerc for this
feral harness
probably @unborn urchin
 cold vale
whole cloud
2.18.~~152703~~ 152706 new PROFILING branch with PERFORMANCE binaries, v25, serv...
cold vale
whole cloud
2.18.~~152703~~ 152706 new PROFILING branch with PERFORMANCE binaries, v25, serv...
Will the HTTP downloads support including basic auth into the URL? I'd like to keep the endpoint I already have restricted under basic auth even though I do understand it would be trivial for someone to extract it from a client after joining, I'd just rather not open things up.
whole cloud
cold vale
Will the HTTP downloads support including basic auth into the URL? I'd like to k...
I think yes.
But all clients will know the URL
I think clients do not log the URL though, only server writes to logs. So its atleast not super trivial to get it
cold vale
whole cloud
I think yes.
But all clients will know the URL
I assume if a server is password restricted they will not be sent this URL until at least the mission load process starts, so they would first need to know the join password?
whole cloud
yea
cold vale
Yeah that's plenty secure for private community usecases then 👍
(you could even have a script generate a new basic auth config and replace it in the server.cfg on each server startup if somewhat concerned)
whole cloud
or you could make it scan RPT for player join, grab their IP, and temporarily allow the IP on the webserver 😄
quartz rampart
does arma send any special headers/cookies when trying to download via HTTP?
maybe you could "auth" the user that way 😛
indigo anvil
quartz rampart
does arma send any special headers/cookies when trying to download via HTTP?
Of course, the mandatory X-ClientRunningOn: CoFFee header entry
autumn timber
A simple user-agent header would probably be enough
light cargo
whole cloud
yes, no. What for? save disk space?
and for cases that missions are preferred to not be cached for intel reasons
 keen bolt
whole cloud
2.18.~~152703~~ 152706 new PROFILING branch with PERFORMANCE binaries, v25, serv...
keen bolt
whole cloud
2.18.~~152703~~ 152706 new PROFILING branch with PERFORMANCE binaries, v25, serv...
What are the chances of this going to stable, assuming everything works out smoothly. (Mostly asking about the mission download over HTTP feature)
 raven sand
did this have anything to do with my minidump i sent?
whole cloud
keen bolt
What are the chances of this going to stable, assuming everything works out smoo...
I have two open crashes right now, we might do crash fix updatetoday
whole cloud
quartz rampart
does arma send any special headers/cookies when trying to download via HTTP?
afaik the useragent is specific
If you have specific ideas on headers we should add, feel free to suggest some.
whole cloud
whole cloud
I have two open crashes right now, we might do crash fix updatetoday
nevermind, no crashes so far. 🤞
I'll throw it on my main server for the weekend
This combination is so funny
 whole cloud
Mh already found a bug with the http downloads.
After you've done a http download and you join into the mission, you spawn twice.
The other being an AI with your name on it.
[06/Mar/2025:09:27:00 +0100] "GET /missions/greenhell.pja305.pbo HTTP/1.1" 200 35849383 "-" "-"
looks like the user agent is "-" which is.... unfortunate, I'll fix it
whole cloud
whole cloud
Mh already found a bug with the http downloads.
After you've done a http downloa...
It only happens, if a client does a http download, before the server has started the mission. If a client JIP joins, then its fine.
spiral pond
does the HTTP GET support the same character set as A3 accepts for mission file naming?
whole cloud
It just throws bytes around
it doesn't know about character set
[06/Mar/2025:11:15:41 +0100] "GET /missions/DbgZeus4P.VR.pbo HTTP/1.1" 200 11106 "-" "BIGameEngine/2.18.150717"
So there is a user agent now, with game version number in it
 viral compass
I tried out profiling vs base game on Linux/Proton and YAAB only gave me a +1fps improvement on 3 run averages, are others seeing better improvements?
viral compass
For context, all my runs average around 60 fps so even percentage-wise it's below 2%
worldly badge
Juuust incase, do you use Vsync
viral compass
Nope :D
whole cloud
⚠️ 🚨 ⚠️ We replaced v25 with a new build 152706.
- Fixed: Non-jip player unit being created twice if http download is used
- Added: A user agent for the web requests
Eagerly taking ideas and feedback about this. Like maybe add http headers with the expected mission file size, or others that might be useful?
We already have a second part of this in the works so if anything would be useful to be added, now is a great time.
 chilly geyser
whole cloud
⚠️ 🚨 ⚠️ We replaced v25 with a new build 152706.
\- Fixed: Non-jip player uni...
chilly geyser
whole cloud
⚠️ 🚨 ⚠️ We replaced v25 with a new build 152706.
\- Fixed: Non-jip player uni...
http requests for rest is a very useful thing, but I don't know if it is possible
whole cloud
I mean ideas and feedback about http mission downloads
chilly geyser
whole cloud
I mean ideas and feedback about http mission downloads
😦
 ember owl
whole cloud
2.18.~~152703~~ 152706 new PROFILING branch with PERFORMANCE binaries, v25, serv...
ember owl
whole cloud
2.18.~~152703~~ 152706 new PROFILING branch with PERFORMANCE binaries, v25, serv...
Genuinely so huge- thank you guys for all your hard work 💕
analog acorn
whole cloud
⚠️ 🚨 ⚠️ We replaced v25 with a new build 152706.
\- Fixed: Non-jip player uni...
This isn't exactly my area of expertise so this might be stupid, but does it also do HTTPS? Not that I think it's a security risk for this purpose, but some of the more paranoid servers might prefer to refuse unsecured connections entirely
vale shoal
analog acorn
This isn't exactly my area of expertise so this might be stupid, but does it als...
yes, it also works with https
whole cloud
analog acorn
This isn't exactly my area of expertise so this might be stupid, but does it als...
empty goblet
whole cloud
2.18.~~152703~~ 152706 new PROFILING branch with PERFORMANCE binaries, v25, serv...
just to understand how happy certain Dwarden person is about that Added: Mission file downloading over HTTP
2006 https://community.bistudio.com/wiki?title=User:Dwarden/Sandbox&oldid=27556
2009 https://forums.bohemia.net/forums/topic/70345-server-ability-url-forwarding-of-mission-content/?do=findComment&comment=1248441
2013 https://feedback.bistudio.com/T67473
quite sure it's been at least 17 and 15 years for first entries inside internal system for Arma 2 and like decade for Arma 3 🙂
thanks @patent sky thanks @whole cloud
Bohemia Interactive Forums
Im creating this thread with poll to obtain some feedback on one possible feature for ArmA 2 (with very rare chance this to appear also for ArmA 1) server / client. Original thread with POLL was here : http://www.flashpoint1985.com/cgi-bin/ikonboard311/ikonboard.cgi?act=ST;f=57;t=77288 The featur...
now nobody can claim Unreal, Quake and CounterStrike has that and Arma don't 🤣 no more
obsidian condor
Heh, that 2006 list. Hmm, how many are in Enfusion/Reforger (specifically the "Unfinished" section? Don't get me started on the awful weapon resting feature 🤮
restive pilot
Which one is awful?
obsidian condor
Reforger's bipod interface
Anyway, back to ARMA 3, if we're going back to deal with more 2013 FT tickets then agents not walking through some building doors without even opening them (both are still issues) would be a cool thing
E.g. agent will just walk into the land_i_shed_ind_f through the door without opening it
restive pilot
Isn't that related to door names?
obsidian condor
Not sure, I saw something about badly fitted out model for when it happens in general once but was probably just speculation 🤷
That said, with all the warnings on BI stuff in a standard RPT I would not be surprised 😉
restive pilot
I'm not sure either but I remember a really long time ago someone said to me it was because of door names 😅
quartz rampart
whole cloud
⚠️ 🚨 ⚠️ We replaced v25 with a new build 152706.
\- Fixed: Non-jip player uni...
i thought maybe steamUID or maybe server IP the user is currently on? that way you could quite easily auth that the user is "authorized"
whole cloud
Steam UID might be problematic.
Server IP yeah.
But you already have the client IP in server log, so you could check which IP the http request comes from to compare the two
quartz rampart
whole cloud
Steam UID might be problematic.
Server IP yeah.
But you already have the client ...
yeah that is true but that makes it more "complicated" as then you need to parse the server log every time you get a request.
whole cloud
but you'd have to do that for steam uid too, unless you have a specific whitelist
quartz rampart
whole cloud
but you'd have to do that for steam uid too, unless you have a specific whitelis...
yeah i was thinking about a specific whitelist
whole cloud
Wondering if thats some kind of privacy issue, but I don't think it can be, you only go to the link after you're already on the server so the esrver already has your UID
quartz rampart
it is also i feel like easier to maintain Steam UUIDs then client IPs 😛
heavy galleon
tbh, how much "security" you need here?
The moment someone is requesting the map from the webserver, he will either get it from the webserver OR the arma server itself
the only issue could be someone downloading it manually
but that you will never solve
you can just queue the server for players, find their steam, you got the steamid, access granted
whole cloud
A client could share the link and give it to someone who's not on the server.
But at that point, they could also give the steam UID and fake the headers 🤷
fickle geyser
or mission file from their pc
heavy vortex
Does it send the server password?
whole cloud
Thing I had in mind is that you might have a server that has different version of the same mission file with the same filename. Needing to differentiate which version the client actually wants.
But probably just going to send expected filesize, maybe hash
heavy galleon
whole cloud
U think we amateurs :u

heavy galleon
I refused to answer 
heavy vortex
I guess if you really care about non-clients downloading your mission then you can just not use the http.
heavy galleon
download with html, calc hash, ask server if correct
if not, fall back to arma messages
I could spoof size by removing other shit after adding myself into the allowed debug console list 
actualy nah, keep it as it is I could have some fun
 cloud nacelle
Why not make dedi server automatically start a http server that handles the missionfile so people don't need to do it separately?
heavy galleon
because for example ports
whole cloud
cloud nacelle
Why not make dedi server automatically start a http server that handles the miss...
lol
bleak coral
@whole cloud Just curious about 2 things in regards to the new method for downloading mission files. How does it handle mission files that have %6 in them for example, I've set it up through apache, and going to the link http://<IP>/missionfiles/example.mission.name.%6.pbo wouldn't work, but getting rid of that seemed to fix it and download the mission file fine.
Another thing, is there anyway of actually checking if people are downloading it via that methor? Or would you have any way of checking that you're aware of and can point me in the direction of?
Disregard the 2nd point, can just pull up the acces log.
 celest sparrow
just make it dl from my gitlab package manager dangit
bleak coral
celest sparrow
just make it dl from my gitlab package manager dangit
G Drive links would be better...
celest sparrow
that is how my current pipeline works, mission packs to there, server grabs it :(
private hosted
bleak coral
I just had it be uploaded and downloaded by a discord bot lol
G Drive might be a bit easier
heavy vortex
bleak coral
<@90532520101183488> Just curious about 2 things in regards to the new method fo...
Well, you'd probably want to replace % with %25 at least. Whether it works is another matter.
bleak coral
Well things like "." show up as %6 or similar.
It's not a huge deal, I can just remove the decimal. Just wondering if I'm being a numpty or if it's just not supported 😅
heavy vortex
Your mission name is example.mission.name...pbo?
patent sky
bleak coral
<@90532520101183488> Just curious about 2 things in regards to the new method fo...
Should™️ be fine but I didnt test that case
bleak coral
Ah look, it's not a big deal, I think we'll manage without a decimal 😄
Was just easier to manage map itterations when it's being passed around.
heavy vortex
The dot's a valid URL character so I'm not sure what point it's breaking at.
bleak coral
So for example, 0.6 gets turned into 0%2e6 in the actual folder name
patent sky
heavy vortex
The dot's a valid URL character so I'm not sure what point it's breaking at.
arma likes to encode missione file names a weird way, check any workshop mission with weird characters in its name, will have %5 etc in the file name
bleak coral
Ah for the effort it's worth, I'll just not use any characters than encode like that at all.
heavy vortex
I would expect Arma to do that encoding automatically. It's kinda doing the same encoding twice, but that should still work.
obsidian condor
whole cloud
Thing I had in mind is that you might have a server that has different version o...
bisign?
whole cloud
bleak coral
<@90532520101183488> Just curious about 2 things in regards to the new method fo...
Something to fix for @patent sky I guess.
Especially %20 is very common in file names..
We should try to encode the filename into URL, so that just dropping a file with same name on the webserver, will get to the file.
if people are downloading it via that methor?
Server RPT logs every time it offers client a http download, or when it fails, or when it couldn't offer (because client not on profiling branch)
whole cloud
obsidian condor
bisign?
wat, missions have no bisign. What do you mean
patent sky
KP%20Liberation%20Altis%20(2035%20CDLC%3a%20WS,%20RF,%20&%20EF).Altis.pbo

whole cloud
Probably, for that also want to add a http header that has the original non-tampered with name?
Even though I think basically no-one will do it, I want to cater to people that host their own API with some database thing that handles the requests, instead of just a webserver with a folder 🤔
(I actually already have such an API for mission downloads for our web interface, would be nice to re-use that)
patent sky
Same, also allows easier access control and logging
whole cloud
Performance and request size is irrelevant, so we could go wild with that
bleak coral
whole cloud
Probably, for that also want to add a http header that has the original non-tamp...
Here's me with a basic ass Apache HTTP setup lol. But if anything you have suggested will help in any way I'm all ears.
whole cloud
I do the same basic apache setup right now.
But my mission makers don't use special characters like that in filename
bleak coral
I guess if it ain't broke don't fix it.
whole cloud
we're going to fix it though
bleak coral
whole cloud
we're going to fix it though
I'm glad we actually have even just the basic setup for it (I assume it wasn't so basic to actually create tho lol). Going to have to start forcing people to use profiling now
obsidian condor
whole cloud
wat, missions have no bisign. What do you mean
LOL, I know. Was thinking of ways of verification but realized when I was headed to bed that it wouldn't add anything
gritty wasp
Logs looks clear. But we did not manage to play 150+ players mixed perf/stable. Waiting for server message and that is it. Probably http offering check took too much time. NGINX error log also clear.
whole cloud
Probably http offering check took too much time.
no
gritty wasp
If this is http server DoS, should it throw 500 in error log?
Did someone else tried http load?
vale shoal
gritty wasp
If this is http server DoS, should it throw 500 in error log?
Did someone else ...
I use it too, but only have 68 entries since yesterday morning. So not many of my users actually use perf branch.
But what I also saw is that the server (while getting data from my custom XML) is also sending BIGameEngine/2.18.152706 as agent.
gritty wasp
In RPT we had 42 entries of Offering HTTP and 107 fails because of stable 152405 build.
File was just 1.1MB
whole cloud
I ran it yesterday, I force all players on prof, works super fine a nice and fast
Need to actually measure download bandwidth, I have a slight fear it might be game fps dependant
gritty wasp
force all players on prof
What if mixed?
HTTP hosting and game server on same machine?
whole cloud
what then?
Yes
empty plover
is the HTTP download MT?
gritty wasp
whole cloud
what then?
Yes
will it be super fine a nice and fast when there are also players on stable clients?
whole cloud
empty plover
is the HTTP download MT?
öh... wat.
That doessn't make sense. You mean if we're running multiple parallel connections? no
whole cloud
gritty wasp
will it be `super fine a nice and fast` when there are also players on stable cl...
stable clients won't get the fast one, so no
empty plover
whole cloud
öh... wat.
That doessn't make sense. You mean if we're running multiple parallel...
i was thinking if user has bad connection that could freeze arma during the download process, unless MT
and in anycase download takes time so I wonder how do you managed that
cloud sky
empty plover
i was thinking if user has bad connection that could freeze arma during the down...
It's async, like not tied to the game/simulation loop
empty plover
cloud sky
It's async, like not tied to the game/simulation loop
that's good then
whole cloud
the download is async
And I don't think you care about Arma freezing while you're on a loading screen
empty plover
well if your there long enough windows is like "the program doesnt respond" 😉
but sounds like you got it covered
fast hornet
does it need port 80/443 or does the config entry allow something like this?:
missionHTTPDownloadBaseURL = "https://website.com:8080/missionfiles/"
whole cloud
Anything that a webbrowser supports, should work
fast hornet
kk.. will test it in a bit 🙂
fast hornet
i just noticed that the logging is a bit inconsistent.. might be a good idea to change that to make it easier/possible to debug.
Offer:
18:47:25 Offering HTTP mission download to 'playername' at 'http://www.example.com/Exile.Chernarus_Isles.pbo' size 4.1 MiB
Fail:
18:47:28 Client mission file download from HTTP mirror failed for client: 11111111111111111! HTTP Code: 0 ErrorMsg: Failed to connect to www.example.com port 8080: Timed out
So the offer only has the player name and the fail only has the steamid.
(The fail itself is fine, no http server running at that time. Also looks like a non-default port in the config is getting honored.)
 bleak coral
So I don't know if I'm doing something wrong, but I have one server up with a different profile name than this that has the missionHTTPDownloadBaseURL part in the server_config.cfg. I'm now trying to launch a second seperate server and come across this error:

Image Screenshot-2025-03-08-190631 hosted in ImgBB
leaden relic
bleak coral
So I don't know if I'm doing something wrong, but I have one server up with a di...
You have the property defined twice
bleak coral
leaden relic
You have the property defined twice
That's what I'm asking about. In my server_config.cfg it is defined once. But when I have 1 server with that in the server_config running and I try to launch a second arma server instance on the same dedi box it comes up with that
leaden relic
Oh that's odd
Try looking at the file, maybe the two configs were appended together?
bleak coral
leaden relic
Oh that's odd
Try looking at the file, maybe the two configs were appended toget...
Seems like its being added now to the config, not sure what i did different, but tl;dr it works
fast hornet
do you apply a different cfg file for both servers with the -config= parameter?
deft oak
Got a new interesting one today. About 10 minutes after an automated restart server FPS dropped from the usual 90's to the 10's and stayed there while spamming out these frame captures. All of them look generally the same (like the attached).
This is on server version 152674.
 light cargo
yes dedmen, new steamapi broke old steam systems
i knew it

it crashed randomly when i selected a workshop mission

only arsenal is accessible
i cant go back to stable because of the memory improvements
i hope next stable doesnt include the steamapi stuff but the memory improvements :harold:
all i can play is vanilla content not workshop
its so bad that expansions has a purchase button for every entry and it complains the steam overlay is disabled
whole cloud
light cargo
it crashed randomly when i selected a workshop mission
You got a crash report for that one?
light cargo
whole cloud
You got a crash report for that one?
yep, crashdumps enabled
and also a random launcher crash
no matter what i pick its not letting me host game

other than this, the game is perfectly functional


with own dedicated server i get stuck connecting :|
same with multiplayer servers
heavy galleon
light cargo
with own dedicated server i get stuck connecting :|
Have you tried linux?
If you can't run arma properly on your main OS, maybe linux can be of help!
(and I tested it, it works  )
)
spiral pond
deft oak
Got a new interesting one today. About 10 minutes after an automated restart ser...
{"name":"nSSC","ts":7123.6,"pid":0,"tid":2816,"ph":"X","dur":96.8,"cat":"p"},
almost 15k of these as part of{"name":"nSPSC","ts":7122.9,"pid":0,"tid":2816,"ph":"X","dur":291251.7,"cat":"p"},
gritty wasp
light cargo
i cant go back to stable because of the memory improvements
memory allocation improvements still give less benefit than mimaloc
light cargo
gritty wasp
memory allocation improvements still give less benefit than mimaloc
i cant use mimalloc because of 16gb of ram and i have much less free ram available, only scheduled collect version
light cargo
heavy galleon
Have you tried linux?
If you can't run arma properly on your main OS, maybe linu...
no storage on main pc for it
heavy galleon
light cargo
no storage on main pc for it
upgrade 🙂
light cargo
heavy galleon
upgrade 🙂
argentina here, no money
heavy galleon
there's ways, for super cheap, like 4€, or even 0
deft oak
spiral pond
> {"name":"**nSSC**","ts":7123.6,"pid":0,"tid":2816,"ph":"X","dur":96.8,"cat":"p...
Interesting, I've never seen that one. It was doing this until I restarted it after about 15 minutes.
I've got a similar frame capture from every 20 seconds during it
whole cloud
deft oak
Got a new interesting one today. About 10 minutes after an automated restart ser...
The server is getting confirmation that a previously pending network message, has now been delivered.
Maybe there was alot of packet loss before that? I'd expect lots of is pending in your RPT
I can optimize that a bit, but ~18k hits, and you said this happened over multiple frames. Even if I make that twice as fast that won't do much for that case.
whole cloud
I figure I can probably speed this up 10x for your situation.
But I expect such situations to not really happen, so maybe it was just a rare fluke. Won't fix that for now.
Usually you have a few hundred messages handled there, not tens of thousands.
If it happens more often I'd consider it
spiral pond
Something caused those pending message before, right? Wouldnt it make more sense (also) trying to determine what caused it?
whole cloud
Packet loss. Maybe some player is on wifi.
There's nothing to investigate there
vale shoal
whole cloud
Packet loss. Maybe some player is on wifi.
There's nothing to investigate there
That happens actually more often than I thought. Even in the past weeks, we had at least 4 cases of users getting constant "Signature check timeouts" on different pbo files. After switching to Ethernet, it stopped. I don't know why someone could even consider playing on Wifi.
heavy galleon
vale shoal
That happens actually more often than I thought. Even in the past weeks, we had ...
Because wired is not always an option.
inland dew
vale shoal
That happens actually more often than I thought. Even in the past weeks, we had ...
yeah, it's also not rare for me to see playets getting kicked with sig timeout on different servers
deft oak
whole cloud
The server is getting confirmation that a previously pending network message, ha...
That's interesting but I suppose it explains why it happened within a few minutes of a restart and why it was the only time I've ever seen it. It did do this consistently for about 15 minutes (until I was forced to restart the server to resolve it). During that time I got about 35 frame captures that all look like the one I posted above. And indeed my RPT is full of "is pending" messages. In the future, is there a way for me to identify the player and kick them to avoid having to restart the server to resolve this? Unscheduled restarts are really a pain for us with our "persistent environments".