#pyqtgraph
1 messages · Page 1 of 1 (latest)
 torn minnow
 rough furnace
torn minnow
<@369662814488363009> how do you produce a contour plot?
rough furnace
torn minnow
<@369662814488363009> how do you produce a contour plot?
No great support for that right now, one of the matplotlib maintainers proposed a 3rd party library to assist with contours https://twitter.com/story645/status/1541772631266975744

@ogimoore @pleiszenburg @pyqtgraph would it be possible to build a computation only library that could then be used by us and pyqtgraph? Kinda like https://t.co/ZflUiMepgw
 Twitter
·
torn minnow
rough furnace
No great support for that right now, one of the matplotlib maintainers proposed ...
Twitter
·
torn minnow
rough furnace
No great support for that right now, one of the matplotlib maintainers proposed ...
Thank you
rough furnace
GitHub - contourpy/contourpy: Python library for calculating contours in 2D quadrilateral grids
https://github.com/contourpy/contourpy
People have opinions on using this library within pyqtgraph?

GitHub
Python library for calculating contours in 2D quadrilateral grids - GitHub - contourpy/contourpy: Python library for calculating contours in 2D quadrilateral grids
rough furnace
rough furnace
GitHub - contourpy/contourpy: Python library for calculating contours in 2D quad...
This library when combined with pcolormeshitem could offer substantial contour plots; pcolormesh I believe requires quads and won’t do triangles
 mortal grotto
Is this a reliable way of only disconnecting from a signal if it is already connected?
def maybe_disconnect(signal, slot):
  try:
      signal.disconnect(slot)
  except (TypeError, RuntimeError):
      # TypeError for PyQt, RuntimeError for PySide
      pass

# test 1:
signal.connect(slot)
maybe_disconnect(signal, slot) # works
# test 2: no connection
maybe_disconnect(signal, slot) # works
Use case: List of objects and a slot can either be connected to object.signalA or object.signalB. Easy to just try-except and disconnect from A & B for all objects:
for obj in obj_list:
    maybe_disconnect(obj.signalA, slot)
    maybe_disconnect(obj.signalB, slot)
slot is not a QtCore.Slot, so it's not possible to call slot.disconnect()
rough furnace
Yes; if you’re on newer than Qt 5.12; you can store the QMetaObject that is returned when you call the connect method. You can call QObject.disconnect(QMetaObjectInstance)
When I’m not on mobile I’ll do a better example; I think @obsidian sapphire worked on integrating this into functions.disconnect on a PR that hasn’t been merged.
mortal grotto
Thanks for the detailed answer. The connection happens elsewhere, so it's hard to determine where that meta info would be stored. However, if the try-except behavior has failure cases, I'll find a way to do things more robustly
Here's a MWE I've been playing with to test all bindings and potential wacky cases
import os
os.environ['PYQTGRAPH_QT_LIB'] = 'PySide2'

from pyqtgraph.Qt import QtCore, QT_LIB

print(QT_LIB)

class Sender(QtCore.QObject):
    signal = QtCore.Signal(object)

class Receiver:
    def slot(self, arg):
        print('slot: ', arg)

    def maybe_disconnect(self, signal):
        try:
            signal.disconnect(self.slot)
        except (TypeError, RuntimeError):
            pass

sender, receiver = Sender(), Receiver()

def test_disconnect():
    sender.signal.connect(receiver.slot)
    sender.signal.emit(1)

    receiver.maybe_disconnect(sender.signal)
    sender.signal.emit(2)
    receiver.maybe_disconnect(sender.signal)
    sender.signal.emit(3)

if __name__ == '__main__':
    test_disconnect()
You can store it as an attribute to the object that stores the signal
mortal grotto
I'll try recording an array of MetaObjectInstances and disconnecting from everything in that array; seems more graceful than brute-force above
rough furnace
mortal grotto
I'll try recording an array of `MetaObjectInstance`s and disconnecting from ever...
we have a disconnect method in functions.py; but it doesn't accept QMetaObject's currently, it still expects a signal and slot to be passed to it. Really should have it accept QMetaObject's ...as those have been the most reliable ways I've found to disconnect signals (they didn't work on Qt 5.12, but do work on Qt 5.15)
mortal grotto
Perfect, thanks. Good to know I was on the right track
torn minnow
sorry to bother, but how would i convert this matplotlib code to pyqtgraph
fig = plt.figure()
ax = fig.add_subplot(111, projection='3d')


m_s, b_s = np.meshgrid(m_array, b_array)
e = (m_s + b_s - 2) ** 2 + ((2 * m_s) + b_s - 5) ** 2 + ((3 * m_s) - 7) ** 2
ax.plot_surface(m_s, b_s, e, rstride=1, cstride=1, cmap='viridis', edgecolor='none')
my attempt:
import numpy as np
import pyqtgraph as pg
import pyqtgraph.opengl as gl


app = pg.mkQApp("GD")
w = gl.GLViewWidget()
w.show()
w.setWindowTitle('GD')
w.setCameraPosition(distance=20)

g = gl.GLGridItem()
w.addItem(g)

m_array = np.linspace(-10, 15, 100)
b_array = np.linspace(-10, 15, 100)

m, b = np.meshgrid(m_array, b_array)
e = (m + b - 2) ** 2 + ((2 * m) + b - 5) ** 2 + ((3 * m) - 7) ** 2

p2 = gl.GLSurfacePlotItem(x=m,y=b,z=e, size=5, shader='normalColor')
w.addItem(p2)


if __name__ == '__main__':
    pg.exec()
error:
Traceback (most recent call last):
  File "C:\Users\e\Gradient Decent\e.py", line 21, in <module>
    p2 = gl.GLSurfacePlotItem(x=m,y=b,z=e, size=5, shader='normalColor')
  File "C:\Users\e\AppData\Local\Programs\Python\Python39\lib\site-packages\pyqtgraph\opengl\items\GLSurfacePlotItem.py", line 29, in __init__
    self.setData(x, y, z, colors)
  File "C:\Users\e\AppData\Local\Programs\Python\Python39\lib\site-packages\pyqtgraph\opengl\items\GLSurfacePlotItem.py", line 104, in setData
    self._vertexes[:, :, 0] = x.reshape(len(x), 1)
ValueError: cannot reshape array of size 10000 into shape (100,1)
Can you share a screenshot of the matplotlib output?
 fervent vale
import numpy as np
import pyqtgraph as pg
import pyqtgraph.opengl as gl

pg.mkQApp()
w = gl.GLViewWidget()
w.show()
w.setCameraPosition(distance=50)

g = gl.GLGridItem()
g.setSize(30, 30, 0)
w.addItem(g)

m_array = np.linspace(-10, 15, 100)
b_array = np.linspace(-10, 15, 100)

m, b = np.meshgrid(m_array, b_array)
e = (m + b - 2) ** 2 + ((2 * m) + b - 5) ** 2 + ((3 * m) - 7) ** 2

p2 = gl.GLSurfacePlotItem(x=m_array,y=b_array,z=e, size=5, shader='normalColor')
p2.scale(1, 1, 0.005)
w.addItem(p2)

pg.exec()
matplotlib

pyqtgraph

 nocturne dagger
Is there any way to send whatsapp messages trough python?
rough furnace
nocturne dagger
Is there any way to send whatsapp messages trough python?
Not the right channel
 crude ginkgo
hello, how can i get both product name and family name?
the website doesn't have api to request from it
 mortal grotto
crude ginkgo
hello, how can i get both product name and family name?
the website doesn't have...
mortal grotto
crude ginkgo
hello, how can i get both product name and family name?
the website doesn't have...
Not the right channel for this question
crude ginkgo
mortal grotto
Not the right channel for this question
alright mb
 autumn olive
is there a way to make an instant search with database? PYQT5**
rough furnace
autumn olive
is there a way to make an instant search with database? PYQT5**
I don't understand the question... what database?
torn minnow
autumn olive
is there a way to make an instant search with database? PYQT5**
yes, but wrong channel
 tired totem
Hey, someone interest working in a project with me?
rough furnace
tired totem
Hey, someone interest working in a project with me?
Considering this channel is monitored by maintainers and some regular contributors to pyqtgraph; we already have a regular project we contribute to. If you’re looking to contribute to the library, I would take a look at the contributing guide, and identify an issue you want to tackle.
 sharp herald
fervent vale
pyqtgraph
sharp herald
fervent vale
pyqtgraph
My goodness PyQTGraph looks so sexy
sharp herald
crude ginkgo
hello, how can i get both product name and family name?
the website doesn't have...
Whats the website? I'm a web scraper, maybe I can help you out
sharp herald
tired totem
Hey, someone interest working in a project with me?
What are you looking to do?
rough furnace
on one hand I would love to get started on work on seeing if the next major iteration of seaborn, which supposedly might support alternative backends besides matplotlib ...but on the other hand, I don't want to nag Michael about wh en something is available for testing.
 dapper yarrow
I'm really enjoying pyqtgraph ImageView with the built-in HistogramLUTItem
I normally set a custom colormap, which gives 256 individual ticks on the colormap
256 individually movable ticks is a bit excessive, is there any way to hide these ticks?
fervent vale
After setting the custom colormap, you could call
imv.ui.histogram.gradient.showTicks(False)
@fervent vale thanks!
 copper lily
new channel
rough furnace
https://twitter.com/pamelafox/status/1556779165247893506
At least we don’t have to worry about clobbering git history with running black on the entire repo

It's super cool that Github blame can ignore any revisions you put in a .git-blame-ignore-revs file. Now I don't have to feel bad about running prettier on a codebase! https://t.co/4FT1mnko6U
 Twitter
·
Twitter
·
Only the PR merge conflicts
 stoic lotus
PyQtGraph: How to show first and last tick string values on x-axis?
I want to synchronize the x-axis of PyQtGraph. When the user rescales the X-Axis with mouse interactions (e.g. scroll-wheel while mouse on x-Axis) I want to see first and last tick values only when plot is in its initial state and when zoom-in or zoom-out other ticks will appear.
This question has a follow up here (https://stackoverflow.com/q/31775468/10543310) and here (https://stackoverflow.com/q/73240127/10543310).
ticks = [list(zip(t_time_value, t_ticks_values))]
Note: ticks can be of a large length (at least 16385).
I found setTickSpacing() (https://pyqtgraph.readthedocs.io/en/latest/_modules/pyqtgraph/graphicsItems/AxisItem.html#AxisItem.setTickSpacing) but not sure how to use it or it is the right one to use.
Thanks for help!

Stack Overflow
I want to display string values for ticks on x-axis in pyqtgraph. Right now I am unable to figure out how to do that.
Ex:
x = ['a', 'b', 'c', 'd', 'e', 'f']
y = [1, 2, 3, 4, ,5, 6]
pg.plot(x, y) ...
Stack Overflow
I am trying to plot temperature data points according to their time recording.
t = ['2021-12-11T0:6:15', '2021-12-11T7:15', '2021-12-11T8:15', '2021-12-11T9:15', '2021-12-11T10:15']
temp = [33.6, ...
rough furnace
saw this on the mail list earlier; ...the axis spacing stuff is something that I've found to be a bit elusive; will see if someone else that monitors here has a good tip off the top of the head.
If nobody can come up with anything, I'll try and dive into this later tonight
fervent vale
Do you really need to display arbitrary string values? Couldn't you just use DateAxisItem? The bundled pyqtgraph example plots 8301 points with good performance.
rough furnace
@rocky kelp not the right channel; please take a look at #❓|how-to-get-help
 azure hearth
 rocky kelp
someone know how to use pyCharme?
rocky kelp
someone know how to use pyCharme?
Yes.
rough furnace
Segfaults!!!!!!!!
 soft basalt
stoic lotus
stoic lotus
**PyQtGraph: How to show first and last tick string values on x-axis?**
I want ...
soft basalt
stoic lotus
stoic lotus
**PyQtGraph: How to show first and last tick string values on x-axis?**
I want ...
Any help community, please?
rough furnace
stoic lotus
Any help community, please?
Did you try the suggestion from pijyoi to use the DateAxisItem?
stoic lotus
rough furnace
Did you try the suggestion from pijyoi to use the DateAxisItem?
I appreciate your reply. I tried but didn’t know how to use it. I’ve been dealing with this for more than a week. I can share more details about my task
rough furnace
if you can post a code snippet of some code that demonstrates the issue a bit more? I can certainly take a look and see if I can modify that accordingly.
rough furnace
look at PR that uncomments out code; ... wonder why it was commented out....
🤦♂️

 mental cradle
Hi everyone,is it too late to join the team for this project?
Or it's developed already and you guys maintaining it ?
fervent vale
stoic lotus
I appreciate your reply. I tried but didn’t know how to use it. I’ve been dealin...
Have you looked at pyqtgraph/examples/ DateAxisItem.py?
rough furnace
@torn coyote @obsidian sapphire @fervent vale I need a sanity check regarding @mortal grotto 's PR for interactive params (not relating to the code diff, but relating to the segfault in the CI).
pyqtgraph/pyqtgraph#2318 is the PR in question. It shows a segfault for Python 3.9/PyQt5 5.15/Ubuntu (and only for this pipeline). Re-running the CI job results in that job failing at the same spot in the test suite with a segfault.
First, I attempted to replicate locally. I was unable to. Then I pushed @mortal grotto 's branch to my fork, CI ran, no segfault. @mortal grotto pushed an empty commit to the branch, triggering a new CI run, segfault.
I'm not sure what to do. I'm inclined to merge and hope this segfault is a result of some artifact that is cached (or just not going away) when the CI is rerun. I'd like to get other opinions.
 supple leafBOT
 mortal grotto
PlotWidget + ImageItem is a glorious combination that allows smooth zooming and panning with large images. I have to play in C++ land for a different app; has anyone messed with QtCharts (or some third-party integration) enough to know whether it can replicate some portion of that?
fervent vale
rough furnace
<@518839900288712705> <@166635900300820480> <@862941683460210688> I need a sanit...
I forked it and it segfaults at the same spot: https://github.com/pijyoi/pyqtgraph/runs/7975148281?check_suite_focus=true

GitHub
pyqtgraph main development repository. Contribute to pijyoi/pyqtgraph development by creating an account on GitHub.
rough furnace
mortal grotto
`PlotWidget` + `ImageItem` is a glorious combination that allows smooth zooming ...
When I toy'd with QtCharts, it didn't really do mouse interactivity well; it could handle rapid plot updating, but mouse events were a pain.
If you're in C++ land, consider looking at QCustomPlot not sure if their offering is appropriate tho https://www.qcustomplot.com/
QCustomPlot is a Qt C++ widget for plotting. This plotting library focuses on making good looking, publication quality 2D plots, graphs and charts, as well as offering high performance for realtime visualization.
mortal grotto
Nifty, looks like they have something that might work: https://www.qcustomplot.com/documentation/classQCPItemPixmap.html
Thanks for the recommendation
rough furnace
something I've never liked about our test suite...we leave way too many windows open...
copper lily
I finally did it
    f = a
    c = 0
    d = 1
    e = 0
    while(a>c):
        b = d
        d = e + d
        e = d
        d = d -b
        print(d)
        c = c + 1

# 0112358

g = 500
hello(g)
```is it correct code
for fibbonachi
 mystic bison
copper lily
```def hello(a):
f = a
c = 0
d = 1
e = 0
while(a>c):
...
mystic bison
copper lily
```def hello(a):
f = a
c = 0
d = 1
e = 0
while(a>c):
...
@copper lily i think you're in the wrong channel. please try #python-discussion! :)
mortal grotto
rough furnace
something I've never liked about our test suite...we leave way too many windows ...
If you export QT_QPA_PLATFORM=minimal before testing, it doesn't open windows
rough furnace
mortal grotto
If you `export QT_QPA_PLATFORM=minimal` before testing, it doesn't open windows
Huh! TIL!
rough furnace
@fervent vale I think pyqtgraph/pyqtgraph#2226 is a good candidate to merge before the 0.13.0 release. What do you think?
supple leafBOT
 fervent vale
rough furnace
<@862941683460210688> I think pyqtgraph/pyqtgraph#2226 is a good candidate to m...
fervent vale
rough furnace
<@862941683460210688> I think pyqtgraph/pyqtgraph#2226 is a good candidate to m...
OK I have removed the draft status
rough furnace
👀👀👀
 rough furnace
@mortal grotto want to revisit 2121 ? looks like a good candidate PR to merge before 0.13.0
That's the bad regex one for the example app
mortal grotto
My only qualm is the minor nitpick about the white border, but I think that's acceptable for the time being. I'll play around with the PR a bit more and then it might be good to go
rough furnace
I'll try and take a look and see if I can see something about that ...
rough furnace
working on a PR to bump qt requirements to 5.15/6.2+ (instead of 5.12+/6.1+) ... I'm thinking of removing the if-checks for QPainterPath.reserve() calls ... anything else I should do as part of this PR?
rough furnace
@obsidian sapphire any suggestions for how to change the MultiPlotWidget example, which uses MetaArray (that on its own is fine) but unfortunately uses MetaArray.view which was removed as one of the 0.13.0 deprecations.
rough furnace
felt great deleting so many methods from ScatterPlotItem that have been deprecated for some time
rough furnace
@violet hound just saw your post a week ago on one of the help channels, is you're still having issues, please feel free to post here 👍
rough furnace
@copper lily just saw your posts in the help channel, pyqtgraph in interactive prompts can have mixed results depending on which bindings you're using... did I real your question right that you're using pyqtgraph inside of pygame?
fervent vale
I am not altogether sure about deliberately making 0.13.0 not work with 5.12
But if we are taking that path, then we can also assume presence of Format_Grayscale16
Affected files are ImageItem.py and test_ImageItemFormat.py
rough furnace
fervent vale
I am not altogether sure about deliberately making 0.13.0 *not* work with 5.12
you think we should put 5.15 in the README, but leave the hasattr('reserve') stuff there for QPainterPath checks?
my main rub w/ it at this point is I can't imagine who the target audience member would be for using new version of pyqtgraph, recent versions of python/numpy but need to stick to an older version of Qt. If we can assume 5.15, the code diff isn't particularly large at this point, but will make it easier to roll out stuff in the future such as a pdf exporter
fervent vale
Yes, new code added to the library should assume 5.15 and not workaround for older versions.
Whether housekeeping of old existing code needs to be done in this PR was another matter. But if you have already started it for QPainterPath.reserve, then the same can be done for the rest too
rough furnace
while i'm personally of the mindset of getting rid of it; I'm certainly not set to it, if there is interest/preference in keeping the older code paths as is for a while longer, we can keep it as such
fervent vale
I have no objection to their removal
copper lily
rough furnace
<@456226577798135808> just saw your posts in the help channel, pyqtgraph in inte...
Nope, I was making a comparison between the unresponsive window and unresponsive windows in pygame/pyglet etc.. when you don't handle the events.
I had to force it to use PyQt5 because it seemed to use PySide6 behind the scenes for some reason. But now I cannot reproduce the issue so I assume it now uses PyQt5 by default
rough furnace
copper lily
Nope, I was making a comparison between the unresponsive window and unresponsive...
hmm... you have two Qt bindings in your environment? I think by default it would use PyQt5 if it sees that first; it can be a problem if PyQt5 is < 5.12 tho. You can force pyqtgraph to use specific bindings by setting (the undocumented) environment variable PYQTGRAPH_QT_LIB to the bindings you want to use: https://github.com/pyqtgraph/pyqtgraph/blob/master/pyqtgraph/Qt/__init__.py#L23
 runic umbraBOT
pyqtgraph/Qt/__init__.py line 23
QT_LIB = os.getenv('PYQTGRAPH_QT_LIB')```generally we recommend sticking to one Qt binding in your environment; this can be trickier with some conda environments that use the defaults channel as that often installs Qt 5.9 for many packages (which we no longer support)
rough furnace
@fervent vale on further reflection, I think I'm going to keep the Qt < 5.15 code in the code-base through the 0.13.0 release, and promptly remove it after the release. This should make it easier for folks that manually patch pyqtgraph for one last version.
mortal grotto
When I pip install pyqtgraph, Qt/__init__.pyi doesn't seem to be copied. Is this an artifact from setup.py not copying pyi files? Or should I be doing something else?
rough furnace
mortal grotto
When I `pip install pyqtgraph`, `Qt/__init__.pyi` doesn't seem to be copied. Is ...
I don't think setup.py packages stubs by default
https://mypy.readthedocs.io/en/latest/installed_packages.html#creating-pep-561-compatible-packages
looks like we need to modify setup.py
mortal grotto
Is there a significant need for backwards compatibility, or would now be a good time to implement a pyproject.toml file?
All the cool kids are doing it these days
rough furnace
was thinking of migrating to pyproject.toml after 0.13.0 release
now that setuptools supports editable installs w/o setup.py figure we're at a good point to ditch it
fervent vale
Last I tried, pyqtgraph does run on Anaconda's PyQt5 5.9. The thing stopping it outright is the 5.12 version check
Any reason we want to prevent people from doing that?
rough furnace
It's not so much that I want to prevent them, but there is a border between what we support and what we don't that I'd like to adhere to a bit more. Right now, we don't support Qt < 5.12; we don't test for it, we don't check docs on new code to make sure it works with it, and if someone opens an issue with Qt 5.9, we certainly most likely won't attempt to fix it. That said, I'm good with changing the raised exception on the Qt version check to a warning (probably should do that as part of that PR I'm crafting).
For a long time, pyqtgraph (before my involvement w/ the project) attempted to support ancient versions of dependencies. numpy versions going effectively all the way back; code was written to by python 2.6 compatible for quite a while after 2.7 was standard... (conversely, code was py2.7 compliant long after python 3 was a standard) adopting NEP-29 has really simplified things for us, and provided us with a good timetable for when we can feel comfortable rolling out new features and so on, but as we all know, NEP-29 doesn't say anything about what versions of Qt to support.
I was of the opinion that we should support Qt versions that users can get either via conda or pip, now that conda-forge ships Qt 5.15 packages, I feel ok about making that the minimum version we require. I'm open to expanding the supported Qt versions to Linux packages of Qt that are available via native package managers as I'm sure some folks use PyQt/PySide in that fashion.
If we want to preserve Qt 5.12+ support (or even attempt to roll out support for Qt 5.9+), I'm open to that discussion; I hate making these kinds of decisions for the pyqtgraph project single-handedly. I just want to minimize "works with, but we don't support" areas which I think can cause confusion, and sends the wrong message to our userbase.
rough furnace
fervent vale
Any reason we want to prevent people from doing that?
wait, doesn't the Qt full enum namespace bit not work on Qt 5.9?
fervent vale
rough furnace
wait, doesn't the Qt full enum namespace bit not work on Qt 5.9?
I don't know when the full enum thing officially landed, but somehow it does work with Anaconda's PyQt5 5.9
rough furnace
fervent vale
I don't know when the full enum thing officially landed, but somehow it does wor...
oh, that's interesting... had it in my head it didn't ...perhaps should revisit 5.9 support as it would mean we can run on qt via defaults channel
fervent vale
Qt version compatibility
fervent vale
rough furnace
oh, that's interesting... had it in my head it didn't ...perhaps should revisit ...
I think it has more to do with the sip version than with the PyQt5 version. According to riverbank website, scoped enums were added in sip 4.19.9 (new in 5.11). My Anaconda 2021 comes with PyQt5 5.9.2 and sip 4.19.13
rough furnace
fervent vale
I think it has more to do with the sip version than with the PyQt5 version. Acco...
I suppose I should bring this to the attention of the QtPy devs, they may want to roll out full enum namespace support...
rough furnace
anyone here use Xarray package much? keep thinking it would be a good candidate for supporting tighter integration w/ pyqtgraph https://twitter.com/TEGNicholasCode/status/1564677238716506114

Xarray now understands physical units, thanks to integration with the pint package!🍺
Likes
124
Twitter
·
rough furnace
funny, the GraphicsScene example doesn't actually use GraphicsScene 😆
oh, we called a class method on it that was deprecated...on my branch it doesn't look like it's being used...
rough furnace
hey everyone, achievement unlocked! lgtm rates our code-quality A+!
 rough furnace
I think we're close to 0.13.0 release, PRs I think that should make it into the release are 2383, 2319, 2252, 2157, 2151, (maybe 2084), 1805 (I'll have to take over that PR and overhaul it a bit), (1631 - I'll likely have to modify that one too).
I think some PRs can be closed w/o merging too...
maybe 1828 too...
fervent vale
One issue with merging many PRs right before a release is that the modifications that the PRs make have undergone less testing in the wild. And users already don't normally use unreleased versions of pyqtgraph.
rough furnace
you know what they say, it's not really a release if there isn't a regression 😉
I hear you, and I have similar concerns, but I really hate how long we've waited for some PR authors to get their changes into a release
rough furnace
in loosely related news, redoing the CSVExporter to use the csv module instead of ..string concatenation... makes it look so much nicer
fervent vale
There's a discrepancy in the Qt/__init__.py related to the changes to module_whitelist. QFileSystemModel exists only in QtGui for PyQt6. In all other bindings, including PySide6, it exists in QtWidgets
#1915 used PyQt5 vs PyQt6 to determine which classes had moved to QtGui namespace.
rough furnace
hmm... some of those that I removed I ran into errors which admittedly I was confused with at the time...
fervent vale
In C++, QFileSystemModel has moved to QtGui for Qt6
So it's PySide6 that would be in "error" by leaving it in QtWidgets
rough furnace
lost track of time, I have to hit the hay, but I should probably fix that 😬 hopefully I'll get some time to look into it this weekend
fervent vale
There's a line in PySide6 typesystem_widgets_common.xml that says "<!-- FIXME PYSIDE7: Move to QtGui -->" with regards to QFileSystemModel. So it would seem that PySide6 does consider it to be a bug on their side
rough furnace
yeah I'll shim PySide6 so QFileSystemModel is in QtGui...
rough furnace
GitHub - irahorecka/visuaudio: GUI application to visualize audio spectrum
https://github.com/irahorecka/visuaudio
Stumbled across this project

GitHub
GUI application to visualize audio spectrum. Contribute to irahorecka/visuaudio development by creating an account on GitHub.
Unfortunately uses pyqtgraph 0.10.0 😂
supple leafBOT
 storm canyon
Hey I have a problem with pip where whenever I try to install a package I get an error
for example

note says that this is likely not a problem with pip but this error occurs with every package
storm canyon
 versed obsidian
its a problem with lxml
versed obsidian
its a problem with lxml
how do I fix it?
rough furnace
storm canyon
Hey I have a problem with pip where whenever I try to install a package I get an...
Not the right channel for this, we discuss pyqtgraph specific issues here. Check out #❓|how-to-get-help
rough furnace
Anyone here ever work with web assembly?
Qt WebAssembly Q&A, Part 1
https://www.qt.io/blog/qt-webassembly-qa-part-1
Apparently we can do qwidget applications in web assembly, wondering if this would give us a better way of rending pyqtgraph stuff on the web (without needing jupyter)

Want to find out more about WebAssembly? Our Senior Product Manager answers 11 questions sent to us by our dev community.
mortal grotto
To my knowledge it works with C++ apps, but not python
rough furnace
https://bugreports.qt.io/browse/PYSIDE-962
Looks like coming in Qt 6.5?
rough furnace
anyone here use mermaid-js for diagram drawing? I'm considering it as an alternative to yEd in pyqtgraph/pyqtgraph#1631
we got a diagram layout we're happy w/, the diagram does render from code (but the code while technically text, isn't easy to edit, and yEd does not allow for automated use of their software so not the great thing for a CI build task)
supple leafBOT
 lapis tide
Hey I came across two projects using Pyqtgraph!
PMT tool from NXP semi:
https://github.com/NXPmicro/pmt
Hifiscan got an article on HaD:
https://hackaday.com/2022/09/12/equalize-your-listening-with-hifiscan/
GitHub
Power Measurement Tool. Contribute to NXPmicro/pmt development by creating an account on GitHub.
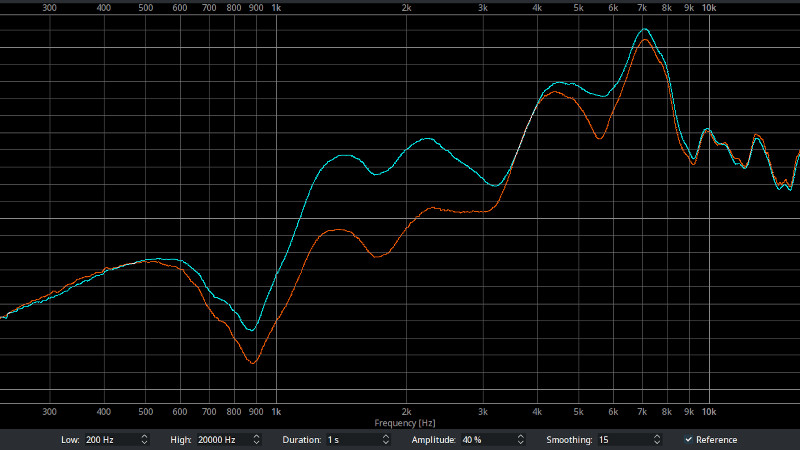
Audiophiles will go to such extents to optimize the quality of their audio chain that they sometimes defy parody. But even though the law of diminishing returns eventually becomes a factor there is…
rough furnace
@fervent vale got ahold of Cristian (pyside dev) ...going to try and steer some more attention towards PYSIDE-1991 ... I'm a little annoyed that I was asked to submit bug reports, and after 6 weeks it's not evaluated...
rough furnace
lapis tide
Hey I came across two projects using Pyqtgraph!
PMT tool from NXP semi:
https:/...
thanks for sharing those links! always great to see where our library is being used
fervent vale
Although pyqtgraph could change the inheritance order to make PyPySide work, and that's what 2271 does; having the mixin being inherited on the lhs is quite a common (and even recommended) pattern.
There's not much point for pyqtgraph to workaround PYSIDE-1991 as other Qt projects do also use mixin inheritance on the lhs. And besides, it does work on regular CPython PySide
rough furnace
yeah, it's a bug report, they would certainly be in their right to say #wontfix but they should have the opportunity to respond and address the issue. I also need to post a bug report of the other issue w/ the object demotion...
fervent vale
Matplotlib even recently changed their mixin inheritance to the lhs https://github.com/matplotlib/matplotlib/commit/bac9962874128fc719465caf6734d9fd4e146e10

GitHub
Instead of having e.g. FigureCanvasQT inherit from QWidget and then
FigureCanvasBase, which requires workarounds to handle the fact that
PySide.QWidget does not participate in cooperative multiple ...
rough furnace
i do think parts of 2271 should me merged into the repo regardless of pypy support, thinking of that conflict between parentChanged method and signal name...
but that's a whole other topic; if I have some time, I'd like to profile 2271 vs. master a bit more, the plotspeedtest on pypy is running at ~60% the frame rate that the standard distribution is running at
fervent vale
There's only one user of parentChanged() within pyqtgraph
rough furnace
all the more reason to change it, it shouldn't be disruptive 😛
fervent vale
but I don't see a good way to deprecate it w/o a outright change
rough furnace
i'll have to look at it again; but if memory serves, it really wasn't a method that end-users should be calling
rough furnace
I always thought QSignalMapper would be something useful in Parameter Trees, I still think it will be useful, but there was some API changes between Qt5 and Qt6 (Qt5 5.15 has the Qt6 API bits in it); so ... yeah we couldn't have used it until recently 😬
rough furnace
while toying around, I setup a signal to be emitted when PlotCurveItem.paint finishes, and counted the number of time that signal was emitted in PlotSpeedTest.py between subsequent update calls; sure enough, with QApplicaiton.processEvents() seems to make it so that paint runs just once per update (yay, was always something I was curious about)
looking at the profile code, looks like boundingRect is called 4x the number of times update is called, and dataBounds is called 2x ...
rough furnace
ok, looks like 3 of the 4 calls to boundingRect are successful cache hits... going to take a closer look at dataBounds now...
fervent vale
The parentChanged() thing can be deprecated for all bindings except PySide6 >= 6.2.2 because on the latter, the signal instance will be found over the method. I.e. there's no way to detect that the user is using a deprecated method name
I understood that PyPy has a big penalty to calling compiled extensions. Given that we derive our speed from calling into compiled code, is it really expected for PyPy to be faster?
rough furnace
fervent vale
I understood that PyPy has a big penalty to calling compiled extensions. Given t...
I have no knowledge of this area at all, I was not aware of this penalty with pypy at all.
The methods that seem to run longer is not something across the board (not sure how much I trust the profiler tho)
rough furnace
I had assumed the pypy implementation would be faster; but as I said above, I'm not coming from a place of knowledge or experience. If it's not any faster, I'm not sure why it would be worth the effort 😬
fervent vale
Hmm, by using more Python internals, it seems to be possible to detect that the user is using the a deprecated parentChanged()
mortal grotto
Is there an equivalent to the deprecated QtWidgets.QApplication.desktop() in Qt6? Basically, a way of finding the root window of the application. There is no QtGui.QDesktopWidget in Qt6
fervent vale
What is a root window? Top level widget? What if there is more than one top level widget?
There was one use of "desktop()" in pyqtgraph/util/get_resolution.py prior to adding support for Qt6
mortal grotto
I was thinking of the root window referenced in the deprecation docs: https://doc.qt.io/qt-5/qapplication-obsolete.html#desktop
But any top-level widget would do. Currently I can get what I need with a while loop across widget parents. If desktop() is deprecated without a replacement it's probably for good reason; I was more wondering if I was missing the recommended alternative
fervent vale
So QApplication::topLevelWidgets() would serve your purpose?
rough furnace
QApplication.topLevelWidgets() is how I would do it
 turbid plume
Guys i need help urgent, in pyqt5 anyone can help me?
rough furnace
turbid plume
Guys i need help urgent, in pyqt5 anyone can help me?
this channel is for pyqtgraph specific topics, there are a number of people who can help w/ Qt/PyQt issues in the #user-interfaces channel (also that channel is monitored much more than this channel is 🙂 )
turbid plume
but no one answered me there, so i wanted to try here
mortal grotto
fervent vale
So QApplication::topLevelWidgets() would serve your purpose?
Indeed, much appreciated. I am surprised none of these terms come up when googling "top level qt widget" and variants
rough furnace
mortal grotto
Indeed, much appreciated. I am surprised none of these terms come up when googli...
Reddit is currently the most popular search engine. The only people who don’t know that are the team at Reddit, who can’t be bothered to build a decent search interface. So instead we resort to using Google, and appending the word “reddit” to the end of our queries.
(headline is a little click-bait-ey, but the contents are spot on IMO)
 sour aurora
rough furnace
(headline is a little click-bait-ey, but the contents are spot on IMO)
sour aurora
rough furnace
(headline is a little click-bait-ey, but the contents are spot on IMO)
This was so accurate, my attention went up by 10 minutes 🤣
rough furnace
blerg, been fighting fatigue, as soon as I identify some PRs I want to review/comment/modify to merge, but after I get the kids to bed, I'm ready to go to sleep myself...
rough furnace
we hit 3k stars 🎊 (actually we hit 2,951, but who am I to argue)
 rough furnace
just tested the PyQt 6.4rc0 wheel with pyqtgraph and everything worked 🎊
rough furnace
hmm....there appears to be a performance penalty in PlotSpeedTest and VideoSpeedTest.py
rough furnace
if someone wants to take a look, you can install the rc bindings; you can install via pip install --index-url https://www.riverbankcomputing.com/pypi/simple/ --pre --upgrade PyQt6
 fresh python
 fresh python
fresh python
fresh python
Output showing
Zero count every time
????
rough furnace
fresh python
Output showing
Zero count every time
????
That doesn’t look like a PyQtGraph specific issue, that a look at #❓|how-to-get-help
 young jacinth
rough furnace
young jacinth
rough furnace
https://pyqtgraph.readthedocs.io/en/latest/uml_overview.html it's finally in!
rough furnace
I just updated pyqtgraph/pyqtgraph#2157 (Qt library load order) so there are no merge conflicts; I think that's the last PR before 0.13.0 release (unless anyone here thinks something else should get merged first)
@fervent vale if you have some time, since you reviewed the earlier version of it, I would appreciate you giving it a look over 👍
supple leafBOT
rough furnace
every time I do one of these changelogs; I keep reminding myself that we probably want to make more intermittent releases 😆
fervent vale
rough furnace
I just updated pyqtgraph/pyqtgraph#2157 (Qt library load order) so there are no ...
I don't have access to a computer for the week. The font weight of 75 line seems to have been re-added to the ui file. This is wrong because font weights have different scales in Qt5 vs Qt6. Setting to Bold alone is sufficient
rough furnace
enjoy your time away from the computers, and in case you're not around when we do the actual release, thank you so much for your contributions to the project!
rough furnace
we've release 0.13.0, on pypi right now, likely be on conda-forge soon
rough furnace
been toying with trying to get better benchmarking for PlotSpeedTest; I setup a QEventLoop and called exec on it; I have a signal emitted from PlotCurveItem when the paint method is finished, exit out of it; results were wildly different (much slower) than our current implementation.
def update():
    ...
    eventLoop = QtCore.QEventLoop()
    curve.sigPaintFinished.connect(lambda: eventLoop.exit())
    t_start = perf_counter()

    curve.setData(
        data[ptr],
        antialias=antialias,
        connect=connect,
        skipFiniteCheck=skipFiniteCheck
    )
    # app.processEvents(QtCore.QEventLoop.ProcessEventsFlag.AllEvents)
    eventLoop.exec()
    t_end = perf_counter()
    elapsed.append(t_end - t_start)
    ...
@rough furnace quick question do you have tree graphs
rough furnace
torn minnow
<@369662814488363009> quick question do you have tree graphs
we do; https://pyqtgraph.readthedocs.io/en/latest/graphicsItems/graphitem.html
it doesn't get a lot of love, so not a whole lot of options to go with it.
Here is an example: https://github.com/pyqtgraph/pyqtgraph/blob/master/pyqtgraph/examples/GraphItem.py
torn minnow
rough furnace
we do; https://pyqtgraph.readthedocs.io/en/latest/graphicsItems/graphitem.html
...
It something like this right?
 rough furnace
pyqtgraph won't do anything to help w/ node placement, for that we recommend using networkx and feeding the positions to pyqtgraph
yeah, a tree is a type of graph, our graphs are really a mixture of scatter plot with lines connecting nodes...
torn minnow
rough furnace
pyqtgraph won't do anything to help w/ node placement, for that we recommend usi...
what is networkx
rough furnace
networkx is a python library that gives a lot of functionality involving graphs
one of the things it can do is if you define a graph, it has some "solvers" that will suggest x, y coordinates for nodes
torn minnow
!pip networkx
runic umbraBOT

Python package for creating and manipulating graphs and networks
torn minnow
this?
rough furnace
yup
if you don't mind manually specifying x, y coordinates for each node, pyqtgraph will likely work just fine for you
torn minnow
I am try to make a family tree graph you think this would be a good fit?
rough furnace
yeah, that should work
torn minnow
rough furnace
yeah, that should work
is there a way to change the picture the shape is
rough furnace
yeah, but there may not be a high level API to do that, you may need to call the underlying ScatterPlotItem methods to change the shape
torn minnow
rough furnace
yeah, but there may not be a high level API to do that, you may need to call the...
alr just wanted to say thx for all the help
rough furnace
that plot object doesn't get a lot of attention so it's a bit bare bones, functionality is present but you may need to dig for it. If you're wanting to see how to change the shapes of things, check out some of the scatter plot examples in the example app
torn minnow
rough furnace
that plot object doesn't get a lot of attention so it's a bit bare bones, functi...
ok forgot to ask yo show me just a quick example of networkx andpyqtgraph?
rough furnace
https://github.com/networkx/networkx/discussions/4879
I have an example here showing the use in 3D space; similar functionality should work for the 2D variant too

GitHub
Greetings from PyQtGraph land. I'm continuing the discussion started on the mail list regarding evaluating the work/effort involved to have PyQtGraph be supported as a plotting backend for ...
torn minnow
rough furnace
https://github.com/networkx/networkx/discussions/4879
I have an example here s...
thx
rough furnace
@lofty creek 👋
dapper yarrow
rough furnace
GitHub - contourpy/contourpy: Python library for calculating contours in 2D quad...
Sorry for replying to such an old post but I found myself using contourpy with pyqtgraph just a couple of weeks ago, so naturally I think it would be a good idea to make this integration easier.
rough furnace
Thanks for sharing; how well did it work?
dapper yarrow
Pretty well, I'm heading to bed now but I can give you an update tomorrow
 lofty creek
Hi all, I'm the developer of pyqtgraph_extensions (https://github.com/draustin/pyqtgraph_extensions), a modest little set of extensions for pyqtgraph that I've developed over the years. Ogi reached out about incorporating some of these extensions into pyqtgraph. I'd be very happy to contribute. Please feel free to poke around pyqtgraph_extensions and shoot me any questions.
dapper yarrow
This is the relevant part of my code for contours (it may have become transposed as I ripped it out of the project).
My impression is that contourpy is very fast and suitable for integration, but I could not really test the speed of it with my app as there is another rate-limiting step.
# image: 2d numpy array
# levels: levels for contours
xx, yy = np.meshgrid(image.shape[0], image.shape[1])
qcg = contourpy.contour_generator(xx, yy, image)
curves = []
for i, v in enumerate(levels):
    reses = qcg.create_contour(v)
    for res in reses:
        c =  pyqtgraph.PlotDataItem(res[:,1], res[:,0], pen='w')
        c.setParentItem(my_image_view.getImageItem())
There are some screenshots that show contour lines at the github site
https://github.com/trygvrad/colorshifter
unfortunately I made the app largely as a proof-of-concept, and the code is not particularly clean.
rough furnace
thanks for sharing!
rough furnace
lofty creek
Hi all, I'm the developer of pyqtgraph_extensions (https://github.com/draustin/p...
Hi Dane, First off, apologies for not reaching out earlier; I have periodically seen your library on pypi and had been curious but had assumed it was abandoned for some reason...
Of the examples, the one that I think we would like to merge first is the aligned layout.
Regarding the color bar item, in the email you made a good point about being able to use the mouse-wheel, which I think we can replicate that functionality without migrating to an AxisItem, which I'm not convinced is what we want in this case (the linear region adjustments are pretty good).
Funny thing is that the maintainer that created that item is also a physicist 😆
mortal grotto
Another pyqtgraph showcase: https://gitlab.com/ntjess/gemovi
It's a package that trains and visualizes generative models (Several VAEs and a DCGAN)

 mortal grotto
Resistor network, a variation of this: https://www.gmelectronic.com/rr-4x1k-smd-1206-convex-1-yageo

 wide prism
Oh, haven't run into these before. I like how your resistors seem to be mostly 10k 🙂
wide prism
rough furnace
Hi Dane, First off, apologies for not reaching out earlier; I have periodically ...
The current ColorBarItem is a internally a PlotItem, which brings its own AxisItem. This is unlinked from the view (L 118) already.
I guess it might not be so hard to (optionally?) re-enable the mouse interaction on that AxisItem and propagate that to the color map setting like we do with the dragged markers? I haven't looked at that in a while.
Hi Dane 👋
mortal grotto
wide prism
Oh, haven't run into these before. I like how your resistors seem to be mostly 1...
Indeed, or at least the generative-learned majority of them are 10k 🙂
lofty creek
wide prism
The current ColorBarItem is a internally a PlotItem, which brings its own AxisI...
Hi Nils! What you describe for mouse interaction on the AxisItem sounds like the right implementation approach to me. I'd add that in my email to Ogi, I mentioned the mouse interaction in the context of listing the apparent differences between pyqtgraph's and pyqtgraph_extensions' ColorBarItems. I haven't worked much with pyqtgraph's ColorBarItem, but the dragged markers seem great and so additional mouse interaction may not be a high priority feature. I do think there's some benefit in allowing the user the interact with the color bar axis in exactly the same way they interact with the spatial axes though.
@rough furnace glad you like the aligned layout. I sometimes wonder if I was being too pedantic when I made that. I was using pyqtgraph for publication-quality figures (https://web.archive.org/web/20180722134930id_/http://spiral.imperial.ac.uk/bitstream/10044/1/42839/2/benzenes_Faraday_2016.pdf)
rough furnace
@wide prism 👆
for publication stuff, those alignment are definitely necessary, glad to see pyqtgraph met your needs not just for interactivity but for publications as well!
lofty creek
Do you have any thoughts on the best way to structure the aligned plot feature in pyqtgraph? In pyqtgraph extensions, it is a subclass of QObject whose interface strives to be as similar as possible to that of PlotItem, except for initialization. This approach is pretty repetitious - PlotItem has a lot of features! I wonder if there's a way to factor out the 'not-alignment-related code' into a common base class of which a functionally unchanged PlotItem and a new AlignedPlotItem could be subclasses?
rough furnace
there are a few ways to go about it, not sure I feel comfortable recommending one over another at this point
rough furnace
documentation style/restructure overhaul is about to get merged YOLO!
@lofty creek back to your question, I'm of the opinion that GraphicsLayout should have the logic to keep things aligned by calling setWidth on the relevant AxisItems directly... but that's my opinion on it w/o having coded it up yet.
rough furnace
and pydata sphinx theme docs are merged 🎊
fervent vale
There's some logic in PlotDataItem that looks dodgy: if dataset.containsNonfinite is None: set connect=all
That translates to: in 'auto' mode, if we don't know whether the dataset contains non-finites, then join up the gaps due to non-finites
The thread in Google groups "Invalid points not causing line drawing to stop" seems to be entering this branch
rough furnace
fervent vale
The thread in Google groups "Invalid points not causing line drawing to stop" se...
Thought you might have a clue about that
Btw hope you had a good vacation
fervent vale
rough furnace
Thought you might have a clue about that
Btw hope you had a good vacation
oh it wasn't a vacation... just no access to a personal computer with internet access
rough furnace
Oh 😦
Hope your time in internet censorship/isolation wasn’t too bad then!
During our in person sprint Luke started work on supporting generic non-linear transformations.
rough furnace
@mortal grotto if you get some time, would you mind commenting on 2442 and 2443? (author accidentally grouped commits from 2442 into 2443 so may need some cleanup).
I'm likely going to update 2418, I think that the "fps" label is a bit misleading after chat w/ Luke, I want to modify how the timing is done to better reflect both pyqtgraph's performance and the time it takes for Qt to do it's thing with cycling through the event loop... down to 12 non-draft PRs 😬
mortal grotto
Thanks for the bump. I finally remembered that I can turn on GH notifications, which is a bit of a firehose at the moment, but at least I don't miss out on activity now.
rough furnace
I also tagged you in a issue that was recently opened, looks like the color parameter item was returning a hex code without a loading #
mortal grotto
#1314 is technically answerable with the author's caveat of just hiding the top item, but should it remain open as a triangle-showing feature request? Maybe we can close it until someone is willing to submit a PR?
rough furnace
sorry to ping you on that one issue; thought parameter tree might be generating the string representations of colors, not manually specified by the user.
mortal grotto
No worries, currently the saved state is a tuple: 'value': (255, 255, 0, 255)
rough furnace
perfect
rough furnace
mortal grotto
#1314 is technically answerable with the author's caveat of just hiding the top ...
eh, probably should leave it open, if we close the issue we'll forget about it, ... I'll add the enhancement label
wide prism
fervent vale
There's some logic in PlotDataItem that looks dodgy: `if dataset.containsNonfini...
I remember the PlotDataItem logic as going for the high-performance execution path by default and treating unannounced non-finites as user error.
At least at the time, drawing with connect=all was much faster, and the logic is designed to go to the fast code path by default. The 'auto' mode tries to divert to the slower version that inserts gaps, but only once it knows there are non-finite values. For performance reasons, it does not scan the entire dataset. The initial value of containsNonfinite = None is treated as "assume all finite, but it's been too expensive to look so far."
The connections disappearing on zoom is usually the result of triggering the dynamic range limiter. This code requires a check for non-finite values in any case, and if any non-finites are detected, it sets the containsNonfinite flag. Once the check has been forced, the auto-connection mode switches over to the slower mode of inserting gaps.
So I think the current behavior is what was intended at the time... Is there a good way to make it more intuitive without performance impact?
fervent vale
If you play around with the example I posted, setting the data a 2nd time is a requirement for triggering the issue. That's quite surprising behaviour to the user.
rough furnace
I would look into this but I’m absolutely booked for the next 8 days so I will exactly zero help on this sorry!
fervent vale
The current behaviour is that once the finite-ness or non-finite-ness is known, then effectively "connect=finite" is used
"connect=all + skipFiniteCheck=True" is effectively an optimization to avoid another finite-ness check and is equivalent to "connect=finite"
fervent vale
The docs: "In the default ‘auto’ mode, PlotDataItem will normally use ‘all’, but if any nonfinite data points are detected, it will automatically switch to ‘finite’."
The users' interpretation would be that finiteness check is always performed
The developer's interpretation is that "if finiteness check just so happens to be performed..."
🤷♂️
wide prism
Yeah, that shouldn't be like that. At the very least the docs should say that behavior is only expected to make sense for finite data, UNLESS some parameter is set.
wide prism
Hmm. There's a layer of buggy-ness on top of the weird design.
In default operation, the dynamic range limiter will run on each new set of data.
This will call self._datasetMapped.dataRect(), which should set containsNonfinite and toggle from 'auto' to 'all' if all data is nice, and to 'finite' when it is not.
However, from the bug description, it sounds like on the very first run the viewbox may not be set up properly yet?
Then the dynamic range limiter doesn't run, dataRect() doesn't get called, containsNonfinite doesn't get set, connect defaults to 'all' and unwanted lines get drawn.
"For want of a nail..."
runic umbraBOT
pyqtgraph/graphicsItems/PlotDataItem.py line 1029
if self.opts['dynamicRangeLimit'] is not None:```Unfortunately I am not set up for testing this right now, but a possible fix might be (L1029)
if self.opts['dynamicRangeLimit'] is not None:
 data_range = self._datasetMapped.dataRect()
 if view_range is not None:
 [...]
That is, run the dataRect() call even if the viewbox is still messed up.
fervent vale
Alternatively (or in combination), if containsNonfinite is not False (I.e. True or None) set connect='finite'
wide prism
Is that still slow?
fervent vale
PlotCurveItem will perform a finite check, and if it turns out to be all- finite, it uses the 'all' codepath
runic umbraBOT
pyqtgraph/functions.py line 2118
if all_isfinite:```So it's actually arrayToQPath that has this logic
The cost is one finiteness check
That didn't get done in PlotDataItem
wide prism
Okay, and since that would only run if the finite check in PlotDataItem hasn't run, that wouldn't cost extra if the dynamic range limiter had to check anyway (it needs min/max values and gets the information basically for free then)
Your solution sounds good to me.
Then we leave the dataRect() logic as it is and keep it at "if the check happened to be performed"... only with a more sane fallback.
Then the change would be line 881, I believe:
curveArgs['connect'] = 'all' # this is faster, but silently connects the curve across any non-finite values gets changed to 'finite'
Speedfreaks will have to manually switch to connect = 'all'
Do you think you might have the chance to test that change?
fervent vale
Not now
I don't think many people are really affected by this
If you know that your data has non-finites, you should really specify connect=behaviour explicitly
I think the issue back then was the log transform could create non-finite
wide prism
Log mapping seems to force a check now, so that containsNonfinites should be accurate.
I may have a chance to look at the minimal fix on the weekend.
rough furnace
the Ctrl/Cmd + K for docs lookup is amazing
 obsidian sapphire
Hrm. CurveArrow offers a way to add a symbol to a spot on a line (via ArrowItem), but it's scale-invariant. do we have a way to do the same but still respond to zoom/scale operations?
ScatterPlotItem would let me put arbitrary, scaling symbols in places, but it doesn't take rotation as an arg.
LabelItem, maybe, if I could figure out how to make it a symbol
rough furnace
I would think scatter plot but rotate the item and set pxMode to false might do it?
obsidian sapphire
oh! ArrowItem takes pxMode!
rough furnace
Even better!!
fervent vale
wide prism
I may have a chance to look at the minimal fix on the weekend.
I have created #2471
wide prism
That looks good, and the logic seems nicely obvious.
There is a slight change in the logic of "skipFiniteCheck", but I guess that is because in 'finite' mode the selected code-path of ArrayToQPath (?) always performs this check anyway?
fervent vale
I don't think I changed the logic of "skipFiniteCheck"? The code is refactored, but effectively the only change is for the None codepath
it might perhaps be better to be explicit about skipFiniteCheck='False' rather than rely on it being the default for PlotCurveItem
wide prism
Sorry, you are right. I misread.
Yeah, always having a defined state of skipFiniteCheck when in 'auto' mode seems like the path of least confusion.
Maybe change the docstring (L274) to read
"In the default 'auto' connect mode, PlotDataItem will automatically override this setting."
?
rough furnace
you all are trying to bring the PR count up ... I'm trying to clear it out 😆
small PRs with comments and linked issues w/ demonstrated test cases do make it easier to merge quickly 😛
rough furnace
I don’t think this is the right channel for your question. This channel topic is specific to PyQtGraph
 rancid eagle
aight , sorry for the mistake 🙂
rough furnace
if anyone knows anything about css; I'm trying to do the following...
if(env('SPHINX_DISABLE_SIDEBARS' == '1')){
    .bd-content {
      flex-grow: 1;
      max-width: 100%;
  }
}
(clearly not right syntax); I want to set the following .bd-content attributes set if I have a system environment variable SPHINX_DISABLE_SIDEBARS set to 1
tie in to pyqtgraph here is that this is for generating offline documentation docset for pyqtgraph docs 😛
 barren hearth
rough furnace
if anyone knows anything about css; I'm trying to do the following...
```
if(en...
barren hearth
rough furnace
if anyone knows anything about css; I'm trying to do the following...
```
if(en...
You can try doing this with JavaScript
rough furnace
barren hearth
You can try doing this with JavaScript
can i insert javascript into a css file? I only have access to a css file in this case (this is for a sphinx-build call where I can specify a css file, not sure how to insert javascript)
barren hearth
rough furnace
can i insert javascript into a css file? I only have access to a css file in th...
In plain vanilla css, no you can't but you can use CSS preprocessors like SASS which allows us to write condition statements in it. Even if you use SASS you have to pre-process your stylesheets which means that the condition are evaluated at compile time, not at run time.
barren hearth
@rough furnace https://docs.readthedocs.io/en/stable/guides/adding-custom-css.html
You can add JavaScript files
## conf.py

# These folders are copied to the documentation's HTML output
html_static_path = ['_static']

# These paths are either relative to html_static_path
# or fully qualified paths (eg. https://...)
html_css_files = [
    'css/custom.css',
]
html_js_files = [
    'js/custom.js',
]
How to add additional CSS stylesheets or JavaScript files to your Sphinx documentation to override your Sphinx theme or add interactivity with JavaScript.
rough furnace
Thanks for sharing!
copper lily
I need help for my assignment anyone pls
Write a non-recursive program for calculation of a factorial using user defined functions concept
barren hearth
copper lily
I need help for my assignment anyone pls
Write a non-recursive program for cal...
using c?
barren hearth
@copper lily
x=int(input("Enter number:"))
factorial=1
while(x>0):
    factorial=factorial*x
    x=x-1
print("Factorial of the number is: ")
print(factorial)
The if-statement being evaluated at compile time would be ideal... sounds like i should probably still try and do this via javascript tho
barren hearth
rough furnace
The if-statement being evaluated at compile time would be ideal... sounds like i...
yes, that would be better. JS would give you much more control over your project.
rough furnace
Just realized I can have more than one css file, in my sphinx conf.py I can append the second css file containing just the bit I care about here when the environment variable is set
obsidian sapphire
hrm. I want to add multi-select to a parameter tree; basically a ListParameter that can have multiple values selected. my mind goes to all the myriad html implementations (e.g. chips, drop-down-with-checkboxes, dueling lists), but I'm not sure what would work best with our framework/Qt. like, it would be easy to just splat out the values into individual bool parameters, but for my use-case of 36+ values, that's pretty ugly. chips is my personal favorite in the html realm, but I can't find any prior art of someone implementing them in Qt. anyone have any ideas for how I should proceed?
mortal grotto
have you tried checklist?
For 36 items it might look a bit hairy since it doesn't scroll through the child widgets, but at least it's already there and allows multi selections
At least you can collapse the children when not in use
obsidian sapphire
oh, I hadn't! that works alright, yeah. thanks!
huh. .show() and .hide() aren't working on the checklist.
or, well, I visible: False at init, and then I try to .show() it later, but to no effect.
to no effect: it stays invisible.
(words are hard some days)
mortal grotto
Indeed -- able to reproduce here too. Looks like super().optsChanged(param, opts) is missing from checklist.py (https://github.com/pyqtgraph/pyqtgraph/blob/5ed8464a88707fbb09fd9383b604ef7eeff8a232/pyqtgraph/parametertree/parameterTypes/checklist.py#L80)
runic umbraBOT
pyqtgraph/parametertree/parameterTypes/checklist.py line 80
self.updateDefaultBtn()```hey everyone, it's looking so much better!

still have that top header that needs to go away; but I'll worry about that one later!
dark mode:
 rough furnace
on one hand, I really want to wrap up the documentation PR, on the other, given some personal (good) news, I'm feeling a little overwhelmed and the last thing I want to do is tweak CSS to try and make it behave as I think it should 😅
fervent vale
Hmm, there's an issue with PlotSpeedTest.py opengl related command line args
The opengl and experimental checkboxes are supposed to reflect the initial state
I can fix the checkbox state
but I don't know how to fix "allow-opengl-toggle"
this is supposed to be the behavior: on toggle of the useOpenGL checkbox, we are supposed to call the useOpenGL() method of GraphicsView which will do an expensive change of underlying widget
I suppose currently updateOptions() is executed for any change in the set of options under its charge?
I guess useOpenGL needs to be hoisted out?
fervent vale
Okay, I have made #2487. That's my first interaction with the Interactive Parameters.
rough furnace
@mortal grotto if you get a chance would you mind reviewing/merging?
mortal grotto
Just responded to the PR; does it work to make the change in updateOptions provided the correct call to useOpenGL is made?
fervent vale
mortal grotto
Just responded to the PR; does it work to make the change in `updateOptions` pro...
We don't want pw.enableOpenGL() to be called due to other options being changed. The method is not smart enough to do nothing when there's no actual change
fervent vale
With the recent issues regarding connect, I realised that since 0.12.3, the default for PlotDataItem has changed from all to auto which is effectively finite. This differs from PlotCurveItem which defaults to all
mortal grotto
Interesting, once more a Parameter PR causes (seemingly) unrelated CI crashes 😆
rough furnace
pyside6 6.4 was released, matplotlib doesn't agree with it
mortal grotto
One of the failures was for pyqt
rough furnace
ugh...
those unrelated CI crashes drive me up the wall, ... perhaps a good change would be to add that QT_MINIMAL (not actual name, but limit number of windows shown in CI to 1)
huh, interact w/ icon failed ... that console output really isn't helpful 😆
mortal grotto
It shows the interact was successful, but the button icon pixmap didn't match its reference. I don't know enough about QImage stuff to identify where things go wrong, but it might be a lifecycle issue?
rough furnace
I don't know much about that either... would a QApplication.processEvents() call be helpful?
mortal grotto
I'm inclined to say no only because it works on all the other CI tests, and I don't have the right environment to reproduce locally so I can't use it for debugging either :/ I'm tempted to retry other PR CIs to verify whether that same job succeeds
Do you remember how to rerun a job without its cache interfering? I recall that was an issue before
rough furnace
the best way I've found to rerun something w/o caching is to close/open the PR
fervent vale
mortal grotto
It shows the interact was successful, but the button icon pixmap didn't match i...
You are absolutely right that it is a life-cycle issue. I have created #2492 to fix the usage of ndarray_from_qimage
PyQt and PySide expose the underlying memory of QImage in different ways. PyQt returns a VoidPtr that doesn't hold a reference to the QImage at all. I am not sure if PySide does hold a reference, but different versions of PySide behaved in different ways. So the lowest common denominator is to assume that no reference is held to the QImage
rough furnace
came here to check on the motivation behind #2492 only to see it already explained 😆
fervent vale
There's a good-looking example here of using QGraphicsView and networkx https://code.qt.io/cgit/pyside/pyside-setup.git/tree/examples/external/networkx/main.py
rough furnace
Going on vacation for a week folks, going to be off the grid.
 glossy path
fervent vale
There's a good-looking example here of using QGraphicsView and networkx https://...
glossy path
fervent vale
There's a good-looking example here of using QGraphicsView and networkx https://...
good job sir
 solid steeple
        hbox_1 = QHBoxLayout()
        hbox_1.addWidget(self.Custom_Numbers_of_Zones)
        hbox_1.addWidget(self.Custom_Textbox_Numbers_of_Zones)
        hbox_1.addStretch()

        hbox_2 = QHBoxLayout()
        hbox_2.addWidget(self.Custom_Start)
        hbox_2.addWidget(self.Custom_Textbox_Start)
        hbox_2.addStretch()

        hbox_3 = QHBoxLayout()
        hbox_3.addWidget(self.Custom_End)
        hbox_3.addWidget(self.Custom_Textbox_End)
        hbox_3.addStretch()

        vbox_1 = QVBoxLayout()
        vbox_1.addWidget(self.Check_Box_Custom)
        vbox_1.addLayout(hbox_1)
        vbox_1.addLayout(hbox_2)
        vbox_1.addLayout(hbox_3)
        self.setLayout(vbox_1)

# creat the Autofill (optional) field in the GUI
        vbox_2 = QVBoxLayout()
        vbox_2 = addWidget(self.Check_Box_Autofill)
        vbox_2 = addWidget(self.Table_Autofill)
        self.setLayout(vbox_2)

# creat left side of Zone Editor
        vbox_3 = QVBoxLayout()
        vbox_3.addWidget(self.Set_Zones_for)
        vbox_3.addLayout(vbox_1)
        vbox_3.addLayout(vbox_2)

        self.setLayout(vbox_3)
NameError: name 'addWidget' is not defined
i get this error message
 plush fulcrum
Vbox 2 you try to set it equal instead of calling the instance method
 short spire
anybody know any python networkx script to generate s-t flow styple graph (directed acyclic graph) ?
 solar patrol
solid steeple
```# creat the Custom field in The GUI
hbox_1 = QHBoxLayout()
hb...
solar patrol
solid steeple
```# creat the Custom field in The GUI
hbox_1 = QHBoxLayout()
hb...
how did you make your message like that?
rough furnace
@austere badge thanks for your presentation on the quickening; we (pyqtgraph users/devs) are very very interested in the performance, so we're likely going to use the specialist library to see if areas of our library that are performance sensitive but do not use numpy/Qt extensively.
 austere badge
rough furnace
<@762845558435217449> thanks for your presentation on the quickening; we (pyqtgr...
austere badge
rough furnace
<@762845558435217449> thanks for your presentation on the quickening; we (pyqtgr...
Awesome, thanks! Feel free to open issues for any questions or pain points.
rough furnace
is there any guidance on how to write python code that make quickening more effective?
austere badge
In general, we specialize common code patterns and Python idioms. The basic idea behind specialization is stability over time. Doing lots of dynamic things, like monkeypatching attributes, tracing frames, or using many different types in one location will all hurt specialization potential.
But in general, "good" code specializes well. The more dynamic stuff and magic, the less stuff we can cache.
 chilly berry
I have a function that exports a file, a dialog box shows the progress, there is only one progress bar component in the dialog box, why does the main window become busy and unclickable, the progress of the progress bar is always updated, I use a thread to update it separately A dialog box, is this a problem with the windows system?
Works fine for the first few seconds

after few seconds window was unclickable

The mouse pointer turns into an hourglass shape
 rough furnace
I think the term you want to search for is “modal”
rough furnace
@torn coyote I was just looking at the vispy gallery docs, and thinking about your PR and the runtime, and it got me thinking; maybe there is another way we can get around building the images other than on every CI run
like, can we do it based on the hash of the example code/file combined w/ the version of pyqtgraph? so no change in version + no change in example = no need to rerun example
rough furnace
After seeing the QMenu issue, I keep wondering if it would be worth the time to try and write up a static code checker to check for these weird binding difference oddities (like how codeql does with more generic python stuff)
rough furnace
if anyone wants to LOL, you should look at the rst source I used to generate this page: https://pyqtgraph--2475.org.readthedocs.build/en/2475/api_reference/uml_overview.html
specifically in the context to the SVGs switching between light/dark themes
going to tag @wide prism for giving me the idea that ended up working for handling light/dark theme switching
rough furnace
unless someone has an issue with pyqtgraph/pyqtgraph#2475 (docs touchups) I'm going to merge in a few hours
supple leafBOT
rough furnace
@mortal grotto just want to say, I feel for you have to slap a deprecation warning on something that was just released a few weeks ago 😆
rough furnace
I'm considering removing the "Qt Bindings Text Matrix" section on the README. Anyone have opinions on keeping/nuking it?
mortal grotto
rough furnace
<@848741630936743956> just want to say, I feel for you have to slap a deprecatio...
Lol
 rough furnace
well, at least you have give a short deprecation period due to the very unlikely duration of which that code was in the library
rough furnace
was just testing pyqtgraph with pyside6 6.4.0.1 and python 3.11; got a few new deprecation warnings:
================================================ warnings summary ================================================
tests/graphicsItems/test_InfiniteLine.py::test_mouseInteraction
tests/graphicsItems/test_ROI.py::test_mouseClickEvent
tests/graphicsItems/test_ROI.py::test_mouseDragEventSnap
tests/graphicsItems/test_ROI.py::test_PolyLineROI
  /Users/ogi/Developer/pyqtgraph/tests/ui_testing.py:56: DeprecationWarning: Function: 'QMouseEvent.QMouseEvent(QEvent.Type type, const QPointF & localPos, Qt.MouseButton button, QFlags<Qt.MouseButton> buttons, QFlags<Qt.KeyboardModifier> modifiers, const QPointingDevice * device)' is marked as deprecated, please check the documentation for more information.
    event = QtGui.QMouseEvent(QtCore.QEvent.Type.MouseMove, pos, QtCore.Qt.MouseButton.NoButton, buttons, modifier)

-- Docs: https://docs.pytest.org/en/stable/how-to/capture-warnings.html
sure enough, marked as deprecated in Qt 6.4
looks like we need to add another argument; Qt::MouseButtons buttons, to the call, I'll try and have a go at it if I don't get too tired tonight
:fliptable:
================== 270 passed, 8 skipped, 4 warnings in 7.79s ==================
/home/runner/work/_temp/270b1706-6860-411c-a2ef-8f4bce04fd44.sh: line 2: 3022 Segmentation fault (core dumped) pytest tests -v```linux users here, can anyone replicate the segfault on python pyside6 6.4 + linux?
fervent vale
I created a CI pipeline for linux py310+pyside63 and py310+pyside64. I ran it on master and also your PR (rebased onto master). All passed with no segfault.
fervent vale
Hmm, I recreated the above CI pipelines and now they segfault
fervent vale
Hmm I recreated the above CI pipelines
copper lily
 sonic nebula
Hello, Can I use vpython and tkinter libraries together? Is there anyone who can help
rough furnace
sonic nebula
Hello, Can I use vpython and tkinter libraries together? Is there anyone who can...
no clue, not the right channel for this question, this channel is for pyqtgraph specific questions 👍
 worldly moat
Hey guys, I have a PyQt graph question I opened a help channel help-falafel if someone can pass by for a quick discussion please 🙂
rough furnace
worldly moat
Hey guys, I have a PyQt graph question I opened a help channel `help-falafel` if...
I replied there, I think in your use case instead of calling .plot(x, y) you need to call .setData(x, y) to update the existing plot
rough furnace
hmm.... hit source button in dash, and got this output which is bogus, just when I thought I had the docs stuff finished/sorted out

at least the web variant looks fine:
 rough furnace
got to the bottom of it, dash needed me to specify display: block for an entry in the css file ...that was applied by a "user-agent" in a regular browser (what is a user-agent?)
 mossy seal
I would like to have something like this but with open GL widgets that display meshes or scatter plots. does anyone have an idea on how to achieve that? Obviously I can't add a GLScatterPlotItem to a QOpenGLWidget from pyqt

 tiny wind
can someone help me with graph #help-pancakes
rough furnace
tiny wind
can someone help me with graph <#696433231222013952>
sorry, just saw this, channel likely already has changed tasks, what was your question?
rough furnace
mossy seal
I would like to have something like this but with open GL widgets that display m...
I generally don't do much w/ the 3d side of the chart, but what's to prevent you from inserting multiple GLViewWidget's into a pg.GraphicsLayoutWidget?
EDIT: things get a little more complicated when you have multiple windows with openGL widgets; there is a special flag you have to set although I can't remember what it was off the top of my head.
 cold walrus
hey i had a problem........i am plotting a graph using matplotlib and when i specify the xticks, it shows error and says that it cannot be converted...
['CSK', 'DC', 'GT', 'KKR', 'LSG', 'MI', 'KXIP', 'RR', 'RPS', 'RCB', 'SRH']
here are the values i want to put
rough furnace
pyqtgraph isn't matplotlib 🙂 that's another library, so this channel probably isn't the best place for help in that regard; sorry!
mortal grotto
cold walrus
hey i had a problem........i am plotting a graph using matplotlib and when i spe...
You might be looking for set_xticklabls instead of xticks https://matplotlib.org/stable/api/_as_gen/matplotlib.axes.Axes.set_xticklabels.html
But yeah, feel free to open a help channel for non-pyqtgraph questions
rough furnace
anyone here have anything against merging pyqtgraph/pyqtgraph#2516 ? It looks good to me, there are type annotations, which appear fine, but we have no mechanism to check for correctness; feel like adding that mechanism would be a major ask of this author
supple leafBOT
fervent vale
rough furnace
anyone here have anything against merging pyqtgraph/pyqtgraph#2516 ? It looks go...
At least make the tests skip if pyopengl is not installed
rough furnace
fervent vale
At least make the tests skip if pyopengl is not installed
Oh, good call!
fervent vale
There seems to be a link between exporters/test_image.py and the test_ErrorBarItem.py failure. The former instantiates a top level window and leaves it there.
rough furnace
hmm... I think @mortal grotto had a suggestion w/ setting an environment variable forcing only one window to remain up at a time; #pyqtgraph message
fervent vale
also includes exporters/test_matplotlib.py if you have matplotlib installed
rough furnace
think we need to add a tear-down step in the exporter code to make sure windows close out?
fervent vale
Could someone else verify the following. First get test_errorbaritem.py to fail reliably by only doing one processEvents. Then run the tests and exclude test_image.py, specifically the filedialog test. And check whether it now passes
I could get it failing reliably with "pytest tests/exporters tests/graphicItems". No need to run everything.
rough furnace
give me a sec, i'll give it a go... @fervent vale one day I hope we meet in person and over an adult beverage you can explain to me how you sniff out causes for these long-standing issues...
@fervent vale I may need to remove both the processEvents calls in test_ErrorBarItem; on my machine 1 call to processEvents is generally sufficient
ok, got test_ErrorBarItem to fail on me with 1 call to processEvents; running pytest tests -k "not test_image.py" 3 times in a row has passed so far, will run a dozen more times or so
I've now run it over 10 times, skipping test_image.py and having only 1 call to processEvents() is consistently passing for me
that said, pytest -k "test_ErrorBarItem or test_image" is not yielding any failures
tl;dr on my situation with only a single call to processEvents()
- I have never seen a failure with
pytest -k "not test_image.py" - I only occasionally see an error on test_ErrorBarItem with
pytest tests
The following is the case for both linux (running in a headless VM) and macOS
fervent vale
The next thing I did was to add app.processEvents() after export() gets called in test_image and test_matplotlib. Then ErrorBarItem with a single app.processEvents() seems to pass
rough furnace
fervent vale
The next thing I did was to add app.processEvents() after export() gets called i...
i would submit a PR for that, I'll "rerun" it in CI suite a bunch of times
rough furnace
wonder how many times i should rerun before we call it good
fervent vale
On Ubuntu WSL2, with the following invocation pytest tests/exporters/test_image.py tests/graphicsItems/test_AxisItem.py tests/graphicsItems/test_ErrorBarItem.py, I am still getting the ErrorBarItem failure with or w/o the PR. So it's still not right. All along the error has been more prone to appear on WSL2 (which is a good thing!)
rough furnace
when you run on WSL do you use xvfb or do you actually render the windows on your screen?
fervent vale
It gets rendered using wayland.
rough furnace
We did it!

 half jewel
Haha nice, you're in the big leagues now :)
rough furnace
when this was first announced a few months back, I knew pyqtgraph was close to making that top 1% cutoff, but didn't realize we were that close
fervent vale
On a "real" Ubuntu 20.04 with PyQt{5,6}, running "pytest test_ErrorBarItem.py" by itself already failed. There's a commented out "update" method in ViewBox.py. when I uncommented it, the test passed. It still passed after I removed all the app.processEvents() ! It seems that the prepareForPaint() was important. Not reproducible on the CI, though.
rough furnace
prepareForPaint is such a ...sensitive call https://github.com/pyqtgraph/pyqtgraph/pull/2053
torn minnow
hello but did networkx fully get implmented yet
rough furnace
torn minnow
hello but did networkx fully get implmented yet
@torn minnow I don't understand the question, you can plot networkx graphs in pyqtgraph, pyqtgraph has a graph plot, you just need to map the nodes from the networkX graph to the nodes call in pyqtgraph, same with the edges
torn minnow
rough furnace
<@555944200047296513> I don't understand the question, you can plot networkx gra...
ok cool
 sinful trench
Hello, having trouble with the exportDialog
I can open it from the console, but when I do the exact same commands through a function it open and closes instantly
someone knows what can cause trouble?
rough furnace
how are you opening the exporter within your function?
sinful trench
ex = exportDialog.ExportDialog(self.graphWidget.scene())
and then I ex.show() with one of the plots as an arg
rough furnace
can you change the call from .show() to .exec() ?
rough furnace
was just looking at pyqtgraph's internal code...yeah it's not exec...
is there a change your export dialog is falling out of scope and the garbage collector is scooping it up/
like you may need to create a self.exportDialog = ..... and then self.exportDialog.show()
sinful trench
rough furnace
is there a change your export dialog is falling out of scope and the garbage col...
that's what I had in mind, but I don't know enoughprogramming to even test that kind of things
sinful trench
rough furnace
like you may need to create a `self.exportDialog = .....` and then `self.exportD...
gona try
rough furnace
if inside a class, assign to a class attribute; there is a way you can make it work without doing that, using QEventLoop but that gets a little complicated
sinful trench
it worked with the self!!
rough furnace
👍
sinful trench
thank
btw
since we are here xD
how can I make it not appear with it upper border outside my screen?
rough furnace
of course, FWIW my first introduction to object oriented programming was when I started working with PyQt (this was before I became a developer professionally)
sinful trench
and also, is there a way to limit the option it has? ( program will be used by non tecfh ppl, eliminating certains option will make thigns lcearer for them)
rough furnace
I think we already merged a fix for the thing rendering off the screen sometimes, it will be in the next release
sinful trench
nice
rough furnace
you can have self.exportDialog.move(int int) to move it to a specific place
sinful trench
sinful trench
and also, is there a way to limit the option it has? ( program will be used by n...
about this, I would love to not show the csv and HDF5 options, is there an easy way? or I have to dig onto the code?
rough furnace
regarding filters, ...can you share a screenshot for what you mean (I think I know what you mean but I want to make sure)
sinful trench
these two simply not shown

I guess it's not something easy? Since it falls out of the scope of usefulness of pyqt
rough furnace
yeah this export dialog is a little bit of a helper function, not as customizable as it should be, ... I think you can edit it but you'll likely have to tweak some of the parameters, let me take a closer look
man, this exportDialog object is not at all documented 😆
someone should fix that 😆
sinful trench
rough furnace
yeah this export dialog is a little bit of a helper function, not as customizabl...
"not as customizable as it should be" it's kind of an extremely niche thing what I'm asking tbf xD
rough furnace
not really
sinful trench
:o not?
rough furnace
limiting options in that sort of thing is something that I have thought of before too 😛
sinful trench
it seems kinda far fetched, what other options could ppl want passing through the export function of pyqtgraph?
sinful trench
rough furnace
limiting options in that sort of thing is something that I have thought of befor...
oh really? well I guess it isn't asniche then haha
rough furnace
I mean, pyqtgraph is used in desktop applications, we want to make interfaces that are intuitive and minimize confusion
removing options that you don't want to use yourself (or don't want your users to use) is perfectly reasonable
sinful trench
so, limiting options for non tech ppl xD I should hadguessed I'm not the only one
oh, and, default values for the export options? is that possible?
rough furnace
yeah it is ...just looking through the source on how to do it (as it's not documented) give me a min...
sinful trench
not that I'm an expert myself, but I agree with the mentality of making thing as simple as possible for the user
rough furnace
I don't pyqtgraph up so you're going to be my tester here, fair warning, this code is me shooting from the hip
sinful trench
rough furnace
yeah it is ...just looking through the source on how to do it (as it's not docum...
oh nice
btw could I see the source? I never know where to look for it
rough furnace
which exporter(s) do you want?
sinful trench
it would be
well, if you canjust leave the image one it would be ok
Image File(Png and tec..) one
rough furnace
at the top of your file somewhere...
from pg.exporters.ImageExporter import *

def listExporters():
    return [ImageExporter]
pg.exporters.listExporters = listExporters
try that?
oh wait wait try that
 rough furnace
🎊
sinful trench
quite nice
rough furnace
there may be a better way to do this.... this is what came to me just now
rough furnace
this should be easier, you shouldn't have to monkey-patch pyqtgraph to get the ideal behavior ...
rough furnace
some of my first work in PyQt https://github.com/j9ac9k/dual-axis-post-processor
GitHub
Post Processing Script to crunch through data collected from a dual-axis scanning station. - GitHub - j9ac9k/dual-axis-post-processor: Post Processing Script to crunch through data collected from a...
need to archive this ASAP 😆
sinful trench
Yeah, not as humbling as you think 😅
rough furnace
this is after I worked on this for a while and posted it to github.....wasn't created in a day 😛
sinful trench
heh I guess, but it's miles ahead of what a noob like me can do haha
rough furnace
which reminds me; probably a good time to prune my older repos
sinful trench
was about to ask if anybody look at those, and then I rememmbered is the first thing I do when I open someone's else repo xD
btw, where can I look onto pyqt and pyqtgraph source code?
rough furnace
pyqtgraph source is here: https://github.com/pyqtgraph/pyqtgraph
pyqt source code is a bit trickier ...and far more complex due to the integration to the C++ library; probably better off sticking to the Qt docs
sinful trench
is it "legal" to put the exported dialog onto, for example, a tab on another window? or is it an abomination?
I update my question: how to update the exporter if I change the plots on my graphic widget?
delete and re instance?
rough furnace
yeah, self.exportDialog = ....
the exportDialog is a QWidget, so you can put it anywhere a QWidget can go (tabs are fine etc etc)
in terms of if it's an abomination, that's up to you, of course just because you can do something doesn't mean you should; but that's up for you to decide 🙂
I think you can call self.exportDialog.updateItemList() too
sinful trench
rough furnace
I think you can call `self.exportDialog.updateItemList()` too
ah that's a good one, ty
rough furnace
our apologies about this class not being well documented, we would totally accept a PR adding docstrings and documentation for the ExportDialog
sinful trench
no need, it's a lot of work, still an amazing library
rough furnace
thank you! definitely a need for the documentation but don't feel obligated to roll out that fix yourself
sinful trench
rough furnace
thank you! definitely a need for the documentation but don't feel obligated to r...
I would if I had any idea about where to begin 😄
sinful trench
Where can I raise a bug in pyqtgraph so developers know about it?
fervent vale

GitHub
Fast data visualization and GUI tools for scientific / engineering applications - Issues · pyqtgraph/pyqtgraph
 drifting vigil
is this Graph as in the data structure?
rough furnace
drifting vigil
is this Graph as in the data structure?
graph like a plot; although we have basic graph data structure plotting capability
drifting vigil
rough furnace
graph like a plot; although we have basic graph data structure plotting capabili...
oh ok. im exploring the discord server, and i saw this channel, got me curious. im currently using networkx for school.
 ornate pewter
half jewel
ornate pewter
https://www.youtube.com/watch?v=XKHEtdqhLK8
ornate pewter
half jewel
ornate pewter
https://www.youtube.com/watch?v=XKHEtdqhLK8
Not sure how this is on-topic here ...
ornate pewter
half jewel
Not sure how this is on-topic here ...
ehh
I just want to see how yall would rate it
half jewel
This channel for meant for discussion about the pyqtgraph open source software project, there are better channels to ask like #python-discussion or off topic
rough furnace
@torn coyote saw this, wondering if it would be helpful for the screenshot tool https://twitter.com/readthedocs/status/1592459219827011586

We just published "Override the build process completely" post ✍️ announcing our new beta feature 🤩 that allows you... Well, exactly that 😅, override the default Read the Docs commands and customize the build process as much as you need. Read it at https://t.co/MsTRum1qtr
 Twitter
·
Twitter
·
 lyric moss
I would like to append dataframe to CSV file present in Aws S3, using AWS lambda, can anyone help me regarding this. #python
sinful trench
Is there a built in function to move a linear region? or is the setRegion the way?
sinful trench
for the record I'm trying to integrate the moving of the linear region with the arrow keys
mortal grotto
@lyric moss this channel is for pyqtgraph-specific questions, you might want to open a help channel instead
@sinful trench yep, you can use setRegion for that purpose
You should be able to accomplish it with something like
import pyqtgraph as pg
from pyqtgraph.Qt import QtCore

app = pg.mkQApp()

region = pg.LinearRegionItem([0, 100])

class MyPlot(pg.PlotWidget):
    def keyPressEvent(self, ev):
        edges  = region.getRegion()
        increment = 0
        if ev.key() == QtCore.Qt.Key.Key_Right:
            increment = 1
        elif ev.key() == QtCore.Qt.Key.Key_Left:
            increment = -1
        if increment:
            region.setRegion([e + increment for e in edges])
        else:
            return super().keyPressEvent(ev)

plot = MyPlot()
plot.addItem(region)
plot.show()
app.exec()
Is there a way to get the next values for each line in an efficient way?
sinful trench
well, I'm currently puting the linear region through a timestamp type array, with irregular step betwen values (graph with x = timestamp array, y = 0)
to get to the next ( or next while jumping n indexes) values I would get the actual region; so the timestamp values of both lines; proces the arrays with these values to get the next timestamp values on the array, and then pass these to the setRegion
that would be outside pyqtgraph "procesing"
is there a way to do it internally and more easily?
mortal grotto
I would recommend having a variable control the current array index, and use the arrow keys to move that index left/right. Then, set your region to whatever values are at array[index], array[index+1]
Or something like that
mortal grotto
@rough furnace question regarding version schemes:
from pkg_resources import parse_version
sorted([parse_version("0.13.1dev0"), parse_version("0.13.1")])
# [<Version('0.13.1.dev0')>, <Version('0.13.1')>]
Python considers dev versions to be earlier than their non-dev counterparts. Have we considered i.e. releasing 0.13.1, then switching to 0.13.2dev0 until the next release?
rough furnace
oh, I thought that's what we were supposed to have done, did I screw that up?
mortal grotto
Current version is 0.13.1dev0 https://github.com/pyqtgraph/pyqtgraph/blob/553287aa4af5d1852df6a90f8b7a9e4f3cbd71b8/pyqtgraph/__init__.py#L6
runic umbraBOT
pyqtgraph/__init__.py line 6
__version__ = '0.13.1.dev0'```Haha, will do 👍 Just wanted to make sure it wasn't intentional
rough furnace
for this kind of stuff, I make every attempt to conform to existing standards
 grand scarab
Hey everyone. I have been working on a cool MIT open-source project.
Would like to share here!
A tool for LIVE test results
By analyzing code coverage, hypertest runs only the tests affected by a code change. Run tests in the background while coding, and get immediate live feedback (<250ms).
Would love feedback 🙂
mortal grotto
Cool project! However, this channel is reserved for pyqtgraph-related topics. You are welcome to post in #python-discussion or somewhere similar, though
grand scarab
Oh! My bad 🙂
sinful trench
mortal grotto
You should be able to accomplish it with something like
```python
import pyqtgra...
I implemented and it works amazingly (also understood why you where incrementing directly the region without going through the array values...)
but small problem: it only works when the last thing I clicked is the plot wit the linear region
how can I do so I can add other regions to that interaction?
mortal grotto
If you have a list of regions, you can loop through them:
for region in regions:
  region.setRegion([...])
Oh, I meant other regions as other widgets, others parts of the window
mortal grotto
Oh, I might recommend overriding keyPressEvent for each region, and emitting sigRegionUpdateRequested or something similar. Then, you just have to connect each signal to a different function that does the region update
rough furnace
yeah subclass and overwrite keyPressEvent if you want to have the linear region item do something on a keyboard press
sinful trench
Ok, thank guys, will do
 crystal ivy
hi @native jungle
 native jungle
hey
fervent vale
I never had a need to use RemoteGraphicsView but occasionally there are people creating issues about it. I took a look at RemoteSpeedTest.py and read in its comments that its premise is that the user does cpu-heavy stuff in the gui-thread and offloads rendering to a remote process. That sounds backwards, why not offload the cpu-heavy stuff elsewhere and do the rendering in the gui-thread?
rough furnace
fervent vale
I never had a need to use RemoteGraphicsView but occasionally there are people c...
I completely agree with this assessment; and have had similar feelings on the matter
I should add, I would support moving to deprecate RemoteGraphicsView; it's really complex, and forces going against what the Qt frameworks wants developers to do.
fervent vale
In fact, the example creates a new PlotDataItem for every update cycle; probably because that's the only way to pass pickable arguments.
fervent vale
I can get CI-ubuntu2204-py39 to segfault with test_busycursor.py alone on pyside60,61,62; yet it passes with test_progressdialog.py alone
rough furnace
Luckily most people probably aren’t using pyside62 any more; and unlikely anyone is using 60 or 61
fervent vale
What I meant was that fixing the QMenu leak uncovers issue(s) present since the beginning of PySide6, which was originally thought to only have begun in 6.3
 left orchid
how to count the number of people in a csv list ?
mortal grotto
Hi @left orchid, this channel is reserved for pyqtgraph-related topics. You are welcome to post your question in a python help thread, though
 sand swallow
Dear pyqt fans,
I have a requirement for a plotting library which can plot some form of an open-street-map with shapes on it. preferably with a marker/label on mouse hover.
Currently I'm trying to use plotly but I am running into some issues.
Is PyQtGraph something to be used for this?
Thanks
-korty
mortal grotto
There aren't any geographical / polar capabilities, but if all you need are the shapes + mouse interaction, pyqtgraph can certainly assist 🙂 You can see some examples in python -m pyqtgraph.examples and select GraphicsItems > Region-of-Interest, GraphicsItems > Scatterplot and check the hover of the bottom left plot, and a few others
sand swallow
mortal grotto
There aren't any geographical / polar capabilities, but if all you need are the ...
Thanks for your reply.
I do need the geographical function in it though. Thank you! 🙂
The search continues 😄
 alpine quail
Hi
I'm trying to highlight the missing areas/parts of the polygon geometry in QGIS using python.
Please help
rough furnace
sand swallow
Thanks for your reply.
I do need the geographical function in it though. Thank ...
You may be able to force the situation using pyproj, I know another user does that, but they did have to subclass and overwrite some methods in AxisItem if I remember right.
We’re working on non-linear transformations
rough furnace
alpine quail
Hi
I'm trying to highlight the missing areas/parts of the polygon geometry in QG...
Not the right channel for help with QGIS 🙂
mortal grotto
I have a NamedImageItem class that inherits ImageItem and also includes a TextItem. I would like to call viewbox.addItem(named_image) and have both objects included in the scene. Is this possible? Or would a better approach be to create a brand new GraphicsWidget that has a layout with both items included?
I'm fairly new to customizing graphics objects so apologies if there is an obvious answer.
Edit: In attempting to mimic LegendItem, I tried putting things into a GraphicsLayoutWidget but that doesn't work for GraphicsObjects like ImageItem. Is there a way to put ImageItem into a layout?
mortal grotto
I have a NamedImageItem class that
sand swallow
rough furnace
You may be able to force the situation using pyproj, I know another user does th...
Thanks for the reply.
I’ll look into that. It sounds a bit above my capabilities to be honest but who knows.
rough furnace
There is a post on the discussions tab on the repo where someone demonstrated how they did it (post was inquiring if there is a better way of doing it, or some way we can have better support for it); but may be a place to start. I think the author is ibrewster
 dreamy flame
What does pyqtgraph mean
rough furnace
dreamy flame
What does pyqtgraph mean
you can try googling, clicking on the URL in the channel description if you want to find out more 🙂
mortal grotto
Question: When an ImageItem with ItemIgnoresTransforms flag is added to a viewbox, autoranging stops working nicely. What's the appropriate way to get autoranging to disregard these items (or only include their position)? Example:
import pyqtgraph as pg
import numpy as np

app = pg.mkQApp()
pw = pg.PlotWidget()
pw.invertY(True)

rect = pg.QtWidgets.QGraphicsRectItem(10, 10, 100, 100)
pw.addItem(rect)
rect.setZValue(100)
rect.setPen(pg.mkPen('r'))

item = pg.ImageItem(np.full((10,10), 255), rect=(0,0,300,300))
item.setPxMode(True)
pw.addItem(item)
# pw.setWindowFlag(pg.QtCore.Qt.WindowStaysOnTopHint)

pw.show()
from IPython import get_ipython
if kernel := get_ipython():
    kernel.run_line_magic('gui', 'qt')
I can set the boundingRect of the item to QRectF() which gets scaling working properly, but then there are artifacts when moving the item until the next range update:
mortal grotto
Ah, looking to ArrowItem for inspiration, I discovered the viewbox will also look for dataBounds when auto ranging ✅
dapper yarrow
A friend of mine is using a GLVolumeItem in an application that uses qtmodern to change the default look of qt.
This has the unfortunate side effect that the window itself becomes translucent so that you can see the windows/desktop behind the application.
Have you ever seen anything like this before, or do you have any idea what setting it is caused by?
 rough furnace
that's sort of a funny effect! haven't used qtmodern before, i will say that we've noted substantial performance reductions when there is transparency on the main window
you might be able to do something like...
palette = self.palette()
palette.setColor(QtGui.QPalette.Background, QtCore.Qt.BGMode.OpaqueMode)
where self is any widget in the application
dapper yarrow
Thanks!
rough furnace
I suspect this is the issue: https://github.com/gmarull/qtmodern/blob/master/qtmodern/windows.py#L147-L148
runic umbraBOT
qtmodern/windows.py lines 147 to 148
if QT_VERSION >= (5,):
self.setAttribute(Qt.WA_TranslucentBackground)```so try self.setAttribute(Qt.WA_StyledBackground)
rough furnace
 viral jacinth
but im having trouble
viral jacinth
but im having trouble
Can you share your code and what you’re hoping to get for output?
viral jacinth
rough furnace
Can you share your code and what you’re hoping to get for output?
hi can show you my code


so this is my issue
im trying to turn my data
into a bar chart
like this
 rough furnace
That’s matplotlib, an entirely different library; we won’t be of help here.
fervent vale
Regarding the translucency of GLVolumeItem, that also happens on WSL2 for the pyqtgraph included example.
While trying that out, I found that there's a regression with Qt 6.4.x (i.e. happens with both PyQt6 and PySide6) and WSL2. The opengl examples show only a black window.
rough furnace
fervent vale
While trying that out, I found that there's a regression with Qt 6.4.x (i.e. hap...
oh that's fantastic ...
@fervent vale looking over Qt 6.4 changelog; saw this:
QTBUG-101620 QOpenGLWidget does not update when content changed while
its hidden
QTBUG-104952 QT_WIDGETS_RHI/QOpenGLWidget lost transparency support on
X11
QTBUG-100810 QML ChartView series color can get wrong on RHI if
useOpenGL
maybe one of those is relevant
this changelog mentions use of RHI in QWidgets which I didn't think you could do....
another possible relevant one: Fixed in 6.4.1
QTBUG-107814 Reg:[6.3->6.4]QOpenGLWidget tries to render duplicate
controls
fervent vale
I tested it on a "real" Ubuntu 20.04 and it occurs there too
Once you resize the window, then it works
That's also true for WSL2, which I hadn't thought to try resizing initially
mystic bison
@sacred field please try #1035199133436354600 or #discord-bots. don't post screenshots, and reset your token
fervent vale
This is how GLVolumeItem.py looks like on WSL2. I don't know if it's WSL2-specific or just wayland as I don't have a Linux box running wayland.
 rough furnace
fervent vale
This is how `GLVolumeItem.py` looks like on WSL2. I don't know if it's WSL2-spec...
rough furnace
fervent vale
This is how `GLVolumeItem.py` looks like on WSL2. I don't know if it's WSL2-spec...
Can you try explicitly setting an opaque background, I described how to do that just a bit ago
fervent vale
palette.setColor(QtGui.QPalette.Window, QtCore.Qt.BGMode.OpaqueMode) : setColor doesn't take such a signature
rough furnace
Shouldn’t it be QPalette.Background not QPalette.Window ?
fervent vale
https://doc.qt.io/qt-5/qpalette.html#ColorRole-enum. Background has changed to Window
fervent vale
rough furnace
> `self.setAttribute(Qt.WA_StyledBackground)`
no effect
note that this translucent effect only shows up for GLVolumeItem.py which uses 3D textures.
rough furnace
Do we need to define a texture with 100% alpha?
fervent vale
I think it's needed to get the intended effect
First thing is to see if this occurs on "regular" Wayland
rough furnace
this looks similar enough to the post earlier that I suspect this is a legit issue; wish I could think of another application that uses QOpenGLWidget so we can test with that too
fervent vale
I switched my Ubuntu 20.04 box to wayland and I see some translucent issues with GLVolumeItem.py, though not so immediately obvious. If I drag the window around, I see some stale background bleeding through
It's a fairly niche feature of pyqtgraph though: GLVolumeItem.py being the only thing making use of GL_TEXTURE_3D.
fervent vale
PYOPENGL_PLATFORM=x11 QT_QPA_PLATFORM=xcb python pyqtgraph/examples/GLVolumeItem.py
If x11 is forced on a system where wayland would automatically be selected, then all is well.
rough furnace
Sounds like nothing much we can do then?
fervent vale
It's currently unknown where the fault lies. It only occurs when using the wayland plugin and 3d textures. There's a workaround for this niche pyqtgraph use-case by simply running it on x11. So, I would say that there's nothing that needs to be done.
rough furnace
most of my linux experience isn't on the desktop, but isn't it conceivable that if you're running wayland that you may not even have x11 on your machine?
fervent vale
there's xwayland, x11 server running on top of wayland
it would be a very custom distro to have wayland but not xwayland
rough furnace
that's good to know
@dapper yarrow regarding the transparent background, if your colleague is on linux using wayland, try the above: #pyqtgraph message
dapper yarrow
apparently she already fixed it by
main_window.setAttribute(QtCore.Qt.WA_TranslucentBackground, False)
She is using qtmodern and reading the source code of that she realized that this sets QtCore.Qt.WA_TranslucentBackground to True, which she does not need
but I will let her know anyways 🙂
thank you for looking into it
rough furnace
dapper yarrow
apparently she already fixed it by
```py
main_window.setAttribute(QtCore.Qt.WA_T...
thanks for following up!
@fervent vale if you can still easily reproduce, would you mind checking the above solution? I wouldn't be surprised if this was the same issue.
fervent vale
rough furnace
thanks for following up!
<@862941683460210688> if you can still easily reproduc...
neither setting it to False or True changes anything. i.e. only the portion of the window that has a 3d texture rendered has the background bleed through.
rough furnace
oh well; guess that was a separate issue, the symptoms were so similar!
rough furnace
@fervent vale got a suggestion to add
        if self.antialias:
            glDisable(GL_LINE_SMOOTH)
            glDisable(GL_BLEND)
at the end here: https://github.com/pyqtgraph/pyqtgraph/blob/836dabc7af0b447cfbccad8de26f59749603b62d/pyqtgraph/opengl/items/GLGridItem.py#L65-L88
fervent vale
I don't think that will help. I have a smaller example that contains only a single GLVolumeItem. The bleed through occurs there too
rough furnace
😦


 mortal grotto
Hi @fallen roost, this channel is reserved for pyqtgraph-related topics. You are welcome to post your question in a python help thread, though
 fallen roost
ok thanks
mortal grotto
Is it just me or is the default SignalProxy broken on master?
import pyqtgraph as pg
pg.mkQApp()
edit = pg.QtWidgets.QTextEdit()
sp = pg.SignalProxy(edit.textChanged)

# TypeError: 'module' object is not callable
Oh, all lib uses are threadSafe=False which is why none of the tests fail
mortal grotto
Is there a built-in control to get the GLViewWidget rotating relative to a different plane? Something like this poorly drawn figure:
I.e. I want to use a GUI action (hold down a key/mouse button, etc.) to rotate relative to a different set of axes. I got spooked by the quaternions trying to check out the source code...
 rough furnace
Not as far as I know; math shouldn’t be bad, google givens rotation matrix
fervent vale
mortal grotto
Oh, all lib uses are `threadSafe=False` which is why none of the tests fail
Oops. My bad
rough furnace
fervent vale
Oops. My bad
this might sound bad, but honestly, pijyoi, I love seeing mistakes in your code, makes me remember that even the best of us periodically mess up (also I think I'm the one that merged)... process is working as it's supposed to.
fervent vale
Haha, I bricked a server at work by changing one bios setting a couple of weeks ago. Reminded me to not touch stuff.
rough furnace
ooof... I hosed my IPMI KVM interface by needlessly upgrading the IPMI firmware on my NAS at home a few months ago. Also took that as a note that just because there is an update, doesn't mean I need to apply it 😆
fervent vale
So the texture bleed-through also happens with 2d textures. It happens whenever the texture has a non-opaque alpha. In the GLImageItem example, uncommenting the 3 lines that set the alpha to 128 will also cause the bleed-through effect on wayland.
fervent vale

I'm sure people are sick of me showing FNA games running on Wayland, so here's something different: Portal 2 running on pure Wayland, no X11! Raw Input is enabled to make use of relative pointer support.
We really did screw up on making OpenGL backbuffers transparent, huh
 Twitter
·
Twitter
·
 fervent vale
On platforms where there was no translucency by default (e.g. windows, x11), setting WA_TranslucentBackground to True will result in translucency (i.e. bleed-through)
On wayland, setting WA_TranslucentBackground has no effect. The translucency remains.
rough furnace
Nice find!
 viral juniper
dam
 naive mulch
guys how can i plot such a graph
 rough furnace
Looks like what you want is PlotDataItem with has the ability to make a line and scatter plot on the same plot
 distant pike
Is python still great without numpy?
Why?
 sullen quartz
i am curious to know whats pyqtgraph
mortal grotto
sullen quartz
i am curious to know whats pyqtgraph
A high performance Python plotting library: https://pyqtgraph.org/
Typically used for scientific applications where user interactivity or rapid plot updating is required, pyqtgraph aims to bridge the gap between NumPy and the Qt GraphicsView framework.
An examples and configurable benchmark application is bundled as well.
GitHub Repo: https://github.com/pyqtgraph/pyqtgraph
Documentation: https://pyqtgraph.readthedocs.io/
Contributing Guidelines: https://github.com/pyqtgraph/pyqtgraph/blob/master/CONTRIBUTING.md

GitHub
Fast data visualization and GUI tools for scientific / engineering applications - GitHub - pyqtgraph/pyqtgraph: Fast data visualization and GUI tools for scientific / engineering applications
GitHub
Fast data visualization and GUI tools for scientific / engineering applications - pyqtgraph/CONTRIBUTING.md at master · pyqtgraph/pyqtgraph
fervent vale
With numpy 1.24.0, there are some deprecation warnings for the unsigned dtypes used for test_arrayToQPath. Looking at the code, I am not so sure that the code makes sense. Take dtype uint64 for example, that would result in y-coords being 0, 2**64-1, 2**64-2, 2**64-3, 2**64-4, 2**64-5. Since that exceeds the precision for float64, you would end up with quantized values.
rough furnace
fervent vale
With numpy 1.24.0, there are some deprecation warnings for the unsigned dtypes u...
certainly doesn't sound right; i wonder who wrote that bit of code 😬
ahh, I think myself and @mortal grotto wrote that function; I think I wrote it out or expanded it of frustration of issues that seemed to keep popping up, not surprising that I put in an edge case that doesn't make sense on closer inspection
mortal grotto
I'm pretty impressed. This is GitHub copilot demonstrating it is familiar with pyqtgraph's inheritance system

Lol, who needs fancy UML diagrams if you can just ask copilot?
rough furnace
lol right?
man, would love to know where co-pilot found this source data for this comment, would love to read that repo
runic umbraBOT
:incoming_envelope: :ok_hand: applied mute to @hollow cedar until <t:1671650754:f> (10 minutes) (reason: duplicates rule: sent 4 duplicated messages in 10s).
The <@&831776746206265384> have been alerted for review.
fervent vale
I am thinking that #2554 (floating point boundingRect) should perhaps be reverted
the computation doesn't take into account the pen width
based on PlotCurveItem, I managed to add the pen width into customGraphicsItem.py, but the additional complexity seems not worth it for someone who just wants to whip up a simple custom graphics item.
it would be especially ugly to get it right for BarGraphItem as its API permits passing in a different pen for each bar

Gist
compute boundingRect taking into account pen width - customGraphicsItem.py
fervent vale
rough furnace
i can certainly revert it......and then re-open #2500 I suppose
Please do. It's issue #2550 though
Part of the trickiness is that pixelVectors only works during runtime. So for a simple case where everything is drawn during initialization, it won't work
rough furnace
Don’t get @torn coyote started on pixelVectors
Can we not have _bounds update when ‘show()` is called? (Not on my computer so can’t look up the docs)
rough furnace
Going to be traveling this next week ( @mortal grotto might be in your neck of the woods, going to Naples) no clue how active I’m going to be here.
copper lily
a
fervent vale
rough furnace
Can we not have `_bounds` update when ‘show()` is called? (Not on my computer so...
On a simple plot, the bounding rectangle changes several times before before stabilising. So updating it just once upon show() would not cut it.
rough furnace
fervent vale
On a simple plot, the bounding rectangle changes several times before before sta...
That constant recalculation that shifts the plots a bit always irks me. Feels like with some kind of analysis tool we can figure out what signals may be firing too many times causing a plot to jitter … but that’s an issue for another time
rough furnace
<@&831776746206265384> 👆
rough furnace
@fervent vale thanks for walking through the user of the box plot PR; I'm reading the comments, but due to family obligations I'm not going to be able to review more closely for another few days at least.
fervent vale
There's one line in the QGraphicsItem docs : "QGraphicsItem does not support use of cosmetic pens with a non-zero width."
So basically, pyqtgraph is using QGraphicsItem in an unsupported mode.
rough furnace
We shouldn't have that many places we use non-zero width cosmetic pens, maybe the LegendItem? (still on holiday/vacation, we should probably look at trying to address those use-cases tho)
fervent vale
Actually we use non-zero width cosmetic pens everywhere.
It's the reason why computing boundingRect is not so simple
 steel basalt
I ran the code
 copper lily
steel basalt
I ran the code
copper lily
steel basalt
I ran the code
what code?
copper lily
bruh 💀
steel basalt
i need help
rough furnace
Wrong channel
mortal grotto
Maybe a dumb question -- is there a way for "auto range" to exclude outliers for a scatterplot? Something where clicking the "A" button doesn't include the "x"ed out samples.
It is easy enough to make a function that does it, just curious if there's an implementation in the library somewhere
 rough furnace
I would be shocked if there was this functionality in the library already
Maybe with calling setLimits before using auto range? I think that might be broken right now but there is a PR to fix it if I remember right
fervent vale
You could try this: on the scatterplot, bring up the context menu and select either X or Y Axis. Then in the Auto spinbox, reduce the percentage value. That exercises the frac argument of DataBounds which reduces the percentile range of data to be displayed.
mortal grotto
Perfect, thanks!
rough furnace
@fervent vale going over pyqtgraph/pyqtgraph#2565 now ... sorry it's taken me a while to follow up there...
supple leafBOT
fervent vale
I think pyqtgraph doesn't really intend for users to be using non-cosmetic pens, so it's a bit weird that a lot of code needs to be added to handle this case that might never be used
On the other hand, the computation of boundingRect that adds the pixel padding due to cosmetic pens may be violating Qt rules. There's a rule that says if the value of boundingRect ever changes, prepareGeometryChange must be called
rough furnace
I think pyqtgraph doesn't really intend for users to be using non-cosmetic pens,
combined with Graphics View not supporting non-0 pen widths for cosmetic widths, this is problematic 😬
fervent vale
The existing pyqtgraph code uses 0.7072 for the pixel padding needed for the "half pen-width".
Based on my testing, 0.5 is the value that should be used
On dpr 2.0 screens, the bounding box is actually over-sized by one pixel
if 0.5 was the half pen-width used
By using 0.7072, the over-sizing increases
i.e. the ideal pixel padding value would have been 1/dpr * 0.5
but the currently used value is computed as 0.7072
so for a thick pen width, we are off by (0.7072 - 1/dpr * 0.5) * penWidthF()
So with a dpr=1 screen, the over-sizing gets more apparent with thick pens
rough furnace
.7072 may have been the "right" value for Qt4; but sqrt(2) / 2 would be a number I would likely start with ..
I would be good with changing that value to 0.5 if the rendered result is better
 wicked tree
where to ask for help?
rough furnace
wicked tree
where to ask for help?
If it’s a PyQtGraph question, post here, otherwise check #1035199133436354600
copper lily
h
rough furnace
finally sitting down to look over some PRs this evening...
 cobalt seal
well you can answer a question instead:
pyqtgraph supports either pyside or pyqt of various versions. pyside is LGPL, but pyqt's non-commercial license is GPL. Shouldn't this mean pyqtgraph is forced to use GPL as well? It's currently MIT
half jewel
I'm not a pyqtgraph maintainer by the way 😅
rough furnace
@cobalt seal so, I'm not a lawyer, but we don't distribute PyQt5/6, we just import and interface with it. So we are not bound by the licensing of PyQt5 itself. Also Riverbank computing has made exemptions to their GPL licensing for open source projects, which is how there are conda distributions of PyQt5/6.
Now if you're distributing an application that uses pyqtgraph and pyqt5/6, depending on your distribution scheme and licensing, you may be bound by the GPL of Riverbank computing.
@half jewel I'm several months overdue 😆 ...notifications weren't too bad, there are some fantastic PRs here, I feel awful for letting them get stale
half jewel
I've left a PR awaiting my review for two months 😶. I think I win 🥴
cobalt seal
rough furnace
<@298248019646611468> so, I'm not a lawyer, but we don't distribute PyQt5/6, we ...
i was not aware of the exceptions. TIL and thanks
half jewel
I also had like 50 notifications to sift through coming back tonight.
rough furnace
cobalt seal
i was not aware of the exceptions. TIL and thanks
the riverbank open source exemption to GPL is a pretty non-standard thing, don't bank on being to utilize it, I suspect the conda and conda-forge developers likely contacted Phil directly to make sure things were on the up and up.
Now, if my application was open source, but I was bundling/shipping PyQt5/6 I'm not sure that would be on the up and up, and I would likely need to adopt a GPL license too.
@half jewel my kids have decided that they don't like staying in their room after bedtime so it makes it hard to focus on work...of course by the time they're passed out, I'm ready to pass out 😆
half jewel
Aww that's kids for ya. Unfortunately kids like to stay up late and they don't really grow out of it 😅
I've been just busy with my personal life and doing other things. It's hard to do all of that and then come back with enough energy to do OSS.
rough furnace
haha my kids are 4 and 7, ....the 7yo knows to stay in his room, the 4yo on the other hand...
yeah, personal life recently has been crazy .... my wife is looking at a job at the US State Department, which would involve an overseas move... we haven't decided for sure, but that looming decision has been so taxing.
half jewel
I hate making decisions, that sounds awful. Absolutely nerve-racking. An overseas move with kids is doubly so.
rough furnace
haha; my wife and I both had very international upbringings, ...the overseas part is mostly fine, the part we're hung up with is she's not sure if this is what she wants to do professionally, she also worries she'll get a posting in a place I hate and I'll resent her for it ... which won't happen, but 🤷♂️
half jewel
Right. She's a bit of an overthinker?
rough furnace
a bit, I do well with uncertainty and rapid changes (prior service military)... my wife, ...less so.... I just need to be patient and I'm sure it will all work out.
half jewel
I sure hope so! Sometimes some patience is the best prescription :)
plush fulcrum
Relevant gpl faq’s:
(Standard I am not a lawyer, this does not constitute legal advise)
https://www.gnu.org/licenses/gpl-faq.html#SystemLibraryException
https://www.gnu.org/licenses/gpl-faq.html#WhySomeGPLAndNotLGPL
https://www.gnu.org/licenses/gpl-faq.html#LinkingWithGPL
https://www.gnu.org/licenses/why-not-lgpl.html
Ultimately much of the FOSS license landscape is (and is likely to remain when it comes to interactions with free licenses) virtually totally untested in court.
Also, iirc there are exemptions from the GPL viral terms if a program can be used without the gpl components. For example Python itself is released under the PSF license. It contains the readline module which will link against GNU readline (a gpl project) if available, but will also work with libedit (bsd licensed), and thus python is not bound by the GPL viral term.
Similar logic would apply to pyqtgraph, we can work with pyside, so even though we can use gpl’d code, we do not require it. But if a user of pyqtgraph relies specifically on pyqt, they may themselves be bound by gpl terms for their whole project, but the fact that pyqtgraph is mit has no bearing on that.
plush fulcrum
Further reading: from John Hunter (matplotlib’s original author) touching on exactly these issues and how python makes the notion of ‘linking’ a whole lot murkier to begin with.
rough furnace
Wake up, check email, @fervent vale you’ve been busy lol
rough furnace
@elder eagle Just saw you provided some help to another used for a pyqtgraph issue, just wanted to thank you for doing that and to feel free to direct folks to this channel too. Thanks!
Also always love to hear about how other users came across the library and what they use it for, clearly you have familiarity so if you feel like sharing I'd love to hear about it 👍
 magic pebble
rough furnace
magic pebble
rough furnace
perhaps the reason NonUniformImage isn't used much is because we don't have a docs page for it 🤦♂️
fervent vale
It seems that it could almost be replaced with PColorMeshItem.
rough furnace
hadn't considered that, but it really does feel like it, huh
cobalt seal
the aim for compatibility for both pyqt and pyside means you probably haven't used it for pyqtgraph, but do y'all have an opinion on pyside 6's from __feature__ import?
rough furnace
cobalt seal
the aim for compatibility for both pyqt and pyside means you probably haven't us...
is this the true_property or snake_case thing? if so, we do not.
rough furnace
I'm not going to lie, I'm a bit annoyed about PYSIDE-1924, I was repeatedly urged to submit a PR to pyside from the pyside devs for that exact change, and despite repeated prompts, the uncommenting of 3 lines has just sat in their queue for 7 months...
@fervent vale I absolutely love pyqtgraph/pyqtgraph#2591 thank you for making access to this lower level interface so "easy"
supple leafBOT
rough furnace
it's too bad we can't rapidly draw a bunch of rects of different colors 😦
rough furnace
some movement on the pyside commenting out the method signatures on the XML file, they asked me to rebase and update the commit message, which I have now done.
rough furnace
@fervent vale pyside devs merged my PR, we should have access to the pointer signatures starting in 6.5.0!
fervent vale
I don't see the new signatures in the wheels at download.qt.io/snapshots/ci/pyside/dev/latest/split_wheels though
It's marked "dev" but the QtCore version is 6.4.3
rough furnace
Looks like they labeled 6.4.3 as the fixed version
 pseudo yarrow
Hi, @rough furnace, you recently mentioned the possibility of a new release in pyqtgraph/pyqtgraph#2477 so out of curiosity: are there any plans of a new release in the near future? Or was that more of a throwaway comment? No pressure or anything, I’m just wondering what to expect as the next release would contain my first few contributions to the project 🙂
supple leafBOT
 rough furnace
It’s pretty soon imo. It was close and then holidays hit; which generally knock me out of my OSS work for a few months. I think a few more PRs are probably ready for merging first. Maybe a week?
pseudo yarrow
Awesome 🙂
fervent vale
Alright, the latest wheels from download.qt.io/snapshots/ci/pyside/dev/latest/split_wheels have the new signatures now
rough furnace
@fervent vale any other PRs you think should be merged before release? was thinking 2595, a modification of 2580 (looks like the author doesn't want to make the change I suggested so I'll redo it on my own), 2540 (again, my own version), 2461, 2418, and maybe 2562 if the author updates the PR like you asked (I may make the update for them if that's the only issue).
rough furnace
just noticed there is a conda pyside6 package on conda-forge, no pyqt package yet, but they now build qt6-main... not looking to kill Qt 5.15 support yet, but glad to know the path has formed to do so
fervent vale
Matplotlib pinned version needs to be bumped up to 3.6.2 so that the test doesn't get skipped for Qt 6.4. Or maybe just don't pin it?
As for 2562, I realised that instead of drawing the points, the code could be greatly simplified by following GraphItem and just embed a ScatterPlotItem
rough furnace
fervent vale
As for 2562, I realised that instead of drawing the points, the code could be gr...
I think we had the pin before due to it not working w/ current qt bindings, which is no longer an issue, I'll unpin.
Re 2562, yeah by all means leverage the other existing plots types!
i need to update some CI config stuff anyway ....it's emitting a ton of warnings
anyway sounds like 2562 can safely be punted for the next release
rough furnace
Thanks for the PR @fervent vale !
fervent vale
If you are fixing 2418, could you also remove one of "fsample", "frequency"? They are meant to be the same thing. One of them must have crept in during the interactive parameters feature update
rough furnace
nice catch, sure thing!
rough furnace
@fervent vale what do you think about having scheduled CI runs that run against the test/rc versions of wheels for pyqt6 and pyside6?
also what's the command you used to install the pyside rc/test wheels? I'm having trouble installing with pip install --index-url=https://download.qt.io/snapshots/ci/pyside/dev/latest --pre --upgrade pyside6
fervent vale
Could it be manually triggered? PyQt doesn't normally have test versions on their server. And you also don't want to consume their server bandwidth without permission. Yesterday when I downloaded the wheels from Qt, it was really slow
rough furnace
yeah CI stuff can definitely be manually triggered, but I think something like weekly or every-other-day scheduled runs would be fine, even if it takes a while
fervent vale
rough furnace
also what's the command you used to install the pyside rc/test wheels? I'm havin...
I downloaded manually. There a line that does work for installing from Qt server, but I would need to dig it up
fervent vale
The line I found in my history was "python -m pip install --index-url https://download.qt.io/official_releases/QtForPython/pypy PySide6-Essentials"
maybe not directly from the CI snapshots.
fervent vale
rough furnace
nice catch, sure thing!
Oops. "fsample" and "frequency" are different things. "fsample" is the sampling rate. "frequency" is the frequency of the sine tone.
rough furnace
Good argument to be made that they should be renamed?
runic umbraBOT
Hey @floral mauve!
It looks like you tried to attach file type(s) that we do not allow (.svg). We currently allow the following file types: .gif, .jpg, .jpeg, .mov, .mp4, .mpg, .png, .mp3, .wav, .ogg, .webm, .webp, .flac, .m4a, .csv, .json.
Feel free to ask in #community-meta if you think this is a mistake.
 floral mauve
Good morning everyone. I hope all of you are ok.
Well, I am looking for how to place an external contour to my graph in python. I am creating my graphics in SVG format, but when I put it on Word I can't put it a contour as when I do it with an graphics in PNG format, that's why I want to creat an external contour with phython codes. I attach an graphic without contour (like the one I have) and with contour (like what I want) to make myself understood (download the graphics to see the contour on Word). I will really appreciate it.
I forgot to say that I used matplotlib.pyplot to create graphics

 rough furnace
floral mauve
Good morning everyone. I hope all of you are ok.
Well, I am looking for how to ...
rough furnace
floral mauve
Good morning everyone. I hope all of you are ok.
Well, I am looking for how to ...
Hi, this channel is for PyQtGraph related issues/help, I don’t use matplotlib much (or Word for that matter) so I’m not sure how much held I’d be.
floral mauve
rough furnace
Hi, this channel is for PyQtGraph related issues/help, I don’t use matplotlib mu...
Oh 😢 . I am so sorry to make a mistake.
Thanks your answer anyway
rough furnace
floral mauve
Oh 😢 . I am so sorry to make a mistake.
Thanks your answer anyway
no problem, best of luck!
 agile idol
Hello, I have a networkx graph that I'd like to visualise using pyqtgraph. I have found examples in pyqtgraph that use the GraphItem class to visualise graphs. It seems that I can use this class to visualise the networkx graph. Are there builtin import functions that allow me to import the graph from networkx to pyqtgraph? If not, what would be the best way to go about importing the graph myself?
rough furnace
we have no direct hook into it, but I've done this before and it's quite easy to do... I actually did a 3D example some time ago here: https://github.com/networkx/networkx/discussions/4879#discussioncomment-1045537
tl;dr use a networkx to give you node x, y positions and pass them to GraphItem.setData, you may need to change up the data structures a bit, but I remember the process being straight forward.
fervent vale
 south tartan
hi
south tartan
hi
How are you getting your live data?
south tartan
fervent vale
How are you getting your live data?
Its not live live data
I cretr it myself
Ever heard of a Mobte carlo simulation?
I want to make it more spicy by changing it to plot both my scatter plot and the line graph live
fervent vale
So you have 2 processes, one creating your fresh data. The other doing the plotting, presumably using pyqtgraph
There's a long thread in pyqtgraph github Discussions about this
Normally i use zeromq for the inter-process communications
fervent vale

GitHub
Hello, pyqtgraph noob here... i have a python program running non-stop and it does not have a gui. i would like to sometimes "connect" to it and view the data it is producing, and...
south tartan
@fervent vale im sorry to tel you that vut i rrally do t have that much time to grt into that topic deeply, since im in exam phase, ig i will actually learn it next month but rn, i just want to add the live thing to my project
Would you mind if we could hop into an vc later the day, and i show you what i got so far?
south tartan
@rough furnace would u be able to help me out here?
rough furnace
south tartan
<@369662814488363009> would u be able to help me out here?
you're going to need to post some code, I only get a few hours a week of pyqtgraph development time, and I am way behind on the 0.13.2 release. Post an example application of what you're trying to get working and indicate what isn't working and we can likely provide you better assistance from there.
south tartan
rough furnace
you're going to need to post some code, I only get a few hours a week of pyqtgra...
i havent even implemented it yet becuase i dont know where to start.... but ima post some code here rq
pi=3.141592653589793238462643383279
pi_x=[0,10000]
pi_y=[pi, pi ]


gesamt_innen=[1]
gesamt_außen=[1]
counter_innerhalb=1
counter_außerhalb=1
Graph_x=[]
Graph_y=[]
fig = plt.figure()
ax = fig.add_subplot(111)
plt.figure(num="first")
circle1 = plt.Circle((0, 0), 1, fill=False)
plt.gca().add_patch(circle1)
plt.xlim(0,1)
plt.ylim(0,1)

ax.set_aspect('equal', adjustable='box')
UI=int(input("Ammount of random Dots: "))

for i in range(UI):
    Graph_x.append(i)


for a in range(1, UI):
   x = random.uniform(0,1)
   y = random.uniform(0,1)
   plt.figure(num="first")
   if (x*x+y*y)**0.5 <= 1:
        plt.scatter(x, y, 8, color="#00ff00")

   else:
        plt.scatter(x, y, 8, color="#ff0000")

   plt.scatter(x, y, 4, color="k")
   plt.xlim(0, 1)
   plt.ylim(0, 1)
   d=(x*x+y*y)**0.5

   if d > 1:
       counter_außerhalb += 1
   else:
       counter_innerhalb += 1
   gesamt_innen.append(counter_innerhalb)
   gesamt_außen.append(counter_außerhalb)
   #plt.figure(num=("zero"))
   #plt.plot(x_value,y_value, linestyle="dotted")
for i in range(len(list(gesamt_innen))):
    if gesamt_innen[i]/gesamt_außen[i]==0:
        continue
    y_value=(gesamt_innen[i]/(i+1)*4)       #y_value=(gesamt_innen[i]/(i+1)*4)   und counter_außerhalb=0   --> gibt genauere Werte
    Graph_y.append(y_value)
plt.figure(num="second")
plt.plot(pi_x,pi_y, linestyle="dotted")
plt.plot(Graph_x, Graph_y)
plt.xlim(0,UI)
plt.ylim(0,5)
plt.show()
Okay, now this is a Monte Carlo Simmulation, to be specific, i enter teh number of points beeig generated in an User input, following that the programm creats a random point between x= 0-1 and y=0-1
with the ammount of points created devided by teh ammounts of points taht are in the circle i get close to pi
i now want to live plotl the scatter plot aswell as teh line plot to plot them both at teh same time

with 50 Points
plt.ion()
fig1 = plt.figure()
fig2= plt.figure()
ax = fig1.add_subplot(111)
ax2= fig2.add_subplot(111)
circle1 = plt.Circle((0, 0), 1, fill=False)
plt.gca().add_patch(circle1)
plt.xlim(0,1)
plt.ylim(0,1)
ax.set_aspect('equal', adjustable='box')

UI=int(input("Wie viele Durchläufe: "))

total,inside = 0,0

for a in range(UI):
   x = random.uniform(0,1)
   y = random.uniform(0,1)
   total += 1
   if (x*x+y*y)**0.5 <= 1:
      inside += 1
      plt.scatter(x,y,8,color="#00ff00")
   else:
      plt.scatter(x,y,8,color="#ff0000")
   fig1.canvas.flush_events()
   plt.draw()
   print(inside/total*4)
this code does the same but only animates the dot creation and prints the Y_values that get close to pi
rough furnace
...this is matplotlib code... that's a completely separate library from pyqtgraph, if you're looking to get that working, this is the wrong place to ask for help w/ that.
south tartan
rough furnace
...this is matplotlib code... that's a completely separate library from pyqtgrap...
ik that this is matplotlib, some guy in general said me i should transform the matplotlib code int pyqtgraph f´for easier live plotting/ faster rendering
rough furnace
south tartan
ik that this is matplotlib, some guy in general said me i should transform the m...
ahh yeah, sorry that's a pretty big ask in terms of support, if you're looking for how to start using pyqtgraph, I suggest starting with the examples and build up from there.
south tartan
rough furnace
ahh yeah, sorry that's a pretty big ask in terms of support, if you're looking f...
Okay say i have given that ```
x_val= np.arrange(1,10)
for i in range(1,10):
y_val= random.random()
taht should be fairly easy
rough furnace
generally the way you update plot data in pyqtgraph is using the .setData() method
south tartan
rough furnace
generally the way you update plot data in pyqtgraph is using the `.setData()` me...
so, the idea is you already have a given data set and just plot it live?
rough furnace
runic umbraBOT
pyqtgraph/examples/Plotting.py lines 54 to 66
p6 = win.addPlot(title="Updating plot")
curve = p6.plot(pen='y')
data = np.random.normal(size=(10,1000))
ptr = 0
def update():
    global curve, data, ptr, p6
    curve.setData(data[ptr%10])
    if ptr == 0:
        p6.enableAutoRange('xy', False)  ## stop auto-scaling after the first data set is plotted
    ptr += 1
timer = QtCore.QTimer()
timer.timeout.connect(update)
timer.start(50)```in our example app, that's one of our basic examples of updating plot data
south tartan
okay saying i have the following:
x= np.arrange(1,10)
y= []
for i in range(1,10):

    y_val= random.random()
    y.append(y_val)
``` givin dataset for x and y, can i now liveplot smth with x and y?god taht looks complicated
rough furnace
there are a number of examples in the example app that demonstrate updating data, appending data to an existing plot is a bit trickier (especially when your datasets get large) but still doable
south tartan
rough furnace
in our example app, that's one of our basic examples of updating plot data
do you have a yt vid somewhere out there explaining the most basic stuff ( like a live line chart)
im more of the by ear learner
rq, whats the pip install command?
rough furnace
there is a video demo-ing pyqtgraph https://www.youtube.com/watch?v=yhU-HUTJ8Y0 (this is an older video, bulk of it still stands) ... haven't seen any pyqtgraph tutorials in video form; most common case of newcomers getting up to speed is browsing through our examples app and picking the bits they want/need

Lightning Talk recorded at the PyConDE & PyData Berlin 2019 conference.
https://pycon.de
More details at the conference page: https://de.pycon.org/program/FTVNPK
Follow us on Twitter: https://twitter.com/pydataberlin, https://twitter.com/pyconde 00:00 Welcome!
00:10 Help us add time stamps or captions to this video! See the description for det...
pip install pyqtgraph ?
south tartan
rough furnace
`pip install pyqtgraph` ?
ah thanks
rough furnace
you need to choose Qt bindings of your choice, PyQt6, PySide6, PyQt5, PySide2, if you're not sure what to choose, would go with PyQt6 ...if you care about GPLv3 vs. LGPL go with PySide6
south tartan
rough furnace
you need to choose Qt bindings of your choice, PyQt6, PySide6, PyQt5, PySide2, i...
dude, sorry to say that, but i have no plan what that is
rough furnace
PyQtGraph is a plotting library that bridges the Qt framework (used for developing cross-platform GUIs, has python bindings) and numpy.
south tartan
rough furnace
PyQtGraph is a plotting library that bridges the Qt framework (used for developi...
i already know that so far
rough furnace
Qt has multiple different python bindings, PyQt5, PyQt6, PySide2, PySide6, we support all of them, but you use one of them.
south tartan
runic umbra
`pyqtgraph/examples/Plotting.py` lines 54 to 66
```py
p6 = win.addPlot(title="Up...
okay, what do i need to import/ download for that to work
i want to have a look into this example
rough furnace
pip install numpy pyqtgraph PyQt6 then python -m pyqtgrpah.examples
south tartan
rough furnace
Qt has multiple different python bindings, PyQt5, PyQt6, PySide2, PySide6, we su...
okay, ig i go with PyQt6 then
rough furnace
that will launch the example app
south tartan
oi 50mB
Okay @rough furnace im flabbergasted by the pure possabilitys with pyqtgraph
rough furnace
south tartan
Okay <@369662814488363009> im flabbergasted by the pure possabilitys with pyqtgr...
hopefully in a good way 😆
rough furnace
found a video series of pyqtgraph here: https://www.youtube.com/watch?v=bB8q_cYWRcQ&list=PL1FgJUcJJ03sImAsEpAzMTjaTCU7bY3ZD no clue if it's any good

Join PyQt6 13 Hours Course in Udemy
https://www.udemy.com/course/python-gui-development-with-pyqt6/?referralCode=75818923A830BA4367E1
In this video we are going to talk about PyqtGraph Introduction Installation & Drawing Line
What is Pyqtgraph ?
PyQtGraph is a graphics and user interface library for Python that provides functionality commonly...
tinker w/ the benchmarks!
south tartan
for now i cant learn the basics i need to make smth quikly done
south tartan
rough furnace
found a video series of pyqtgraph here: https://www.youtube.com/watch?v=bB8q_cYW...
sure thanks
ik btw what i need exaxtly
an scrollable plot
to be precised
that one

but in the example, i cant tell which code block is this graph
runic umbraBOT
Hey @south tartan!
You either uploaded a .txt file or entered a message that was too long. Please use our paste bin instead.
rough furnace
yeah
south tartan
rough furnace
think that one works 😄
okay, do you think its easy to replace my currently working code with matplotlib by such a scrollable plot without having to learn everything
rough furnace
no clue, I don't know squat about matplotlib 😛
south tartan
rough furnace
no clue, I don't know squat about matplotlib 😛
i mean, i got teh data created could i make such a scrollable plotm with a view line sof code?
rough furnace
I chat w/ some of the maintainers periodically ....but I rarely use the library 😛
south tartan
rough furnace
I chat w/ some of the maintainers periodically ....but I _rarely_ use the librar...
understandable cause u a pyqtgraph dev
rough furnace
pyqtgraph fully supports scrollable plots as you can see in the demo, if you can get the data into a numpy array I see no reason why pyqtgraph would be difficult to render that data
I suspect the harder bits will be getting the data; and other application polish/usability
south tartan
rough furnace
pyqtgraph fully supports scrollable plots as you can see in the demo, if you can...
OKay thats good, could u look me a function up to plot that scrollable line chart with a given numpy array?
south tartan
rough furnace
I suspect the harder bits will be getting the data; and other application polish...
i mean x axis is constant, a for loop should be enough, and i already got the y values, ig i can save them in a array
rough furnace
https://github.com/pyqtgraph/pyqtgraph/blob/master/pyqtgraph/examples/scrollingPlots.py I mean first thing would be to see which update function pertains to the plot behavior you want, likely a case of setData ... I think the plot you highlighted has curve4, and you can see here is the only way we mess w/ the curve plot item:
https://github.com/pyqtgraph/pyqtgraph/blob/master/pyqtgraph/examples/scrollingPlots.py#L63

GitHub
Fast data visualization and GUI tools for scientific / engineering applications - pyqtgraph/scrollingPlots.py at master · pyqtgraph/pyqtgraph
south tartan
rough furnace
found a video series of pyqtgraph here: https://www.youtube.com/watch?v=bB8q_cYW...
could u pin that btw?
rough furnace
south tartan
could u pin that btw?
not until I watch it and can vouch for it 😛 ...which I am by no means ready to do
south tartan
rough furnace
not until I watch it and can vouch for it 😛 ...which I am by no means ready to ...
okay good
south tartan
rough furnace
https://github.com/pyqtgraph/pyqtgraph/blob/master/pyqtgraph/examples/scrollingP...
uhm i have no clue what to do with the code tbh
Here in matplotlib that simple
plt.plot(Graph_x, Graph_y)
``` i already got my data Graph_x and Graph_y...ik i have to do lots of stuff before to set up teh scrollable part
but is it hard to create that scrollable plot i fi laready have x and y?
you said the problems is to first GET the data
fervent vale
fervent vale
GitHub
Live pyqtgraph plot. Contribute to domarm-comat/pglive development by creating an account on GitHub.
rough furnace
TIL about pglive
fervent vale
rough furnace
TIL about pglive
Oh they created a pyqtgraph issue about the thick lines 0 segments failure
fervent vale
There will be a final Qt 6.4.3 release
Which would include the drawLines, drawRects functionality
rough furnace
Nice!
agile idol
rough furnace
we have no _direct_ hook into it, but I've done this before and it's quite easy ...
Thanks for your help. It was indeed very simple and my graph is now looking pretty nice. However, it's a directed graph, but pyqtgraph doesn't draw the edges with arrow heads. Below is my current code. Is there a simple way to add arrow heads?
        positions = np.array(list(nx.drawing.layout.circular_layout(networkx_graph).values()))

        ## Define the set of connections in the graph
        nodes = list(networkx_graph)
        node_connections = np.array([
            np.array([nodes.index(e1), nodes.index(e2)])
            for e1, e2 in networkx_graph.edges()
        ])

        ## Define the symbol to use for each node
        symbols = ['s'] * len(positions)

        ## Update the graph (self.graph is a GraphItem instance)
        self.graph.setData(pos=positions, adj=node_connections, symbol=symbols, size=25)
 rough furnace
oo good point on the arrow heads for a directed graph; it's doable in pyqtgraph but more complicated....
you would need to add some ArrowItem's https://pyqtgraph.readthedocs.io/en/latest/api_reference/graphicsItems/arrowitem.html
that is clearly a weak point in the GraphItem plot, I would definitely review/approve of a PR that added that functionality there...
agile idol
Well, I guess since the GraphItem only gets the positions of nodes and the connections between them, there'd be no way for it to know whether the graph is directed or not. On the other hand, a boolean keyword argument like directed would indeed be nice and clean
I'll try to see if I can come up with a decent implementation and if I do, make a PR
rough furnace
thanks, feel free to ask for input here if you're having trouble with the implementation
a boolean directed argument would be how I would add it too
agile idol
Another question: draw.io offers this edge line style, where instead of a straight line between nodes, the line is either horizontal or vertical. I would also like to add this style to my graph. How hard would it be to get the edges to be drawn like this?
 rough furnace
I imagine that would be trickier as you would have to come up w/ logic to determine which way the arrows should go out/in the nodes, etc...
if you do make a go at that, I highly advice against using QPainter.moveTo() and QPainter.liveTo() methods...those are ...problematic for pyqtgraph
agile idol
Okay, what should I use instead?
rough furnace
QPainter.drawLines()
or construct a QPainterPath with points... (and then draw the path)
although neither option would make the arrow-head particularly easy I don't think...
agile idol
positioning the arrow-head is going to be annoying either way, because it also depends on the node shape
rough furnace
I'd have to test, but ArrowItem may be smart enough to just touch the edge, regardless of what the node shape is...
ArrowItem is intended to point to other GraphicsItem's ....I haven't used it that much myself, one of the examples of pyqtgraph shows the use of ArrowItem; ....I'm wondering if the InfiniteLine example has a usage of ArrowItem as well or not... I can't remmeber
agile idol
the InfiniteLine example doesn't use any arrows
rough furnace
blerg, that's too bad, thought one of the TargetItem's in there may have had an arrow connecting it to it's label...
agile idol
the Arrow example does, but there it's just static arrows whose position is hardcoded
rough furnace
I would tinker, but I have work, my first inclination would be to set the ArrowItem's parent to the node that you want it pointing at...not sure if that would place it in the correct area though, but it would keep the arrow and the node coupled together
agile idol
the text.py example does have an arrow that tracks a curve. It creates the arrow and then calls arrow.setParentItem(curvePoint), so I guess your suggestion would work
rough furnace
CurvePoint is a bit interesting for other reasons, I think it was created in large part to tinker with Qt's animation framework and see how easy that is to integrate into pyqtgraph (turns out fairly easily but we haven't seen much demand/interest so we haven't explored doing more of it)
agile idol
Hmm, it turns out to be a little bit more complicated. I have to manually set both the position and the angle of the arrow. While the angle of the edge is not too hard to calculate, the hard part is getting the position right - the pointy bit of the arrow should touch the edge of the shape, which is at an offset relative to the center of the shape. However, I'm not sure what the best way is to calculate this offset...
rough furnace
I'd have to tinker with it, but I assume calculating offsets would be a major pain as the node may have more complicated shapes; I would likely try and use the collision detection mechanism that the shape and boundingRect methods give (shape is used to calculate more precise geometries, but not all graphics items have them)
I assume calling ArrowItem.setParentItem(node) places the arrow head at the center of the node, and not at the edge/bounding rect? if that's the case I suppose you could calculate the offset based on the angle and boundingRect but if hte node is circular and you're having an arrow come in at an angle, that might not look great.
If you have some code where you're trying this, feel free to submit a draft PR, when I have some time (multiple birthday parties to take my son to today!) I'll hop on that branch and tinker some
agile idol
I'm actually using a GraphItem to draw a bunch of points as nodes, and the individual points are not QGraphicItems, so I can't pass them to ArrowItem.setParentItem. Instead, I'm retrieving the position of each of the nodes though GraphItem.scatter.points() and then pick one and call .pos() on it to get the position I place the arrow at. Determining the angle is a bit more complicated, but not too bad:
# Find the points
points = self.scatter.points()

# Add an arrow to each target point
for src_id, target_id in edges:
    arrow = pg.ArrowItem()
    arrow.setParentItem(self)

    point_src, point_target = points[src_id], points[target_id]
    arrow.setPos(point_target.pos())  # TODO: Add offset to edge of shape
    arrow.setStyle(
        angle=(180 * math.atan2(point_src.pos().x() - point_target.pos().x(), point_src.pos().y() - point_target.pos().y()) / math.pi) - 90,
    )
edges is just a list of tuples with node ids giving the start and end point of every edge
agile idol
That gives me a graph that looks like this, with arrows with tips at the center of the nodes

I'm starting to wonder if it's really the right approach to draw the graph as a bunch of points from a GraphItem. Maybe it would make more sense if I let the individual points be actual QGraphicsItems (such as QGraphicsRectItems). That is also because I want to have the text be contained within the node, instead of just being painted on top of it like it is now. And if they are actual QGraphicsItems, I suppose it's also easier to detect the edge for proper edge drawing.
agile idol
oh, that looks very interesting
fervent vale
there's a bug in PyQt's sip.array implementation that we have been working around ever since we started using it.
from PyQt6 import QtCore, sip
import numpy as np

LEN = 5
sa = sip.array(QtCore.QLineF, LEN)   # LEN * 4 doubles
assert len(sa) == LEN

# following fails due to wrong size
# memory = np.frombuffer(sa, dtype=np.float64)
# ValueError: buffer size must be a multiple of element size

vp = sip.voidptr(sa)
print(f'expecting {LEN*4*8}, got {vp.getsize()}')

# the following is our workaround
vp.setsize(len(sa)*4*8)
memory = np.frombuffer(vp, dtype=np.float64)
assert len(memory) == LEN * 4
The bug is in sip_array.c
static int sipArray_getbuffer(PyObject *self, Py_buffer *view, int flags)
view->len = array->len;
should be
view->len = array->len * array->stride;
https://docs.python.org/3/c-api/buffer.html#c.PyObject_GetBuffer

Python documentation
Certain objects available in Python wrap access to an underlying memory array or buffer. Such objects include the built-in bytes and bytearray, and some extension types like array.array. Third-part...
fervent vale
Another issue is that slicing sip.array(s) doesn't work.
from PyQt6 import QtCore, sip

sa1 = sip.array(QtCore.QLineF, 10)
assert len(sa1) == 10
sa2 = sa1[2:8]
assert len(sa2) == 6

vp1 = sip.voidptr(sa1)
assert int(vp1) != 0
vp2 = sip.voidptr(sa2)
print(hex(int(vp2)))    # NULL pointer
The expected behavior is that slicing would yield a non-owning memory view.
The bug is also in sip_array.c.
static PyObject *sipArray_subscript(PyObject *self, PyObject *key)
element(array->data, start)
should be
element(array, start)
PR #2596 is trying to add slicing capability and can't do it for PyQt sip.array because of this bug.
rough furnace
I’ll post to the mail list, I think Phil was looking to do a release shortly so not sure if the fixes will be incorporated in time
Thanks for debugging these!
 wanton dirge
<function faisal.wiring_gals at 0x000001BF54A49510>Why
rough furnace
wanton dirge
<function faisal.wiring_gals at 0x000001BF54A49510>Why
wrong channel
rough furnace
@fervent vale Phil messaged me back, says it might be a few days before he gets to it.
rough furnace
@fervent vale do you think we should merge pyqtgraph/pyqtgraph#2596 before the next release?
supple leafBOT
rough furnace
ahh looking at your commits, probably worth seeing Phil's fix to sip.array first
same goes for #2599
fervent vale
Given that there was a bug in plotting one point thick lines in 0.13.1, probably don't want to risk having yet another buggy 0.13.2 for thick lines
rough furnace
well, wasn't long ago thick lines were outright not functional 😄
i'm going to do some fanciness w/ dependabot to submit PRs to update our pinned dependencies in our test environment...
rough furnace
we're now up to 30 test pipelines since i've added python 3.11; noticed there is a Qt6 conda package too, which means I'm going to add even more pipelines; I'm open to suggestions to which options of the test matrix I should remove (also CI doesn't take that long, so could arguably not remove anything)
fervent vale
Python 3.8 will soon be dropped according to NEP29?
rough furnace
yeah, end of april
rough furnace
other reason I ask is we haven't seen many failures recently that involve specific combinations of bindings + os + python versions... a few years ago, that was happening much more often
fervent vale
I have removed the dependency of #2599 (BarGraphItem) on #2596 (drawargs). #2596 will need a longer testing runway.
fervent vale
The only thing about #2599 is that it changes a keyword argument name of PrimitiveArray from method to use_array. But internals.PrimitiveArray is something internal to pyqtgraph implementation and not supposed to be a public facing api.
If that is going to be problem, I could do a PR just to rename the name for this release?
rough furnace
Yeah I don’t consider that public api but maybe a docstring should be added explicitly stating we don’t consider this public API and changes can happen without warning
rough furnace
if someone is bored and wants to give pyqtgraph/pyqtgraph#2418 a look over, I'd appreciate that.
The other thing I'm considering is changing the default values for PlotSpeedTest.py on newer machines, the default values yield ~1,000 FPS, which make me think we should provide a larger dataset. I do want the defaults to work with low-end devices (Raspberry Pi's), so I'm open to suggestions here.
supple leafBOT
rough furnace
(asks for review, see's the CI is all red 🤦 )
rough furnace
I go to add NonUniformImage to the docs, only to realize there are effectively no docstrings on how to use it... who merged that PR anyway 😅
rough furnace
just saw some numpy warnings:
tests/test_functions.py:290
  /Users/runner/work/pyqtgraph/pyqtgraph/tests/test_functions.py:290: DeprecationWarning: NumPy will stop allowing conversion of out-of-bound Python integers to integer arrays.  The conversion of -1 to uint32 will fail in the future.
  For the old behavior, usually:
      np.array(value).astype(dtype)`
  will give the desired result (the cast overflows).
    np.arange(6, dtype=dtype), np.arange(0, -6, step=-1, dtype=dtype), 'all',
probably should patch that up before it starts failing 😬
If I'm reading this right, can we change np.arange(0, -6, step=-1, dtype=dtype) to
values = np.arange(0, -6, step=-1)
np.array(values).astype(dtype)```That doesn't solve the underlying issue
so the code is casting small negative numbers to become large positive numbers
rough furnace
since @mortal grotto wrote that bit of code, I may let him handle it 😄