#pyqtgraph
1 messages · Page 8 of 1
 rough furnace
Oh I misunderstood; glad you sorted it out
 lapis tapir
thanks anyway
rough furnace
welp, thought I would be catching up on pyqtgraph work over the next few weeks, but my 2yo got a close covid contact and is on quarantine, this will make things interesting :/
 obsidian sapphire
we'll all be there with you soon enough, Ogi, make no mistake.
okay, so I'm looking at the mailing list question that was asked about unresponsive plots, and I'm finding that successive calls to PlotWidget.plot() take longer and longer.
( with a .clear() in between each )
obsidian sapphire
yeah, I can't explain it. clear() is definitely being called, and the plot's items are being removed. something might be leaking here? more digging...
huh. the leaky behavior isn't present if I only plot a single array. or at least, it's not showing as noticeably. ( for those following along, I'm using examples/multiplePlotSpeetTest.py as my playground here, which either plots 225 little arrays, or it combines them into a single array )
obsidian sapphire
modifying the data in place and calling PlotWidget.update() is 10*5 times faster, and doesn't seem to suffer from any leak, so I'm going to recommend the poster do that, but I'm worried about the clear/plot use-case, now.
 fervent vale
Is it intended implementation behaviour that the user passed-in buffer can be subsequently updated and modified by the user? I have always used setData to update the plot data
If the data is transformed before display, wouldn't that mean that the library would have to repeatedly re-transform the data in case it was modified outside by the user?
fervent vale
import numpy as np
import pyqtgraph as pg
from pyqtgraph.Qt import QtCore, QtWidgets

shifts = []
plots = []

def update():
    for idx in range(len(plots)):
        pi = plots[idx]
        shift = shifts[idx]
        data = np.roll(base_data, shift)
        pi.clear()
        pi.plot(data)
        shift = (shift + (idx+1)) % base_data.size
        shifts[idx] = shift

pg.mkQApp()

rng = np.random.default_rng()
base_data = rng.random(1000)

if 0:
    glw = pg.GraphicsLayoutWidget()
    glw.show()
    for row in range(5):
        pi = glw.addPlot(row=row, col=0)
        plots.append(pi)
else:
    wgt = QtWidgets.QWidget()
    wgt.show()
    vbox = QtWidgets.QVBoxLayout()
    wgt.setLayout(vbox)
    for row in range(5):
        pw = pg.PlotWidget()
        vbox.addWidget(pw)
        pi = pw.getPlotItem()
        plots.append(pi)

shifts = [0] * len(plots)

timer = QtCore.QTimer()
timer.timeout.connect(update)
timer.start(1)

pg.exec()
The above script crashes after a while. It doesn't crash if GraphicsLayoutWidget is used instead of using multiple PlotWidgets
rough furnace
covid
fervent vale
PlotWidget zoom pan freeze
rough furnace
Sorry for the mass tag, but I think we need to discuss setLogMode @wide prism @obsidian sapphire @violet basin @fervent vale @torn coyote @torn coyote @mortal grotto @plush fulcrum check the thread...
 wide prism
Sorry for the brain dump; My free time is quite limited right now, so I am in the unappealing position of bothering you all with thoughts without putting them into code. 🙇♂️
rough furnace
wide prism
Sorry for the brain dump; My free time is quite limited right now, so I am in th...
it's ok, not like I've done anything the last ... <checks calendar> 2.5 months; ... today it's 8:15pm, the kids are in bed, and I'm not feeling like I'm about to pass out; I'm going to try and dive into the multi-axis plot PRs and try and find the discrepancy @obsidian sapphire discovered
rough furnace
Next weekend, there will be a PyCascades conference, which I am the sprint chair for. The sprints are a relatively narrow window, 1 PM - 5 PM PST on Sunday Feb. 6th (we can likely sprint later if we want)
Would anyone like to participate?
Link for more info: https://2022.pycascades.com/program/sprints/
Website for PyCascades 2022, a regional Python conference in the Pacific Northwest hosted online.
wide prism
Heh, your involvement with sprints escalated quickly. I am still mentally context-switched away from python development, so it doesn't seem very likely that I'll be able to join in a productive fashion. But I might be able to hang around some.
rough furnace
wide prism
Heh, your involvement with sprints escalated quickly. I am still mentally contex...
heh, my involvement w/ this conference was more with personal connections than my pyqtgraph work 😛
 mortal grotto
Question regarding plot exports: Why don't the scatter plot and curve align with each other?
import numpy as np
import pyqtgraph as pg
from pyqtgraph.Qt import QtCore, QtGui, QtSvg
from skimage.draw import circle_perimeter

pg.mkQApp()
spi = pg.ScatterPlotItem()
spi.setPen('r')
spi.setBrush('r')
spi.setPxMode(False)
spi.setSize(5)
ci = pg.PlotCurveItem()
ci.setPen('k', width=3)

outName = 'test.svg'
# Make some random curve data
coords = np.c_[circle_perimeter(50, 50,25)]
# Default ordering is not conducive toward CurveItem plotting
angles = np.arctan2(*(coords - coords.mean(0)).T)
order = np.argsort(angles)
# Everything should fit nicely in the svg size
coords = coords[order] - coords.min(0)
coords = (coords / coords.max(0)) * 250
# Close the shape
coords = np.r_[coords, coords[[0]]]

points = np.random.randint(0, len(coords), size=15)
spi.setData(*coords[points].T)
ci.setData(*coords.T)

# Boilerplate copied from Qt docs
generator = QtSvg.QSvgGenerator()
generator.setFileName(str(outName))
generator.setSize(QtCore.QSize(250,250))
painter = QtGui.QPainter()
painter.begin(generator)
ci.paint(painter, None, None)
spi.paint(painter)
painter.end()
This generates the attached svg
 mortal grotto
Update: Looks like the scatterplot is off by a 4/3 scale factor
rough furnace
mortal grotto
Update: Looks like the scatterplot is off by a 4/3 scale factor
we've had this issue before, we've made corrections to this alignment before didn't realize it was still off :/
if you search the issue tracker, you'll see quite a bit of discussion on this... but i don't have memory of where we landed
mortal grotto
GH's issue tracker doesn't have the best searching capabilities... I'll do my best
Thanks for the tip, wasn't sure if I was making the wrong assumptions about how exports work or if it was a pyqtgraph thing
rough furnace
i'm in a meeting but i'll see if I can track stuff down

GitHub
Hei there, i have found a strange bug, when creating a plot having a line and markers for a specific dataset the SVG Exporter does not place the marker symbols at the expected positions but somehow...
(notei t's closed)
it's closed but you can see how the debugging occurred which may be helpful
rough furnace
that conda CI build I'm working on, resulting in segfaults is driving me up the wall... after having such a reliable/robust CI for so long, feels like I'm just introducing more problems...
rough furnace
if anyone is on macOS, that uses conda distributions of python, please let me know.
 harsh ravine
Check this out: https://github.com/baijifeilong/IceSpringPySideStubs

GitHub
PySide stubs with Qt signals and Qt documentations and more. - GitHub - baijifeilong/IceSpringPySideStubs: PySide stubs with Qt signals and Qt documentations and more.
rough furnace
harsh ravine
Check this out: https://github.com/baijifeilong/IceSpringPySideStubs
@mortal grotto @obsidian sapphire wondering if these can be integrated into that pyi file that you all are passing around
@fervent vale on the subject of sunsetting support for older Qt versions, I'd like to get your opinion on discontinuing support for Qt 6.1 sooner rather than later (or on the same release we remove Qt 5.12 support)
rough furnace
Tonight I would like to start working on a road-map, here is a horrifically outdated version of a document...
https://github.com/pyqtgraph/pyqtgraph/wiki/Planned-Development

GitHub
Fast data visualization and GUI tools for scientific / engineering applications - Planned Development · pyqtgraph/pyqtgraph Wiki
rough furnace
i'm looking at seeing if we can cache dependencies installed during the CI process; this could arguably speed things up a decent amount, down-side is that we won't catch breaking changes as they are released unfortunately as we will have to pin versions of things
rough furnace
good news, with pytest-xdist we can save 1-2 minutes on runtime for the test suite, but bad news is we get intermittent failures...
rough furnace
https://twitter.com/numba_jit/status/1504081137844600834
makeARGB might get a speedup here on macOS (with numba installed)

M1 / Apple Silicon / osx-arm64 support for #llvmlite has now been merged to 'main'. https://t.co/Q0Uy9G7nvS
 Twitter
·
fervent vale
rough furnace
https://twitter.com/numba_jit/status/1504081137844600834
makeARGB might get a s...
Twitter
·
fervent vale
rough furnace
https://twitter.com/numba_jit/status/1504081137844600834
makeARGB might get a s...
ImageItem float and uint16 have numba code. Not makeARGB.
rough furnace
fervent vale
ImageItem float and uint16 have numba code. Not makeARGB.
Yeah yeah you all know what I meant 😛
fervent vale
rough furnace
Yeah yeah you all know what I meant 😛
I wonder if anyone actually exercises it. I don't.
rough furnace
fervent vale
I wonder if anyone actually exercises it. I don't.
I don’t either but use of numba is something I’ll be asking about in the user survey
rough furnace
so decided I wanted to tinker w/ the JWST image that was just released with pyqtgraph, mostly to tinker/experiment w/ ROI/ImageViews which are parts of the library I don't really touch...
Image for reference:
https://www.nasa.gov/sites/default/files/thumbnails/image/telescope_alignment_evaluation_image_labeled.png
I can't get the channel ordering right to save my life, screenshot:


here is the code I have:
import pyqtgraph as pg
from pyqtgraph.functions import imageToArray
import numpy as np
import os

app = pg.mkQApp()
image_path = os.path.abspath("./image/telescope_alignment_evaluation_image_labeled.png")

original = pg.QtGui.QImage()
original.load(image_path)
# original.convertToFormat(pg.QtGui.QImage.Format.Format_RGBA8888)

array = imageToArray(original, transpose=False)

jwst_image_item = pg.ImageItem(array)
jwst_image_item.setOpts(axisOrder='row-major')
imageview = pg.ImageView(imageItem=jwst_image_item)
imageview.show()

if __name__ == "__main__":
    pg.exec()
what am I missing here, doing a quick look through the code, I'm not seeing an easy way to manipulate the channel order other than to re-order the numpy array, which I suppose I'm not above doing.
(fwiw I did get this working by adding array = array[..., [2, 1, 0, 3]])
fervent vale
After loading the png, convert it to RGBA8888 then use ndarray_from_qimage. The resultant ndarray can be passed directly to ImageItem.
ndarray_to_qimage should be used in preference to `imageToArray. The latter has endian-ness assumptions.
rough furnace
image_path = os.path.abspath("./image/telescope_alignment_evaluation_image_labeled.png")

original = pg.QtGui.QImage()
original.load(image_path)
original.convertToFormat(pg.QtGui.QImage.Format.Format_RGBA8888)

array = ndarray_from_qimage(original)

jwst_image_item = pg.ImageItem(array)
jwst_image_item.setOpts(axisOrder='row-major')
imageview = pg.ImageView(imageItem=jwst_image_item)
imageview.show()
This unfortunately still results in the with the wrong channel order
rough furnace
@fervent vale you've worked w/ ImageItem a lot more than I have, let me know if this is an appropriate case for opening an issue and I can migrate the content there
fervent vale
convertToFormat returns a new QImage rather than converting in-place.
There's an "in-place" version called convertTo available since 5.13 but it's likely to allocate new memory internally anyway.
Another thing, ndarray_from_qimage returns only a non-owning view. So if you don't hold a reference to the QImage, you may need to make a copy() of the ndarray
rough furnace
fervent vale
`convertToFormat` returns a new QImage rather than converting in-place.
that was it, thanks ... not sure why I had it in my head that this was an in-place operation
fervent vale
Regarding all those issues about pyinstaller with PyQt, isn't bundling up GPL modules with presumably the aim of distributing the application a license violation?
rough furnace
while it certainly could, I think there are plenty of exceptions here (fair warning, I'm not a lawyer)
- Application is open source
- Application is distributed internally at a company
I think a comparable equivalent is how ffmpeg is frequently distributed with applications (which if memory serves, it has a more restrictive license)
Along those lines, conda defaults channel distributes PyQt5 5.9 (but that's not a distribution created/maintained by Riverbank computing).
fervent vale
ffmpeg can be built to be LGPL, so it would actually be less restrictive.
rough furnace
https://www.gnu.org/licenses/gpl-faq.en.html#UnchangedJustBinary
looks like as long as the source is available it's ok?
fervent vale
It's one thing to let the user download PyQt to use with your application. Another to bundle them together. That would make your application also GPL licensed
Unless the person bought the PyQt commercial licence
rough furnace
I use fbs (which uses pyinstaller) for my internally distributed tool at my company (I use PyQt5 as well)
https://www.gnu.org/licenses/gpl-faq.en.html#InternalDistribution
fervent vale
Yes. Internal company use is explicitly permitted
rough furnace
not going to lie, the idea that I would deploy a pre-packaged Qt application to the web like that is ...terrifying I already support a few dozen users, and run into all sorts of edge cases... but opening it up to anyone? ...
fervent vale
rough furnace
Yeah yeah you all know what I meant 😛
I was wrong about only float and uint16 having numba acceleration. Float and uint16 monochrome have specialised numba acceleration. Other types make use of fn.rescaleData which is also numba accelerated
fervent vale
For the telescope image, you should convert it to RGB888 instead of RGBA8888. The ImageView histogram treats the alpha channel as just another color channel
rough furnace
fervent vale
For the telescope image, you should convert it to RGB888 instead of RGBA8888. Th...
right; i was trying to add the image into a viewbox, but it was flipped vertically (I think this has to do w/ how the coordinate system works in the ViewBox); is that expected that if the image is in a viewbox I should apply a QTransform to get the correct orientation?
fervent vale
rough furnace
right; i was trying to add the image into a viewbox, but it was flipped vertical...
There's an invertY method for that purpose I think
rough furnace
oh right!
(how do I know so little about this aspect of the library and still have merge rights 😬 )
rough furnace
Hey folks, I just turned down a job offer that may be up someone's alley here.
https://akselos.bamboohr.com/jobs/view.php?id=73
I can discuss my interview process and offer. I turned down the role not because of any red flags but because I got another offer elsewhere that I decided to take instead
rough furnace
I just merged Luke's PR to fix a regression, any other PRs we want to merge before doing a 0.12.5 release?
fervent vale
#2185 that provides a new option to override the segmented lines mode heuristic seems useful
fervent vale
For issue #2213, this would allow an easy way to ascertain if the culprit is the segmented lines mode
For testing purposes, being able to force it on allows testing for edge cases. Like for the new glow example.
(Of course, developers can always force it on by modifying the pyqtgraph source)
rough furnace
fervent vale
(Of course, developers can always force it on by modifying the pyqtgraph source)
Yeah, while subclassing is the Qt way, it would be great if we could minimize this
rough furnace
we got work to do on our time-axis plots 😆 https://twitter.com/michaelwaskom/status/1511039532023570436

I worked on understanding this for years and they just … tweeted it out
 Twitter
·
rough furnace
Twitter
·
rough furnace
Changing jobs, this next week is proving to be exhausting
My group went from 3 devs, and after my departure it will be down to 1 dev, a new grad hire whose been out of school for <1 year.. he’s on vacation so I’m having to document all my pass down while handling his duties too. So this has been awesome. On the plus side looks like I’ll be able to open source the Qt application I have been maintaining
fervent vale
PySide6 6.3.0 is out, and there are 2 tests that have issues: test_busycursor.py fails and test_parametertypes.py segfaults. test_parametertypes.py only segfaults on Python 3.10 but not on Python 3.8 and 3.9.
GitHub
pyqtgraph main development repository. Contribute to pijyoi/pyqtgraph development by creating an account on GitHub.
A modified github workflow that runs PySide6 6.3.0 on Python 3.8, 3.9 and 3.10
No issues for PyQt6 6.3.0
import gc
import string

import pyqtgraph as pg
import pyqtgraph.parametertree as pt

def populate_tree_one(tree):
    # this doesn't crash
    root = tree.invisibleRootItem()

    for x in string.ascii_uppercase:
        ch = pt.Parameter.create(name=x, type='str', value=str(ord(x)))
        item = ch.makeTreeItem(depth=0)
        root.addChild(item)

    return tree


def populate_tree_two(tree):
    # this crashes
    root = tree.invisibleRootItem()

    children = [dict(name=x, type='str', value=str(ord(x))) for x in string.ascii_uppercase]
    param = pt.Parameter.create(name='params', type='group', children=children)

    for ch in param:
        item = ch.makeTreeItem(depth=0)
        root.addChild(item)

    return tree

pg.mkQApp()
tree = pg.TreeWidget()
tree.setColumnCount(2)
populate_tree_two(tree)
# tree.show()
# pg.exec()
del tree
print('before GC')
gc.collect()
print('after GC')
I have a standalone example that can trigger the segfault, but it still depends on pyqtgraph, so would not be good enough for a MWE
In the example above, it seems that creating a "group" Parameter is essential to the segfault. Hopefully someone who is more familiar with parametertree can further whittle down this example into an MWE?
mortal grotto
Huh. 15 children has no problems, but 16 children causes a crash. Change range(16) to range(15) and everything works. Still investigating.
import gc
import string
from PySide6 import QtWidgets
import pyqtgraph as pg
import pyqtgraph.parametertree as pt

def populate_tree_two(tree):
    # this crashes
    root = tree.invisibleRootItem()

    ch = [dict(name=f'test{ii}', type='str', value='False') for ii in range(16)]
    param = pt.Parameter.create(name='params', type='group', children=ch)

    for ch in param:
        item = ch.makeTreeItem(depth=0)
        root.addChild(item)

    return tree


pg.mkQApp()
tree = pg.TreeWidget()
tree.setColumnCount(2)
populate_tree_two(tree)
# tree.show()
# pg.exec()
del tree
print('before GC')
gc.collect()
print('after GC')
Huh 15 children has no problems but 16
Commenting out the self.eventProxy line in basetypes.py fixes termination in all cases
Edit: It still happens sometimes when this is performed. But returning a reference to param mentioned below consistently succeeds
mortal grotto
Also, returning a reference to the param that was created in populate_tree_two alleviates problems.
Apologies for spamming the main thread, somehow mixed up my windows. Will continue the discussion below...
mortal grotto
@fervent vale Pyqtgraph free MWE. Produces GC fault on Windows 11, not sure about other systems
import gc
from PySide6 import QtCore, QtWidgets

class X(QtCore.QObject):
    sigTreeStateChanged = QtCore.Signal(object, object)

    def __init__(self):
        super().__init__()
        self.childs = []
        self._parent = None
        self.changes = []

    def treeStateChanged(self, param, changes):
        self.changes.extend(changes)

app = QtWidgets.QApplication([])
# child, parent = [Parameter.create(name='test') for _ in range(2)]
child, parent = X(), X()
parent.childs.append(child)
child._parent = parent
child.sigTreeStateChanged.connect(parent.treeStateChanged)

print('before gc')
del child, parent
gc.collect()
there is another issue too...
pytest tests -k "not parameter"
this will have a segfault on completion; despite no parameter tree tests running
@mortal grotto can you try disconnecting the signal after you connect it and see if it still crashes? (I'm on child-care duties this week while my 6yo is out from school, i'll try and look more closely in the evening)
fervent vale
Thanks to ntjess, a shorter version: ```python
import gc
from PySide6 import QtCore
class X(QtCore.QObject):
signal = QtCore.Signal()
def callback(self):
    pass
child, parent = X(), X()
parent._child = child
child._parent = parent
child.signal.connect(parent.callback)
print('before gc')
del child, parent
gc.collect()
So we have two QObjects that hold a reference to each other; and on top of that one of them connects its signal to the other's method.
I ran it through the modified CI running {PySide6 6.3.0, PyQt6 6.3.0} x {Python 3.8, 3.9, 3.10} x {Windows, Linux, macOS} and it crashes only for {PySide6 6.3.0} x {Python 3.10} x {Windows, Linux, macOS}
rough furnace
i should probably open a bug in the PySide bug-tracker w/ that MWE
obsidian sapphire
💩 ! The free-moving handles are created with a position in a coordinate system scaled to the bounding box of the ROI they're on (i.e. ([0,1], [0,1]) for all points contained in the ROI), but nothing else knows how to think in those coords, and all subsequent positions use the normal-scale, parent coords. Do we want to switch to declaring the handles in un-scaled units, maybe not right now, but as part of a deprecation path, or do we want to teach all the handle-handling code to use the scaled units? I wish all position data could have explicit references to their individual coordinate systems...
rough furnace
I wish all position data could have explicit references to their individual coordinate systems...
omg yes... i would support any effort to go in this direction
I don't use ROIs as much as others (I did recently get a tweet at a paper that made heavy use of pyqtgraph's ROIs, perhaps I should reach out to the authors); but I would be more inclined to think that we should make handle/handling code learn tho deal w/ scaled units.
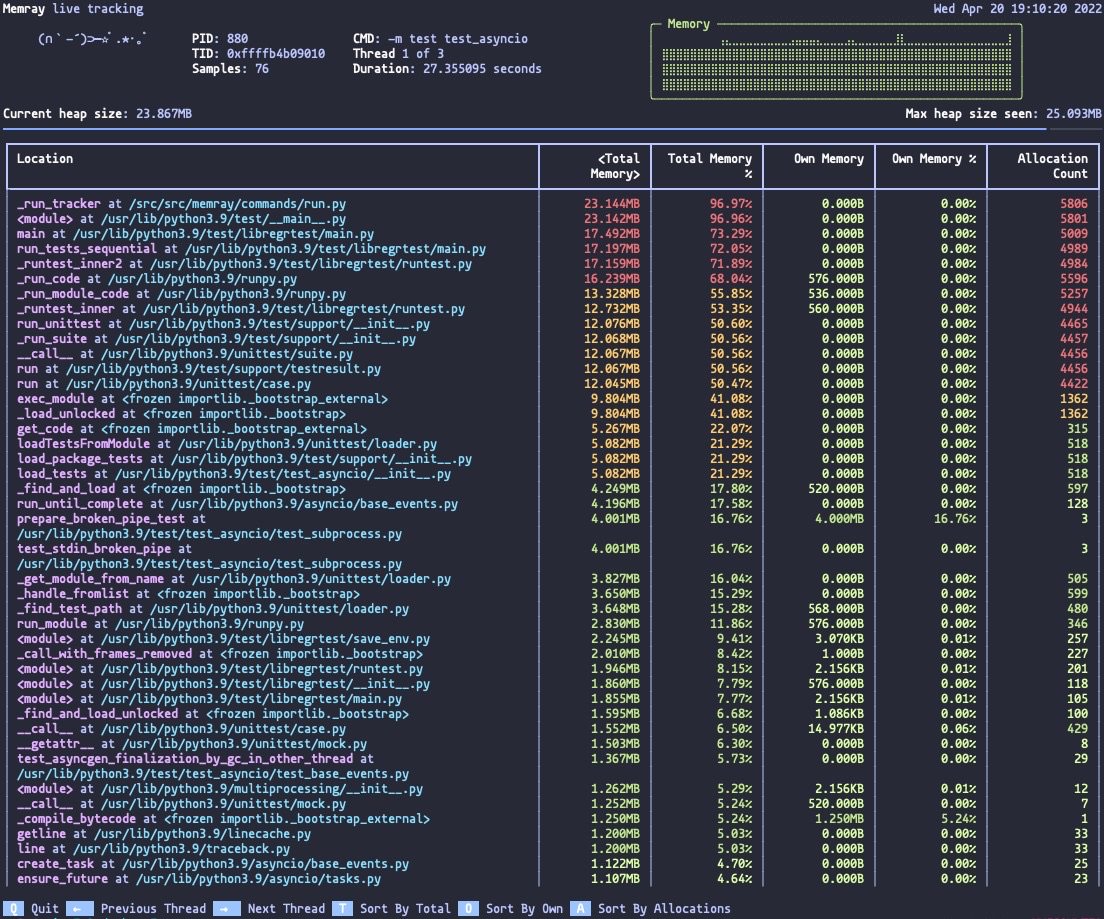
also, looks like bloomberg just opened sourced their memory profiling tool: https://twitter.com/1st1/status/1516859294896906241

WOW.
Bloomberg finally opensourced memray—a new versatile memory profile for Python. Can't way to use it.
Thread 👇
Likes
145
 Twitter
·
Twitter
·
 proper summit
rough furnace
also, looks like bloomberg just opened sourced their memory profiling tool: http...
proper summit
rough furnace
also, looks like bloomberg just opened sourced their memory profiling tool: http...
I'm one of the maintainers, feel free to AMA 🙂
rough furnace
Another maintainer has entered the chat!
@fervent vale has done some amazing work with minimizing copies of arrays in memory. I’d be curious if this tool can help us identify other cases where we are having that sort of thing.
proper summit
probably!
I don't have any better answer for that beyond "try it and see", but the flame graph view should make it pretty easy to see places where an unnecessary allocation is happening
at least if it's large enough to make much of a dent in your process's total heap memory usage
rough furnace
yeah definitely first step is trying for sure
not fair to ask you to comment on it until we at least try that 😆
fervent vale
Someone posted some pyqtgraph screenshots on the pyside gitter channel
To show which examples work on pypy
rough furnace
hmm...wonder how easy it would be to address those, I've never used pypy before
fervent vale
Pypy
rough furnace
just revived my mid-2010 macbook pro (runs the now deprecated/unsupported macOS 10.13/High Sierra). There was a numpy wheel for it for numpy 1.21, current scipy versions, and the latest PyQt5. Running the line plot update still results in ~320 fps on it.
should add, this machine is pretty useless for most tasks.... but somehow pyqtgraph/numpy/qt still work well on it
obsidian sapphire
@rough furnace what's your opinion on deprecating return values? the only clean way to do it is to move to an entirely new fn name, but I'd like to encourage us not to be afraid of fixing things like that. we would maybe want a convention for naming, though.
mortal grotto
@fervent vale and @obsidian sapphire I know you've worked with ImageItem quite a bit, feel free to loop in others who might be interested
I talked to a company quite invested in making pg.ImageItem work for really big (multiple 500MB-1GB edit: file size is misleading compared to array memory) images. Is this something easily supported without memory or fps constraints right now? If not, they would be willing to pay a bounty for the feature to be implemented. They wanted to know what an appropriate cash prize would be and other logistics like timeline etc.
rough furnace
@obsidian sapphire if you have some time, can you read up on #2185 and chime in on the comments, I'm hung up on using booleans or strings for on / off / auto vs True / False / None ... this kind of stuff absolutely paralyzes me, as I likely know on my own I'm likely to suggest something stupid, but if there is some group decision making here, at least I can point the finger at someone else 😄
mortal grotto
Is there a black equivalent for decisions like this? Maybe it's time for a brand-new black-flag: a lib standardization for enums, ternary values, and more 😆
obsidian sapphire
heh. yeah, tools like Sourcery kinda do that with a bunch of flow control patterns, at least.
rough furnace
this one there really isn't a right answer, my opinion is that we should be in-line with the rest of the library API, and if that doesn't match, then we should be in-line with the Qt API, and if that doesn't really fit well, then we're on our own to figure it out.
I think the "correct" solution for this situation isn't necessarily the one that is clearest as the author of the PR suggests, but the one that is most in-line with the rest of pyqtgraph.
this is way way way into personal opinion, and I really don't like mandating PR authors conform to my opinion.
just saw your comment, did a regex search in the repo for 'on' and no matches :/
remote proxy has some matches to 'off'
black will eventually come 😆
 tight cliff
black has some # fmt: off comments to disable formatting, if that was what you are asking
Black reformats entire files in place. It doesn’t reformat blocks that start with # fmt: off and end with # fmt: on, or lines that ends with # fmt: skip. # fmt: on/off have to be on the same level of indentation. It also recognizes YAPF’s block comments to the same effect, as a courtesy for straddling code.
https://black.readthedocs.io/en/stable/the_black_code_style/current_style.html#code-style
oh woops, this is a private channel, sorry to barge in
rough furnace
we welcome visitors @tight cliff ...especially visitors that are our hosts 😄
we're private because not all the maintainers have agreed to migrate from our slack workspace to here
the reference to black is a reflection of the desire from virtually all the maintainers to run black on the entire codebase, the reason we haven't is because of the number of outstanding PRs, which we have been chipping away at for quite some time (once we run black we will have all the merge conflicts)
tight cliff
ohhh, I thought it was about the on/off/auto discussion, woops
rough furnace
the on/off/auto vs. True/False/None has to do w/ a PR we have in our queue detailing an API change and we're debating what the arguments should be
I'm personally team True/False/None due to arguably being more in line with the rest of our API, where-as str representations of on/off/auto better represent the intention here IMO.
@wide prism I know you looked at that on/off/auto issue, but if you can set aside your reference to assembly style programming, I'd be curious to get your thoughts on what would be better
wide prism
Hard to move beyond that... 'on', 'off', 'auto' is clear to read, but
I'd always try putting True or False when writing code.
I think I had some related problem with matplotlib, where there is some parameter that likes 'none' but doesn't like None.
I'd think that obvious True or False parameters should be just that: True or False.
But we can add 'auto' to that list.
Isn't that the extra-special option here that nobody will specify? Because it is the default?
In that case I'd propose keeping None as the internal representation, but making 'auto' a user-facing alternative to specify that.
fervent vale
There's the read back of the config option. Wouldn't be nice to set as 'auto' but to read back as None
wide prism
Hmm. If that actually gets read back, then yeah, consistent "auto" might be the option of least surprise.
Do you know if python does any caching or recycling on string object? Or will option == 'auto' go to string comparison every time?
fervent vale
I don't know what goes on under the hood but I think the drawing time would dwarf any string comparison time.
wide prism
Unless this runs for every point, yeah, you're probably right.
I'll be happy to be outvoted on this 🙂
I'll probably continue to find it strange to see internal state represented as strings, though.
fervent vale
There are actually 2 states. Global config and local config.
The local config fetches its value from the global config
Local config is stored in self.opts and is ambiguous as to whether it's private or user accessible and/or modifiable
rough furnace
Alright, sounds like we have a consensus; I should read over the PR again; will try and do that this afternoon, I have a busy day. @obsidian sapphire if you’re free today and the PR looks good, please merge it 👍
rough furnace
@fervent vale @mortal grotto thanks for your example of the segfault: https://codereview.qt-project.org/c/pyside/pyside-setup/+/409837
looks like they're working on a fix
rough furnace
Pointers to NumPy Arrays to Qt objects or methods
rough furnace
just realized I let the tox.ini config get out of date 😬 guess that's an easy PR I can submit...will do so shortly
mortal grotto
@wide prism how would you feel about a PR for pg.colormap.{get,listMaps} which allows source='any' for finding either local, matplotlib, or colorcet instead of just one source? My use case is allowing the user to pick anything available on the system, and I thought that might be a general use-case
wide prism
I think that is a good idea.
I don't like having the behavior as the default, since it makes it unclear to the user where what map comes from, and thus if others can be assumed to have it.
But as a specifically stated option it sounds great.
mortal grotto
Of course, I think the current default makes sense, and prevents long fetch times (for listing)
wide prism
Heh, I wish I was sure about that. The long fetch time might be mostly on our end, digging through individual files. I think matplotlib might be loading everything from one file, and I honestly don't know how that works out in terms of relative speed here 🙂
mortal grotto
I also wasn't sure about the try -> ImportError overhead given the whole sys.path fiasco of python. Not a huge deal, but explicit is often better than implicit in any case
fervent vale
Parsing all of the csv files was one of the causes of the long startup time of the colormaps example
wide prism
I am not particularly attached to that code, if anyone has a good speed-up, we can put that in. I think the current code is "good enough" since loading all the csv files shoudl basically only ever happen in the example.
Keeping the maps as raw files is supposed to lower the barrier of entry to loading your own maps: Just look at what we have and copy the format.
Is there some way to limit the map loading during the test suite? That's the one place where the slowdown is painful.
rough furnace
Just stumbled across QCustomPlot, a Qt C++ library for doing plotting. I saw they have support for multi-axes plots, a feature many folks have been looking to add to the library; might be worthwhile to try and emulate QCustomPlot's API https://www.qcustomplot.com/index.php/demos/advancedaxesdemo
QCustomPlot is a Qt C++ widget for plotting. This plotting library focuses on making good looking, publication quality 2D plots, graphs and charts, as well as offering high performance for realtime visualization.
 still laurel

 wraith mist

 minor niche
And so it begins
 distant surge
hi there
 main thunder
👋
still laurel
Hey everyone from Latvia!
 viral dawn
mm
 sudden briar
hmm
rough furnace
welcome newcomers, I'm here to convince you that using this library might occasionally be in your best interest!

 raven mountain
Hello new channel
 wild umbra
hello contributors!
rough furnace
For those that don't know, PyQtGraph focuses on being a high performance interactive library that gets embedded within Qt applications (although you can certainly run a Qt application just for doing a plot in pyqtgraph, that's perfectly fine).
We require numpy and any modern Qt bindings to be installed; and as of right now, python 3.8+ (per NEP-29)
once you have numpy and some Qt bindings installed, you can run python -m pyqtgraph.examples to see some basic use cases of the library and some of the benchmarks
if you're interested in contributing to the library, we can use help from all sorts of areas; we need help w/ opengl and SVG support ... if you have experience with numba, there are likely places in the library that would benefit from numba acceleration as well
 uncut ore
I have one practice project with pyqtgraph, the one thing I am sorta stuck on is having the parameter tree influence the currently plotted trajectory
mortal grotto
I can help with that 😁
uncut ore

Bad code warning: https://github.com/brad90four/snippets/blob/main/ballistic_animation_V2.py
I'm assuming I need to have the "plotting" moved into a function, and then have the initial values from the parameter tree and the plotting function on some kind of event loop?
rough furnace
@uncut ore just fyi @mortal grotto is the parameter tree expert
also @uncut ore I see you trying to solve your physics homework 👀
rough furnace
wait, are you using the animation capability of arrow item?
this might be the first usage of that I've seen in the wild 🎊
uncut ore
I might have had a convo with you in the past about it, and about possibly exporting the animation to a gif or mp4 format
rough furnace
QAnimation support to ArrowItem was added as a test before my involvement w/ the library started, from what I've gathered it was one of those things that just looked so easy that Luke (original author) decided to add to see what would happen.
I don't think we offer any kind of export capability for animations/movies natively, would totally entertain that discussion tho; right now suggested scheme is to export a png of every frame, and use ffmpeg to make a gif or mp4 out of it
mortal grotto
I've done something a little similar, but not with animations
 uncut ore
Is the PNG export already implemented?
 mint kestrel
Hi guys
rough furnace
uncut ore
Is the PNG export already implemented?
yes
we support svg export too (although there are a handful of issues in the issue tracker)
looking qt QMediaRecorder I think exporting to a mp4 might not be out of the realm of reason
uncut ore
mortal grotto
I've done something a *little* similar, but not with animations
Oh that is sweet!
rough furnace
@uncut ore if you think you're ready to give a mp4 export a good shake, message me, I'll give it a shake and see at least there are some easy solutions to implement within Qt directly
uncut ore
Sounds good, it is likely a bit beyond me right now but if I come up with something I'll for sure give you a shout
rough furnace
yeah, the qt multimedia stuff is a bit complex and weird... would definitely be a tough thing for someone new to the framework to try and figure out
mortal grotto
@uncut ore something like this? 🙂
 mortal grotto
The gif didn't change label text, but this code has it
You were close!
You just had to make a function that re-evaluates parameters each time an event happens (like pressing "go")
uncut ore
Ahhh that is sweet
Would moving the TextItems into the run loop also update the labels?
mortal grotto
Yep!
 vestal jay
is pyqtgraph better than matplotlib?
mortal grotto
Same with setting curve data -- Qt handles it all for you*
- depending on the time taken to complete actions it might lag, but that won't be an issue for your code
mortal grotto
vestal jay
is pyqtgraph better than matplotlib?
For some things yes, others no
There's a good comparison here: https://www.pyqtgraph.org/
rough furnace
vestal jay
is pyqtgraph better than matplotlib?
no, it's different, matplotlib devs have been great to us, we consider ourselves BFFs
website highlights differences, pyqtgraph is a much smaller project that works really well in a smaller niche than matplotlib; matplotlib has far more static plot capability (and it's not even close)
rough furnace
take a look at the example app python -m pyqtgraph.examples they will highlight how to create some basic plot GUIs, if you're looking for something a little more complex/feature-full, you can look at some Qt tutorials, realpython has some, and if you need something more robust, I think pythonguis.com has some articles too
Qt is a big framework, you won't learn it in a day/week/month but it doesn't take long to get started
 true hearth
Thx
 hexed nova
I was wondering if this library has good collision detection with shapes?
Ex can it tell if/where 2 circles intersect?
rough furnace
hexed nova
I was wondering if this library has good collision detection with shapes?
Ex ca...
Pyqtgraph doesn’t have anything like this baked into the library but the Qt graphics view framework might have something which should integrate with ease. I’d have to check the docs.
hexed nova
Ok thank you just wondering.
rough furnace
hexed nova
Ok thank you just wondering.
Based on this example adding collision detection should be a piece of cake and depending on your use case require no pyqtgraph changes https://doc.qt.io/qt-5/qtwidgets-graphicsview-collidingmice-example.html
@fervent vale thanks for chiming in on #2308 , goodboy has been messaging me on this perceived issue for some time now. I still don’t understand what the issue he thinks the code-base has.
fervent vale
rough furnace
<@862941683460210688> thanks for chiming in on #2308 , goodboy has been messagin...
I think there is some misunderstanding on the purpose of reserve. But he is also right that if the API were allowed to change, one could reuse the memory of old QPainterPaths
rough furnace
Anything can change; would need a good case for it is all.
EDIT; do you think there is substantial benefit for preserving the QPainterPath instances?
 warm vortex
wow
an opensource plotting lib in pydis
oh wait this has been here since 2021?
guess i didn't see it
rough furnace
warm vortex
oh wait this has been here since 2021?
We were private for quite a while
fervent vale
QPainterPath reuse
mortal grotto
Has anyone successfully attempted running a pyqtgraph GUI inside a docker container? I've followed 5+ solutions so far and nothing worked yet
uncut ore
Following up on the animation from yesterday, is there a way to get each "frame" created by the CurveArrow's makeAnimation method? I would like to export each frame to then animate with PIL's Image function
...
a = pg.CurveArrow(curve)
...
def run():
    ...
    global animation
    animation = a.makeAnimation(loop=-1)
    animation.start()
    exporter = pg.exporters.ImageExporter("Not sure what to put here")
    exporter.export(f"{item}.png")
Might need X server?
mortal grotto
That won't quite work, because "run" is only called once. So you would get a picture of the initial setup, but not any of the subsequent frames
uncut ore
Right, the animation.start() is the loop that is "moving" the arrow along the curve
But I can't access the individual frames (I think)
mortal grotto
You can connect to the stateChanged signal with a new function that is responsible for taking a screenshot

Are you familiar with signals and slots? They are powerful tools in the Qt ecosystem
mortal grotto
No worries! They're pretty straightforward once you learn the basics. I'll send over a very rough implementation. Lol, there are probably significantly more efficient ways of making this happen
uncut ore
Something along this should be good to pick it up? https://www.pythonguis.com/tutorials/pyqt6-signals-slots-events/
mortal grotto
uncut ore
Something along this should be good to pick it up? <https://www.pythonguis.com/t...
Looks great!
mortal grotto
So I misunderstood the "stateChanged" signal, which only fires when the animation changes from starting to running to stopping. Instead, you can use a timer
Also, since your animation re-loops indefinitely, the "finished" signal connection doesn't help much and screenshots will continue as long as the app is open. You will need different logic to prevent that
Also make sure the screenshotFolder exists or you will get an error trying to save the exporter
uncut ore
mortal grotto
So I misunderstood the "stateChanged" signal, which only fires when the animatio...
Whoa! Thank you so much for the full response
rough furnace
mortal grotto
Has anyone successfully attempted running a pyqtgraph GUI inside a docker contai...
I have but I haven’t actually rendered the results on my display; just rendered things to the virtual frame buffer
rough furnace
uncut ore
Something along this should be good to pick it up? <https://www.pythonguis.com/t...
yup, the Qt signal/slot mechanism is one of the core components of the framework; many built-in Qt objects have their own signals you can tap into (connect to your own slots) to get the kind of GUI behavior you want.
uncut ore
Updates: aligned the animation duration and screenshot timer to get close to 30fps based on the "flight time" https://github.com/brad90four/snippets/blob/main/ballistic_animation_V2.py

 pale musk
thats mighty nice
uncut ore
Huge props to ntjess and j9ac9k for the hand-holding though
Now to try my strava visualizer in pyqtgraph....lol
rough furnace
@uncut ore instead of the textitems pointing to range and max height, you can consider using TargetItem https://pyqtgraph.readthedocs.io/en/latest/graphicsItems/targetitem.html
let's you use a textbox attached to a scatter plot symbol so you can have an arrow pointing to specific points in the curve w/ text
you can see some examples of it in action in the infinite line example
uncut ore
rough furnace
<@698273827448291379> instead of the textitems pointing to range and max height,...
.bm
mortal grotto
A few minor improvements (minus TargetItem)
- Clean out old pngs in case you're running twice
- Avoids re-creating text items in the "run" loop
- Locks aspect ratio to treat x- and y-units similarly
- Autoranges axes on new run
🤦 Would help if I attached the file

@rough furnace This is shaping up to almost be a reasonable pyqtgraph.examples entry lol
rough furnace
mortal grotto
<@369662814488363009> This is shaping up to almost be a reasonable `pyqtgraph.ex...
yeah I would agree w/ that, we do have an arrow item example as it stands no?
mortal grotto
It's not interactive tho 😁
If I were to submit a PR I'd make a GraphicsItem stick man and the goal would be to hit it with the projectile 😆
Should be reasonably doable! You could even make it fall over if you successfully aimed
rough furnace
need an animated battleship game
demonstrating pg.GraphicsLayout (top view + side view)
 elder eagle
Instead of saving frames as PNGs and then assembling them into an animation via PIL, ffmpeg in input-via-pipe mode can be used; that's much more performant. You can see an example here:
https://github.com/RundownRhino/Cellular-Automata-Simulator/blob/public/video.py#L9-L10=
 runic umbraBOT
video.py lines 9 to 10
class Recorder:
"""Handles the recording of a video from frames using ffmpeg"""```re this^
uncut ore
elder eagle
re this^
.bm
rough furnace
if someone submitted a PR to have optional ffmpeg support into pyqtgraph for exporting purposes, I would totally accept that
 dim wave
hey guys am trying to install pyqt5 on mac but am getting a erorr
rough furnace
dim wave
hey guys am trying to install pyqt5 on mac but am getting a erorr
pip install pyqt5 doesn't work?
@dim wave fyi i don't really do support on DMs, I often have to put the computer away, parenting duties call me, and likely someone else can help you if you describe your issue.
 copper lily
rough furnace
`pip install pyqt5` doesn't work?
copper lily
rough furnace
`pip install pyqt5` doesn't work?
pip3 on Mac isnt it or what was that about
rough furnace
copper lily
pip3 on Mac isnt it or what was that about
python3 -m venv .venv
source .venv/bin/activate
pip install pyqt5
That doesn’t work? What’s the error message
 pearl heart
Hey, I wanna know how to install this pyqtgraph.
Ping me or DM me, if anyone know this.
 cedar trail
pearl heart
Hey, I wanna know how to install this pyqtgraph.
cedar trail
pearl heart
Hey, I wanna know how to install this pyqtgraph.
did you try pip install pyqtgraph?
https://pyqtgraph.readthedocs.io/en/latest/installation.html
cedar trail
pearl heart
Or just pyqtgraph?
just that
pyqtgraph has been built with pyqt
rough furnace
You need to install some Qt bindings,, 5.12+ or 6.1+
 median remnant
rough furnace
welcome newcomers, I'm here to convince you that using this library might occasi...
median remnant
rough furnace
welcome newcomers, I'm here to convince you that using this library might occasi...
What even are those?
median remnant
mortal grotto
I've done something a *little* similar, but not with animations
I have done stuff like that in DL
 polar onyx
Hi, please stick to the channel topic :)
 solid dock
Where can I download this?
mortal grotto
If you're asking about the pyqtgraph package, you can get it from pypi.org (pip install pyqtgraph), github (https://github.com/pyqtgraph/pyqtgraph), or conda forge (not sure if the conda one is recommended due to some complicatoins with the Qt libraries available with Conda)
 torn minnow
is this like matplotlib but better and simpler than opengl?
rough furnace
@fervent vale
The current snapshots (PyQt5, PyQt5-sip, PyQt6, PyQt6-sip) allow you to
create a sip.array object like this...

from PyQt6.sip import array
from PyQt6.QtCore import QPoint

points = array(QPoint, 4)

The array is mutable, so...

points[1].setX(10)
points[1].setY(20)

The SIP support for the /Array/ annotation has been changed so that any
argument so marked will accept either a sip.array of the appropriate
type (in which case no conversions are necessary) or a Python sequence
(in which case the sequence is converted to a temporary array on the
fly).

All of the relevant QPainter methods now have support for /Array/, so...

painter.drawPoints(points)

You can test if the support is present just by checking if the sip
module has the 'array' attribute.

Please test.```@torn minnow For unchanging publication plots, matplotlib is significantly more mature and feature-full. For real-time analysis (i.e. streaming data), integration into larger applications, and a few other tasks, pyqtgraph seems to do pretty well
You can check out the "Comparison to other python graphics packages" here: https://pyqtgraph.org
torn minnow
mortal grotto
<@555944200047296513> For unchanging publication plots, matplotlib is significan...
cool
ModuleNotFoundError: No module named 'OpenGL'
import numpy as np

import pyqtgraph as pg
import pyqtgraph.opengl as gl
from pyqtgraph.Qt import QtCore
If you're doing the 3D examples, opengl is one of the requirements: https://github.com/pyqtgraph/pyqtgraph#optional-added-functionalities

GitHub
Fast data visualization and GUI tools for scientific / engineering applications - GitHub - pyqtgraph/pyqtgraph: Fast data visualization and GUI tools for scientific / engineering applications
You can check out some pre-made examples at python -m pyqtgraph.examples once you have pyqtgraph installed
rough furnace
i will point out our opengl implementation is likely ...sub-optimal; the 3D portions of our library generally do not get as much attention as the 2D portions. If anyone here has OpenGL experience, we would love your input on where things can be done better.
fervent vale
pijyoi1836
rough furnace
just noticed that conda-forge failure; looks like there was an update to the pyside2 conda-forge feedstock 4 days ago
fervent vale
rough furnace
just noticed that conda-forge failure; looks like there was an update to the pys...
Interesting. The test failed for test_qimage_writethru.py. Failed the zero-copy test
rough furnace
conda-forge pyside2 was upgraded from 5.13.2 to 5.15.4; so lots of changes there
fervent vale
Remote Graphics View should show a blank image then
rough furnace
i just asked someone on twitter where I should direct this sort of bug-report; conda-forge feedstock repo for pyside2 says issues should be limited to issues w/ installation...
fervent vale
Fortunately almost all the code was migrated away from assuming write-thru behaviour
fervent vale
zero copy QImage
rough furnace
@proper summit trying to run memray on my linux VM; got an issue here complaining about CXXABI_1.3.11 not found
Happy to move this discussion somewhere else or to an issue tracker if you'd like.
I'm running this in an ubuntu VM with apt-get install libunwind-dev liblz4-dev per the README instructions.

I tried running from source, but but a different error:
 mortal grotto
@rough furnace are you OK with a PR to add this discord link in "Support" section of readme?
rough furnace
mortal grotto
<@369662814488363009> are you OK with a PR to add this discord link in "Support"...
Please!
proper summit
rough furnace
<@451976922361102357> trying to run memray on my linux VM; got an issue here com...
What version of Ubuntu? I wonder if it's just too old to provide the C++17 ABI we depend upon. Feel free to open an issue (if you haven't already - I've been on vacation and I'm just catching up)
proper summit
The compilation error you got when trying to build it from source is definitely related to the old gcc 5 compiler not supporting the C++ 17 standard
obsidian sapphire
okay, so I need build two new plot options: 2nd derivative and a low-pass filter (with configurable cutoff freq). I don't think I want to include these by default in pyqtgraph? I would be happy to make them standard, but they begins to feel like a lot of noise in the plot options menu.
obsidian sapphire
huh... the 1st-derivative plot option is behaving poorly in my app: it initially redraws with the derivative applied, but subsequent redraws revert to the unadulterated data.
rough furnace
proper summit
The compilation error you got when trying to build it from source is definitely ...
I had to install gcc-5 for something else; this Ubuntu 20.04 I’ll install a newer gcc and try again. Thanks for the reply!
rough furnace
@proper summit I got myself sorted out, thanks again for your help!
proper summit
Ah, great, glad you got it!
rough furnace
memray usage here is somewhat nice right now as Riverbank Computing (authors of PyQt4/5/6) are giving us access to an experimental way to pass numpy arrays to Qt's draw methods more directly; potentially with zero-copy operations, so being able to quantify the improvement memory wise is super helpful.
rough furnace
 gentle arch
anyone could help fast to install pyqtgraph at vscode?
gentle arch
anyone could help fast to install pyqtgraph at vscode?
install it like any other package pip install pyqtgraph in your active virtual environment.
(you will need to decide which qt bindings to install as well, if you don't know, or don't care, I would recommend installing PyQt5 bindings pip install pyqt5 )
gentle arch
so i cant start my virtual enviornment
rough furnace
probably should post to one of the help channels for help with that 👍
 thin hazel
@gentle archhave you ever started any virtual environment?
obsidian sapphire
I'm going to rubber ducky at this thread while I work on this transform refactor.
obsidian sapphire
how is saveState/restoreState being tested currently?
test_dockarea has some calls
but that doesn't have any plots
mortal grotto
obsidian sapphire
how is `saveState`/`restoreState` being tested currently?
I was about to type a message since I have a PR about that now but I see you aren't referencing parameter trees
obsidian sapphire
😆 nice! yeah, no, I'm only working on PlotItem at the moment.
obsidian sapphire
okay, math friends, this might be important. why would doing log scaling on an FFT necessitate dropping the 0th term? I don't get errors or noticeable visual discrepancies for any of the Basic Plotting plots.
is it that log(0) == inf, and therefore the log is invalid at that point?
I guess if I plot y=0, maybe it'll be apparent?
fervent vale
The 0th term has x-coord 0
obsidian sapphire
A[0] contains the zero-frequency term 0*fs, which is real due to Hermitian symmetry.
(that's from the rfft docs)
which I guess is what you're saying? 0*fs should always be zero; I don't know why they would bother saying that, then.
(fs is the sample freq)
okay, maybe this only comes up if I'm plotting complex numbers?
fervent vale
Whether the input data is real or complex, the freq coords are the same
Whether or not taking log(X) of the frequency coords makes sense is another matter
obsidian sapphire
oh! I wonder if this is masking the potential problem: self.x[nonfinites] = np.nan # set all non-finite values to NaN
fervent vale
Taking log(Y) of abs(fft(data)) displays the magnitude in roughly decibel scale
obsidian sapphire
(that snip is from the log scaling)
fervent vale
Yes, it was also partially responsible for the histogram plot issue
So what you are saying is that with the addition of that snippet, it is no longer needed to drop the 0th fft term for log X?
obsidian sapphire
That was my thought, yeah. I just tried again with the inf->nan lines commented out, and I still wasn't able to trigger any errors or weird graphs.
fervent vale
It would also pass through arrayToQPath which has to remove non- finites
The 0th x term would then get replaced by the 1st x term
obsidian sapphire
Well, so, my actual goal is to be able to decouple log and fft transforms. If the fft code is pre-emptively removing zeros only to prevent log(0), then it's safe to remove that logic. Is there any other reason to drop/shift away that 0*fs term?
fervent vale
I think it used to be that several years ago, log X of fft mode would throw exceptions
obsidian sapphire
oof. okay, I'm going to keep pushing ahead on this under that assumption. the git log for these lines does have the first bin causes an error, and it looks like that's no longer true!
(also, thanks for talking through that with me!)
 lusty moat
What's pyqtgraph used for
rough furnace
lusty moat
What's pyqtgraph used for
it's used when you want a plotting library with interactivity (mouse/keyboard events) or need rapid updating (example you have live sensor data coming in). It's often found used in experimental research settings, but by no means is it limited to that audience.
What it is not is a matplotlib replacement/derivative. While pyqtgraph can generate static plots, other libraries generally work much better in that regard.
lusty moat
I see
mortal grotto
I know it's a really simple tool, but I was able to use pg.debug.Profiler to turn a 3-second operation into 977ms 🙂 Such an easy way to find the bottlenecks!
If it was more commonly used, I would submit a PR to threshold such that only perf times > threshold get printed, but it would require a bit of a redesign
rough furnace
there is actually a PR for that very feature right now 😆
feel free to review/give feedback on it and merge it when you think it's ready 👍
#2281
 quartz tiger
pyqtgraph/pyqtgraph#2281
 supple leafBOT
 quartz tiger
our bot can be useful sometimes
mortal grotto
A quick search didn't reveal any comments from him; @rough furnace do you know if goodboy is in this discord? My gut reaction is the logging module would fit with a lot less hassle and more flexibility for something like this. I don't think the performance overhead of logging vs custom printing is too huge, but I'd need to run some tests. Unfortunately, that would invalidate lots of logic from the PR. But it would let you choose different output streams, several separate thresholds (i.e. a LoggingHandler for each threshold set), different logging levels for different threshold severities, and so on.
rough furnace
i do think introducing logging module would be a very worthwhile thing to do; but I don't think it necessarily belongs in this PR
regarding logging performance; I think logging messages were highly optimized for the %s syntax of string interpolation (vs. str.format() or f"")
mortal grotto
I guess to clarify I don't mean incorporating logging everywhere in pyqtgraph, I just meant for updating the profile to log filterable messages instead of adding time threshold logic. Though you're right, that could always come later since it would still be convenient to allow a Profiler signature that stays the same as this PR
rough furnace
ooo i see what you're getting at...
that would indeed be a better way of going about it ...especially if we just limit scope to debug.Profiler() ... if you do suggest it, i would put a comment about how to do the logging and filtering at least so they don't have to figure it out.
goodboy isn't here, but he was on our slack channel, but he hasn't been active there in recent months
mortal grotto
👍 that would be the goal
Shame, it's a lot easier to discuss via threads instead of PR comments, lol
torn minnow
This project is really cool I will be adding it to my work flow
The live updating features and 3d graphing is one of the best
mortal grotto
pyqtgraph/pyqtgraph#2322 is live as a hopeful replacement of 2281
supple leafBOT

 loud fjord
i got a question:
how to make a pyqt5 window which stays top of a specific pyqt5 window
rough furnace
loud fjord
how to make a pyqt5 window which stays top of a **specific** pyqt5 window
not sure how to easily do that, would likely have to iterate through the other Qt windows and see if there is any overlap, and then manually set a window on top of another. Generally making one window sit on top of all windows would likely be far far easier.
rough furnace
loud fjord
how to make a pyqt5 window which stays top of a **specific** pyqt5 window
i would consider posting in #user-interfaces there may be more Qt folks over there that may have better suggestions.
loud fjord
k
obsidian sapphire
More rubber duckies here
rough furnace
@fervent vale does the audio on this chat sound like absolute garbage on your end too or is it just my machine?
fervent vale
It sounds okay to me
rough furnace
huh, ok, thanks for the sanity check
@fervent vale is there a time-range that typically works well, sounds like they wanted to have a longer discussion on the whole passing numpy arrays bit
rough furnace
ok, right now is on the early side, but doable for me
actually early is good as kids aren't up yet 😛
fervent vale
It doesn't have to be void pointers... Think that gives people the wrong idea
Could be anything that supports the python buffer protocol
In [25]: lines = np.zeros((3, 4), dtype=np.float64)
In [26]: mv = memoryview(lines)
In [27]: mv.shape
Out[27]: (3, 4)
In [28]: mv.format
Out[28]: 'd'
e.g. their drawLines should accept any python buffer of doubles that has a shape of (nlines, 4)
It just seems odd to me that they would prefer drawLinesNp(x1, y1, x2, y2) (based on what the current drawPointsNp looks like)
rough furnace
(magically my speakers are working again without sounding like absolute rubbish)
yeah I went w/ the void pointer to use an example of how we currently do it, but if they're more partial to drawWhateverNp methods, I'm sure we can work w/ that too
torn minnow
Is possible to change the opacity a point/line in pyqtgraph?
rough furnace
torn minnow
Is possible to change the opacity a point/line in pyqtgraph?
yes! you need to modify the pen color being used on the line to add alpha
fair warning if you have > 1 px thick line you'll see major performance penalties with using a color with some transparency
mortal grotto
@torn minnow Maybe you already know this, but if you want to apply the same opacity to all points or the whole line, you can also change the opacity of the underlying item:
item = pg.PlotCurveItem() # Or whatever your item is
item.setOpacity(0.5) # hardly any performance penalty compared to setting a pen with alpha
Do we want to set the e.g. log-mode of a PlotDataItem separate from its parent PlotItem? The PlotDataItem doesn't have access to its axes, to be able to set them up appropriately. I feel like I should just deprecate all of the PlotDataItem.set*Mode methods and redirect users to the PlotItem-level controls, regardless of the rest of my current work.
@wide prism you did a bunch of this work. what do you think?
Also, what do people think of this UI for the dynamic parameters of a custom data transform? I'm just sticking a ParameterTree into the second column of a grid layout, but if there are other good ideas, I would be willing to play around with it.
 rough furnace
@wide prism ☝️
torn minnow
mortal grotto
<@555944200047296513> Maybe you already know this, but if you want to apply the ...
thx for the info
wide prism
obsidian sapphire
<@702383444180860928> you did a bunch of this work. what do you think?
Ideally, there would be no reason for just one PlotDataItem to ever have a different transform/mapping mode than others in the same plot.
But ideally, all items would also understand the transforms/mappings and coordinate with the axes to plot accordingly. There it sounds like going through PlotItem would be great.
But until some of that works, I am somewhat undecided on removing the methods in PlotDataItem...
They might be good to have for forcing reproducible behavior for a while longer. Deprecation with an indefinite expiry time for now, maybe?
rough furnace
I'm good rolling out deprecation warnings, but we should have something else in-place that we can suggest users use instead
obsidian sapphire
👍
oh, damn; the order of these transforms is very significant; if you do your dy/dx before your low-pass filter, the noise dominates, but in the other order, you get the derivative of the sensible part.
maybe these need to be reorderable? just add on some handlebars to each one...
rough furnace
is what you're trying to do have some overlap w/ the flowchart module?
fervent vale
rough furnace
(magically my speakers are working again without sounding like absolute rubbish)...
A drawLinesNp(x1, y1, x2, y2) would definitely not be zero-copy. PySide binding would need to convert it into an array of QLineF for every call, even with no change in data.
rough furnace
fervent vale
A `drawLinesNp(x1, y1, x2, y2)` would definitely not be zero-copy. PySide bindin...
:/
rough furnace
@fervent vale am I putting too much value in zero-copy here? I mean, at a glance not having to allocate 2x the memory for something like this seems fairly beneficial, I don't have much experience w/ this kind of lower level programming so I likely have strong misconceptions here
obsidian sapphire
rough furnace
is what you're trying to do have some overlap w/ the flowchart module?
I don't think we need to have nearly that much flexibility, but yeah, a linear-flow-only flowchart is what's happening here.
fervent vale
rough furnace
<@862941683460210688> am I putting too much value in zero-copy here? I mean, at ...
Given nlines, the PySide binding would need to allocate and populate nlines* 4 * 8 bytes for every call; with no chance of reusing this allocation.
Zero-copy also implies zero-alloc
rough furnace
ahh, so if it's not going to happen for drawLines regardless probably should just forget about it then 😬
fervent vale
In our current implementation, it's cached alloc and vectorized population on pyqtgraph side; on the pyside side, there will be a conversion from python list to c++ array (not zero-copy)
rough furnace
right, but what we're asking from them is to be able to take a numpy array (or a voidPtr to a numpy array, or some alternative), so we can do away w/ even having a python list to begin with. I mean, for all I know here this is a non-issue.
fervent vale
Yes, that would be ideal. Take a python buffer, treat it as nlines * 4 doubles and pass it directly to drawLines with no conversion
In my opinion, removing some XML lines from their binding generation would do the trick
rough furnace
yeah i'm bummed they didn't address your comment in chat earlier
fervent vale
I realised that QPolygonF actually follows the same pattern as drawPixmapFragments
rough furnace
i should have said something about it, sorry about that.
rough furnace
fervent vale
I realised that QPolygonF actually follows the same pattern as drawPixmapFragmen...
oh nice, think we can get-away with use drawPolyline instead of drawLines ?
fervent vale
QPolygonF.data() returns an instance to the first QPointF element
Calling shiboken.getCppPointer() on that returned instance gives the pointer to the array of QPointFs
I mean it's the reverse analog of drawPixmapFragments
In drawPixmapFragments, we pass it an instance to the 1st element of the PixmapFragment array
rough furnace
silly question, where is the XML file(s) you're referring to w/ the signatures?
fervent vale
It's under lib/site-packages/PySide6/typesystem_gui_common.xml
Search for drawLines
There's xml there to remove unwanted C++ signatures
rough furnace
i'll try and rebuild a pyside package w/ that change and see what happens
fervent vale
Tell me if you need me to provide an example. Can modify it from the pyqt sip array MWE
rough furnace
an example will likely be helpful, i'm pretty tired, so if I run into too many issues trying to build pyside i'll likely give up before too long 😛
fervent vale
Yeah, I don't want to kill my machine building Qt
It's nice that PyQt bindings can be built with no extra files
rough furnace
you don't have to build qt to build pyside
fervent vale
Do I need to download Qt sources to build PySide?
rough furnace
i think you need Qt installed so you can point to qmake
CMake Error at cmake/ShibokenHelpers.cmake:162 (find_package):
  Could not find a package configuration file provided by "Clang" with any of
  the following names:

    ClangConfig.cmake
    clang-config.cmake

  Add the installation prefix of "Clang" to CMAKE_PREFIX_PATH or set
  "Clang_DIR" to a directory containing one of the above files.  If "Clang"
  provides a separate development package or SDK, be sure it has been
  installed.
Call Stack (most recent call first):
  cmake/ShibokenSetup.cmake:39 (setup_clang)
  CMakeLists.txt:11 (include)
ain't nothing easy 😛
fervent vale
 rough furnace
i see going for the no-intention 😆 i can sort that out
ok needed llvm installed too... and had to set an environment variable... laptop is now moving to space-heater mode
EDIT: ok now just errored later in the build process...
wide prism
maybe these need to be reorderable just
fervent vale
Ok, I managed to build PySide2 (QtCore, QtGui only) against system Qt5 in WSL2 Ubuntu 20.04 with the drawLines(QLineF*, int) signature left intact. The benchmark script above yields 621 fps (without array) vs 918 fps (with array).
In [2]: QtGui.QPainter.drawLines?
Docstring:
drawLines(self, lines: PySide2.QtCore.QLineF, lineCount: int)
drawLines(self, lines: typing.List[PySide2.QtCore.QLineF])
drawLines(self, lines: typing.List[PySide2.QtCore.QLine])
drawLines(self, pointPairs: typing.List[PySide2.QtCore.QPointF])
drawLines(self, pointPairs: typing.List[PySide2.QtCore.QPoint])
Type:      method_descriptor
So yes, it would be as simple as removing the offending xml lines...
Using the system Qt5 avoids having to download the sources from the Qt Company
diff --git a/sources/pyside2/PySide2/QtGui/typesystem_gui_common.xml b/sources/pyside2/PySide2/QtGui/typesystem_gui_common.xml
index 13f8f3cbf..ed8ef4327 100644
--- a/sources/pyside2/PySide2/QtGui/typesystem_gui_common.xml
+++ b/sources/pyside2/PySide2/QtGui/typesystem_gui_common.xml
@@ -1851,7 +1851,7 @@
     </add-function>
     <!-- ### Overloads using QVector<T> does the job of these methods -->
     <modify-function signature="drawLines(const QLine*,int)" remove="all"/>
-    <modify-function signature="drawLines(const QLineF*,int)" remove="all"/>
+    <!-- <modify-function signature="drawLines(const QLineF*,int)" remove="all"/> -->
     <modify-function signature="drawLines(const QPoint*,int)" remove="all"/>
     <modify-function signature="drawLines(const QPointF*,int)" remove="all"/>
     <modify-function signature="drawRects(const QRect*,int)" remove="all"/>
nice work!
rough furnace
still running into build issues w/ Qt 6.3 but I almost have it
rough furnace
$ pip install PySide6-6.4.0a1-6.3.0-cp39-cp39-macosx_12_4_x86_64.whl
ERROR: PySide6-6.4.0a1-6.3.0-cp39-cp39-macosx_12_4_x86_64.whl is not a supported wheel on this platform.
🤦♀️
mortal grotto
For those with more Qt familiarity -- When I spawn a QWebEngineView, there is an unsuppressable stderr printout originating from this function in Qt source: https://sources.debian.org/src/qt6-webengine/6.2.4%2Bdfsg-8/src/core/web_engine_context.cpp/#L263
My first thought was to check if this QLoggingCategory could be disabled temporarily, given it has an entry in the PySide6 docs: https://doc-snapshots.qt.io/qtforpython-dev/PySide6/QtCore/QLoggingCategory.html
It is also referenced in the Bluetooth error filtering section: https://doc.qt.io/qtforpython-6/PySide6/QtBluetooth/index.html
However, attempting to access it gives an AttributeError so it probably isn't actually packaged (testing on PySide6==6.3.0).
As a result, I put the calling code in another python file and created a Process that set stderr to print to os.devnull. This has several obvious downsides, but at least works. Is anyone familiar with any ways to temporarily suppress these kinds of Qt debug statements that don't involve subprocesses?
rough furnace
oh i've done some filtering of messages like that before ...hold on
https://github.com/j9ac9k/barney/blob/main/src/barney/BarneyApp.py#L52-L95
look at how I do the regex match
qInstallMessageHandler passing to another method there, and then you should be able to catch/filter messages there
mortal grotto
Neat! So they integrate with the logging module?
mortal grotto
Oh nvm, I misread your code initially. So QLogggingCategory isn't available but you can still intercept the logged messages. Thanks! None of the terms I was googling led me down this direction
rough furnace
I should add, I'm not making any claims on this being the "correct" way of doing it; it's just how I did it 😆
mortal grotto
Better than a subprocess that suppresses any stderr printouts 😆
rough furnace
but basically you intercept the qt logger messages, filter out the ones you don't want, and re-emit the messages in the python logging module
mortal grotto
Oh interesting, QMessageLogger is indeed exposed in PyQt5 but not PySide{2,6}
rough furnace
hmm.... i used it with pyside2 ... might be in a different module or something
mortal grotto
rough furnace
hmm.... i used it with pyside2 ... might be in a different module or something
Could be... Not well documented if that's the case
rough furnace
I don't think you need QMessageLogger ?
mortal grotto
Whoops, I meant QLoggingCategory
It would allow easy disabling of debug info from modules by name
rough furnace
don't think you need that one either, you need QMessageLogContext
mortal grotto
For the filter handler sure, but having access to QLoggingCategory would allow you to do
QLoggingCategory.setFilterRules("qt.webengine* = false")
if all you want is to suppress that debug information
rough furnace
ahh
mortal grotto
rough furnace
https://github.com/j9ac9k/barney/blob/main/src/barney/BarneyApp.py#L52-L95
look...
Worked like a charm! Thanks again
rough furnace
@mortal grotto you should report a pyside bug requesting they expose QLoggingCategory tho
rough furnace
@fervent vale
Got pyside6 to compile w/ that XML file edited out:
pyside6_dev_39 ❯ python benchmark.py
use_array=False duration=0.289 fps=346
use_array=True duration=0.080 fps=1245
😆
looks like I'm just generating type-errors...ok re-verifying that it's actually doing something
sure enough, I accidentally undid my removal in the XML file, ... updated the results
rough furnace
I got the recompile process down to a few minutes; let me know if you think I should change modifying that XML file in other ways
fervent vale
All the drawXXXs could be restored, although we don't have a use for them
fervent vale
How much disk space did it cost you to compile pyside6?
fervent vale
I added support for this new drawLines signature to https://github.com/pyqtgraph/pyqtgraph/pull/2314, maybe you could try it out. (I haven't tried it out myself because I only compiled QtCore, QtGui)
fervent vale
Okay, compiled QtWidgets, and PlotSpeedTest.py works with the new signature
One snag: my PySide2 has __version__ 5.14.2a1
that breaks debug.py version splitting code that assumes all parts are integer
rough furnace
got my hands full here for another ~4 hours...
~/Developer/pyside-pyside-setup dev*
pyside6_dev_39 ❯ du -sh .
2.0G
2 GB?
my build command:
python setup.py install --ignore-git --debug --module-subset=Core,Gui,Widgets --qtpaths=/usr/local/bin/qtpaths
not including all other auxiliary downloads like Qt source, llvm?
rough furnace
oh, ugh, I installed qt via brew, same w/ llvm and clang
qt: /usr/local/Cellar/qt/6.3.0 (12,874 files, 550.0MB) *
llvm: /usr/local/Cellar/llvm/13.0.1_1 (5,449 files, 940.9MB)
fervent vale
python3 setup.py install --qmake=/usr/bin/qmake --no-examples --module-subset=Core,Gui,Widgets --skip-docs --parallel=8
my build failed when I included --ignore-git but that was probably because I didn't do git submodule update or something
rough furnace
I had to skip QtDesigner module, also I had to put symbolic links for Assistant.app, Linguist.app and Designer.app ... I think I set an environment variable too...
regardless, I'll be happy to test more later tonight w/ this 👍
ok, back to parenting duties... will rebuild and test your branch in ~4 hours
obsidian sapphire
I made a PR. @wide prism will you look at it and make sure I'm not making any mistakes, or otherwise suggest ways I could improve it?

GitHub
This PR refactors the existing data transforms (derivative, fft, log, etc.) into a generic data transform API. The old methods are deprecated with no set date to allow for adequate testing of the n...
rough furnace
@mortal grotto while trying to test the self-built pyside bindings; I just got this traceback when attempting to launch the Line Plot Update benchmark
 File "/Users/ogi/Developer/pyqtgraph/pyqtgraph/examples/PlotSpeedTest.py", line 87, in <module>
    params = ptree.Parameter.create(name='Parameters', type='group', children=children)
  File "/Users/ogi/Developer/pyqtgraph/pyqtgraph/parametertree/Parameter.py", line 137, in create
    return cls(**opts)
  File "/Users/ogi/Developer/pyqtgraph/pyqtgraph/parametertree/Parameter.py", line 217, in __init__
    self.addChildren(self.opts.pop('children', []))
  File "/Users/ogi/Developer/pyqtgraph/pyqtgraph/parametertree/Parameter.py", line 601, in addChildren
    self.addChild(chOpts)
  File "/Users/ogi/Developer/pyqtgraph/pyqtgraph/parametertree/Parameter.py", line 582, in addChild
    return self.insertChild(len(self.childs), child, autoIncrementName=autoIncrementName)
  File "/Users/ogi/Developer/pyqtgraph/pyqtgraph/parametertree/Parameter.py", line 617, in insertChild
    child = Parameter.create(**child)
  File "/Users/ogi/Developer/pyqtgraph/pyqtgraph/parametertree/Parameter.py", line 137, in create
    return cls(**opts)
  File "/Users/ogi/Developer/pyqtgraph/pyqtgraph/parametertree/parameterTypes/pen.py", line 45, in __init__
    children = self._makeChildren(self.pen)
  File "/Users/ogi/Developer/pyqtgraph/pyqtgraph/parametertree/parameterTypes/pen.py", line 111, in _makeChildren
    QtEnumParameter(ps, name='style', value='SolidLine'),
  File "/Users/ogi/Developer/pyqtgraph/pyqtgraph/parametertree/parameterTypes/qtenum.py", line 16, in __init__
    self.enumMap = self._getAllowedEnums(enum)
  File "/Users/ogi/Developer/pyqtgraph/pyqtgraph/parametertree/parameterTypes/qtenum.py", line 54, in _getAllowedEnums
    vals = enum.values
  File "/Users/ogi/.pyenv/versions/3.9.13/lib/python3.9/enum.py", line 429, in __getattr__
    raise AttributeError(name) from None
AttributeError: values
this is a dev/alpha of pyside6 right now, but fair warning, this issue may be present in 6.4.0
fixed with this modification in qtenum.py
    def _getAllowedEnums(self, enum):
        """Pyside provides a dict for easy evaluation"""
        if 'PySide' in QT_LIB:
            try:
                vals = enum.values
            except AttributeError:  # pyside6 6.4+
                vals = {e.name: e for e in enum}
@fervent vale I'm seeing a ~160fps -> 167fps difference on PlotSpeedTest.py (thanks for updating your PR)
improvement seems to scale with nsamples too
fervent vale
Try also line width=1, but toggle between segmented line mode
rough furnace
pyside6.3 ~530fps
pyside6.4.0a1 ~550fps
you think it would be worth testing this signature?
void QPainter::drawLines(const QPointF *pointPairs, int lineCount)
According to source code at woboq, drawLines(QPointF*, int) merely casts QPointF* to QLineF* and then calls drawLines(QLineF*,int) with half the length
rough furnace
oh, yeah, let's not do that 😆
fervent vale
Clearly shows that a QLineF is memory layout is compatible with QPointF...
There are just 4 drawXXXs methods: Lines, Points, Rects, PixmapFragments
The integer variants aren't useful to us
It might be worthwhile creating a benchmark of drawPoints vs drawPointsNp to show to Qt company
rough furnace
i'll enable the signature and rebuild...
fervent vale
Should be easily adapted from the existing script
rough furnace
i'll give that a go right now...
wide prism
obsidian sapphire
I made a PR. <@702383444180860928> will you look at it and make sure I'm not mak...
I'll do my best to find some time, something I haven't been very successful at recently.
Let me already say that getting the entire hand-coded, proof-of-concept style transform code wrapped up in nice structures would be so satisfying.
rough furnace
@fervent vale heh, I was right about to share mine...
Gist
benchmark drawPoints vs. drawPointsNp. GitHub Gist: instantly share code, notes, and snippets.
but i'm getting weird results, so I likely hosed something up
pyside6_dev_39 ❯ python benchmark_points.py
mode='list' duration=0.372 fps=269
mode='array' duration=0.046 fps=2184
mode='numpy' duration=0.117 fps=853
👀
@harsh ravine free FPS baby!
fervent vale
Better verify that it did run... by saving the qimage as a png
fervent vale
With less coding effort than creating the Np methods too...
rough furnace
that's ...almost an order of magnitude improvement...
harsh ravine
So those results are legit?
rough furnace
yup
harsh ravine
That is insane
rough furnace
this is a proof of concept tho...
- We don't use
QPainter.drawPointsin our repo anywhere - We are using these results to talk them off a proposal we really think is sub-optimal
harsh ravine
What kind of results do you get with a pattern that has a float32 dtype?
fervent vale
Oops, I left the save statement inside, have edited it away. It should have been outside the timing calls anyway
fervent vale
harsh ravine
What kind of results do you get with a pattern that has a float32 dtype?
That's not supported
harsh ravine
aww
rough furnace
😆
mode='list' duration=0.307 fps=326
mode='array' duration=0.029 fps=3473
mode='numpy' duration=0.109 fps=918
@harsh ravine we want to use the "array" mode proposed here for QPainter.drawLines which we currently use when drawing lines > 1px, the benefits are nowhere near as huge as with drawPoints but it's definitely observable
there is likely something we can do w/ drawRects in the future as well, but overwhelming majority of our draw operations are drawPainterPath which we have (I mean pijyoi has) optimized quite extensively; ...with another PR in queue to optimize it more.
harsh ravine
oh, why does the benchmark use drawPoints then?
rough furnace
because pyside devs rolled out a custom drawPointsNp function (Np short for numpy) ...they were using that function as a way to highlight better numpy support, and were proposing rolling out a similar drawLinesNp method for us
this benchmark goes to show that we can get far better performance if they just delete one line in their XML file listing the function signatures to not expose 😆
harsh ravine
Think this is going to help that guy who wanted to plot a million points, or whatever it was?
rough furnace
didn't see that one, saw someone wanting to draw a ton of rectangles, which exposing that signature for drawRects would go a long ways too
harsh ravine
was referring to whatever this was in reference to #pyqtgraph message
rough furnace
oh, ugh yeah that would probably work, still would recommend doing some downsampling tho
fervent vale
I managed to build PySide6 6.2.4 on WSL Ubuntu 22.04. I suspect the numbers you were getting was because of --debug.
After tweaking the run parameters nsegs 10_000 -> 50_000; size 500 -> 1000; I get the following times:
mode='list' duration=0.926 fps=107
mode='array' duration=0.559 fps=178
mode='numpy' duration=0.610 fps=164
python3 setup.py install --qtpaths=/usr/lib/qt6/bin/qtpaths --ignore-git --no-examples --skip-docs --module-subset=Core,Gui,Widgets --pyside-numpy-support --parallel=8
The issue with your benchmark script is that drawLinesNp assumes / requires that the arrays passed in are contiguous.
rough furnace
nice catch; let me rebuild...
pyside6_dev_39 ❯ python setup.py install --ignore-git --no-examples --skip-docs --module-subset=Core,Gui,Widgets --pyside-numpy-support --parallel=8
...
pyside6_dev_39 ❯ python benchmark_points.py
mode='list' duration=0.082 fps=1219
mode='array' duration=0.023 fps=4316
mode='numpy' duration=0.030 fps=3345
oh, should adjust the parameters too...
pyside6_dev_39 ❯ python benchmark_points.py
mode='list' duration=0.402 fps=248
mode='array' duration=0.160 fps=625
mode='numpy' duration=0.208 fps=480
@harsh ravine with nsegs = 1,000,000
~/Developer/pyside-pyside-setup dev*
pyside6_dev_39 ❯ python benchmark_points.py
mode='list' duration=7.633 fps=13
mode='array' duration=2.033 fps=49
mode='numpy' duration=2.542 fps=39
so yeah I guess 1 million points is not out of the realm of reason any more...
harsh ravine
Impressive. That's more than quick enough now.
fervent vale
note that there is already a drawPoints(QPolygonF) overload that gives good performance, so neither the 'array' nor the 'numpy' versions are needed
the example given was really to demonstrate that providing a 'array' overload would be simpler and faster than a 'numpy' overload
rough furnace
@fervent vale regarding #2324 (avoiding serialization of qpainterpath construction) can we work around the issue with NaN values in a path resulting in an invalid path and getting blank ones returned instead?
fervent vale
okay, so this non-finite issue has firstly to do with the serialization operator diligently checking for all-finite, and if any non-finite is found, it discards the whole path
but secondly, this means that the rest of the Qt library is free to assume that the coordinates are all finite
so if you were to forcefully subvert this assumption, who knows what undefined behavior you would end up invoking
rough furnace
i'm fine with that float('nan') is a valid float and I'm definitely of the opinion Qt should not be discarding painter paths because there is a float('nan') in it...
I'm mostly curious if this makes it so we do away w/ the finite check and back-filling process
(I get that this code-path won't be used unless enableExperimental is called 👍 btw good use of that flag)
fervent vale
I remember in one of the earlier iterations, it was possible to pass in NaNs through QPolygonF or something
but in one of the examples that did filling, it ended up with corruption
rough furnace
oh, right, ... i remember that, might have had something to do w/ line thickness too ...
fervent vale
the enableExperimental was to let it get into the "wild" and hopefully get more testing before it got into mainstream
rough furnace
yeah normally I'm not big on hiding stuff like this behind that flag, I doubt enough users are using current versions of pyqtgraph with enableExperimental set to True... but I think this is an appropriate case for it. Do you have access to an ARM platform you can test on? All my apple machines are the intel based ones...
fervent vale
not so much that it would matter on ARM64, since ARM is little endian anyway. More importantly would be to verify 32-bit because that's where the pointer sizes and size_t are 32-bit
it should work though
rough furnace
I'm trying to think who might have a 32-bit machine they could test on; @wide prism ...didn't you mention one of your work machines was 32-bit windows some time ago?
fervent vale
I could try on a 32-bits version of Bullseye on the raspberry pi, that comes with Qt 5.15, I think.
rough furnace
if it's not too much trouble (I have no problem merging as is)
fervent vale
hmm, let me try install Python 3.7 32-bits side-by-side on my Windows machine instead
rough furnace
you might need 3.8
fervent vale
okay it works with Python 3.7 32-bits, PySide2 5.15.2.1
come to think of it, pypi only has 32-bit PySide2 for Windows
so it's really a very limited audience...
fervent vale
test_qpainterpathprivate.py succeeds on Raspberry Pi OS 32-bits Bullseye / system PyQt5 5.15.2
PlotSpeedTest.py also works (over VNC)
Also works on Raspberry Pi OS 64-bits Bullseye
rough furnace
Thanks for testing!
rough furnace
https://codereview.qt-project.org/c/pyside/pyside-setup/+/415702 eventually submitted my own change 😬
thanks again for identifying where the ease of changes here
fervent vale
rough furnace
i'm fine with that `float('nan')` is a valid float and I'm definitely of the opi...
Actually backfill is not needed for connect=all and connect=finite. For connect=all, it would be sufficient to remove the non- finites. The before and after finite coords would then automatically be joined together
This is how the segmented line mode does it
It would likely require regeneration of the test reference images because what the back filling does now is to repeat coords
rough furnace
i can regenerate images
fervent vale
In the rendering of the QPainterPath, repeated coords are not an no-op
rough furnace
(really should modify the viewer/examiner app to allow to save images)
fervent vale
The finite checking is fast. The backfill is the slow part as it uses sort
rough furnace
really liked the original behavior, if you had a NaN value the "lines" connecting to that NaN value would just not be there; allowing for an easy way to introduce a discontinuity
while completely out of scope, wish there was an easy way to introduce float('inf') and -float('inf') support (drawing effectively a vertical line up/down from the point before, and a vertical line to the point after ... but yeah, that would hose all sorts of stuff like boundingRect
fervent vale
oh, the removal of backfill for connect=all was already done in #2036
_arrayToQPath_finite also doesn't use backfill
so it's only 'array' and 'pairs' that make use of backfill, and even then using it for 'pairs' is dubious
rough furnace
oh, huh, I clearly haven't been paying attention 😬
copper lily
copper lily
rough furnace
while completely out of scope, wish there was an easy way to introduce `float('i...
off topic, I was just using float inf like the other day
fervent vale
copper lily
off topic, I was just using float inf like the other day
Could you elaborate? Was it for pyqtgraph line curve plotting purposes? It's useful to know how users are using pyqtgraph
torn minnow
    ax.plot_surface(m, b, e, rstride=1, cstride=1, cmap='viridis', edgecolor='none')

    unw = np.unravel_index(e.argmin(), e.shape)
    m = m[unw]

    b = b[unw]
    print(m, b)
    ax.scatter(m, b, e.min(), c='r', marker='o', s=100)
    ax.set_xlabel('m')
    ax.set_ylabel('b')
    ax.set_zlabel('E')
I have this code what would be the best way to convert it to using pyqtgraph
rough furnace
can you show a screen-shot of what that looks like? my matplotlib game is weak
here is one of pyqtgraph's 3D surface plot example: https://github.com/pyqtgraph/pyqtgraph/blob/master/pyqtgraph/examples/GLSurfacePlot.py
torn minnow
rough furnace
can you show a screen-shot of what that looks like? my matplotlib game is weak
Here is how it looks like but i hate how it renders it and also matplotlib doesn't work that good with 3d https://gyazo.com/b1c63c4580b8d0add0871c8147f8bbf4.png
 rough furnace
torn minnow
Here is how it looks like but i hate how it renders it and also matplotlib doesn...
rough furnace
torn minnow
Here is how it looks like but i hate how it renders it and also matplotlib doesn...
ahh, a 3D Scatter Plot; here is an example https://github.com/pyqtgraph/pyqtgraph/blob/master/pyqtgraph/examples/GLScatterPlotItem.py
GitHub
Fast data visualization and GUI tools for scientific / engineering applications - pyqtgraph/GLScatterPlotItem.py at master · pyqtgraph/pyqtgraph
torn minnow
rough furnace
ahh, a 3D Scatter Plot; here is an example https://github.com/pyqtgraph/pyqtgrap...
thx
rough furnace
torn minnow
thx
you'll need pyopengl installed to your venv for the 3D capability!
torn minnow
rough furnace
you'll need pyopengl installed to your venv for the 3D capability!
Ok
will do
@rough furnace thx so much it works a lot better now
rough furnace
nice! our 3D capability is a bit rudimentary; definitely not anywhere near feature parity as our 2D but it does work 👍
torn minnow
ya also it is alot less laggy and functional compared to matplotlib
rough furnace
the interactivity in pyqtgraph is really a top notch feature of the library; matplotlib can do some of it, but the library is really aimed for another purpose
 worldly lake
Reposting from #python-discussion:
Hi! Just saw announcements message about pyqtgraph. I currently use matplotlib to produce simple graphs ( I've added a link below)
How does it actually compare to matplot lib in terms of speed? I just want to produce static pngs (well, a buffer actually so I can deal with it in memory rather than saving it to file than re reading etc)
Here's how one of my graphs looks like. I would say its pretty simple
https://cdn.discordapp.com/attachments/847448895490490388/986395525236539392/NA-PVP-XboxOfficial-TheIsland-SmallTribes1_Today.png
 rough furnace
hey, so in terms of speed pyqtgraph is pretty fast, but i can't imagine speed being an issue in matplotlib here, this seems like a straight forward chart... that x-axis might be problematic for us tho, I'm not sure.
worldly lake
I have a discord bot which dynamically generates these plots and sends them
Its not slow, but its not like, "instant" or as fast you know. Thought maybe pyqtgraph could be a bit faster
rough furnace
so plot render/save speed should be fast but startup time might be problematic as pyqtgraph loads the entire qt framework in the process
worldly lake
startup time isnt an issue for me yeah
I've got some "benchmarks"
2022-06-15 00:53:51.572 | Graph prepared in 0.9760644845664501 seconds
2022-06-15 00:53:52.575 | Graph prepared in 0.9724381305277348 seconds
2022-06-15 00:53:53.727 | Graph prepared in 1.1165316887199879 seconds
2022-06-15 00:53:54.737 | Graph prepared in 0.9700769018381834 seconds
2022-06-15 00:53:55.672 | Graph prepared in 0.8993141390383244 seconds
as i said that x-axis might be problematic, you'll have to tinker with it, but doing a line plot overlayed with scatter symbols isn't an issue (PlotDataItem is what you want)
worldly lake
avg 0.9 to 1 seconds
worldly lake
rough furnace
as i said that x-axis _might_ be problematic, you'll have to tinker with it, but...
alright ty
rough furnace
i'm wondering if you can send a png into a buffer directly, I Think there is some code somewhere in the library to do that, but this might be a case of some pre-mature optimization... see how things go with a dumb example first 😛
worldly lake
from io import BytesIO
ez
plt.tight_layout()
buf = BytesIO()
plt.savefig(buf, format="png")
buf.seek(0)
return buf
then I can just do discord.File(buf)
(I use discord.py)
rough furnace
is this graph being generated on a head-less system, there may be extra steps needed on linux
rough furnace
you may need need xvfb
https://github.com/pyqtgraph/pyqtgraph/blob/master/.github/workflows/main.yml
you can see what packages we install and how we use xvfb for our test suite..should hopefully give you some ideas
rough furnace
Haha yeah that screenshot does indeed look like I’ve seen it before
rough furnace
Thanks for the enum PR @fervent vale
rough furnace
Arbitrary Transforms PR 2326
rough furnace
Now that we have PyQt5 and PySide2 conda-forge packages for Qt 5.15.x, I'm seeing little need to support Qt 5.12 any more. I put together a poll; please consider voting on it.
rough furnace
rough furnace
Now that we have PyQt5 and PySide2 conda-forge packages for Qt 5.15.x, I'm seein...
rough furnace
@fervent vale looks like an unrelated PR triggered some relevant test failures:
    def alloc(self, size):
        # The C++ native API is:
        #   drawPixmapFragments(const PixmapFragment *fragments, int fragmentCount,
        #                       const QPixmap &pixmap)
        #
        # PySide exposes this API whereas PyQt wraps it to be more Pythonic.
        # In PyQt, a Python list of PixmapFragment instances needs to be provided.
        # This is inefficient because:
        # 1) constructing the Python list involves calling sip.wrapinstance multiple times.
        #    - this is mitigated here by reusing the instance pointers
        # 2) PyQt will anyway deconstruct the Python list and repack the PixmapFragment
        #    instances into a contiguous array, in order to call the underlying C++ native API.
        if self.use_sip_array:
>           self.objs = Qt.sip.array(QtGui.QPainter.PixmapFragment, size)
E           TypeError: a sip.array can only be created for types using ABI v12.11 or later
pyqtgraph\graphicsItems\ScatterPlotItem.py:164: TypeError
It's triggered by the release of PyQt5 5.15.7. So if this error appears, it means sip.array was found but PyQt5 itself was not updated to support it.
fervent vale
Okay, according to the Github Action logs, cached PyQt5 5.15.6 was used together with the updated PyQt5-sip 12.11.0
testing locally, PyQt5 5.15.7 + PyQt5-sip 12.11.0 does support the sip.array drawing methods
rough furnace
fervent vale
It's triggered by the release of PyQt5 5.15.7. So if this error appears, it mean...
ahh ok so got an awkward combination of the two that we probalby won't see regularly
fervent vale
Well, locally, I did a pip install -U PyQt5 and that pulled in the newer sip too
So PyQt5 5.15.7 has a dependency on the newer sip, but users can install newer sip with older PyQt5
fervent vale
Hmm, PyQt5 5.12 also pulls sip 12.11.0, but clearly PyQt5 5.12 won't be getting this support
rough furnace
o; that may be an issue
fervent vale
rough furnace
o; that may be an issue
I have added in version checks that should fix the problem.
rough furnace
Lgtm, just curious why do you like to compare the hex versions of the version numbers?
fervent vale
For one, it's the binding version that's relevant
QtVersion is set to QT_VERSION_STR
And since we are needing the binding version, PYQT_VERSION is easier to use than PYQT_VERSION_STR
encoding it as hex just makes it easier to read
rough furnace
huh, i just reran the CI for #2300 but it's still failing for pyqt5 5.12.3; ... I don't understand why that CI is failing, since I merged the PR you just created.... wonder if it re-ran with master cached or something...
passed on my local machine...
ok on closing/re-opening it's now passing ...
rough furnace
oh, i'm jumping the gun by a few days but oldest version of numpy to 1.20
rough furnace
should 0.13.0 be the next release? (debating making a PR to remove all the stuff marked for deprecation in 0.13.0)
fervent vale
I suppose numpy 1.21.5 should be bumped to 1.21.6 in requirements.txt?
fervent vale
Does that interfere with caching?
rough furnace
I don't think so; it still queries pypi for current versions of stuff, the cache just holds the previous downloads
or at least that's my understanding
rough furnace
If anyone wants to collaborate on closing out some of the open PRs tonight; let me know. Going to try and allocate a few hours with the intent of lowering the PR count.
fervent vale
multiplePlotSpeedTest.py can also demonstrate the speed up due to accessing QPainterPathPrivate
rough furnace
That one doesn’t have the parameter tree yet, right?
fervent vale
In fact, it has a check to see if arrayToQPath was in functions.py
That probably gives an idea of how old it is
rough furnace
Speaking of functions.py, anyone want to break that up?😂
fervent vale
isocurve, traceImage, isosurface, pseudoScatter, toposort are probably good candidates for moving out
rough furnace
fervent vale
isocurve, traceImage, isosurface, pseudoScatter, toposort are probably good cand...
as is the hundreds of lines of commented out code
mortal grotto
Man, pyqtgraph is neat. I've been playing with GANs, here's an app that lets you move around the latent space to generate new samples 🙂
rough furnace
TARGET ITEM! IN THE WILD!!!!

 leaden lotus
wow
 lunar crescent
Which programm language is better java or python
rough furnace
lunar crescent
Which programm language is better java or python
Probably not the right channel for this discussion
 tidal rock
lunar crescent
Which programm language is better java or python
tidal rock
lunar crescent
Which programm language is better java or python
Python
In my opinion, it depends what you are writing for
 tepid patrol
lunar crescent
Which programm language is better java or python
tepid patrol
lunar crescent
Which programm language is better java or python
c++
 gray linden
lunar crescent
Which programm language is better java or python
gray linden
lunar crescent
Which programm language is better java or python
css
 molten mist
hello!
I'm just getting started using pyqtgraph to build a GUI for my project - freemocap
https://twitter.com/freemocap/status/1541436589682966528
I look forward to asking questions on here as work continues 😄

you can run this .py as a __main__ to check out the new (very rough work-in-progress) GUI
If you don't know how to do that, join the Twitch stream this afternoon and I'll show you how 😊
Twitter
·
rough furnace
welcome @molten mist !
since it looks like you're making use of the 3d capability of the library, do you have much experience with opengl?
molten mist
a little bit, but I've done a fair amount of 3d plotting in matlab and matplotlib, and I've worked with Blender a fair amount
rough furnace
would love to expand some of the 3d plot capabilities of pyqtgraph; it is unfortunately pretty dependent on opengl as of rigth now, and outside of the basics none of the active maintainers have much expertise there
molten mist
Here's an implementation of a 3d skeleton viewer I made with pyqtgraph's GLViewWidget
molten mist
rough furnace
would love to expand some of the 3d plot capabilities of pyqtgraph; it is unfort...
Oh, I'm not worried about OpenGL 😂
I'm going to need a lot of little help here and there as I figure out the syntax and general vibe of how GUI's work
rough furnace
at a glance here looks like you're doing a lot of the right things, not recreating new graphics objects, but calling setData and such instead 👍
the API has been around for a while which means it's tough for us to make changes, there are no shortage of inconsistencies throughout; but the feature-set on 3D data is fairly minimal so you may not be getting too impacted there... we did recently switch from QGLWidget to QOpenGLWidget which that was disruptive to some
molten mist
Right on - I'm mostly just going to use to to do basic 'dots and lines' like kinds of plotting, so Scatter3d and Line3d (or whatever) are all I need
This one does a lot of image display from webcams - https://github.com/freemocap/freemocap/blob/jon/alpha-pipeline/src/qt_visualizer_and_gui/qt_visualizer_and_gui.py
Which will also be a part of things in the future

GitHub
Free Motion Capture for Everyone 💀✨. Contribute to freemocap/freemocap development by creating an account on GitHub.
rough furnace
this example created by pijyoi may be super helpful: https://github.com/pyqtgraph/pyqtgraph/blob/master/pyqtgraph/examples/GLPainterItem.py
molten mist
Something I've thought of a lot - Would it be possible to embed an iPython console in a pyqtgraph GUI? Ideally one that had access to the same local variables as the main function?
basically - is it possible to include a spyder-like ipython console to my GUI? Similar to the pyqtgraph console, but more fully featured
rough furnace
yes, there is a console widget that pyqtgraph ships with
i think there is even an example that highlights its usage
rough furnace
I bring that GLPainterItem example since that's helpful for combining the 2D and 3D capabilities
molten mist
Yas, I've played with that and it's super cool, but it's not particularly well functioned. As far as I can tell, there's no color-coded linting or code completion(?)
I was thinking about something along the lines of qtconsole - https://github.com/jupyter/qtconsole
Could I make a widget from that and include it in a pyqtgraph GUI?

GitHub
Jupyter Qt Console. Contribute to jupyter/qtconsole development by creating an account on GitHub.
rough furnace
oh yeah, I agree the pyqtgraph console on its own is fairly limited; definitely would be better to integrate the qtconsole more directly...not sure how straight forward that is to integrate into the existing console, or if you can just treat the qtconsole as its own qwidget and just add it elsewhere via addWidget to a layout call or something
molten mist
rough furnace
oh yeah, I agree the pyqtgraph console on its own is fairly limited; definitely ...
Yeah, that's what I was thinking!
Another tricky thing is to get the console to have access to the same data as the rest of the GUI. I think it's relatively straightfoward to just create the qtconsole widget and attach it, but there's some extra work to connect it to the same... kernel? I think the proper jargon is that it needs to be "connected to the running kernel" or something?
--
rough furnace
no clue about that, i agree it would be ideal
molten mist
I'll let you know if I make any progress there 🙂
rough furnace
if there are changes needed in our library, would certainly support that
molten mist
Also - I'm curious it you could tell me more about the governance/mod structure behind the pyqtgraph project!
How do you organize and recruit your moderators? Are y'all funded in any way (grants, donations, etc)?
freemocap is starting to grow, so I'm curious about the structures behind bigger projects like yours 🙂
rough furnace
no funding; there are ~5 active maintainers; original author suffered from burnout and I took over maintainer duties 3-4 years ago... he's still around and provides assistance periodically which we really appreciate.
needing to get my act together to get our numfocus membership in 😬
i don't think this project should be used a model for how to run a project 😆
molten mist
that's interesting to hear, I can already see how burnout would be a huge problem, hence why I'm trying to put thought into the structure now (while we're small) in preparation for maybe being bigger later
Thank you for stepping up to be maintainer! I really like your project a lot. I think it occupies a really nice niche in the scientific python community 🙂
rough furnace
I mean, it's a common theme in open source for a good reason; it's tough to work around, and what's unfortunate is that assistance/help doesn't come around until the project starts to derelict
I put out roughly annual calls for maintainers, ... I try to keep up with PRs as they're submitted (at one point was down to 16 open PRs, but we're back up to 40 now)
it's a bit unfortunate that when maintaining a project you generally don't write much code for it, mostly reviewing/testing ... there are a couple of areas of the library I would love to spend more time with, but when I allocate time to this project, it's usually to go through open PRs
molten mist
thats a shame, but it makes sense
sounds a lot like running a lab though, which is my regular job anyway 😛
(btw, I'm going to host a Twitch stream now - twitch dot com slash freemocap - feel free to pop on if you like, otherwise I'll post my questions and progress here. Thanks!!)
rough furnace
haha I need to get back to my paying job, best of luck, please let us know if you run into issues and similarly let us know how qtconsole integration goes!
 brazen haven
what’s this?
rough furnace
A high performance interactive plotting library
rough furnace
For contours, we should likely look at better sorting this package: https://github.com/contourpy/contourpy

GitHub
Python library for calculating contours in 2D quadrilateral grids - GitHub - contourpy/contourpy: Python library for calculating contours in 2D quadrilateral grids
 plush fulcrum
@molten mist here is an app I made which includes both pyqtgraph plots and qtconsole embedding: https://github.com/yaq-project/yaqc-qtpy
molten mist
plush fulcrum
<@362711467104927744> here is an app I made which includes both pyqtgraph plots ...
That's awesome, thanks!!
I'll check it out and let you know if I have questions 😄
molten mist
plush fulcrum
<@362711467104927744> here is an app I made which includes both pyqtgraph plots ...
sorry, for the newbie question, but... how do you run this? 😅
Oh wait, I got it!
yaqd list --format json | yaqc-qtpy -
and then a nice cow pops up and a black box that says -hidden
plush fulcrum
molten mist
sorry, for the newbie question, but... how do you run this? 😅
So it does require some additional things running... this is our "engineering interface" for my laser lab (and a handful of other labs) providing access to small hardware interface programs called yaq daemons
molten mist
Ah, I get it - yaq like yak 🐮
plush fulcrum
molten mist
sorry, for the newbie question, but... how do you run this? 😅
https://python.yaq.fyi/installing-yaq/
You can run fake daemons if you are interested in trying it out
molten mist
Ah perfect!
This looks like a really awesome project in addition to being a good source of sample pyqtgraph code. There are some parts of freemocap that might benefit from this kind of daemon/client pattern
plush fulcrum
molten mist
Ah perfect!
just to provide some screenshots of pyqtgraph plus console

 molten mist
not to mention that I think a daemon motif would match well with out currently skeleton based branding 😂 💀 👹 +
molten mist
plush fulcrum
just to provide some screenshots of pyqtgraph plus console
That's awesome, thank you so much!
plush fulcrum
The pattern adds some systemic complexity, but I really like it because it makes debugging a whole lot easier than a monolith application. (each part is pretty simple, but yeah you do have to organize running the parts)
molten mist
Totally
On my end, I'm planning to use freemocap as a teaching tool, so having an ipython console attached will provide a nice entry point towards giving students basic programming experience
plush fulcrum
for us the console is mostly an escape hatch to provide access to features we have not (yet) built actual UIs for, but also serves as a place to do some light computation/function writing with access to the hardware. Not really something we expect users to sit down at and use a ton, but it was not that hard to add so I went ahead and did it. This file includes the embedding of the qtconsole, adapted from an example in their docs, linked in a comment.
GitHub
Contribute to yaq-project/yaqc-qtpy development by creating an account on GitHub.
Oh wait I got it
 inland hornet

In this video I am going to show you how you can create in Python with Matplotlib and Pandas. This tutorial is meant for beginners.
inland hornet
can anyine help me out with how can i display the graph to a html web?
rough furnace
inland hornet
can anyine help me out with how can i display the graph to a html web?
generally speaking pyqtgraph doesn't work on web interfaces, if you want web there are other libraries like bokeh, plotly, if you want to use pyqtgraph on a web interface, you can see some of our jupyter integration examples, but generally an area our library is particularly proficient
inland hornet
rough furnace
generally speaking pyqtgraph doesn't work on web interfaces, if you want web the...
what about matpotlibs
rough furnace
no clue, we don't work on matplotlib 🙂
inland hornet
is matpotlibs like a beginer thing?
rough furnace
matplotlib is a top tier and very powerful plotting library, it's just not our plotting library, we're not in a good place to give advice/input about it, especially in this channel. If you have a specific question, consider posting in one of the help channels, #data-science-and-ml or #user-interfaces
inland hornet
my task: make a graph of a car (time and velocity are given every sec) and display it live feed to a website. (a basic simple html website)
rough furnace
again, probably not the library for you, pyqtgraph generally runs on native environments, and not web environments, I would consider bokeh or plotly instead
inland hornet
bokeh and plotly okay i'll look into them now
inland hornet
rough furnace
again, probably not the library for you, pyqtgraph generally runs on native envi...
this really helped thankkyouu
using bokeh ]
fervent vale
rough furnace
https://codereview.qt-project.org/c/pyside/pyside-setup/+/415702
Looks like they want you to add "Pick to 6.4"?
 fervent vale
Indeed https://code.qt.io/cgit/pyside/pyside-setup.git/ shows there's no 6.4 branch
rough furnace
Yeah I’ll see what they suggest
mortal grotto
molten mist
Something I've thought of a lot - Would it be possible to embed an `iPython` con...
@molten mist just seeing this, you can check out my implementation here: https://gitlab.com/ntjess/utilitys/-/blob/main/utilitys/widgets.py#L54
runic umbraBOT
utilitys/widgets.py line 54
class ConsoleWidget(RichJupyterWidget):```Sample use (leveraging https://gitlab.com/ntjess/utilitys/-/blob/main/utilitys/widgets.py#L99):
from utilitys.widgets import safeSpawnDevConsole
import pyqtgraph as pg
pg.mkQApp()
safeSpawnDevConsole(local1='test', var2=55)
pg.exec()
Note that several debug environments will cause IPython console to crash, so this defaults to pyqtgraph's implementation in those cases


 quartz tiger
I'm looking to do some very basic graphing (2d line graph with a few lines some data trends), after generating the graph I want to have the png image bytes in memory, so that I can send it off to an API, no need to display it in a gui.
I notice you support exporting to a file, so I imagine I can use this to export to an iobuffer.
Do you think this is a valid use case for this lib, or is it a little overkill for my basic use case?
fervent vale
import pyqtgraph as pg
from pyqtgraph.Qt import QtCore, QtGui

app = pg.mkQApp()
pwgt = pg.PlotWidget()
pwgt.plot(list(range(10)))
app.processEvents()
qimg = QtGui.QImage(800, 600, QtGui.QImage.Format.Format_RGB32)
painter = QtGui.QPainter(qimg)
pwgt.render(painter)
painter.end()
io = QtCore.QBuffer()
qimg.save(io, 'PNG')
pngdata = io.buffer().data()
with open('export.png', 'wb') as fd:
    fd.write(pngdata)
interestingly, the amount of pyqtgraph-specific code is really minimal. It's almost all Qt code.
quartz tiger
That seems pretty straight forward, thanks :D
rough furnace
@quartz tiger this is actually a regular occurrence, given we are so heavily integrated into Qt, for more .... custom functionality, usually there is Qt framework capability there that integrates fine w/ pyqtgraph.
molten mist
@rough furnace @plush fulcrum - I made a simple JupyterConsoleWidget for pyqtgraph and added something to pyqtgraph.examples to show basic usage - https://github.com/pyqtgraph/pyqtgraph/pull/2353

GitHub
I added a JupyterConsole widget and made an Example showing basic use
this was based on the implementation from yaqc-qtpy which I learned about in a conversation on the #pyqtgraph channel in the Py...
rough furnace
molten mist
<@369662814488363009> <@341189908372652033> - I made a simple `JupyterConsoleWid...
just saw this, thank you so much!
molten mist
My pleasure, it was fun to put together 🙂
Tbh, I'm fairly clueless about how that 'kernel' stuff actually works, but the example seems to work well enough 🙂
rough furnace
um... you may have forgotten to add the example to the PR? I see the file in pyqtgraph/widgets/JupyterConsoleWidget.py but not seeing a file in pyqtgraph/examples/...
also love the comment w/ the source/example 👍
plush fulcrum
I do question a bit if it is in scope… I have no issue with having an example, but we were discussing removing the existing console support, so not sure adding a new console is what we want
If the lesson is “qtconsole can be made easier to use than it is” perhaps that is a conversation for qtconsole
fervent vale
A clean install of qtconsole pulled in 30+ packages
fervent vale
import numpy as np
import pyqtgraph as pg
from pyqtgraph.Qt import QtWidgets
from qtconsole import inprocess

class ConsoleWidget(inprocess.QtInProcessRichJupyterWidget):
    def __init__(self):
        super().__init__()

        self.kernel_manager = inprocess.QtInProcessKernelManager()
        self.kernel_manager.start_kernel()
        self.kernel_client = self.kernel_manager.client()
        self.kernel_client.start_channels()

    def shutdown_kernel(self):
        self.kernel_client.stop_channels()
        self.kernel_manager.shutdown_kernel()

class MainWindow(QtWidgets.QMainWindow):
    def __init__(self):
        super().__init__()
        cwidget = QtWidgets.QWidget()
        vbox = QtWidgets.QVBoxLayout()
        cwidget.setLayout(vbox)
        self.plot = pg.PlotWidget()
        self.console = ConsoleWidget()
        vbox.addWidget(self.plot)
        vbox.addWidget(self.console)
        self.setCentralWidget(cwidget)

        app = QtWidgets.QApplication.instance()
        app.aboutToQuit.connect(self.console.shutdown_kernel)

        kernel = self.console.kernel_manager.kernel
        kernel.shell.push(dict(np=np, pw=self.plot))
        self.console.execute("whos")

if __name__ == '__main__':
    pg.mkQApp()
    main = MainWindow()
    main.show()
    pg.exec()
Would a standalone example such as the above be more appropriate?
rough furnace
Yeah I’m partial to a stand-alone example, and a reference to the example in the Documentation for the console widget
rough furnace
@obsidian sapphire @plush fulcrum @wide prism @torn coyote can you all share your thoughts on pyqtgraph/pyqtgraph#2352 ?
tl;dr a PR #2169 which is a micro-optimization was merged, and made an attribute of ViewBox is now an Optional (can sometimes be None). This change caused a breakage in the Orange project. I don't see a good way to support both workflows here. Anyway deciding how to manage this sort of thing is one of the most hated kinds of decisions so I'm outsourcing that to you all 😛
rough furnace
Lazy QRect
 safe pecan
Kernel problem
rough furnace
safe pecan
Kernel problem
kernel solution?
rough furnace
the way I seem to keep breaking pyqtgraph, merging that pyi file will likely break something 😆
rough furnace
@fervent vale would you like me to submit a bug-report to the pyside bugtracker for your example regarding the ROI-Handle decay issue?
fervent vale
It's not minimal enough yet
Actually you could submit the Mixin one, it's minimal
And is likely the blocker for qtconsole
The pypy CI is currently set up to use the Qt CI snapshots. Don't think there's any PyPySide-specific commits since 6.3.0
rough furnace
I think it's fine to use their snapshots for testing on this PR
this is a highly experimental feature that is subject to change, ...even if changes haven't been made recently
I can reach out to Christian and make sure they're ok w/ it
rough furnace
you mean this mixin example here? https://github.com/pyqtgraph/pyqtgraph/pull/2271#issuecomment-1114188020
GitHub
With regards to #2270, experiment with swapping inheritance order to get GraphicsItem(s) to work on PyPy.
Except for PySide6 (tested on 6.2.4 and 6.3.0), the patches here cause all other CPython bi...
fervent vale
In the PR, there's a subdir "tests_pypy" with a file test_mixin.py
All the tests in this subdir will pass on the regular bindings
But will fail on PyPySide
 strange canopy
I wanted to create a program that would display how a control valve reacts to input changes and its tuning constants, etc. But being a beginner with python I don't know what "graphics package" would be best to display a moving graph like the one seen in this video: https://www.youtube.com/watch?v=7qw7vnTGNsA
Someone mentioned that pyqtgraph would be good for this application. Would you all agree?

A tuned PID controller - automatically manipulates the motor speed to maintain the lever arm's angle at a setpoint. Programmed on Arduino, using Ziegler-Nichols tuning constants.
rough furnace
strange canopy
I wanted to create a program that would display how a control valve reacts to in...
as someone that studied control theory, I think displaying live readings from a system like this is something pyqtgraph would absolutely accel in. If you are unfamiliar w/ graphics frameworks and such, I think pyqtgraph should be able to ease soem of the head aches.
you can get the basics up and running with the following
pip install numpy scipy pyqtgraph PyQt6
python -m pyqtgraph.examples```

this will launch pyqtgraph's example application which can show you some basic examplesWow, thank you for that! Very helpful.
I looked up PyQt6, skimming the docs at the moment. As I mentioned, being a beginner at this, would you help me understand the need for PyQt6?
rough furnace
so... a little context, PyQt5, PySide2 are python bindings to Qt framework version 5.x; PyQt6, PySide6 are python bindings to the Qt framework version 6.x ... There isn't much documentation specific to PyQt/PySide usually we use the C++ documentation of the Qt framework itself.
strange canopy
"Qt framework", going to have to google that...
Hopefully pyqtgraph and PyQt6 are available through 'conda install'?
strange canopy
rough furnace
so... a little context, PyQt5, PySide2 are python bindings to Qt framework versi...
I mention that because I have this 3rd party software that uses Anaconda, and I had issues earlier this year with having different versions of python on my work laptop, so I only have Anaconda version 4.12.0, which corresponds to python version 3.8.12. I asked the software company if their software was OK with using a newer version of python and they of course replied "no"... :/
rough furnace
you can do this via conda, you need to install some stuff via conda-forge tho...
conda create -n my_project
conda activate my_project
conda install -c conda-forge pyqt5 pyqtgraph numpy scipy
So... first of all thank you so much for holding my hand through all this. And then second of all, how would I find out what you just mentioned there? What's the -c switch for? What is "my_project"?
I apologize for asking such basic stuff...
rough furnace
the -c is for specifying a specific conda channel to install packages from... so w/o specifying it, miniconda and anaconda distributions use the defaults channel to install packages from. Unfortunately, on the defaults channel, it has a very old version of PyQt5 (which we stopped supporting quite some time ago), and also an old version of pyqtgraph (which will never get updated unless they update their version of PyQt5, which from what I pieced together, will just never happen).
in terms of how to find out what I mentioned here, the commands I posted are fairly straight forward, you can view to #❓|how-to-get-help channel if you run into trouble installing stuff, there's nothing unusual I posted here.
strange canopy
rough furnace
the `-c` is for specifying a specific conda channel to install packages from... ...
I understand about that not being unusual. My problem is I don't know what "usual" is, exactly. 😄
Thanks again for all the help!
rough furnace
haha it's fine, generally speaking, a good place to start is the project README https://github.com/pyqtgraph/pyqtgraph#installation-methods
strange canopy
Github... that's another thing I need to learn. 🙂
rough furnace
ok, can't get multiple PR templates working to save my life, ...since these checklists were meant to prevent me from forgetting stuff, going to put the contents into CONTRIBUTING.md
EDIT: just kidding, decided to merge it into a single template, and put the checklists under collapsable sections
fervent vale
fervent vale
It's not minimal enough yet
There's now a minimal test called tests_pypy/test_qgraphicsobject.py
It's a bit weird though, the trigger point is over-riding the itemChange method...
rough furnace
Huh! There have been comments in the code base about overriding that method being problematic in very old versions of pyside
rough furnace
I'm going to try and spend some time tagging issues, closing out old ones; if anyone has some down time and wants to assist; that would be appreciated!
rough furnace
@fervent vale thanks for identifying the lingering reference. I have a branch going to try and address some issues with the LegendItem, I’ll see if I can remove that extra reference or replace it with a weak ref
Edit: re-read and saw you think it’s a bindings issue we may not be able to work around. I’ll see if I can replicate without pyqtgraph
fervent vale
pijyoi1836 thanks for identifying the
 somber fractal
Hello!
How do I in django to query a value in the bank greater than 100 and less than 1000
tight cliff
somber fractal
Hello!
How do I in django to query a value in the bank greater than 100 and less...
That's off topic here, try #web-development
torn minnow
hello I have a quick question I am running some code in matplotlib and in pyqtgraph but i am getting different results
rough furnace
torn minnow
hello I have a quick question I am running some code in matplotlib and in pyqtgr...
API isn't quite the same so not entirely surprising
torn minnow
import numpy as np
import pyqtgraph as pg
import pyqtgraph.opengl as gl
from pyqtgraph.Qt import QtCore

data = np.array([[1, 2], [2, 5], [3, 7]])
m = 0
b = 0
eta = 0.1

app = pg.mkQApp("GLScatterPlotItem Example")
w = gl.GLViewWidget()
w.show()
w.setWindowTitle('GD')
w.setCameraPosition(distance=20)

g = gl.GLGridItem()
w.addItem(g)

def compute_grad_with_respect_to(m, b, respect=True):
    if respect:
        return (6 * b) + (14 * m) - 33
    else:
        return (6 * m) + (3 * b) - 14


for i in range(100):
    respect_to_b = compute_grad_with_respect_to(m, b, respect=False)
    respect_to_m = compute_grad_with_respect_to(m, b)

    m = m - (eta * respect_to_m)
    b = b - (eta * respect_to_b)
    print(m, b)

    e = (m + b - 2) ** 2 + ((2 * m) + b - 5) ** 2 + ((3 * m) - 7) ** 2

    sp1 = gl.GLScatterPlotItem(pos=(m,b,e), size=15, color=(1, 2, 0, 1))
    w.addItem(sp1)

if __name__ == '__main__':
    pg.exec()
output

import numpy as np
import matplotlib.pyplot as plt

data = np.array([[1, 2], [2, 5], [3, 7]])
m = 0
b = 0
eta = 0.1


def compute_grad_with_respect_to(m, b, respect=True):
    if respect:
        return (6 * b) + (14 * m) - 33
    else:
        return (6 * m) + (3 * b) - 14


fig = plt.figure()
ax = fig.add_subplot(111, projection='3d')

for i in range(100):
    respect_to_b = compute_grad_with_respect_to(m, b, respect=False)
    respect_to_m = compute_grad_with_respect_to(m, b)

    m = m - (eta * respect_to_m)
    b = b - (eta * respect_to_b)
    # make a 3d plot with m b and e
    e = (m + b - 2) ** 2 + ((2 * m) + b - 5) ** 2 + ((3 * m) - 7) ** 2

    ax.scatter(m, b, e, c='b', marker='o', s=10)
    ax.set_xlabel('m')
    ax.set_ylabel('b')
    ax.set_zlabel('E')

plt.show()
output
 torn minnow
rough furnace
API isn't quite the same so not entirely surprising
torn minnow
rough furnace
API isn't quite the same so not entirely surprising
am I doing anything or am I just looking at the wrong angle
rough furnace
hmm... don't think it's just the angle here...
so first thing first; instead of adding 100 GLScatterPlotItems, you should probably create a 100x3 numpy array where each row represents the x,y,z coordinates of each point
actually you're not using the i variable anywhere, any reason that for loop is part of your example here?
oh wait, I see you're updating points
also the size parameter doesn't take a constant like that, need an array I think
oh, looking at your scale, I think what's happening is that the scales are way off...
I'm not that familiar w/ the 3D aspects of the library, but I think it generally expects the scale of each axis to be fairly similar...
import numpy as np
import pyqtgraph as pg
import pyqtgraph.opengl as gl
from pyqtgraph.Qt import QtCore

data = np.array([[1, 2], [2, 5], [3, 7]])
m = 0
b = 0
eta = 0.1

app = pg.mkQApp("GLScatterPlotItem Example")
w = gl.GLViewWidget()
w.show()
w.setWindowTitle('GD')
w.setCameraPosition(distance=20)

g = gl.GLGridItem()
w.addItem(g)

def compute_grad_with_respect_to(m, b, respect=True):
    if respect:
        return (6 * b) + (14 * m) - 33
    else:
        return (6 * m) + (3 * b) - 14


N = 100
points = np.empty((N, 3), dtype=np.float64)

for i in range(N):
    respect_to_b = compute_grad_with_respect_to(m, b, respect=False)
    respect_to_m = compute_grad_with_respect_to(m, b)

    m = m - (eta * respect_to_m)
    b = b - (eta * respect_to_b)
    print(m, b)

    e = (m + b - 2) ** 2 + ((2 * m) + b - 5) ** 2 + ((3 * m) - 7) ** 2

    points[i, :] = [m, b, e]

    # sp1 = gl.GLScatterPlotItem(pos=(m,b,e), size=5, color=(1, 2, 0, 1))
    # w.addItem(sp1)


points[:, -1] /= 20
size = np.empty((N,), dtype=np.float64)
size[:] = 5.

sp1 = gl.GLScatterPlotItem(pos=points, size=size, color=(1., 2., 0., 1.))
w.addItem(sp1)

if __name__ == '__main__':
    pg.exec()
 torn minnow
rough furnace
```python
import numpy as np
import pyqtgraph as pg
import pyqtgraph.opengl as g...
torn minnow
rough furnace
```python
import numpy as np
import pyqtgraph as pg
import pyqtgraph.opengl as g...
thank you so much
rough furnace
torn minnow
thank you so much
sure thing!
I don't know off the top of my head if there is a way to scale an axis in 3D pyqtgraph-land...
Just had a nice email exchange with Phil at Riverbank Computing, he said he's open to other feature requests from us. @fervent vale you've done the bulk of the Qt integration recently, if you think there is something else that the bindings can do to help things out, let me know and I'll gladly make the feature request.
torn minnow
rough furnace
Just had a nice email exchange with Phil at Riverbank Computing, he said he's op...
Ok
rough furnace
feels like I've been merging PRs, but seems to have made everyone else busier, outstanding PR count is still more or less the same 😆