

1 messages · Page 398 of 1
 analog kestrel
I need to use these classes to train over 50 epochs, batch size of 16, learning rate of 1e-3. I am wondering how to get started?
 desert oar
analog kestrel
I need to use these classes to train over 50 epochs, batch size of 16, learning ...
desert oar
analog kestrel
I need to use these classes to train over 50 epochs, batch size of 16, learning ...
it sounds like this is a homework assignment. is it?
analog kestrel
At one point it was. I am re-using it for self-learning as I prepare for a new job this summer
Once I am able to figure out the structure of training I think I can take it from there!
Don't have too much experience using python classes
desert oar
okay. it looks like you have all the pieces there, i recommend following the guide in the docs https://pytorch.org/tutorials/beginner/basics/optimization_tutorial.html
you don't need to know that much about python classes to use this, although writing your own classes benefits from some understanding of how they work
analog kestrel
I can read the docs, however I am limited to numpy
 mild dirge
the devs of pytorch have also written a book on deep learning which quickly goes over the basics too
mild dirge
analog kestrel
I can read the docs, however I am limited to numpy
numpy? this seems like pytorch
desert oar
what do you mean by "limited to numpy"? you can't use pytorch without pytorch
 charred cedar
Anyone here good with confirmatory factor analysis in Python? I am stuck on an issue in #help-falafel would appreciate help
 arctic wedgeBOT
Hey @analog kestrel!
It looks like you tried to attach file type(s) that we do not allow (.ipynb). We currently allow the following file types: .gif, .jpg, .jpeg, .mov, .mp4, .mpg, .png, .mp3, .wav, .ogg, .webm, .webp, .flac, .m4a, .csv, .json.
Feel free to ask in #community-meta if you think this is a mistake.
desert oar
i was about to say, you won't be able to upload an ipynb file. export it to python with jupyter nbconvert --to script (you need to pip install nbconvert first)
i think jupyter also has an option in the menu to save as a plain python file
arctic wedgeBOT
Hey @analog kestrel!
It looks like you tried to attach a Python file - please use a code-pasting service such as https://paste.pythondiscord.com
desert oar
!paste @analog kestrel
arctic wedgeBOT
Pasting large amounts of code
If your code is too long to fit in a codeblock in discord, you can paste your code here:
https://paste.pythondiscord.com/
After pasting your code, save it by clicking the floppy disk icon in the top right, or by typing ctrl + S. After doing that, the URL should change. Copy the URL and post it here so others can see it.
desert oar
paste the contents in that site ☝️
desert oar
interesting, it looks like this is a from-scratch implementation of the torch "Module" interface
who made this?
and why?
it's hard to give any feedback on this because it's someone's entirely custom work
analog kestrel
i see
desert oar
i suppose you're expected to call forward, backward, and gradientStep yourself
analog kestrel
yes^
desert oar
do you know what those 3 things mean?
i hate the forward/backward jargon
"forward" means "generate a prediction at the current weight values"
"backward" means "compute the gradient at the current weight values" (which uses the output from the "forward" part)
analog kestrel
yes, i understand conceptually how it works - i am having implementation issues using what was provided in the classes
desert oar
and then "gradientStep" is the gradient descent weight update
looks like you are just expected to call forward, backward, gradientStep in a loop
analog kestrel
how do I update the weights across training epochs?
desert oar
it looks like the gradientStep method does that for you
look at how it is defined
MLP.gradientStep calls fc1 and fc2 gradientStep methods
so you look at those methods
fc1 and fc2 are instances of Linear, so look at Linear.gradientStep
and you can see that it does exactly what you want: it updates the weights and biases
 warm raptor
Hello there i am wondering if there is a library that i can use to generate a search tree for example see the above picture
as the data is also a 2d array and has a path

thanks
desert oar
@analog kestrel is this all you have? do you have any notes on backpropagation or usage examples?
analog kestrel
@desert oar thank you for the assistance. i appreciate it
and yes - that is all I have
I think I need to play around a bit more
been stuck for a while though
strange behavior with the gradientStep function...

(this is for the 1st training iteration, and the first batch of 16)
desert oar
looks like you put in the wrong inputs
although i was about to post a code snippet before i had to leave for a few mins
and yeah that does look right
please do post code as text in the future though
its hard to read screenshots
!code see below for instructions on code formatting:
arctic wedgeBOT
Here's how to format Python code on Discord:
```py
print('Hello world!')
```
These are backticks, not quotes. Check this out if you can't find the backtick key.
desert oar
model = MLP(n_classes)
criterion = LeastSquareCriterion(n_classes)
for ecoch in range(n_epochs):
    for (x_batch, y_batch) in batches:
        y_pred = model.forward(x_batch)
        loss = criterion.forward(x_batch, y_pred)
        grad0 = criterion.backward(y_pred, y_batch)
        grad = model.backward(x_batch, grad0)
        model.gradientStep(learning_rate)
your code is more or less that, right?
desert oar
loss.backward i think is wrong
i think the "x" in the backward function is supposed to be the y values in your batch
analog kestrel
do you mind if I ping you later? hoping to get unstuck and complete this
desert oar
i am going to be out this afternoon, so you can ping but i might not be available
analog kestrel
desert oar
i am going to be out this afternoon, so you can ping but i might not be availabl...
got it working. thanks again so much! excellent!
desert oar
analog kestrel
got it working. thanks again so much! excellent!
great. what was the issue?
analog kestrel
overlooked the correct inputs the loss function, as you pointed out
desert oar
good
it helps to remember the rules for the size of matrices in matrix multiplication
 grave hare
Hello! I am attempting to dive into a project request and while I'm slightly familiar with this, i'm having a hard time getting started in the right direction. I am trying to forecast (predict) when orders will occur in the current month based on historical data. These orders will come from specific customers along with an order type. The idea is to determine if we will be able to complete the order based on our capacity given actual orders for that day and forecasted orders for that day.
I figured some type of time series analysis would fit, but haven't gotten much further as im not entirely sure of the measures a Time analysis uses/needed.
desert oar
grave hare
Hello! I am attempting to dive into a project request and while I'm slightly fa...
are the orders on a monthly basis? or are they on a fixed-duration basis?
that is, can you expect "one order every month" and you just don't know which day? or is it more like "there is an unknown number of days between orders, but usually it's 1 per month"?
grave hare
based on the criteria of each order from each customer, it could be one order of type a and 3 for type b spaced x days apart, or for some customers it could be type a is ordered first, then a type b, etc. depending on how the orders fall, you may have a type a order for a customer in one month, then the following month there would be a type b. All of this information is recorded in the historical data.
desert oar
and are there other features that might affect when the order arrives? are orders more frequent at certain times of year? presumably different customers tend to order different types and quantities of things
grave hare
yes, or some customers may order from us for one type and someone else for anther type.
but of course, we would just try to forecast for what we have fulfilled in the past
desert oar
ultimately are you just interested in forecasting order quantites across all customers? or do you need customer-level predictions?
this seems like a nontrivial problem btw
grave hare
Quantities across all customers with one or two levels of criteria
desert oar
hmm, that makes things a bit easier
you can model order quantity as a non-homogeneous poisson process
or you could apply some kind of time series model like (S)AR(I)MA(X) for monthly or weekly order quantities
grave hare
Okay, that's the route I started on but then stopped ha. Any resources on this to get me started?
desert oar
grave hare
Okay, that's the route I started on but then stopped ha. Any resources on this ...
hard to go wrong with FPP https://otexts.com/fpp3/
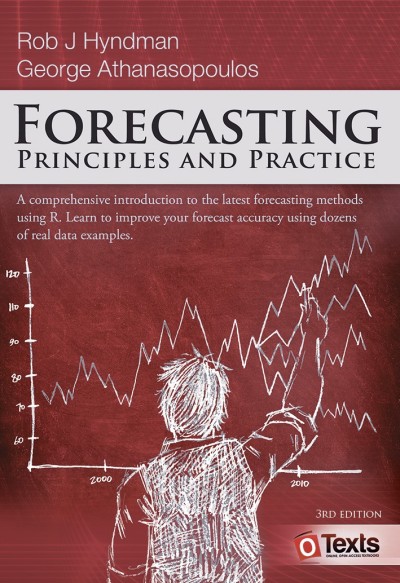
3rd edition
this paper is also interesting, although the "arrival rates" are probably a lot higher than what you deal with in your business http://www.columbia.edu/~ww2040/4615S15/Forecasting_032818submit.pdf
grave hare
I'll check it out, thanks for chatting it out with me
 small orbit
Anyone who wants to help me implement Keras Tuner?
 serene scaffold
small orbit
Anyone who wants to help me implement Keras Tuner?
serene scaffold
small orbit
Anyone who wants to help me implement Keras Tuner?
this sounds like something that would require a significant donation of someone's time, so you're more likely to get help if you ask a more pointed question.
 knotty barn
Is anyone good at coupled systems of ODEs?
 bold timber
Hi, anyone can gives me a recommendation source about machine learning deployment?
grave hare
@desert oar any sources that use Python? what you referred to uses R 🙄
 analog kiln
can someone help me navigate old TF code? https://github.com/ofirpress/UsingTheOutputEmbedding/blob/master/ptb_word_lm/ptb_word_lm.py#L101-L128
i'm not sure I understand at all what stuff like softmax_w = tf.get_variable("softmax_w", [size, vocab_size]) means
analog kiln
nvm, i'm dum, this isn't the file that ties the weights
 steady basalt
Anyone here can handle leetcode medium?
 vagrant marsh
where i can find this dataset?
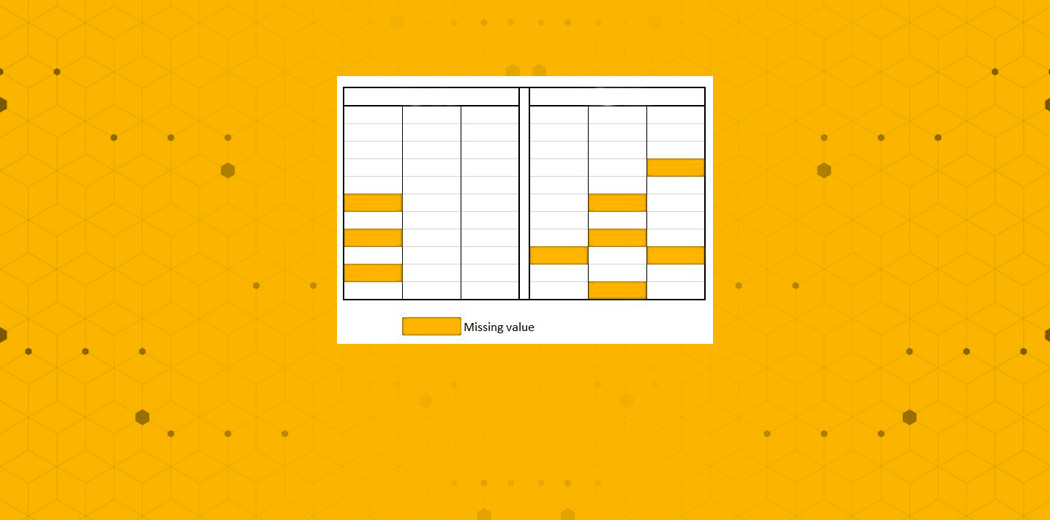
In this article, we are going to cover Missing value Ratio technique and later on will see its implementation in Python as well.

 tranquil sage
For CNN word embedding layer, how do you decide whether to use GloVe or Word2Vec? Task: multi-label text classification with small data
 blissful bone

IntroThis is a part of the series of blog posts related to Artificial Intelligence Implementation. If you are interested in the background of the story or how it goes: This week we'll showcase testing process and the early results of the model. We will be using SerpApi's Google Organic Results
tranquil sage
Anyone can suggest pretrained model for text classifcation task?
Architecture : CNN.
Task: Resume parsing
serene scaffold
tranquil sage
Anyone can suggest pretrained model for text classifcation task?
Architecture : ...
if it's text classification, what are the classes? if it's text parsing, do you mean information extraction, and what are you trying to extract?
tranquil sage
serene scaffold
if it's text classification, what are the classes? if it's text parsing, do you ...
i want to extract all details in the resume such as the personal details, academic background etc.
So I need to do block segmentation to achieve that, where I cluster all text lines that labeled as entity of academic background (such as institution name, year of study, major name)
Here I need to classify each line whether it is academic background or personal details or not.
serene scaffold
@tranquil sage is a text version of the resume already given?
tranquil sage
serene scaffold
<@737237905147297874> is a text version of the resume already given?
yup, the resume originally was in PDF format. now i've extracted them to text using Apache Tika. all of it were in one text files now. to be annotated.
serene scaffold
tranquil sage
yup, the resume originally was in PDF format. now i've extracted them to text us...
I would probably do named entity recognition first on the whole document first. things like address, institution, academic subject. and then figure out where each entity fits in to the bigger picture.
 stoic trench
Hello!
I am trying to filter through a dataset(I refer to as "df") to find specific words in a column called df["Question"].
I used the following code
Code:
def word_filter(dataset, words):
filter = lambda x: all(word.lower() in x.lower() for word in words)
return dataset.loc[dataset["Question"].apply(filter)]
filtered = word_filter(df, ["king", "England's"])
print(filtered["Question"])
Result:
4953 Both England's King George V & FDR put their stamp of approval on this "King of Hobbies"
Name: Question, dtype: object
I am trying to figure out how I can make the function more uniform and applicable to all columns so I attempted the following but its not giving me the exact same results
Code:
def word_filter(dataset, words, column):
filter = lambda x: all(word.lower() in x.lower() for word in words)
return dataset.loc[dataset[column].apply(filter)]
filtered = word_filter(df, ["king", "England's"], "Question")
print(filtered)
Result:
Show_Number Air_Date Round Category Value \
4953 3003 1997-09-24 Double Jeopardy! "PH"UN WORDS 200.0
Question \
4953 Both England's King George V & FDR put their stamp of approval on this "King of Hobbies"
Answer
it seems to be giving me the the rows of all columns associated with the data I am looking for
Any thoughts on how I can improve it?
bold timber
how to fix this error?

 wooden sail
the error message is telling you the vocab property no longer exists. presumably, the link right underneath explains how to use the functions and properties you are being recommended to use instead of vocab. tl;dr: word_vectors.vocab doesn't exist, read what the new equivalent is
bold timber
wooden sail
the error message is telling you the vocab property no longer exists. presumably...
ok, thank you
# Mean of word vector
def vectors(document_list):
    document_embedding_list = []

    for line in document_list:
        doc2vec = None
        count = 0
        for word in line.split():
            if word in model.wv.key_to_index:
                count += 1
                if doc2vec is None:
                    doc2vec = model[word]
                else:
                    doc2vec = doc2vec + model[word]

        if doc2vec is not None:
            doc2vec = doc2vec / count
            document_embedding_list.append(doc2vec)
    return document_embedding_list

document_embedding_list = vectors(prac1['vendor_tag1'])
print('Number of document vector:',len(document_embedding_list))
I got an error like this: TypeError: "'Word2Vec' object is not subscriptable
how to fix this error?
bold timber
on this @rugged ether

can you give me the clue what of the line can be replaced?
I get an error like this

this is what I change

The correct code is to use 'key_to_index', but thank you so much for helping me
Oh yeah, I'm sorry I don't see that Lol🤣
 karmic valley
hey anyone got advice on how i would start learning how to make a neural network for medical images. so feed in medical images and label them. any resources you can ffer?
 quasi pier
Don't know if this is the right place to ask but how do I open the data in a .nc file ? I've tried for an hour now and still can't see the entire data in the files
arctic wedgeBOT
Hey @quasi pier!
It looks like you tried to attach file type(s) that we do not allow (.nc). We currently allow the following file types: .gif, .jpg, .jpeg, .mov, .mp4, .mpg, .png, .mp3, .wav, .ogg, .webm, .webp, .flac, .m4a, .csv, .json.
Feel free to ask in #community-meta if you think this is a mistake.
 warm valley
Hello,
I am using this function to predict the output of never seen images
`
def predictor(img, model):
image = cv2.imread(img)
image = cv2.cvtColor(image, cv2.COLOR_BGR2RGB)
image = cv2.resize(image, (224, 224))
image = np.array(image, dtype = 'float32')/255.0
plt.imshow(image)
image = image.reshape(1, 224,224,3)
label_names = train_ds.class_indices
dict_class = dict(zip(list(range(len(label_names))), label_names))
clas = model.predict(image).argmax()
name = dict_class[clas]
print('The given image is of \nClass: {0} \nSpecies: {1}'.format(clas, name))
how to change it, if I want the top 2 accuracy`
i.e
70% chance its dog
15% its a bear
 lapis sequoia
Guys, I just did kmeans(3).cluster_centers_
Which centroids does it return?
Because I haven't fit in my data yet.
 jaunty belfry
mig = np.array(1).reshape(1,1)
mig
what is the meaning of reshaping a single element array
what it means mathematically
serene scaffold
 desert lotus
<@906320410382061599>
desert lotus
<@906320410382061599>
please don't ping random people to ask for help. instead, put an actual question into the chat that someone can read and start answering.
 lilac tundra
Hello Folks,
I'm trying to install caffe on MacOS Monterey but couldn't find any relevant article for a python newbie like me. Could anyone point me to the right direction please? Any help would be appreciated.
Thanks in advance
desert lotus
lilac tundra
Hello Folks,
I'm trying to install caffe on MacOS Monterey but couldn't find any...
u can get it on python.org
 topaz leaf
from openpyxl import Workbook, load_workbook
import numpy as np

wb = load_workbook("Heat Exchanger Data.xlsx")
ws=wb.active
#initialising variables
Tcold=[]
Thot=[]
lmtd=[]
#columns im interested in
columns=[57,59]


#calculates and returns log mean temperature difference
def paralmtdcalc(hin,hout,cin,cout):
    t1=(hin-cin)
    t2=(hout-cout)
    lmtdval=(t1-t2)/np.log(t1/t2)
    return lmtdval

#iterates by row of excel sheet and stores them in an array
for row in range(2,5):
    for clm in columns:
        Tcold=np.append(Tcold,ws.cell(row,clm).value)
        Thot=np.append(Thot,ws.cell(row,clm+3).value)
hi guys first time using openpyxl was wondering if the library has an issue reading reference cells (i.e values in this cell were calculated using other cells) as i repeatedly get nonetype errors or is this an issue with my code
there are values in columns 57 and 59
 grizzled haven
Hi Guys,
I have on question. Can we have the same bias for all neurons?
lapis sequoia
can someone tell me what's going on in this code
 serene scaffold
lapis sequoia
can someone tell me what's going on in this code
serene scaffold
lapis sequoia
can someone tell me what's going on in this code
!code
arctic wedgeBOT
Here's how to format Python code on Discord:
```py
print('Hello world!')
```
These are backticks, not quotes. Check this out if you can't find the backtick key.
lapis sequoia
Wdym. Is using a picture bad?
serene scaffold
lapis sequoia
Wdym. Is using a picture bad?
yes
 spice mesa
Hey yall...I am trying to get st dev using numpy and needed some help. I need to convert the below line into numpy.
The question I have is how do I get st dev of the last n elements instead of the whole array? numpy.std() does not take the length as a parameter. Any thoughts?
def stDevHi = stDev(high, stDevLength);
serene scaffold
spice mesa
Hey yall...I am trying to get st dev using numpy and needed some help. I need to...
is the array one-dimensional for sure?
spice mesa
serene scaffold
is the array one-dimensional for sure?
Yes. Its just historical prices
lapis sequoia
centers = kmeans.cluster_centers_.reshape(num_cluster, 8, 8)
for axi, center in zip(ax.flat, centers):
    axi.set(xticks=[], yticks=[])
axi.imshow(center) ```also, keep in mind that the style in python is to write st_dev and st_dev_length.
you can use slicing to get the last five elements, so arr[-5:].std()
lapis sequoia
lapis sequoia
```fig, ax = plt.subplots(2, 5, figsize=(8,4))
centers = kmeans.cluster_centers_...
Help
spice mesa
serene scaffold
also, keep in mind that the style in python is to write `st_dev` and `st_dev_len...
Ok let me try that
serene scaffold
lapis sequoia
```fig, ax = plt.subplots(2, 5, figsize=(8,4))
centers = kmeans.cluster_centers_...
looks like it's supposed to plot the cluster centers discovered by kmeans clustering. what does one of the figures look like? (you can use screenshots to show figures.)
lapis sequoia
The images look fine. I don't understand how the code implements that. I know what the images represent
But if you wanna see

These are centroids of the digit-clusters.
serene scaffold
lapis sequoia
The images look fine. I don't understand how the code implements that. I know wh...
fig, ax = plt.subplots(2, 5, figsize=(8,4)) -- create a blank figure
kmeans.cluster_centers_.reshape(num_cluster, 8, 8) -- put the ten images into a (10, 8, 8)-sized array (each (8, 8) slice is one of those images)
for axi, center in zip(ax.flat, centers): -- for each of these...
axi.set(xticks=[], yticks=[]) -- make the axis labels blank
axi.imshow(center) -- show the image
lapis sequoia
And why was ax.flat done
serene scaffold
I don't know
 wicked grove
Hello, i have a doubt
My model gives different accuracies on the same test set each time i run it
How can i make sure this doesn't happen, as it extremely stochastic and idk which result to save
spice mesa
serene scaffold
also, keep in mind that the style in python is to write `st_dev` and `st_dev_len...
@serene scaffold I just tried that. While it works, it returns a scalar value however I need to return an array. I basically need st_dev at each index. Let me know if that does not make sense.
spice mesa
spice mesa
<@253696366952316929> I just tried that. While it works, it returns a scalar val...
@serene scaffold I did arr[:length] and I think that worked. I need to validate the numbers Thanks for your help
serene scaffold
spice mesa
<@253696366952316929> I just tried that. While it works, it returns a scalar val...
so you need a sliding window of the standard deviation for five values?
spice mesa
serene scaffold
so you need a sliding window of the standard deviation for five values?
Yes....sorry I should stated that
serene scaffold
@spice mesa would be easier to do with a pandas Series: https://pandas.pydata.org/docs/reference/api/pandas.Series.rolling.html
 fringe prairie
Hello People!This is Prasanth and im a CS 3rd year Btech student from India. I need a deep learning model which takes only one picture of a person and then have to save his/her photo for future use. now whenever we given that persons picture to the model it needs to identify the person and predicts him accurately.(need face recognition) but the main problem is i want to store host the model online and develop an application with authentication of the user. so if the user ever logouts or uninstalls the application , and reinstalls it and then logged in his account, then the model already trained needs to identify his face
how can i make this ?
in simple words - as far my knowledge after deployement or training we can only use the model for trained set of faces only. (like if we trained with 5 person faces it can only recognize those 5 people) but i need a model that will be deployed and can be trained with just one picture of the user and has to identify them even they logged out and logged in the application(as once the training is done). and mainly as the model hosted online new users will use the app and i dont know how an already trained model can detect new users faces (bcoz model never hadnt trained with the new users face right?)]
how can i achieve the solution for this problem
im a beginner and guide me if im wrong about my knowledge.
i need an dl model that simlutaneously predicts already trained users faces and alse needs to be trained with new user faces too.
spice mesa
serene scaffold
<@587037680164929568> would be easier to do with a pandas Series: https://pandas...
I would love to do Pandas Series however I am limited to numpy. Need to use array's only
serene scaffold
spice mesa
I would love to do Pandas Series however I am limited to numpy. Need to use arra...
who is imposing this limitation?
spice mesa
I am using a tool called deephaven which is developed in Java and works iwth Python. If I use Pandas, it creates a disconnected dataset. I have to use array's if I want real time data updates.
 lilac kindle
fringe prairie
Hello People!This is Prasanth and im a CS 3rd year Btech student from India. I n...
lilac kindle
fringe prairie
Hello People!This is Prasanth and im a CS 3rd year Btech student from India. I n...
the point of training is for the model to be used with inputs that were not part of training correct?
spice mesa
So @serene scaffold I guess I need a rolling st_dev
spice mesa
serene scaffold
who is imposing this limitation?
@serene scaffold I think I found a solution. Wanted to share with you.
def rolling_window(a, window):
    shape = a.shape[:-1] + (a.shape[-1] - window + 1, window)
    strides = a.strides + (a.strides[-1],)
    return numpy.lib.stride_tricks.as_strided(a, shape=shape, strides=strides)

stDevHi = numpy.std(rolling_window(high, stDevLength), 1)
https://stackoverflow.com/questions/6811183/rolling-window-for-1d-arrays-in-numpy
 steel vector
return tf.nn.softmax_cross_entropy_with_logits(
Node: 'categorical_crossentropy/softmax_cross_entropy_with_logits'
logits and labels must be broadcastable: logits_size=[10,10] labels_size=[10,5]
[[{{node categorical_crossentropy/softmax_cross_entropy_with_logits}}]] [Op:__inference_train_function_925]
2022-04-22 22:26:05.679486: W tensorflow/core/kernels/data/generator_dataset_op.cc:107] Error occurred when finalizing GeneratorDataset iterator: FAILED_PRECONDITION: Python interpreter state is not initialized. The process may be terminated.
[[{{node PyFunc}}]]
steel vector
steel vector
return tf.nn.softmax_cross_entropy_with_logits(
Node: 'categorical_crossentropy/...
can anyone help me with this
arctic wedgeBOT
Hey @steel vector!
You either uploaded a .txt file or entered a message that was too long. Please use our paste bin instead.
steel vector
steel vector
steel vector
https://paste.pythondiscord.com/raw/osuronimed
code
 vital oriole
I'm uninstalling anaconda from a windows machin and OF COURSE they cannot be bothered to make it straight forward to unistall like 95% of everyother software program
...so refering to this: https://docs.anaconda.com/anaconda/install/uninstall/
How do I know qwhich is the 'root of your install'?
Like here👍 is where navigator is: C:\Users\adankert\.anaconda
Should I delete that file?
or C:\Users\adankert\.ipython
?
THis file?:C:\Users\adankert\.spyder-py3
 latent lintel
anyone has experience in deep learning // Extreme learning machine in particular ?
 odd meteor
S/O to whoever is in charge of regularly designing and changing the profile image of this server ... I think it's kinda refreshing to see 😀
mild dirge
latent lintel
anyone has experience in deep learning // Extreme learning machine in particular...
Ask your question, not if there is an expert that can help you
karmic valley
someone can give me resource to learn how to make neural network for medical images
?
 candid pollen
hey is there any one can help me? what im trying to do is to get some values from some roi, and train that data to make a prediction
karmic valley
help how to add p values

like compare one group to another in plot
automatically work out and add p values
 modern cypress
Am I stupid or is this calculation wrong?

 mild dirge
n(truth) is not the same as correctly classified
Not sure what it actually is, but it is bigger than the n(classified) in a certain row
modern cypress
mild dirge
Not sure what it actually is, but it is bigger than the n(classified) in a certa...
the number of truths (the number of actual cases found in the class) and the number of classified (the number of cases classified as belonging to that class)
oh
so i am stupid
arctic wedgeBOT
:incoming_envelope: :ok_hand: applied mute to @hollow sun until <t:1650670189:f> (9 minutes and 59 seconds) (reason: duplicates rule: sent 4 duplicated messages in 10s).
 misty flint
is pandas' .get_dummies() basically one hot encoding?

or am i misunderstanding the documentation
wicked grove
Hello,i have been training my model using kfold and i have used used the numpy set random to set the seed
Yet every time the model gives a different result on the test set abd idk why one to save
It is so stochastic,can someone please tell me how i can solve this
 patent igloo
How did u guys begin learning data structures
bold timber
why the number of rows is different from the amount of index?

 austere swift
it could be because of an index modification of some sort
reset the index by calling the df.reset_index() function and see if that works
lapis sequoia
patent igloo
How did u guys begin learning data structures
I learned some basics with Datacamp&Dataquest, but I feel like they rush through the material sometimes. Now I practice more with my own small projects that I find online (free) & Codecademy
odd meteor
Isn't this Word Embedding? You could leverage already available word vector models instead of building yours from scratch. There's word2vec, GloVE, BloomEmbedding etc
 pearl fable
Hi, how do I load a .svm and .jsonl format dataset into jupyter as csv format? Please help
bold timber
austere swift
it could be because of an index modification of some sort
ok thank you
 tawny coral
Has anyone used blender to deliver better visualizations to clients? Can you tell me about your experience if so?
 ornate spindle
how to extract data from multiple pages at a same time?
serene scaffold
ornate spindle
how to extract data from multiple pages at a same time?
multiple pages of what?
and by "at the same time" do you mean "in parallel"?
 thorny otter
Any data science learner??
serene scaffold
thorny otter
Any data science learner??
are we not all learners?
thorny otter
We all are.
Buddies I want to learn skills in data science bt i have no a good roadmap thah what to learn first, what to learn after this, I want a step by step roadmap.
Can you help me??
 tall pulsar
thorny otter
Any data science learner??
tall pulsar
thorny otter
Any data science learner??
Yes here
thorny otter
tall pulsar
Yes here
Hello
thorny otter
Going to
tall pulsar
What are you persuing now.
thorny otter
Engineering brother!!
tall pulsar
B.tech?
thorny otter
Yup
tall pulsar
Same here brother!
wooden sail
from the math side, the core competencies for introductory data science is usually linear algebra, multivariable calculus/optimization, and statistics. if you're using python, you have several options on the library side. you can do lower level stuff with numpy and jax, for example. scipy is a bit higher level. then there's stuff like pytorch and tensorflow, which is (usually, but not necessarily) higher level than the previous ones i mentioned (by higher level i mean more abstract and requiring you to deal less with the nitty-gritty)
interestingly, the 3 topics i mentioned CAN interact and overlap quite a bit, but can also be learned largely independently of each other, so you can almost learn them in whatever order you see fit
lapis sequoia
i want to learn ml which branch should i use
serene scaffold
lapis sequoia
i want to learn ml which branch should i use
do you know what the branches of ML are?
lapis sequoia
serene scaffold
do you know what the branches of ML are?
uh i dont mean that i mean there are like deep learning and all sorry i used wrong word
serene scaffold
lapis sequoia
uh i dont mean that i mean there are like deep learning and all sorry i used wro...
deep learning requires a lot of advanced knowledge, and you can learn a lot about ML without touching it
lapis sequoia
serene scaffold
deep learning requires a lot of advanced knowledge, and you can learn a lot abou...
ohh so where i should start
serene scaffold
what is your goal?
serene scaffold
what is a chat detector?
lapis sequoia
chat detector means that take a look at chat and autodetect bad sentences
serene scaffold
bad sentences. what makes a sentence bad?
lapis sequoia
like rude and all
serene scaffold
a profanity filter is relatively simple, but something that measures rudeness would be quite complicated
lapis sequoia
i want to do camera relative stuff
for now
and
like if i give him a photo of dog so it detect dog and all
this kinds of
wooden sail
for that, i'd recommend precisely what i had described above, if your goal is to understand image classification and segmentation well. if you only wish to use libraries, you don't really need much more than to watch a few videos on youtube or coursera on deep neural networks, classification, and segmentation. if you want to go more in depth and design your own stuff, you'll need to do statistics, linalg, convolutions, etc and be able to choose or create your own cost functions as needed (e.g. using differential equations or statistical targets)
wicked grove
hello i have set up grid search cv in this way, can someone pls tell me if it is correct
model1 = KerasClassifier(build_fn=create_model, epochs=50, batch_size=32, verbose=0)
# define the grid search parameters
params = {'learn_rate': [0.1, 0.01, 0.001],'dropout': [0.2, 0.3, 0.4, 0.5],'epochs': [50,80,100]}
grid = GridSearchCV(estimator=model1, param_grid=params, n_jobs=-10, cv=5,)
grid_result = grid.fit(X,Y,callbacks=[early_stopping])
# summarize results
print("Best: %f using %s" % (grid_result.best_score_, grid_result.best_params_))
means = grid_result.cv_results_['mean_test_score']
stds = grid_result.cv_results_['std_test_score']
params = grid_result.cv_results_['params']
for mean, stdev, param in zip(means, stds, params):```Are there any good resources on how to interpret accuracy and loss curves?
I'm also not sure why there was an outlier on epoch 9

 tidal bough
it looks to me like both your train and val are steadily climbing still, so might be good with some more epochs
I don't know any general guides on how to interpret them, but there's plenty resources on how specific patterns (overfitting, underfitting, etc) look, I think
mild dirge
Yeah it might help to average the curves over multiple runs
It seems that accuracy changes a lot over each epoch, so it would be good to do multiple runs so you can visualize the average and the standard deviations for each epoch
modern cypress
mild dirge
It seems that accuracy changes a lot over each epoch, so it would be good to do ...
Ahhh let me try that
modern cypress
tidal bough
it looks to me like both your train and val are steadily climbing still, so migh...
I had noticed this too, so I wrote "As the validation curve has not started to plateau towards the end of the graph, another assumption can be made that the model has not reached its final potential and should be continued to train until there is a significant plateau."
Need to fix wording but gets that general idea across i hope
 frank edge
maybe dataset isnt consistent
modern cypress
Yeah one of my classes has something like 4 times the images of other classes
Because I needed to make sure that class was especially being correctly identified
tidal bough
if it's 80% of the dataset, then 80% accuracy can correspond to quite a low f-score (because reaching 80% acc on such a dataset is as simple as guessing the most common class no matter what)
modern cypress
I have that class with 2000 images, and then 5 other classes each with 500 images
I know it's not an ideal situation :I
frank edge
do you using shuffle?
modern cypress
Mhmm

I learned a lot from this project tbh. I wish I could go back and re-do it all, but unfortunately the deadline is very soon, so time doesn't allow
wooden sail
ML tasks usually deal with grossly nonconvex target functions and noisy data. using stochastic gradient-like methods, this sort of behavior can occur due to the gradients not being quite right at each iteration (the step size schedule takes care of this through an averaging effect, eventually converging to a true, though possibly local, minimizer). the cost functions are also formulated statistically in many cases, too. this means that you expect the behavior of the learned model to be accurate "on average", not exactly right for every single data set you present the model with
contrast this with model-driven (as opposed to data-driven) techniques where exact knowledge of a couple of orders of differentials lets you more accurately define trust regions so that you can ensure the cost decreases at every single iteration
serene scaffold
 woven coral
how can i check custom text real or fake??
woven coral
how can i check custom text real or fake??
I do not look at screenshots of code. Can you explain what you mean by "real text" or "fake text"?
serene scaffold
woven coral
it is a fake news detection model
last time I looked into fake news detection, the technique is to track the flow of information on the internet back to a known source of misinformation.
woven coral
i want to know news hedline or news is real or not
serene scaffold
woven coral
i want to know news hedline or news is real or not
how is an LSTM supposed to do that?
woven coral
wait
serene scaffold
Sure. but keep in mind that I won't look at screenshots of code/text
woven coral

I will show you how to do fake news detection in python using LSTM. LSTM is a deep learning method to train ML model. I will be also using here gensim python package to generate word2vec matrix. This method is 99% accurate as shown in this video lecture. Please like and subscribe this channel.
Dataset: https://github.com/laxmimerit/fake-real-ne...
check this video
serene scaffold
I don't have time to watch an hour and a half long video.
serene scaffold
well, like I said, the technique that I'm familiar with is about identifying instances of the same news story throughout the internet, and tracing the origin of the information. I'm skeptical that a model trained on existing data could potentially predict the truthfulness of future headlines.
but if you need help with a specific issue, you can ask.
woven coral
wait
 iron basalt
No model (unless the model is trained on a giant set of things considered true/real, but that is basically the same as checking some trusted sources (and it won't work for breaking news)) can tell if something is fake news or not based just on title (actually impossible), the best that can be done is what @serene scaffold mentioned, you check with some trusted source, and/or check if it's from an untrusted source. You could maybe do something like a clickbait detection (seems scam-ish / clickbait-like).
arctic wedgeBOT
Hey @woven coral!
It looks like you tried to attach file type(s) that we do not allow (.ipynb). We currently allow the following file types: .gif, .jpg, .jpeg, .mov, .mp4, .mpg, .png, .mp3, .wav, .ogg, .webm, .webp, .flac, .m4a, .csv, .json.
Feel free to ask in #community-meta if you think this is a mistake.
serene scaffold
you could also see if the headline contains words that are bombastic or absurd, but that hasn't been as effective since 2016.
woven coral
x=[""]
x=tokenizer.texts_to_sequences(x)
x=pad_sequences(x,maxlen=maxlen)
serene scaffold
woven coral
check this pic
I've said twice that I won't look at screenshots.
woven coral
(model.predict(x) >=0.5).astype(int)
serene scaffold
x=tokenizer.texts_to_sequences([""]) -- what is this intended to do?
woven coral
x=["this is a real news"]
x=tokenizer.texts_to_sequences(x)
x=pad_sequences(x,maxlen=maxlen)
 surreal rock
hi all im new to machine learning
woven coral
(model.predict(x) >=0.5).astype(int)
surreal rock
i have a question: what does the training set mean? m = training set....
woven coral
if x=[""] is real it will give me 1 out put if it is fake it will give 0
serene scaffold
surreal rock
i have a question: what does the training set mean? m = training set....
generally speaking, machine learning is about identifying patterns from training data, and then seeing if it can apply those patterns to get the right answer on test data.
surreal rock
serene scaffold
generally speaking, machine learning is about identifying patterns from training...
so would you say the training set is the entire set of values ...all the x's and y's?
woven coral
x=["“The Trump campaign has confirmed to Hannity.com that Mr. Trump did indeed send his plane to make two trips from North Carolina to Miami, Florida to transport over 200 Gulf War Marines back home.”
— quote in article titled “200 Stranded Marines Needed A Plane Ride Home, Here’s How Donald Trump Responded,” Sean Hannity Show website, May 19, 2016"]
x=tokenizer.texts_to_sequences(x)
x=pad_sequences(x,maxlen=maxlen)
in [" "] it is a fake news
serene scaffold
surreal rock
so would you say the training set is the entire set of values ...all the x's and...
both the training and test sets have x and y values.
surreal rock
serene scaffold
both the training and test sets have x and y values.
test set means the values retrieve from the learning program?
woven coral
yh
in this model i used lstm,gensim,word2vec
but when i used one hot encoding insted of word2vec
serene scaffold
surreal rock
test set means the values retrieve from the learning program?
for the training data, the model is given both the x and y values, so that it can learn how to return the right y values given the x values.
for the test data, the x values go into the model, and you see if the y value it returns is the correct one.
surreal rock
serene scaffold
for the training data, the model is given both the x and y values, so that it ca...
ohhh ok the test is purely practice values. ok thank you that was a great explanation
serene scaffold
surreal rock
ohhh ok the test is purely practice values. ok thank you that was a great explan...
you are welcome 💚
woven coral
i dont know how can i check real or fake news on on hot encoding
serene scaffold
woven coral
i dont know how can i check real or fake news on on hot encoding
neither do I. I don't think that you can.
woven coral
what should i do
serene scaffold
woven coral
what should i do
try a different beginner project
woven coral
but i want to this
serene scaffold
AI isn't a crystal ball. it's one thing to build a model that can predict things when the factors that cause that thing are known
you're trying to build an AI that can ascertain whether or not a proposition is true or not, even when that proposition hasn't been conceived yet.
woven coral

iron basalt
It would be really complicated. Not a beginner project, and IDK if anyone has ever done it.
serene scaffold
in fact, if this were possible, someone should build it and try headlines about stocks going up or down
iron basalt
Also way more than just ML involved.
woven coral
it is deep learning model
iron basalt
The type of thing I would expect maybe some large government to invest into making, given all the data they have access to.
serene scaffold
woven coral
it is deep learning model
"deep learning" just means "neural network with lots of layers". it does not mean that it can predict the future.
iron basalt
But even then, I doubt anyone has made it (work well).
serene scaffold
do you understand how what you are trying to do is tantamount to predicting the future?
surreal rock
serene scaffold
you are welcome 💚
one more question if you dont mind....is there a standard formula for the variables....x, y, h, m.....x = input value, y = output value, h = hypothesis, m = training set....
serene scaffold
surreal rock
one more question if you dont mind....is there a standard formula for the variab...
x_test, y_test, x_train, y_train
woven coral

serene scaffold
@woven coral I'm not trying to discourage you. I'm trying to help steer you towards a project that is more obtainable and potentially fulfilling for you
surreal rock
jsut a guy trying to help...or girl
woven coral
serene scaffold
<@965172868805701664> I'm not trying to discourage you. I'm trying to help steer...
i know
woven coral
serene scaffold
<@965172868805701664> I'm not trying to discourage you. I'm trying to help steer...
thanks
surreal rock
serene scaffold
<@965172868805701664> I'm not trying to discourage you. I'm trying to help steer...
just rying not to be sexist 😂
serene scaffold
surreal rock
just rying not to be sexist 😂
I usually try to give short answers with emojis. that one was to indicate that I am boy.
surreal rock
serene scaffold
I usually try to give short answers with emojis. that one was to indicate that I...
no offense to this teacher but his english is difficult to understand...im assuming he is saying that m = the total number of value sets in this example... set meaning x and y
 surreal rock
serene scaffold
I usually try to give short answers with emojis. that one was to indicate that I...
surreal rock
serene scaffold
I usually try to give short answers with emojis. that one was to indicate that I...
i understood
serene scaffold
surreal rock
no offense to this teacher but his english is difficult to understand...im assum...
we would call those "{training,test} instances". looks like the point here is to discover the relationship between the size of a residence and the price?
 rough mountain
I have a binary classifier. It has 98% accuracy. Is there anyway I could push it even further now that it's trained?
serene scaffold
rough mountain
I have a binary classifier. It has 98% accuracy. Is there anyway I could push it...
Depending on what library you used to create the model, you might be able to continue training it with additional data, if you have data it hasn't already been trained on. But that 2% might represent instances that are genuinely ambiguous
surreal rock
can anyone make out what is this symbol under the sigma symbol
 serene scaffold
surreal rock
can anyone make out what is this symbol under the sigma symbol
serene scaffold
surreal rock
can anyone make out what is this symbol under the sigma symbol
i = 1, with the dot of the i confusingly placed
surreal rock
THANK YOUU
serene scaffold
surreal rock
THANK YOUU
you are welcome 💚 any other questions about the notation used here?
mild dirge
Professors who write stuff by hand...
serene scaffold
mild dirge
Professors who write stuff by hand...
anyone who has a PhD or MD should not be allowed to write by hand.
surreal rock
serene scaffold
you are welcome 💚 any other questions about the notation used here?
can you help me read this formula...
serene scaffold
I write on a tablet when I listen to lectures, and I tend to erase and rewrite stuff a lot to make it all look good. but I think students would find that obnoxious if I were to display my tablet on a screen and write on it while lecturing. (I have never been a lecturer)
serene scaffold
surreal rock
can you help me read this formula...
I would need to see the rest of the context to be sure about h, but the superscript (i)s are "the ith element", presumably of the weights.
surreal rock
serene scaffold
I would need to see the rest of the context to be sure about `h`, but the supers...
i think he is just setting up the formula so we have something to base off of, similar to a quadratic formula ax2 + bx + c
surreal rock
serene scaffold
I would need to see the rest of the context to be sure about `h`, but the supers...
ok i found out the name of the formula, square error function(cost function) which he said is used in most cases of regression
odd meteor
modern cypress
I'm also not sure why there was an outlier on epoch 9
It appears your model could still learn a thing or two (pun intended) 😀 from your data had you allowed it more training time
If we're strictly gonna use this curve to judge, you could see that your validation accuracy started to decline beyond the 13th epoch but there's every possibility it could still peak.
Looking at both curves very well, one could argue that this curve is simply telling you that your model hasn't quite finished learning. It needs more data!
Try to increase the number of epochs and monitor what's gon happen next. I think it'll be fun to find out 😀
misty flint
geopandas is pretty cool
def recommend if you are working with spatial data
you just need latitude and longitude
lapis sequoia
Does anyone here understand variational inference? I'm havinga hard time getting some things about it.
lapis sequoia
To anybody using dataclasses, where exactly would you use it?
I'm struggling to find any uses that aren't easier with dictionaries or pandas
serene scaffold
lapis sequoia
I'm struggling to find any uses that aren't easier with dictionaries or pandas
dataclasses are intended to reduce the amount of boilerplate when you define a class. but we don't define classes very often on the data science side of things.
lapis sequoia
serene scaffold
dataclasses are intended to reduce the amount of boilerplate when you define a c...
makes sense
serene scaffold
lapis sequoia
makes sense
using a dataclass is preferable to having a bunch of dicts with equivalent sets of keys. but if you're in that situation when you're doing data science, then it probably makes more sense to have all those would-be dicts/dataclass instances as rows of a dataframe
lapis sequoia
serene scaffold
using a dataclass is preferable to having a bunch of dicts with equivalent sets ...
yeah that's what I was thinking, most of my day to day processing just involves piping various dataframe apply functions
if it's not too complex I tend to just default to dictionaries
serene scaffold
lapis sequoia
yeah that's what I was thinking, most of my day to day processing just involves ...
are you sure you have to be using .apply?
lapis sequoia
should I not be?
serene scaffold
apply doesn't benefit from any of pandas' optimizations
it's just there for convenience if nothing else will do.
lapis sequoia
I thought it was the faster way to do row by row operations
apply with lambda functions
serene scaffold
nope, it's the same as looping over the rows.
serene scaffold
you have to use one of the actual pandas methods
lapis sequoia
I mean I vectorise where possible
serene scaffold
when you say that you vectorize, do you mean that you're using apply?
lapis sequoia
I mean if it's simple enough I try to default to numpy arrays and just use normal quant functions
If it's more complicated, like a series of if statements, I'll define the condition as a function and use .apply with a lambda function
If I'm just slicing a dataframe, like identifying specific date ranges, I'll use the build in functions
serene scaffold
well, like I said, that's the same as looping over the series/dataframe in pure Python, and it doesn't benefit from any optimizations. so you might see if there's ways to accomplish what you're doing in terms of the pandas API
lapis sequoia
I mean I try to use built in functions where possible
I'm just wondering where a dataclass would fit into this
 stiff pollen
can any one help me with sql
 tall blaze
stiff pollen
can any one help me with sql
tall blaze
stiff pollen
can any one help me with sql
What’s your question
serene scaffold
stiff pollen
can any one help me with sql
there's a #databases channel for that, but please always ask your actual question; you'll irritate people if you post teasers for questions without giving enough information for someone to answer it.
tall blaze
I’ll help you out in the db channel if I know the answer too!
tall blaze
serene scaffold
there's a <#342318764227821568> channel for that, but please always ask your act...
Unrelated, but if I have a question about a git api where would I ask it?
serene scaffold
tall blaze
Unrelated, but if I have a question about a git api where would I ask it?
lapis sequoia
Anyone here who is learn IBM professional certificate form Coursera?
 tawdry fog
Need help please: I want to find the n most frequent Sequences of Strings in a pandas DF. So the DF has a Column containing Names of Persons and I want to find out which names typically occur in succession. Sequence length is 2 and no gaps.
tawdry fog
from nltk import ngrams
from collections import Counter
ngram_counts = Counter(ngrams(text.split(), 2))
ngram_counts.most_common(25)
this is the answer 😄
 tame zodiac
Hey guys, quick question: Can somebody recommend a tutorial for a model pipeline? Should contain data cleaning to perhaps improving data, following usage of a ML algorithm?
I'm trying to learn to use that model for a web application.
 cinder matrix
Hi can someone please advise on the best metric to use to automatically evaluate generated sentences, please @ when replying
serene scaffold
cinder matrix
Hi can someone please advise on the best metric to use to automatically evaluate...
what are you trying to evaluate about them?
serene scaffold
so it generates sentences, and you want to evaluate if they sound realistic or not?
 gentle nexus
How to fix missing values with pipeline?
cinder matrix
serene scaffold
so it generates sentences, and you want to evaluate if they sound realistic or n...
ideally, but i dont think we have the tech for that..closest thing to that is similarity measures with ngram overlap etc
serene scaffold
cinder matrix
ideally, but i dont think we have the tech for that..closest thing to that is si...
you would have to get a bunch of humans and ask them to rate how realistic they think the sentences sound. or see if they can spot the generated sentences among real ones.
f1 is for classification tasks and this is not that.
cinder matrix
so i should go for recall and precision? as far as automatic evaluation is concerned
serene scaffold
cinder matrix
so i should go for recall and precision? as far as automatic evaluation is conce...
no. those are also for classification tasks. you can't evaluate how realistic a sentence sounds automatically.
cinder matrix
most papers included it though along with human evaluation
am only an undergrad student i wont have time to survey bunch of people
serene scaffold
then they're doing some kind of classification
mild dirge
Ikkor said they had some keywords and target sentences
So there already are desired sentences to use to measure how good the generated ones are
serene scaffold
so you're trying to measure how similar a generated sentence is to a target sentence?
cinder matrix
this one used bleu
 cinder matrix
serene scaffold
so you're trying to measure how similar a generated sentence is to a target sent...
cinder matrix
serene scaffold
so you're trying to measure how similar a generated sentence is to a target sent...
i guess i would have to do that
and then conclude that the best metric would be human
cinder matrix
serene scaffold
so you're trying to measure how similar a generated sentence is to a target sent...
for this do you recomend running the metric through each row of my dataset and avaeraging the scores>
serene scaffold
cinder matrix
for this do you recomend running the metric through each row of my dataset and a...
so you've decided what metric to use and how you will calculate it in the context of what you are doing?
serene scaffold
cinder matrix
i think am gonna use all 💀
you can't say that you're going to use "every evaluation metric" if you don't know how you're going to calculate it
cinder matrix
bleue and rouge for example is just 1 line code
serene scaffold
can you show me with code how you are going to calculate the bleue score?
cinder matrix
pseudocode yeah like
calculate_bleu(generated sentence,expected sentence)
perfect bleu is 1 when both are same
serene scaffold
nope. has to be working code.
cinder matrix
from nltk.translate.bleu_score import sentence_bleu
reference = [['this', 'is', 'a', 'test'], ['this', 'is' 'test']]
candidate = ['this', 'is', 'a', 'test']
score = sentence_bleu(reference, candidate)
print(score)
the closer the candidate is to the reference, the higher the score
serene scaffold
alright. so yes, you can take the average of all those scores to report the performance of the whole system.
serene scaffold
do you at least now have an appreciation for what AI actually is, as compared to how it's understood by the public?
cinder matrix
XD didn't know it was that hard like, i don't even grasp how people write machine learning models from scratch
layers and stuff, am just finetuning existing one
gentle nexus
How to fix missing values with pipeline?
 wispy walrus
Guys how can i hot encode an array so i can use as training data

this are my datas
serene scaffold
wispy walrus
you can one-hot encode each genre
wispy walrus
how can i do that
serene scaffold
sklearn has it. try looking into it and come back if you can't figure it out
serene scaffold
well, try looking into one hot encoding with sklearn
wispy walrus
I've done and it seems to work
but...
when i run the fit
it never compleates
my codelab model crushed because took all the ram
tame zodiac
tame zodiac
Hey guys, quick question: Can somebody recommend a tutorial for a model pipeline...
push
 tacit basin
tame zodiac
Hey guys, quick question: Can somebody recommend a tutorial for a model pipeline...
tacit basin
tame zodiac
Hey guys, quick question: Can somebody recommend a tutorial for a model pipeline...
 unique flame
I am trying to check if there are any duplicate values in my dataframe (115x6) and at the moment I'm just using a for-loop with an if statement. Is there an inbuilt function that does that? After googling for a while I came across Dataframe.duplicated(), but I think that only checks for duplicates in a column or row (https://www.geeksforgeeks.org/python-pandas-dataframe-duplicated/).
odd meteor
unique flame
I am trying to check if there are any duplicate values in my dataframe (115x6) a...
Yes there is an inbuilt function for that in Pandas.
df.duplicated().sum() <---- to check the total number of duplicates in your datasetdf.drop_duplicates(keep='first', inplace=True) <---- drop duplicate rows and keep the first
arctic wedgeBOT
Hey @eager remnant!
It looks like you tried to attach file type(s) that we do not allow (.pdf). We currently allow the following file types: .gif, .jpg, .jpeg, .mov, .mp4, .mpg, .png, .mp3, .wav, .ogg, .webm, .webp, .flac, .m4a, .csv, .json.
Feel free to ask in #community-meta if you think this is a mistake.
 eager remnant
hey guys i'm working on "data mining "project for university and i'm running into an error when trying to set up the model for prediction
ValueError: Found input variables with inconsistent numbers of samples: [5090096, 1272524]
exported an html version( to pdf )of the notebook to give more context but i can't upload it here
when i looked online i saw that the error is caused by the two variables not havingthe same structure but when i printed them out to see it didn't seem like the case for me.
i tried dropping both rows from the both variables x and y but i still get the same error just on different rows (one of them non existant ~out of bounds)

hey guys i'm working on "data mining "project for university and i'm running into an error when trying to set up the model for prediction
ValueError: Found input variables with inconsistent numbers of samples: [5090096, 1272524]
exported an html version( to pdf )of the notebook to give more context
when i looked online i saw that the error is caused by the two variables not havingthe same structure but when i printed them out to see it didn't seem like the case for me.
i tried dropping both rows from the both variables x and y but i still get the same error just on different rows (one of them non existant ~out of bounds)
odd meteor
gentle nexus
How to fix missing values with pipeline?
You can import an imputer from sklearn and then add the imputer object in the pipeline you created to handle missing values.
 flat geode
Hi guys! Hope you’re fine.
Need some help from an expert for an IA and data analysis Python project
I’m help inge a girl with her homework but i got lost and i cant do it alone 😢
Helping *
tall pulsar
flat geode
Hi guys! Hope you’re fine.
Need some help from an expert for an IA and data anal...
Ask the question, let me see if I can get it!
mild dirge
@flat geode ?
tall pulsar
Hey I have a question about Data Science Career
flat geode
They are exercises in classification algorithms, validation techniques and evaluation measures.
Also decision training, implemented in scikit-learn, and calculate the training time.
tall pulsar
flat geode
They are exercises in classification algorithms, validation techniques and evalu...
I think it's hard for me to help 🙄
flat geode
For example in an exercise talk about matplotlib.errorbar to represent the standard deviation.
 warm swan
from matplotlib import pyplot as plt
from tensorflow.keras.datasets import cifar100, mnist

(x_train, y_train), (x_test, y_test) = cifar100.load_data()

bed_id = (y_train == 5).reshape(x_train.shape[0])
bicycle_id = (y_train == 8).reshape(x_train.shape[0])
girl_id = (y_train == 35).reshape(x_train.shape[0])
keyboard_id = (y_train == 39).reshape(x_train.shape[0])
orchid_id = (y_train == 54).reshape(x_train.shape[0])
rocket_id = (y_train == 69).reshape(x_train.shape[0])
streetcar_id = (y_train == 81).reshape(x_train.shape[0])

bed_images = x_train[bed_id]
bicycle_images = x_train[bicycle_id]
girl_images = x_train[girl_id]
keyboard_images = x_train[keyboard_id]
orchid_images = x_train[orchid_id]
rocket_images = x_train[rocket_id]
streetcar_images = x_train[streetcar_id]


for i in range(70):
    plt.subplot(7, 10, i + 1)
    if i < 10:
        plt.imshow(bed_images[i % 10])
    elif 10 <= i < 20:
        plt.imshow(bicycle_images[i % 10])
    elif 20 <= i < 30:
        plt.imshow(girl_images[i % 10])
    elif 30 <= i < 40:
        plt.imshow(keyboard_images[i % 10])
    elif 40 <= i < 50:
        plt.imshow(orchid_images[i % 10])
    elif 50 <= i < 60:
        plt.imshow(rocket_images[i % 10])
    elif 60 <= i < 70:
        plt.imshow(streetcar_images[i % 10])

plt.show()
I want to add a class label text in front of each line like this documentation example image: https://www.cs.toronto.edu/~kriz/cifar.html
How can I add text in the beginning of each line?
 nova saffron
Hi guys  I am gonna start learning Python for data analysis. Does anyone have some tips and useful info to share with a noob?
eager remnant
solved ☑️
mild dirge
flat geode
For example in an exercise talk about matplotlib.errorbar to represent the stand...
If you need help here, please ask a concrete question that can be answered
surreal rock
can someone please help me understand how is the professor simplifying J of theta 1????
 lapis sequoia
surreal rock
can someone please help me understand how is the professor simplifying J of thet...
lapis sequoia
surreal rock
can someone please help me understand how is the professor simplifying J of thet...
It's the vertical difference between the actual y label and the predicted y co-ordinate for that same x. After that they square it and take average of it for all the predicted data points.
surreal rock
yea i was looking on youtube to see.... its basically y(actual value) - mx + b
lapis sequoia
surreal rock
im still not understanding where he got the 3 zero squared tho
Because. The points lie on the line.
So zero vertical distance
Y actual=MX+b
surreal rock
lapis sequoia
So zero vertical distance
hypothesis line has zero( y value) distance from the actual line....correct?
lapis sequoia
surreal rock
oh so the error is 0 basically
I think so
lapis sequoia
surreal rock
hypothesis line has zero( y value) distance from the actual line....correct?
Yup. There's no actual line though. Just actual points
Only hypothesis line. Because it's linear regression
surreal rock
lapis sequoia
Only hypothesis line. Because it's linear regression
yea man, linear regression is what im learning. we hit a subject call cost function. and the teacher isnt explaining it right so i had to go to a 3rd party to better understnd
 ornate sky
hey any data analysts here ?
misty flint
how do you guys feel about these points https://en.m.wikipedia.org/wiki/AI_Superpowers
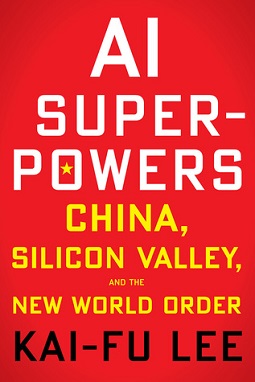
AI Superpowers: China, Silicon Valley, and the New World Order is a 2018 non-fiction book by Kai-Fu Lee, an Artificial Intelligence (AI) pioneer, China expert and venture capitalist. Lee previously held executive positions at Apple, then SGI, Microsoft, and Google before creating his own company, Sinovation Ventures.


 amber plaza
Hello there. I've a question: since almost every Data Science Jobs I've requiere at least +2 years of experience in de field... Is there any way to break in the field? Maybe from web design full stack first?
serene scaffold
amber plaza
Hello there. I've a question: since almost every Data Science Jobs I've requiere...
I had to apply to like 200+ positions before I found one that would hire me fresh out of undergrad, so it's a difficult space to break into for sure. what made the difference is that I published.
web development isn't going to help you break into data science. if nothing is working out currently, you may need to get a masters.
lapis sequoia
how would i start learning to make ais in python? like where can i start what lib i should use and things i should learn?
serene scaffold
lapis sequoia
how would i start learning to make ais in python? like where can i start what li...
!resources data science
arctic wedgeBOT
The Resources page on our website contains a list of hand-selected learning resources that we regularly recommend to both beginners and experts.
lapis sequoia
serene scaffold
!resources data science
thank you!
 safe elk
misty flint
safe elk
misty flint
Actually great points to discuss over coffee cant argue...unless the paradigm shifts again then their advantages hold..
misty flint
safe elk
Actually great points to discuss over coffee cant argue...unless the paradigm sh...
i think their advantages will only snowball
tiktok was based in Hong Kong (initially) and their Recommendation System was super-coveted
(and probably point #2 was super pertinent in order to build it)

 zenith bison
hey anyone want to make a poem writer project
which makes poem of about 100 words with only 5 to 10 words of input

Welcome To Our channel
In this you will make a poem writer project using TensorFlow that will generate a poem for you on its own.
So consider Giving a video a like, share it with your friends and Subscribe to our channel too for more videos.
Instagram link:https://www.instagram.com/rohitnarwal7988/
Python book: https://www.amazon.com/Python-sim...
Here is my tutorial
 pastel valley
yo if for example i trained a cnn model on keras to classify cat and dog then saved the model and a few weeks i decided that i want to add rabbit to the model to be classified is it possible like i will add a new class to my trained model?
odd meteor
pastel valley
yo if for example i trained a cnn model on keras to classify cat and dog then sa...
Yes it's possible. But adding a new class 'rabbit' will demand you retrain your model and also adjust your model architecture a bit to accommodate for probability of each 3 classes being predicted.
pastel valley
odd meteor
Yes it's possible. But adding a new class 'rabbit' will demand you retrain your ...
do i need to retrain it together with the previous training set like the cat and dogs?
odd meteor
pastel valley
do i need to retrain it together with the previous training set like the cat and...
Yes you do need to retrain it. Supply both pictures of cats, dogs, and rabbits and work from there.
pastel valley
and on the architecture i add 1 more for the softmax out put?
odd meteor
pastel valley
and on the architecture i add 1 more for the softmax out put?
Yes. you need to add softmax activation function to the output layer to capture the probability of each class being the correct prediction which then makes use of argmax to output the class with the highest probability.
pastel valley
nice nice thank you sir
 urban lance
I'm using plotly to plot edcf graphs of each of my columns.
but I only want to plot the bottom 10% of values of each column. what would be the best approach?
steady basalt
Anyone know if you’re supposed to encode target class if it’s “yes” or “no”
To 1,0 and 1,0 columns
odd meteor
urban lance
I'm using plotly to plot edcf graphs of each of my columns.
but I only want to p...
I'm not sure there's a way to do that inside plotly's ecdf function. However, you should be able to grab the bottom 10% of each column from Pandas and then pass it to ecdf plot instead of passing the entire df. I guess that should do the job.
urban lance
odd meteor
I'm not sure there's a way to do that inside plotly's ecdf function. However, yo...
yea that's what I'm doing now. Although that might give me another problem 🤔 We'll see
odd meteor
urban lance
I'm using plotly to plot edcf graphs of each of my columns.
but I only want to p...
This is off point, but which clustering algorithm did you eventually use for that problem you were trying to solve? 😀
urban lance
odd meteor
This is off point, but which clustering algorithm did you eventually use for tha...
Still haven't solved it 😂 I took a break of 4 weeks lol
odd meteor
urban lance
Still haven't solved it 😂 I took a break of 4 weeks lol
Lmao 😂😂😂
You said KMeans, Agglomerative hierarchical, DBSCAN didn't work... Perhaps you should try Fuzzy C-Means and MeanShift algorithm if you've not given up 😁
urban lance
well I'm plotting those ECDF graphs to have an even better idea of what features make sense to use 😅
I'll probably have another crack at it soon
 burnt island
anyone here with a helpful resources collections on how to run a project on image detection
odd meteor
steady basalt
Anyone know if you’re supposed to encode target class if it’s “yes” or “no”
How you encode this target class really doesn't matter to be honest.. So long you can differentiate your positive class and negative class you're good to go.
A "Yes" or "No" class could be encoded as 1 and 0 (the conventional way) or 0 and 1 (if you're interested in "No" as it's your positive class)
For instance a target label with, say "Male" and "Female", can be encoded
A) Male = 1 vs. Female = 0
B) Male = 0 vs. Female = 1
The most important point is knowing your positive class and negative class.
For example:
Supermoon's wife is pregnant, and we wanna build a model that can predict the chances of Supermoon's wife giving birth to a female child.
You could encode your target using either #A or #B but when doing your model.predict_proba() you must call the appropriate class of interest (which is the female class in this case)
steady basalt
Ye I agree
BTW, does sklearn have a binary cross entropy metric
I’m evaluating and want more than just AUC
odd meteor
burnt island
anyone here with a helpful resources collections on how to run a project on imag...
If you're cool with learning from YouTube, I'm sure you'll find a good video there. https://www.kaggle.com/code/ritvik1909/object-detection-sliding-window
Check Kaggle for more resources as well

Explore and run machine learning code with Kaggle Notebooks | Using data from MNIST NET
odd meteor
steady basalt
I’m evaluating and want more than just AUC
cross_entropy loss function is synonymous to Logloss.
If you want more metrics run this code
from sklearn import metrics
metrics.SCORERS.keys()
If you still want to make your own custom metric called, maybe, sonic_moon then you need to import the make_scorer object from sklearn to create that. 😊
steady basalt
Thanks bro, I will need a way to measure and output cross entropy loss for my assignment
To compare models
cinder matrix
Guys, how do I get accuracy for my finetuned gpt2 model? Like for example, in this lstm article, at the end of the article he can print accuracy https://data-flair.training/blogs/machine-learning-text-summarization/
please @ when replying

Process of producing summary from huge set of information maintaining actual context is Text Summarization. Create your own text summarizer.
burnt island
odd meteor
If you're cool with learning from YouTube, I'm sure you'll find a good video the...
thanks so much
 amber lark
Does someone here understand good the math behind backpropagation? I want to be sure if I understood everything so I tried to do all the derivatives but I am not sure if I was right. If someone can check it, it will be great!
steady basalt
Anyone here done leetcode 35
 tough frigate
how useful is leetcode on the scale of 1 to 5 when it comes to SQL in the interviews?
 chilly abyss
misty flint
how do you guys feel about these points https://en.m.wikipedia.org/wiki/AI_Super...
chilly abyss
misty flint
how do you guys feel about these points https://en.m.wikipedia.org/wiki/AI_Super...
I have always have the feeling that China would lead in the AI raise and this book gives more evidence to that.
tall pulsar
woven coral
anyone know how to slove this problem??
USE the key present in dict
tall pulsar
urban lance
I'm using plotly to plot edcf graphs of each of my columns.
but I only want to p...
Read documentation, I think there is a x_limit and y_limit method in update_traces and layout method.
misty flint
chilly abyss
I have always have the feeling that China would lead in the AI raise and this bo...
it makes me wonder what the short-term consequences will be. i dont think we will start having fang company equivalents in china but still
chilly abyss
misty flint
it makes me wonder what the short-term consequences will be. i dont think we wil...
In the short-term, I don't think so too, but never say never. Anything could happen. 🙂
 spare briar
I am skeptical because the competitive advantages listed could apply to other, better established technical industries where China remains far behind
like silicon
the only unique advantage I see is related to government involvement in data collection, but I don't think this is needed in a world where everyone has already willingly given their data to FAANG
besides I think that the data governance problem can be solved by eg federated learning so that people can benefit from algorithms without forfeiting privacy
 wet mica
I have an idea for kind of a strange ML/Art project, but I don't really know where to start with modeling. Basically, I want to train a model on my catalog of photos that I have taken. Ideally I would want some unsupervised model to learn to recognize features/commonalities within the photos. Then, with this model, be able to recognize other photos that share some threshold of feature similarity with the trained model.
In other words, I want to teach a model to recognize commonalities in the photos I take, and be able to identify other images that match stylistically.
I am having a hard time figure out what the right type of model for this is and the right type of search terms to be using. I've done unsupervised PCA and TSNE projects before, but this would be my first time branching into deep learning/image analysis. Any pointers would be appreciated!
modern cypress
wet mica
I have an idea for kind of a strange ML/Art project, but I don't really know whe...
Hmm, try K Means maybe
It will try cluster images together with the most similar means
modern cypress
wet mica
I have an idea for kind of a strange ML/Art project, but I don't really know whe...
https://scikit-learn.org/stable/modules/generated/sklearn.cluster.KMeans.html
Looks like SciKit has this, but im not if it works with images
Examples using sklearn.cluster.KMeans: Release Highlights for scikit-learn 0.23 Release Highlights for scikit-learn 0.23, Demonstration of k-means assumptions Demonstration of k-means assumptions, ...
 rotund cairn
Hi, I need assistance with a project that requires developing a chatbot in Python that will serve as both student support and a teacher assistant for university students. I have an idea, but I'm not sure whether it's the proper execution; I want to use the Google Search API to allow as many inquiries as possible to return responses. I'd like to know how to go about developing this project; any help would be greatly appreciated. Thank you very much.
wet mica
modern cypress
https://scikit-learn.org/stable/modules/generated/sklearn.cluster.KMeans.html
L...
Thanks. You are the second person to recommend k means to me. So I suppose I will give it a shot then
surreal rock
why in some cases is it (predicted - actual)^2 and other cases its (actual - predicted)^2....wouldnt that give seperate answers...i know because of the square its always going to be positive

 odd meteor
wet mica
I have an idea for kind of a strange ML/Art project, but I don't really know whe...
odd meteor
wet mica
I have an idea for kind of a strange ML/Art project, but I don't really know whe...
From my experience, when it comes to clustering with an image data, MeanShift usually outperform KMeans. So if you're interested in doing image segmention, you could try MeanShift.
For Image similarity detection, I'm not familiar with it yet, but you can always check online to get a cue.
mild dirge
!e
print((12-3)**2 == (3-12)**2)
@mild dirge :white_check_mark: Your eval job has completed with return code 0.
True
@surreal rock
surreal rock
mild dirge
<@572540029574840339>
yes
mild dirge
The difference is either x or flipped: -x, and x^2 == (-x)^2
So it doesn't matter which term is subtracted from which term
surreal rock
ok so basically it doesnt matter
ok
thats good to know cause in algebra what's first mtters
mild dirge
Well it does matter which comes first when subtracting, the point is that squaring makes it so it doesn't matter whether the number is positive or negative
surreal rock
mild dirge
So it doesn't matter which term is subtracted from which term
it seems like you guys use the cost function everyday if u remember it so well
odd meteor
rotund cairn
Hi, I need assistance with a project that requires developing a chatbot in Pytho...
You need to explore NLU in NLP. Then learn about intent and entity recognition. You could then decide to leverage DiagFlow or Rasa for the project.
Oh, there's GPT-3 as well. So you decide which one you wanna use.
surreal rock
i guess yea 75 - 100 is the same as 100 - 75 when squared
odd meteor
surreal rock
i guess yea 75 - 100 is the same as 100 - 75 when squared
😊 The presence of square will still make it positive regardless of how you flip it. However, statistically, when OLS is used:
RSS = TSS - ESS
and MSE = 1/N * RSS
So it ought to be Actual - Pred (just the way MSE formula (the cost function) was defined in the first image.
surreal rock
what is OLS RSS TSS ESS MSE
surreal rock
odd meteor
😊 The presence of square will still make it positive regardless of how you flip...
^^^^
odd meteor
surreal rock
what is OLS RSS TSS ESS MSE
It's just some Stats terminologies that involves minimizing the cost function.
OLS = Ordinary Least Squares
ESS = Explained Sum of Squares
RSS = Residual Sum of Squares
TSS = Total Sum of Squares
So without going deep in Stats, OLS can be likened to what Gradient Descent is in Neural Nets. Although, OLS isn't exactly regarded as an optimizer.
 surreal rock
can anyone help me understand the code written here... explain to me like im an idiot lol
 rotund cairn
odd meteor
You need to explore NLU in NLP. Then learn about intent and entity recognition. ...
rotund cairn
odd meteor
You need to explore NLU in NLP. Then learn about intent and entity recognition. ...
thank you, I'd look them up
lapis sequoia
surreal rock
can anyone help me understand the code written here... explain to me like im an ...
please send the code as text to make it easier for people to read
 hasty mountain
Someone who has some experience in Adversarial Networks, especially in DCGANs, please, tell me... Is it normal to do everything right with your code, but you still can't make it work because you have to blindly keep testing the learning rate for both discriminator and generator until you can find a good number?
 modest mulch
Hi, does anyone know how to solve the occlusion problem when tracking players in a basketball game? Deep sort didn't work as it assigned the player a new id after he had been occluded, we thought of using optical flow to solve this problem, but it doesn't work very well as the change of motion between two consecutive frames might be too large, any ideas on how to solve this?
modest mulch
hasty mountain
Someone who has some experience in Adversarial Networks, especially in DCGANs, p...
Yes, training gan is quite hard in general, and it's merely impossible to get it right from the first run even if the code is perfectly fine
you usually have to do a couple of tricks
like trying different learning rates, sampling your latent space from a gaussian, not hard coding the labels (as 0 or 1), rather do something like (0-0.3, 0.7-1.3) etc
training on real batch first and then on fake batch (don't shuffle them)
hasty mountain
Oh, I see... I've seen those labels and batch tricks in an OpenAI paper... They also told about inserting a random noise into the discriminator, even though I don't know if that's been quite effective for me...
hasty mountain
modest mulch
training on real batch first and then on fake batch (don't shuffle them)
Thanks. That's reassuring. I'll try different tricks, then.
modest mulch
hasty mountain
Thanks. That's reassuring. I'll try different tricks, then.
You're welcome mate, here are some tricks you could start with
https://github.com/soumith/ganhacks
starter from "How to Train a GAN?" at NIPS2016. Contribute to soumith/ganhacks development by creating an account on GitHub.
hasty mountain
Oh yeah, I've read that article too. It's awesome
I'm also trying NVidia's Progressive DCGAN, which makes it a bit more complicated...but I'm ambitious

modest mulch
you got this
 stiff folio
Hello! Does anyone know if there's a way to achieve np.subtract.outer(a,b) but with cupy?
serene scaffold
stiff folio
Hello! Does anyone know if there's a way to achieve np.subtract.outer(a,b) but w...
did you mean subtract instead of substract?
stiff folio
yes, sorry
serene scaffold
That apparently doesn't exist, so I'm not sure what you're referring to
serene scaffold
stiff folio
https://numpy.org/doc/stable/reference/generated/numpy.ufunc.outer.html
CuPy’s ufunc currently does not provide methods such as reduce, accumulate, reduceat, outer, and at.
https://docs.cupy.dev/en/stable/reference/ufunc.html
😦
serene scaffold
I don't; I have never actually used cupy
CuPy provides universal functions (a.k.a. ufuncs) to support various elementwise operations. CuPy’s ufunc supports following features of NumPy’s one:
Broadcasting
this means that for any vectorized function, func(a.reshape(-1, 1), b.reshape(1, -1)) will do what outer does.
if a and b are already both vectors, you can also just do func(a[:, None], b[None, :]), I think
 plush jungle
so I have this transformer code that I'm trying to train on a simple dataset to better understand the transformer architecture https://www.toptal.com/developers/hastebin/afarisisiv.py
and my dataset consists of 3 different 6 character sequences of 1's and 0's:
dataset = [[np.array([1,1,1,0,0,0]),
            np.array([0,0,0,1,1,1]),
np.array([0,1,0,0,1,0])]]```basically the idea is the transformer should eventually be able to predict the second three by being passed the first three, like:
111->000
000->111
010->010```the problem is, I can't get it to train to any degree of accuracy no matter what I do
I've tried high learning rates, low learning rates, and lots of epochs, as well as shuffling the dataset, but nothing makes the loss go down significantly
misty flint
this game uses word2vec and semantic meanings https://semantle.novalis.org/
highly recommend if you like wordle
austere swift
ive been playing that for a couple weeks now and its so fun
I played since puzzle 23
 whole shore
What is the minimum number of samples do i need per class for a sign language translator?
serene scaffold
@whole shore there's no way to definitively answer that. Also, sign language translators are not classifiers
But the total number of training instances you'd need for one is going to depend on a lot of things
 smoky vale
Hi all im in need of assitance in regards to Azure ML for computer vision
i want to implement the following using Python from Azure:
whole shore
serene scaffold
<@263399089826168833> there's no way to definitively answer that. Also, sign lan...
ah, I was being vague. just basic static gestures like fingerspelling
 compact rose
Can anyone help? i know this is basic, but i'm not knowing how to solve this D:
 tidal bough
sk is a series, so what do you mean by if sk == 3?
compact rose
my idea is to get values that are equal to three and print it out saying that this row is normal. imagine that ID is equal to three, then let's print it out.
 serene scaffold
@toxic palm just ask
This question should go in #algos-and-data-structs
Please copy it to there and remove it from here
 toxic palm
serene scaffold
Please copy it to there and remove it from here
toxic palm
serene scaffold
Please copy it to there and remove it from here
removed. please remove your comment also, so that everything will be cleared here..
urban lance
I'm trying to calculate the tf-idf value of a column in my dataframe but when I run in through the sklearn lib, it returns an array of 0s
from sklearn.feature_extraction.text import TfidfVectorizer
v = TfidfVectorizer()
x = v.fit_transform(df[df.columns[0]])
x.toarray()
 serene scaffold
urban lance
I'm trying to calculate the tf-idf value of a column in my dataframe but when I ...
serene scaffold
urban lance
I'm trying to calculate the tf-idf value of a column in my dataframe but when I ...
try taking the sum of the array, to see if there are 1s in it that aren't displayed
 pseudo wren
I am working on the housing data set as a test set
And I had some questions about the process I should be doing
When doing the linear regression process (assuming the relationship between two variable is linear)
I need to choose a loss function to calculate loss correct?
So far I’m only familiar with MAE, MSE, and Huber loss
Then I have to check for the minima and maxima to get the gradient
And then when I get the gradient I subtract by each point along the gradient to get the minima
Is this process correct? I can’t share my code right now but I’m having a bit of trouble with implementing the math . I want to be sure I remember the formula.
odd meteor
pseudo wren
Then I have to check for the minima and maxima to get the gradient
You need not worry much about gradient descent if you're not using neural network. It's okay to use OLS.
Now when it comes to finding the gradient of a weight (or slope of a weight )... You need to multiply 3 things
calculate the slope of your loss function with respect to the value at the node you feed into
The value of the node that feeds into the weight
Slope of the activation function with respect to value you feed into.
Then multiply #1 x #2 x #3 = The gradient of that weight.
Now to update the weight, you'll do
W - LR x Gradient = New Weight
Where W = The weight you want to update
LR = Learning Rate (a hyperparameter)
Gradient = The gradient of the weight we got when we multiplied #1, #2, and #3
 heavy valley
Hi all - is there a way to write a dataframe into an existing excel sheet, preserving the VBA macros already in the file?
odd meteor
odd meteor
You need not worry much about gradient descent if you're not using neural networ...
Essentially, this whole process is what backpropagation entails ( of course, without using calculus to explain it)
pseudo wren
odd meteor
You need not worry much about gradient descent if you're not using neural networ...
Thank you! I think right now I’m just doing model training
 keen forum
Hi there, I have some ugly data that's come out of a tool for getting PDF tables into dataframes - it works. But not perfectly.


So it's clear where the numbers should go - but I'm not entirely sure how to tell pandas to look above and below a non-empty row for columns and to concatenate strings on this condition.
 wild pagoda
Hey guys, so currently i have data like this:
time[s] P[kPa]  V[km/h] SA[deg] CA[deg] SR[%]   Fz[N]   Fx[N]   Fy[N]   Mx[Nm]  My[Nm]  Mz[Nm]  Vs[rad/s]       RL[m]   Ttyr[degC]      Tamb[degC]      Tbrg[degC]      Tw[Nm]  Yb[mm]  CF[N]   FD[N]   RD[deg] CmdFz[N]    CmdSA[deg]      CmdCA[deg]      CmdV[km/h]      CmdP[kPa]       CmdRL[m]        CmdSR[%]        CmdTw[Nm]
0.000000e+00    2.299780e+02    -6.300000e-02   6.000000e-03    0.000000e+00    0.000000e+00    3.844010e+03    -2.196800e+01   6.289300e+01    -1.281100e+01   -6.672000e+00   -3.076900e+01   -5.235988e-03   3.037220e-01        5.418200e+03    2.129100e+01    1.140000e-01    0.000000e+00    -2.400000e-01   6.289500e+01    2.196200e+01    2.598050e+02    3.841600e+03    0.000000e+00    0.000000e+00    0.000000e+00    2.300000e+02        3.037200e-01    0.000000e+00    0.000000e+00
How do i convert it and put it into an excel file?
 rose agate
keen forum
So it's clear where the numbers *should* go - but I'm not entirely sure how to t...
rose agate
keen forum
So it's clear where the numbers *should* go - but I'm not entirely sure how to t...
I tried to solve this by iterating through rows and checking for Nones in each column, and adding above and below string, seems to work
import pandas as pd
import numpy as np

data = {'a':[None,'M', None], 'b':['2',None, '485']}
df = pd.DataFrame(data=data)

df.replace('None', np.nan, inplace=True)
df2 = df.copy()

for i in range(df.shape[0]):
    for column in df.columns:

        try:
            if (df.iloc[i][column]) is None:
                df2.iloc[i][column] = df.iloc[i-1][column] + ' ' + df.iloc[i+1][column]

        except Exception as e:
            pass
 misty flint
austere swift
I played since puzzle 23
misty flint
austere swift
I played since puzzle 23
dang really? whats the hardest word that took you the most guesses?

keen forum
rose agate
I tried to solve this by iterating through rows and checking for Nones in each c...
Hey, this is exactly what is needed - thank you so much!
wild pagoda
wild pagoda
Hey guys, so currently i have data like this:
```
time[s] P[kPa] V[km/h] SA[deg...
someone help me pls ;-;
keen forum
import pandas as pd

file = open("discord_text.txt","r")
rows = []

for line in file:
  rows.append([v for v in line.split(" ") if v != ""])

pd.Dataframe(rows).T.to_excel("output.xlsx")
Think this should do the trick @wild pagoda
wild pagoda
keen forum
```python
import pandas as pd
file = open("discord_text.txt","r")
rows = []
fo...
It's not working tho, my code:
    rows = []
    rows.append([v for v in self.data.split(" ") if v!=""])

    pd.DataFrame(rows).T.to_csv(filename)
 wild pagoda
keen forum
```python
import pandas as pd
file = open("discord_text.txt","r")
rows = []
fo...
wild pagoda
keen forum
```python
import pandas as pd
file = open("discord_text.txt","r")
rows = []
fo...
currently, my self.data have format like this:
time[s] P[kPa]  V[km/h] SA[deg] CA[deg] SR[%]   Fz[N]   Fx[N]   Fy[N]   Mx[Nm]  My[Nm]  Mz[Nm]  Vs[rad/s]       RL[m]   Ttyr[degC]      Tamb[degC]      Tbrg[degC]      Tw[Nm]  Yb[mm]  CF[N]   FD[N]   RD[deg] CmdFz[N]    CmdSA[deg]      CmdCA[deg]      CmdV[km/h]      CmdP[kPa]       CmdRL[m]        CmdSR[%]        CmdTw[Nm]
0.000000e+00    2.299780e+02    -6.300000e-02   6.000000e-03    0.000000e+00    0.000000e+00    3.844010e+03    -2.196800e+01   6.289300e+01    -1.281100e+01   -6.672000e+00   -3.076900e+01   -5.235988e-03   3.037220e-01        5.418200e+03    2.129100e+01    1.140000e-01    0.000000e+00    -2.400000e-01   6.289500e+01    2.196200e+01    2.598050e+02    3.841600e+03    0.000000e+00    0.000000e+00    0.000000e+00    2.300000e+02        3.037200e-01    0.000000e+00    0.000000e+00
So what is that? tab-delimited row-wise and new-line-delimited column-wise?
wild pagoda
keen forum
So what is that? tab-delimited row-wise and new-line-delimited column-wise?
sorry but i don't know what you mean
what i want is this
 keen forum
Try this: print(repr(self.data))
wild pagoda
keen forum
Try this: `print(repr(self.data))`
 keen forum
wild pagoda
keen forum
wild pagoda
Okay, see between each line there is: \t these are "tabs" acting as seperators, so we say that as we go down the row that this is "tab-delimited"
and there'll be a single \n which is the new line
wild pagoda
yeah true
keen forum
And since self.data is one big lump we have to break it down.
So, first step, break it down into an iterable and then second step split on tab.
rows = []

for line in self.data.split("\n"):
  row = [v for v in self.data.split("\t") if v != ""]

pd.Dataframe(rows).T.to_excel("out.xlsx")
the self.data.split do i need to repr(self.data).split?
keen forum
No, shouldn't be necessary. The only string stored in python is the string with "\t".
wild pagoda
and the row = [v...
should it be rows.append?
keen forum
rows.append(row) sure
wild pagoda
oh
wild pagoda
keen forum
`rows.append(row)` sure
it's kinda wrong lol

currentcode:
    rows = []
    for line in self.data.split("\n"):
      row = [v for v in self.data.split("\t") if v != ""]
      rows.append(row)
    pd.DataFrame(rows).T.to_csv(filename)
Remove .T in Dataframe(rows)
keen forum
 pliant bobcat
wild pagoda
keen forum
Remove .T in Dataframe(rows)
pliant bobcat
wild pagoda
keen forum
Remove .T in Dataframe(rows)

not what i expected too, it's print the value 3 times
and it's not split the rows title and the value
 keen forum
Try using \\n+ or [\\r\\n]+ to split
wild pagoda
keen forum
Try using `\\n+` or `[\\r\\n]+` to split
after editing a littlebit, i make it work, now how do i remove the index number of row and col?
 keen forum
wild pagoda
after editing a littlebit, i make it work, now how do i remove the index number ...
keen forum
wild pagoda
after editing a littlebit, i make it work, now how do i remove the index number ...
Let's solve the first problem first
wild pagoda
keen forum
Let's solve the first problem first
no the problem is done :v
keen forum
rows = []

for line in self.data.splitlines():
  row = [v for v in self.data.split("\t") if v != ""]

pd.Dataframe(rows).T.to_excel("out.xlsx")
i need to split it first
self.data = self.data.split(" ")[0]
after that, i do this:
rows = []
    for line in self.data.split("\n"):
      row = [v for v in line.split("\t") if v != ""]
      rows.append(row)
    pd.DataFrame(rows).to_csv(filename)
now it's work
keen forum
Okay, that's weird
:v so long as it works
Excess row?
That's because one of the lines is empty
So to get rid of the blank line just include a line that rejects ""
wild pagoda
just realize no need to self.data = self.data.split(" ")[0]
no i want to remove the index of rows and col , you can see 0-2 in 1st col and 0-25 in 1st row
 keen forum
I'm not seeing what's wrong here tbh
keen forum
Great!
pastel valley
yo if i used this to load my test images is it in order from the idirectory?

so the 5th image on the first folder of my dataset is the one where the model predicted wrong?

i just want to observe the images where the model predicted wrong
 echo rover
Hi, I have a problem I have to make a project for my school but I can't do it I've been taking my head for a week I don't understand anything, could someone do it and send it to me please, it's about an exploitation of a database to make a bar graph thanks to python. please send me a private msg if it is possible
serene scaffold
echo rover
Hi, I have a problem I have to make a project for my school but I can't do it I'...
you're more likely to get help if you put your question in the chat. you have to give enough information for people to see what you need and start helping. People aren't likely to DM you to find out what your actual question is, as it would end up being a waste of their time if they don't know or aren't interested.
mild dirge
serene scaffold
you're more likely to get help if you put your question in the chat. you have to...
They're not asking for help, just the answer 😛
We're not going to make your homework for you @echo rover
serene scaffold
mild dirge
They're not asking for help, just the answer 😛
they'd have to put the actual question in the chat either way 😛
serene scaffold
 cinder kiln
what is data science
cinder kiln
what is data science
using programs to dig through large amounts of data, and the theory of getting useful information with those programs
serene scaffold
cinder kiln
stuff
stuff is things
 slender ferry
I'm not sure if it's the correct channel
I'm developing a simple application which takes an input video source and processes each frame to display in a tkinter gui
In the processing I predict on the data using a custom YOLO model
I have a fairly good CPU and even on one video source I'm almost pinning my 5800X if I dont use cuda, is running the predictions this demanding or is it more likely that I'm spamming some callback too often?
slender ferry
mild dirge
Pretty sure it may be quite heavy on the cpu, why don't you use cuda?
One of the goals was for it to run locally on a raspberry pi, but 1fps to something along 1fpm is likely sufficient
mild dirge
I'm not sure what version you are using, but YOLO v3 has somewhere along 61 million parameters (if what I just googled is correct), so if it is anywhere near that big, a forward pass might take long
slender ferry
We're using YOLO v5
But I generally just wanted to know if it was as taxing or not
Running on CUDA I end up with ~12-16ms frametime on my system vs ~100-140ms on CPU
mild dirge
yeah that kind of speedup is definitely expected for larger models
 echo vigil
I have a pyspark dataframe with schema: id (int), date (timestamp), val (float). I want to create another column val2, which contains the val for the same id and the most recent timestamp that is at least 30 days before the timestamp in the date column.
For instance:
id, date, val
1, 10-20-2018, 14
1, 10-31-2018, 9
1, 11-24-2018, 10
1, 12-23-2018, 4
2, 8-21-2020, 7
2, 9-29-2020, 20
2, 10-14-2020, 5
should add the column val2:
id, date, val, val2
1, 10-20-2018, 14, null
1, 10-31-2018, 9, null
1, 11-24-2018, 10, 14
1, 12-23-2018, 4, 9
2, 8-21-2020, 7, null
2, 9-29-2020, 20, 7
2, 10-14-2020, 5, 7
Any idea how this can be solved in pyspark?
heavy valley
Asking again, sorry - is it possible to dump a dataframe into a .xlsm file w/o modifying the existing vba macros?
odd meteor
mild dirge
Pretty sure it may be quite heavy on the cpu, why don't you use cuda?
I don't have CUDA either... Whenever I see cuda anywhere, I'm reminded I have Iris XE GPU 😩😭
odd meteor
heavy valley
Asking again, sorry - is it possible to dump a dataframe into a .xlsm file w/o m...
You can dump a df in excel tho. Idk about VBA macros... Hopefully, someone with a good knowledge on that can answer your question.
 proven bolt
Hey, I know this is not purely a python question but I hope someone would be able to give me a pointer anyway
I have a postresql db with a many-to-many relationship - author and article
In my CSV file, an article is stored as a row with a column for authors(a list). So should I create a new CSV file where I store the author name and give each author an ID and then match it up as I load it into my joining table in the db?
Or is it possible to do something clever with the serial sequence when i create my tables? I just dont see how I would match up the correct author and article ID's in that way
desert oar
proven bolt
Hey, I know this is not purely a python question but I hope someone would be abl...
what are you doing with these csv files? what are you trying to achieve here?
arctic wedgeBOT
:incoming_envelope: :ok_hand: applied mute to @lapis sequoia until <t:1651006715:f> (9 minutes and 59 seconds) (reason: duplicates rule: sent 4 duplicated messages in 10s).
proven bolt
desert oar
what are you doing with these csv files? what are you trying to achieve here?
I have a csv file with some scraped articles, which im trying to import into a db. So it's something like below. What I'm unsure of is whatever to do the id joining in the article_author table in python, or if there is some better way maybe in postresql
csv:
id, content, author
1, abab, john,jane
2, baba, john
table article
id, content
1, abab,
2, baba,
table author:
id, name
1, john
2, jane
table article_author
article_id, author_id
1, 1
1, 2
2, 1
lapis sequoia
odd meteor
I don't have CUDA either... Whenever I see cuda anywhere, I'm reminded I have Ir...
why not rent? < - Azure/AWS/Google
 neat crescent
!unmute 838609647342452796
arctic wedgeBOT
:x: failed to pardon infraction mute for @wild hatch. User was not found in the guild.
neat crescent
o.o
misty flint

safe elk
Coffee time
desert oar
proven bolt
I have a csv file with some scraped articles, which im trying to import into a d...
you can do joins in pandas, but why not load these tables directly into postgresql? you can then do the joins when you need to query for data later.
you could "pre-join" everything in pandas too. or you can make temporary tables and then do the joins directly in postgres, saving the joined results to a final table
or create a view, or a materialized view... lots of options. depends on what you need
misty flint
safe elk
Coffee time
drinking some rn. while i try to finish this project
proven bolt
desert oar
you could "pre-join" everything in pandas too. or you can make temporary tables ...
Thanks a bunch, I feel more comfortable in pandas so I might do a pre-join there then
candid pollen
Hello! I'm just recently interested in Machine Learning, and I want to try some predictions (after reading a while its better to use LSTM(?)), I'm planning using an array and a value for input and have an output as value (3d array and label(int) as input and itll make pred based on another 3d array), is there any recommendation or example about LSTM? or maybe some documetation that can direct me to the right way some kind
plush jungle
candid pollen
Hello! I'm just recently interested in Machine Learning, and I want to try some ...
you might try the pytorch example code for LSTMs
candid pollen
hmm i still dont get it
plush jungle
candid pollen
Hello! I'm just recently interested in Machine Learning, and I want to try some ...
what sort of data are you training it on? is it time series data? What do the 3d arrays represent?
candid pollen
plush jungle
what sort of data are you training it on? is it time series data? What do the ...
the array im working with is an pixel value of an images, it was originally a video that i convert to images, frame by frame
and theres a value for each of its frame as an input/would be prediction
plush jungle
and the output is what? the prediction for the next frame of the video as an image?
candid pollen
the value that was assigned for that frame
i can share the details in #help-honey
ah nvm its dormant
plush jungle
candid pollen
the value that was assigned for that frame
what value?
candid pollen
its an int, it's a bpm from dataset
 nova bane
So im a beginner in machine learning and i want to ask question. How do we choose machine learning model statistically? Or is it just a matter of trial and error?
 brave sand
sorry if this doesn’t count as natural language processing, but I’m in a bit of a pickle. I accepted an internship for CS but the project I was assigned isn’t my forte.
The question is to generate questions from a story or article, and find the best questions out of the generated questions.
I’m open to suggestions and advice!
serene scaffold
brave sand
I’m open to suggestions and advice!
What have you tried?
brave sand
serene scaffold
What have you tried?
Just a bit of asking around but something called GPT 3
But I have to have access to it
 hollow kindle
dont hate me for asking but what is a neural network
serene scaffold
brave sand
Just a bit of asking around but something called GPT 3
look into how you can detect factual statements in the text, and then convert them to questions. GPT anything is going to be overkill.
brave sand
serene scaffold
look into how you can detect factual statements in the text, and then convert th...
You think so? But what questions do I ask based on the factual statements in the text?
serene scaffold
brave sand
You think so? But what questions do I ask based on the factual statements in the...
"Bob is from New York" -> "Where is Bob from?" or "Who is from New York"
serene scaffold
hollow kindle
dont hate me for asking but what is a neural network
something that takes a bunch of inputs and outputs, and learns what function of the inputs gives you the outputs.
brave sand
But how do I know or extract factual info? Reason why I wanted to use GPT is because this project is due in 2 1/2 weeks
serene scaffold
brave sand
But how do I know or extract factual info? Reason why I wanted to use GPT is bec...
how is GPT going to help you solve it?
brave sand
doesn’t have to be perfect but the prof expects it to sort of work?
but wouldn’t it be faster? and easier to work with?
hollow kindle
serene scaffold
something that takes a bunch of inputs and outputs, and learns what function of ...
so could you use it for some kind of virtual assistant or would it be more for something that would for example play a game automatically
serene scaffold
brave sand
but wouldn’t it be faster? and easier to work with?
no? GPT-3 can generate long texts that are grammatically correct and "make sense". that doesn't mean that you can easily adapt it to write questions that are answered in a given document, or that you can adapt it for that task at all.
serene scaffold
hollow kindle
so could you use it for some kind of virtual assistant or would it be more for s...
it would be more like the second one. because a virtual assistant is actually going to be a bunch of different programs--one for each kind of thing that the virtual assistant can do.
brave sand
so following your idea, do I train a model to recognize key words such as? and how do I make it so it’s a correct and the question sort of makes sense?
hollow kindle
serene scaffold
it would be more like the second one. because a virtual assistant is actually go...
ok thanks
serene scaffold
brave sand
so following your idea, do I train a model to recognize key words such as? and h...
what is the context for your need to design this? it seems odd that you've been given an intermediate NLP task with seemingly little direction.
@hollow kindle I apologize that I don't have a more thorough answer. it takes a long time for someone to wrap their mind around what a neural network is. I'm still working on it myself, in many ways.
hollow kindle
serene scaffold
<@709072841374433301> I apologize that I don't have a more thorough answer. it t...
its fine i have never done any research on it and only have an idea on what it is, but interested in making some kind of virtual assistant that can have responses different than some predetermined ones based on a set input
brave sand
serene scaffold
what is the context for your need to design this? it seems odd that you've been ...
so I am in a research project/internship, and this tryout project is to create questions from a text. It doesn’t have to be perfect, but it should somewhat work. NLP is not my forte, I know next to nothing on it but this professor needs this done by 5/11. I was informed of this project today. There are a few other projects I can choose from but I don’t think that they are easier.
Finding and Fixing Bad Questions
We have some questions that we’ve identified as being bad. We don’t know why all of them are bad, but we’d like to make them better. Some patterns that we’ve seen are:
Ambiguity
Wrong assumptions
Wrong interpretations
Take a look at the questions. Do you see a pattern? Can you detect this pattern automatically (e.g., with a regular expression)? Can you correct any of the patterns with a simple script that either changes the question or the answers?
What to Submit: Submit your program that detects problems and fixes them. Along with a repository of your code, send a file of the original and fixed questions
serene scaffold
brave sand
so I am in a research project/internship, and this tryout project is to create q...
it's pretty clear from this that they don't expect (or want) you to use GPT. this one about finding bad questions looks pretty interesting as well.
though it might be because I've become exceptionally opinionated about what constitutes a good or bad question after two years of answering questions here.
brave sand
serene scaffold
though it might be because I've become exceptionally opinionated about what cons...
LOL. that is true
brave sand
serene scaffold
it's pretty clear from this that they don't expect (or want) you to use GPT. thi...
yeah, I’m undecided on which one to try
one of the reason why I mentioned GPT-3 is because of the guys at the Artificial Intelligence server told me that could be potentially helpful
desert oar
i suspect you want to start with something simpler
brave sand
I totally would break this problem down and take my time, but a time limit is really limiting what I can do
serene scaffold
I don't even know how you would use GPT-3 to solve it, and you'd have to pay, if I understand correctly
it sounds like whoever suggested GPT-3 just mentioned the first high-profile NLP thing they thought of.
desert oar
@brave sand they are suggesting you use regular expressions, so they are expecting "stupid" simple solutions
are there specific words that suggest bad questions? punctuation patterns? capitalization usage? length (either very long or very short)?
brave sand
hm yeah. I think the bad question one is easier than the generating questions one
desert oar
you could also try using a pre-trained language model like bert at some point in a project like this, but then you have these opaque word vectors to figure out what to do with; a language model is basically just super-powered dimension reduction in a task like this
brave sand
yeah hard pass on that.
do you know the identifying whether a questions is good or not is a more doable problem than the generating questions?
serene scaffold
if you want to hard pass on that, then you'll want to hard pass on any solution that involves GPT-3 as well 😛
serene scaffold
brave sand
do you know the identifying whether a questions is good or not is a more doable...
it sounds more doable to me, though I haven't seen the questions they want you to classify. or the document(s) you might be pulling questions out of.
brave sand
haha I did realize that once I read a little more into GPT-3
brave sand
serene scaffold
it sounds more doable to me, though I haven't seen the questions they want you t...
that's another thing, there isn't a doc with the questions or documents, I'll have to ask the prof.
there is another project I could do but it's less programming related.
[Non-Programming Option] Crafting Adversarial Questions
We have a couple of adversarial interfaces for writing questions:
http://fm2.qanta.org
https://trick.umiacs.umd.edu/
The code can be found here:
WAITING FOR LINK, WILL UPDATE SOON
This is a little more open-ended than other projects, but the main idea is to use these interfaces to write a bunch of adversarial questions. We’ll be able to use these questions for human–computer face-offs, and through your insights we’ll be able to improve the interfaces.
What to submit: Share the questions / claims that you’re most proud of and why they’re good at specifically targeting weaknesses in the computer’s ability to detect these sorts of problems.
Optionally: Create a pull request that improves either of these interfaces in a way that would help others write more challenging questions for a computer.
How this would translate into a full project: We would write lots of challenging questions, investigate how computers get tripped up, and improve the interfaces to highlight those properties to help others write similar questions.
Web site created using create-react-app
any idea what he is talking about?
and the prompt for the good bad questions is here:
`Finding and Fixing Bad Questions
We have some questions that we’ve identified as being bad. We don’t know why all of them are bad, but we’d like to make them better. Some patterns that we’ve seen are:
Ambiguity
Wrong assumptions
Wrong interpretations
Take a look at the questions. Do you see a pattern? Can you detect this pattern automatically (e.g., with a regular expression)? Can you correct any of the patterns with a simple script that either changes the question or the answers?
What to Submit: Submit your program that detects problems and fixes them. Along with a repository of your code, send a file of the original and fixed questions.
How this would translate into a full project: We’d try to fix as many questions as possible, retrain a QA system on this better data, document our ability to correct these problems, and hope to see improvement.
`
serene scaffold
unfortunately I have other stuff I need to do before going to bed, so I have to drop off.
brave sand
yeah no worries man, I couldn't thank you enough already. guess I'll be hanging around more often in the channel LOL
serene scaffold
I'll probably check again tomorrow while I'm supposed to be working
hollow kindle
are you a programmer for your job
serene scaffold
yes, I'm a computational linguist.
hollow kindle
cool
 inland zephyr
Hello all i want to know if it is able to put an preprocessing function inside a Keras Model. I want to investigate a model from paper, which using wavelet preprocess in the front after an image raw input, then each coeff processed in parallel in identical CNN block

i define my wavelet and CNN central block like this:
    coeff = pywt.dwt2(data,'dmey','periodic')
    ll,lh,hl,hh = coeff
    return ll,lh,hl,hh

def CNN_Central_Block(input_size):
    feed = Input(shape=(input_size,input_size,3))
    x = Conv2D(kernel_size=(5,5),filters=32)(feed)
    x = BatchNormalization()(x)
    x = ReLU()(x)
    x = MaxPool2D(pool_size=(3,3))(x)
    x = Conv2D(kernel_size=(4,4),filters=64)(x)
    x = ReLU()(x)
    x = Conv2D(kernel_size=(1, 1), filters=10)(x)
    x = Softmax()(x)
    x = Flatten()(x)
    out = Dense(10)(x)
    return Model(input=feed,out=out)```.
One problem is since i using branching from one image to four different image coeff, should i put ImageDataGenerator in the front of model or just hardcoded a function to cover the paralel CNN model?for those who want to know the paper: https://ieeexplore.ieee.org/document/7838150

Image classification is a vital technology many people in all arenas of human life utilize. It is pervasive in every facet of the social, economic, and corporate spheres of influence, worldwide. This need for more accurate, detail-oriented classification increases the need for modifications, adaptations, and innovations to Deep learning algorith...
 magic dune

I already know how to do q learning but wanted to take it and put it into my tic tac toe code
but I am not sure how I should structure the q table and how I can implement it into my already made ti...
 hollow sentinel
i’m connected to andrew ng on linkedin
and i just fucking found out five minutes ago
💀💀💀
misty flint
brave sand
one of the reason why I mentioned GPT-3 is because of the guys at the Artificial...
what stelercus said. i made a PoC using gpt-3 at work and even then we ended up deciding to use an open source model instead with little to no difference in model inference
hollow sentinel
rex i must be hallucinating
hollow sentinel

what the actual fuck
maybe it’s a good idea to never tell him i never actually finished his course on ML w opera 😭😭😭😭
misty flint
tbh i dont have anything else to say except im lowkey jealous
oh
i also like his most recent initiative
hollow sentinel
check out krish naik he’s a homie
misty flint
about data-centric AI
hollow sentinel
indian guy gives godly explanations
hollow sentinel
oh yeah naik doesn’t do research stuff but he talks a ton about a lot of ml related stuff
misty flint
most recent guest of ken jee's podcast
hollow sentinel
and builds basics well
come on bro you know i have zero time for ken’s nearest neighbors rn 😭😭
no hate ken’s awesome
misty flint
ok ill also subscribe to him
hollow sentinel
wait am i connected w him on linkedin too
💀💀💀
i swear i did not know anything about being connected w these guys beforehand
misty flint
hollow sentinel
come on bro you know i have zero time for ken’s nearest neighbors rn 😭😭
you know i listen to podcasts on my commutes and workouts, so idk what youre doing

hollow sentinel
i listen to an ex navy seals
misty flint
hollow sentinel
nah jk i should defo listen to the podcast more
misty flint
its not for everyone
hollow sentinel
it’s also just hard balancing it w lsat and bar prep too
hollow sentinel
yes before anyone asks i am preparing for the lsat and bar as an undergrad soph
before i get docked for being off topic
😭
misty flint
we had the lawyer of the company come speak to us last week, the general counsel guy
misty flint
my friend wants to do ML + cybersecurity
hollow sentinel
that sounds like an interesting cheesecake flavor
hollow sentinel
when did the cheesecake factory introduce that flavor?
😭😭😭
that sounds like a recruiter’s wet dream
misty flint
i think your college is just too small and there's too many busy bodies
but that's my opinion
misty flint
💀 💀 💀
hollow sentinel
nah they’re just 18 year olds that wanna get shitfaced
i don’t blame them there’s a lot of kids who think that and they all fall into the same trap
but the point is they gotta snap out of it at some point before it’s too late
hollow sentinel
gn man
 severe plaza
Hi every one, i would like create a classificator of time series
When i insert the chart she return a string containing type of time series any one can help me?
 thorn venture
I have a df which I have done groupby and added the result in new df . But when I use the same column name used in group by that give me error
 barren wedge
is someone doing on some research? i want to join
inland zephyr
The bitwise operation frustate me at all... so i change it to Add
i dont know if my GPU can stand for this suffering
 urban lance
does anyone have experience with spacy and lemmatization?
The lemmatization is not fully working, it works fine for some words but skips over others
Is there a way I can add custom lemma's to the function?
brave sand
misty flint
what stelercus said. i made a PoC using gpt-3 at work and even then we ended up ...
hm yeah, I’ll not use GPT-3 then. and I have to pay to use it
 lucid nimbus
one hot encoding and label encoding ... when should you use one over the other?
mild dirge
For categories you use one-hot encoding, for sequential data you may use label encoding
so f.e. if the column is "score" and you have very bad, bad, regular, good, very good
then you could convert those to 0, 1, 2, 3, 4
Because regular is closer to good than very good f.e., there is some relation between these categories
@lucid nimbus
 spare pollen
hi i have a ultimate tic tac toe game and i want to make an ai for the game, any library suggestion or tutorials i can use?
mild dirge
I think you would want to use a mini-max algorithm
lucid nimbus
thankss @mild dirge !
mild dirge
So no machine learning or anything
spare pollen
hmmm then any suggestions for that?
mild dirge
yeah, minimax
spare pollen
okay
mild dirge
That would be for regular tic-tac-toe, not sure how I would change for ultimate tic tac toe
spare pollen
ill try and figure something out
 wooden minnow
hi!
I want my code to perform semantic analysis and create a csv table:
from collections import Counter
import pandas as pd
stoplist = ['.', 'and', 'was', 'in', 'a', 'the', ',', '?', ':', 'of']
text1 = str(input("Paste text here: "))
words1 = [s.lower() for s in text1.split() if s.lower() not in stoplist]
data = {'quantity': words1}
df = pd.DataFrame(data)
df = df['quantity'].value_counts()
df.to_csv('seo.csv')
Stoplist works for words, however it does not for punctuation. Stackoverflow suggests using
.str.replace(r'[^\w\s]+', '')
but it doesn't work here: AttributeError: Can only use .str accessor with string values!
small orbit
how do i implement "Keras Tuner" in my code? https://colab.research.google.com/drive/13163dhtSAkL9h53yj2dsRStsNNDTESJB
brave sand
@serene scaffold sorry for the ping, let me know if I shouldn’t ping you from now on. what determines a question as a bad question? more importantly, does my program look through a sentence and look for keywords and sentence structure?
desert oar
brave sand
<@253696366952316929> sorry for the ping, let me know if I shouldn’t ping you fr...
it sounds like "what determines a question as a bad question" is specifically what you are expected to figure out 🙂
brave sand
desert oar
it sounds like "what determines a question as a bad question" is specifically wh...
yeah alright that makes sense. but how should my program work?
 pastel bobcat
hey guys does anyone have experience with working with the dn3 library for processing EEG data?
 main summit
wooden minnow
hi!
I want my code to perform semantic analysis and create a csv table:
from ...
main summit
wooden minnow
hi!
I want my code to perform semantic analysis and create a csv table:
from ...
try this:
from collections import Counter
import pandas as pd
import string

stoplist = ['and', 'was', 'in', 'a', 'the','of']
text1 = str(input("Paste text here: "))

# punctuation removal
text1 = text1.translate(str.maketrans('','',string.punctuation))

words1 = [s.lower() for s in text1.split() if s.lower() not in stoplist]
data = {'quantity': words1}
df = pd.DataFrame(data)
df = df['quantity'].value_counts()
df.to_csv('seo.csv')
how? again that seems like it's your task to figure out
i gave some suggestions yesterday, which require you to go through lots of examples and come up with some heuristics ("rules of thumb")
you often need to do "human learning" in order to do "machine learning" effectively
brave sand
I meant, are there any nlp specific tools or tips that would make this task easier
desert oar
they suggested regex, and that's definitely a good general-purpose tool
as well as the various string-processing functions in python
you might be able to use some functionality from NLTK or Spacy, but i suggest avoiding complicated "NLP stuff" until you at least have a better idea of what you actually need to do
avoid the temptation to jump for the coolest-sounding tool first
data science is 65% data cleaning, 15% reports/presentations/dataviz, 15% using rules of thumb and basic techniques, and 5% using advanced fancy stuff
small orbit
anyone?
 random sapphire
is it ok to promote my data science related youtube videos in this channel?
serene scaffold
random sapphire
is it ok to promote my data science related youtube videos in this channel?
No, this falls under advertisement. Sorry.
random sapphire
Thanks @serene scaffold - Is there a channel where that sort of thing is ok?
serene scaffold
brave sand
<@253696366952316929> sorry for the ping, let me know if I shouldn’t ping you fr...
"what makes a good or bad question" is for you to answer just as a regular person. don't think about it from the perspective of how you can detect the difference programmatically.
serene scaffold
random sapphire
Thanks <@253696366952316929> - Is there a channel where that sort of thing is ok...
There is not, as our rule against advertising applies to the whole server.
serene scaffold
desert oar
they suggested regex, and that's definitely a good general-purpose tool
@brave sand here's what's interesting about their suggestion that you use regex: regex is just detecting patterns in strings. the strings don't even have to mean anything in any human language for regex to work. so it's a very low-fi approach. more sophisticated approaches (like our beloved GPT-3) do things that try to emulate actually understanding what the words mean.
brave sand
serene scaffold
<@765319974469238814> here's what's interesting about their suggestion that you ...
alright I’ll look into regex. thanks
 merry ridge
Is there an easy way to check how a particular numpy method is implemented? I see that numpy is open source but when I go through github I am having trouble locating the relevant source code. In MATLAB at least, I can just open any function right from the terminal
spare pollen
if anyone can help me with minmax please go to #help-kiwi
 versed gulch
Hi guys does anyone know how to resize each pixel in an image i.e. from 1x1x1 to 6.64x6.64x8.8?


 frozen phoenix

 dusk tide


 warm copper


