#data-science-and-ml
1 messages · Page 396 of 1
 karmic valley
oh hey got an issue.
¬```py
temp=image_t.numpy()
temp=temp[0,0,...]
fig = plt.figure(frameon=False,)
ax = fig.add_axes([0, 0, 1, 1])
ax.axis('off')
ax.imshow(temp, cmap='gray', vmin=-0.4916811, vmax=0.5)
ax.plot(xs,256-file.flow[source_start:source_end],"#04dff6", linewidth=0.5)
ax.plot(xs, ys, "r-", linewidth=0.5)
plot_path = OUT_IMAGE_DIR / "test" / "plot" / f"{i}.png"
plot_path.parent.mkdir(exist_ok=True, parents=True)
fig.savefig(plot_path,dpi=300)
i want my figure to by 1024 by 256 pixels. how to do that? small orbit
@cloud maple: i actually think i just got it to work now. but thanks anyways
but it seems that i dont have enough gpu memory 😛
 cloud maple
Yup. That's tough. Most stuff won't run of 4 or 6 GBs of vram. I bought a cheap k80 with 24gb.
small orbit
batch_size = 1 <-- actually worked. 😄
so, now i am looking into finding what the biggest batch_size is
5 was too much
cloud maple
Yes, but it's slow going. I went down that road too. What model are you running?
small orbit
nvidia tesla k80?
cloud maple
yes
small orbit
cool, how much?
cloud maple
I think I paid $130 a year ago.
small orbit
running keras bert
100 000 emails(350mb)
cloud maple
Now they're $300
small orbit
oh, wow
cloud maple
I have a bunch of videos about it on my YouTube channel. https://www.youtube.com/watch?v=OIoem6-8xdI&t=337s

K80 for ML and AI BIOS setting, PCIE lanes, nvidia-smi, nvtop, CUDA, and facebook's parlai.
small orbit
i ran the model on the cpu for 5 days, but it was 5 days left. i thought that it would be better to test with GPU
ah, cool!
cloud maple
I got tired of not being able to run stuff on my 1050ti.
small orbit
will tensorflow use the TPU as a GPU? or do you need to do anything special in relation to tensorflow?
i have a laptop with nvidia quadro T1000 😮
cloud maple
Yes, on the CPU you might have 8 threads, but even a cheap GPU has hundreds of cores.
small orbit
yeah, true
crazy price on tesla k80 yeah
are they using these for bitcoin mining also maybe?
 desert oar
cloud maple
I got tired of not being able to run stuff on my 1050ti.
desert oar
cloud maple
I got tired of not being able to run stuff on my 1050ti.
i got a 1060 specifically because it was the oldest/cheapest graphics card that had tensor cores 😆
little did i know that gpu prices would go through the roof and i wouldn't be able to upgrade when i wanted
small orbit
@cloud maple: It seems by the estimated time to be running it in 2 days, instead of 10 days. quite a bit faster!
 daring pilot
hi
 mild dirge
Do you have any experience with AI at all?
 serene scaffold
so you don't actually want to know? you just came here to rickroll us?
daring pilot
Sorry, but I'm not working on a bot right now.
serene scaffold
Please don't waste our time.
mild dirge

daring pilot
ok.
cloud maple
Sorry, my neighbor rang the door bell.
small orbit
@mild dirge: who r u asking?
mild dirge
small orbit
<@309775277720993792>: who r u asking?
Message was deleted, dw about it 😛
small orbit
"It seems by the estimated time to be running it in 2 days, instead of 10 days. quite a bit faster!"
mild dirge
ah that seems like a fair improvement
small orbit
i am using the laptop gpu
10 days = laptop cpu
2 days = laptop gpu
i tried running on cloud cpu, but it wasnt faster it seemed.
mild dirge
ah too bad
small orbit
so, now i am trying to setup a cloud server to use with gpu
mild dirge
Our uni actually supplies a school computer with 220.000 cuda cores and like 5k cpu cores or something
But there's a waiting list and all, so most of the times I use my own computer anyways
small orbit
just struggling with installing all this cuda crap in linux:P
mild dirge
ah yeah, it's a struggle on windows
small orbit
oOo
mild dirge
So i'd imagine it's worse on linux
small orbit
that is crazy
well, on windows i managed to do it
on linux, you really need to find a tutorial with the correct linux distro and version. at the same time correct tensorflow, correct cuda, correct cudnn...etc
mild dirge
yikes haha
small orbit
the cloud computer has nvidia tesla M60. 6 cores, 56gb ram, 380gb storage
1.2 usd per hour
 grave frost
@small orbit most cloud providers give CUDA and all libraries pre-intstalled
you just mess about PIP a fair bit for your own packages, then you're good to go
small orbit
@grave frost: yeah, if you can figure out how
grave frost
small orbit
<@738058085083381760>: yeah, if you can figure out how
figure what out?
grave frost
well yeah, it probably provides an image when you're setting up the VM
small orbit
its really not intuitive at all
grave frost
it wont be
small orbit
too bad, because azure is quite good
grave frost
Azure itself is quite bad
plus cloud is usually simple for most people. the danger is to not get billed accidentally
small orbit
but you really need to read the M$ documentation to be able to understand it all, if you're not doing it like i am, learn by doing
grave frost
that's what the docs are for
small orbit
yeah, and the docs sux bigtime
they are using wording so that you dont really know what they are talking about
like, environment. what does that mean?
you can choose 😛
not intuitive
grave frost
thats basic terminology 🤷♂️
grave frost
virtual environment
small orbit
or python environment?
grave frost
perhaps you might be from a non-tech background? I recommend following some YT tutorial/course first
yes
it depends. either is a virtualenv or a conda env
small orbit
and, when you setup a "compute", you have a field where you can add "script"
is that script for docker? or is it bash?
python?
yeah, thats what i mean, i understand what the word means, but it can mean several things.
!= intuitive
small orbit
i know
but wording isnt cutting edge
they could have made it a whole lot more intuitive
grave frost
that's how docs are like. you get used to it after some time of suffering
they never tell you everything. its always figure out on your own
ppl are too lazy smh. can't blame them too. I haven't ever written a single doc
boring AF
desert oar
writing docs helps you reason about your work, it's a good exercise
mild dirge
don't wanna brag or anything, but I've written quite a lot of readmes 
 misty flint
technical writing is important and underappreciated 
good documentation can be hard to find at times
 slender sand
Hey, can anyone recommend a good person-detection tool for python? My partner and I are trying to build a rudimentary image search engine but I need something that will take an image (in memory) and tell me if I'm looking at a person or not, without taking 30 seconds to process each image. I've tried one or two on GH but haven't found one I like.
 pseudo wren
This may sound crazy based on what I maybe struggled with yesterday
But I am learning about model validation
I’m going to explain what I understand of model validation as best I can
And I’m hoping that you guys can tell me if what I think is actually correct
So the process of model validation is the process of making sure the features you want to evaluate are interacting with each other in a thorough way in order to yield the best results
We can hand validating and also k fold validate
We will take our x values and y values for whatever feature we have chosen to evaluate
(Let’s say it’s a housing market dataset and I want to see if price correlates to number of rooms)
I would do a correlation matrix to see if there’s indication of correlation
And then I would split my x’s and y’s into training and test sets
In k fold validation
I would have a training model and 3 test models
I will put them up against each other to see how they operate with the information given and calculate MSE or MAE. I would then iterate through all the values needed from the features selected
This will ensure my training model is well trained and is less thrown off by new information
How far off am I in this analysis?
serene scaffold
So the process of model validation is the process of making sure the features you want to evaluate are interacting with each other in a thorough way in order to yield the best results
Model validation is measuring the performance of the model. It does not necessarily involve analysis of the features.
We can hand validating and also k fold validate
I am not sure what you mean by "hand validate".
We will take our x values and y values for whatever feature we have chosen to evaluate
I'm a bit confused by this statement. Features are part of the x data.
I would have a training model and 3 test models
Did you mean train and test data? I have never heard of "train models" and "test models".
It sounds like you have learned a lot @pseudo wren, but are still confused about a few concepts.
pseudo wren
serene scaffold
> So the process of model validation is the process of making sure the features ...
So I got a little bit more clarity on some statements so I will try at a second attempt
-
So model validation is just performance testing to actually fix our model if it is not performing well, would involve supplying it new data.
-
When I say hand validate I meant iterate over it with a for loop. Weird terminology professor used.
-
So yes training data and testing data will have to be compared up against each other, with the data interacting in a good mix so as to supply more accurate results as to how the model is performing
I think when I said features I meant like the features we choose to measure in a data set. Like comparing car seating to price in a car data set.
Thank you for correcting me as well!
serene scaffold
-
So model validation is just performance ~~testing to actually fix our model if it is not performing well, would involve supplying it new data. ~~ measuring
-
so they meant "write the performance calculation code yourself". they were not introducing a new term.
-
I don't understand this part. you're talking about a way to pick which features to use in the model?
@pseudo wren ^
pseudo wren
Yes the way to pick which features to use in the model
serene scaffold
anyway, the term "cross validation" is pretty widely used. I don't normally hear people say "model validation", but all the usages I can find of it are only referring to calculating/measuring the performance.
but that's just a matter of terminology, not whether the concepts they're trying to teach you are valid.
pseudo wren
serene scaffold
anyway, the term "cross validation" is pretty widely used. I don't normally hear...
Would you say this far I do understand it at least?
serene scaffold
pseudo wren
Would you say this far I do understand it at least?
I am not sure
pseudo wren
What do I seem unclear on?
serene scaffold
you seem confused about how models and model training works in general, but that's completely normal/to be expected if you're taking an introductory course. while you seem to have a general idea, I don't want to give you a false sense of confidence by saying that you understand xyz, as I don't know exactly what you're going to be graded on.
Tell me this, can you explain in your own words what a feature is?
@pseudo wren
pseudo wren
Yes
So when I refer to features in a data frame, I am talking about values that I am going to be using for my training model
In the housing market example
 sterile rivet
I've a survey data with 10k entries (name is one of the columns in the df)
What piece of code should I use in order to check if there is any repetition of names?
pseudo wren
If I were to try and compare number of rooms to housing price
I believe those would be my features
From there
I would take that data and feed it to my model as x and y values, to see how the model interprets this data and how it makes predictions based on this data
desert oar
sterile rivet
I've a survey data with 10k entries (name is one of the columns in the df)
What ...
data['name'].duplicated().any() or similar. check the docs for pandas.Series.duplicated.
pseudo wren
This is what I think so far anyway
sterile rivet
desert oar
`data['name'].duplicated().any()` or similar. check the docs for `pandas.Series....
Will try that ouy, thank you!
pseudo wren
I could also perform regression on the data given by calculating the MSE and MAE and seeing what the loss is, or how close the model comes to the “truth”.
misty flint
pseudo wren
I would take that data and feed it to my model as x and y values, to see how the...
so...in ML-speak, when we say ML features we typically mean the variables / "x values" we are feeding into the model. i would avoid using "y values" in this context as that typically represents your target variable (i.e. housing price)
your "predictor variable"
tbh its really annoying how everything gets a different name in ML
serene scaffold
misty flint
tbh its really annoying how everything gets a different name in ML
I assume there is some number of people who try to make a name for themselves by assigning new words to things and making it sound like they're making a contribution
misty flint
serene scaffold
I assume there is some number of people who try to make a name for themselves by...
half of domain knowledge is understanding terminology and its connotations, i swear
pseudo wren
you guys probably arent wrong lol
so when we say features
we mean the independent variables
right
misty flint
that are being used in the model
pseudo wren
yeah
so in the analogy of the housing market
how would you guys structure a k-fold model
serene scaffold
well, there is no such thing as a k-fold model
serene scaffold
if you're doing k-fold cross validation, k is an integer, and you're making that many models.
pseudo wren
but using the example, how would you carry out the steps
misty flint
misty flint
that are being *used* in the model
bc theres another field under ML called "feature engineering" where we can come up with those features themselves (creating those variables)
pseudo wren
so i have a less abstract view on it
serene scaffold
@pseudo wren can you explain how k-fold cross validation works?
pseudo wren
sort of yes
so
and bare with me cuz i just learned this today
k-fold cross validation is a method of validating our model to make sure it has thoroughly had contact with all the data being provided in our model
this means having testing and training sets
you can do 3 testing to one training set
and calculate the results of that
misty flint
misty flint
bc theres another field under ML called "feature engineering" where we can come ...
"feature selection" refers to selecting a subset of features out of a given set of features to be used in a model (dont ask me why we have all these "official" terms for this stuff)
pseudo wren
and you'd do this multiple times to ensure your model has had exposure to everything
for each x and y variable
so you'd have like
x_training and y_testing
and then x_testing and y_training
serene scaffold
@pseudo wren
to make sure it has thoroughly had contact with all the data being provided in our model
models do not provide data. there is data in the data set, and models can either be trained upon data or make predictions from data.
you can do 3 testing to one training set
if you have 3 testing and one training set, what is k?
pseudo wren
I don’t think I’m good at communicating ideas with the technical vocabulary yet
But thank you for correcting me Pope
serene scaffold
you are welcome 
pseudo wren
If you have 3 testing and one training I think k is the one with the lowest MSE?
This is a lot to learn in a day
pseudo wren
What would K be then?
serene scaffold
3 + 1
pseudo wren
Yeah I sorta pulled that answer out of my ass I’ll admit
Ah that makes sense
3 training and 1 testing
Right?
serene scaffold
if you do k fold CV, you split the data into k groups ("folds"), and each group takes a turn being the test data
pseudo wren
K is the result of that… combination?
That makes sense
So in the example of the housing market
serene scaffold
and whichever group/fold gets to be the test data for that model, the rest get to be the training data. so every fold is part of the training data k - 1 times
pseudo wren
If I had a CV I’d split it up into 1/4th
And then each group gets their turn to be the training data
And the testing data
And this is to ensure our data is accounted for thoroughly
So the process would be
serene scaffold
pseudo wren
And this is to ensure our data is accounted for thoroughly
I suppose. the point is to get more use out of your data set, as there are some types of problems where data sets take a long time to create and are limited. though it can also be interesting to see if the performance varies a lot between folds.
for example, in my work, the data sets take thousands of hours to create.
pseudo wren
- Account for data frame information we are going to measure, and split it up into x and y values. Split it up further into training and testing groups.
- We then split the CV and test it up against each other with each group getting to be the training model and testing models at some point
Or sorry
Model is the wrong word
Im not being technical here
The training group and the testing group
misty flint
k=10 is also a common value you might come across. "10-fold cross validation"
 pseudo wren
- The purpose of this is to evaluate how our model is performing
pseudo wren
misty flint
k=10 is also a common value you might come across. "10-fold cross validation"
So the concept would still be essentially the same just in 10 rather than in 4. I’m guessing this can go on in groups forever.
I was given a small set to work with right now though
Do I have the general idea a little more correct?
misty flint
pseudo wren
So the concept would still be essentially the same just in 10 rather than in 4. ...
it can. but like stelercus said, you usually use this method when you have a limited data set, so theres usually not a need to divide it further (most of the time)
serene scaffold
pseudo wren
So the concept would still be essentially the same just in 10 rather than in 4. ...
@pseudo wren I guess you could keep increasing k until every fold has one item in it 😆
would increase training speeds for each fold
pseudo wren
lmao maybe! sounds inconvenient though!
serene scaffold
training speed
 lapis sequoia
what if i wrote ai to write ai better than me
serene scaffold
pseudo wren
I think I understand a little better now
I'm glad 😄 sounds like you really want to do well in the course
misty flint
serene scaffold
<@160842639938158593> I guess you could keep increasing k until every fold has o...
sounds like a great way to overfit
pseudo wren
I do! if i'm gonna be an AI researcher I hope to know this stuff well!
misty flint
its a broad field, so i highly recommend trying to look for a specialty btw
serene scaffold
lapis sequoia
what if i wrote ai to write ai better than me
well, if you do, don't tell anyone. just let it do your job and keep collecting that check
pseudo wren
implementation and learning scikit learn
pseudo wren
serene scaffold
well, if you do, don't tell anyone. just let it do your job and keep collecting ...
I saw some ted talk about this today
i thought it was a little silly
but it was a philosopher basically prophesizing ai as the end
funny to think about when they seem so dumb right now
basically saying how ai would then reproduce and write new ai
serene scaffold
uhhhhhhhhhhhhhhhhhhhh. there are some problems that AI can do very well. and there are some problems where it performs well unexpectedly. but there are core human competencies that AI can't emulate currently.
lapis sequoia
pseudo wren
yeah but i don't know if it'll _end_ us right?
it certainly can and probably will
misty flint
desert oar
we will end us before AGI ends us
real talk tho
pseudo wren
yeah we might fuck the earth before we hit that point
serene scaffold
you know how you're learning that models are things that learn stuff from data, and then predict one of the columns in the data? that's sort of the whole thing. there isn't a point at which the model becomes self-aware and tries to control society from your computer.
lapis sequoia
pseudo wren
yeah we might fuck the earth before we hit that point
too late for that
pseudo wren
serene scaffold
you know how you're learning that models are things that learn stuff from data, ...
yeah i think that's what i've started to realize
they don't exactly possess neuroplasticity
serene scaffold
so to put what you're learning in context, you're learning about classifiers, which are models that assign labels to things. and that in itself is a huge part of what AI is
pseudo wren
hm yeah
so is it like
to build an AI
it's made up of a ton of classifiers like the models i'm learning?
like if i wanted to make some insurance AI software
I could include the housing model I trained
a car model
etc.
and package that into an artificial intelligence?
serene scaffold
depends on what you consider to be "an AI". but a lot of software that involves AI will probably involve classifiers in some way.
though I think insurance is a famous example of where AI probably shouldn't be used. if you're going to tell a customer that they're considered high-risk, you should have a specific reason, not "I entered your data into the model and it told me you were high-risk"
pseudo wren
Lmao yeah AI probably shouldn’t be involved in something like that
desert oar
serene scaffold
though I think insurance is a famous example of where AI probably shouldn't be u...
this is actually a legal requirement in the usa, in some cases (e.g. pricing) your models have to be pre-registered and pre-approved by state regulators. underwriting has more freedom, at least in business/p&c.
pseudo wren
Would we package classifiers together from different models we trained to make up artificial intelligence software?
Or is that not part of the process
serene scaffold
desert oar
this is actually a legal requirement in the usa, in some cases (e.g. pricing) yo...
by model, do you mean as a synonym for "pricing scheme/structure"? not an ML model?
desert oar
serene scaffold
by model, do you mean as a synonym for "pricing scheme/structure"? not an ML mod...
the former, but i believe they are allowed to use decision trees and regression
pseudo wren
desert oar
the former, but i believe they are allowed to use decision trees and regression
Hopefully insurance never becomes fully automated
Or cars
But I’m sure you guys would be able to say how successful that would be better than I
 safe elk
misty flint
real talk tho <:kekHands:948697940711587900>
safe elk
misty flint
real talk tho <:kekHands:948697940711587900>
Elon talk ...lmao
safe elk
serene scaffold
depends on what you consider to be "*an* AI". but a lot of software that involve...
Great book on that topic https://en.m.wikipedia.org/wiki/Weapons_of_Math_Destruction

Weapons of Math Destruction is a 2016 American book about the societal impact of algorithms, written by Cathy O'Neil. It explores how some big data algorithms are increasingly used in ways that reinforce preexisting inequality. It was longlisted for the 2016 National Book Award for Nonfiction but did not make it through the shortlist has been wi...
 iron basalt
pseudo wren
yeah but i don't know if it'll _end_ us right?
iron basalt
pseudo wren
yeah but i don't know if it'll _end_ us right?
There are many ways in which humanity can already end itself on purpose or not. There is not really any good prediction that can be made as to what will happen post wide-spread AGI (because nothing like it has ever happened (anywhere in the universe as far as we know)). There are certain classes of "safe" AI, but that won't stop the "non-safe" ones from being made. And anybody with enough computers can make them, so it's kind of unavoidable at this point (without some major setback like a nuclear war).
pseudo wren
iron basalt
There are many ways in which humanity can already end itself on purpose or not. ...
Maybe so. Hopefully my contributions to the field are only good.
iron basalt
serene scaffold
though I think insurance is a famous example of where AI probably shouldn't be u...
Unless the AI can give you the reason why it thought that, but most don't do that now.
Nor are most out there in use right now quines.
(PaLM actually might be, if it trained on its own source code too / read it)
 keen dragon
highest_salaries = salary.sort_values(by='salary', ascending=False)
eighth_highest_salary = tenpaid.get['salary'].index[9]
eighth_player_name = tenpaid.get['name'].index[9]
print('Player:', eighth_player_name, '\nSalary:', eighth_highest_salary)
what is wrong with this code

 graceful glacier
i have the following table

i want to group the columns into an umbrella 'measures' column
what pandas function can i use to make the columns multiindex?
sterile rivet
graceful glacier
i want to group the columns into an umbrella 'measures' column
You should check documentation on groupby
 versed gulch
is there a way to save 3D image i.e. i converted my 2D arrays to an image and saved them into a file, is this possible when converting a 3D array into a 3D image?
 true elk
Hey, any tips to improve pytesseract results? I've tried almost everything I found online (grayscale, threshold, psm modes, white margin, etc)
Is model training on Tesseract mandatory for a reliable/consistent result ?
(this is not a fancy font)
please @ me if you have tips. Model training is my last option. It's a licensed font, I can't easily train the model without manual data entry..
 gilded kestrel
I'm experimenting with a dataset for a regression task. In short, I want to predict how long a user has to wait for x to happen (this is my target variable in seconds). I have various features, including a date column in a format yy:mm:dd:hh:mm:ss. My assumption is that yy:mm is not important but the time of the day is. E.g. I want my prediction to take into account the time of day. Should I be looking at time series or just a way to include time as a feature?
 hybrid mica
in general, does XGBoost give good results?
 stark breach
Hey i have got a model i just made , its a very small linear regression project , will anyone be able to help me out by evaluating it and telling me where i can improve ,you can send a DM if you are ready to help , i will send you the notebook
 candid pollen
Hello! im tring to extract values from ROI on a Image, is there any example or documentation that can i read??
hybrid mica
what is the best way to evaluate the performance of non-linear regression models?
 steady basalt
hybrid mica
in general, does XGBoost give good results?
steady basalt
hybrid mica
in general, does XGBoost give good results?
Yes
steady basalt
hybrid mica
what is the best way to evaluate the performance of non-linear regression models...
Error?
AUROC?
 frigid elk
ROI 😉
steady basalt
Area under roc curve is good for predictive performance
It takes into account both recall and specificity
For each prediction
Based on their own probability cut off
Although sometimes u may consider one more important than the other
candid pollen
candid pollen
Hello! im tring to extract values from ROI on a Image, is there any example or d...
or docs about ROI in general
 tough frigate
hybrid mica
in general, does XGBoost give good results?
tough frigate
hybrid mica
in general, does XGBoost give good results?
yeah
 chilly abyss
hi everyone, I want to replicate what's in this excel sheet in python.
The data structure in python is a one-dimention but contains monthly irradiation data for 2000 to 2021.
hi everyone, I want to replicate what's in this excel sheet in python.
The data structure in python is a one-dimention but contains monthly irradiation data for 2000 to 2021.
 desert oar
chilly abyss
hi everyone, I want to replicate what's in this excel sheet in python.
The data...
desert oar
chilly abyss
hi everyone, I want to replicate what's in this excel sheet in python.
The data...
you can actually import the data from xls. you don't have to type it all manually or copy-paste
you should use pandas for tables
so your data is in B2:O14, you can read exactly that range with pandas
true elk
Anyone has experience with pytesseract? How can I train the model without having the font?
chilly abyss
The fact is that, the data would be downloaded from the cloud and it will come in that 1d form so in actual sense the code I want to write would be able to work with the raw data that is the reason I m searching for ways to work with the 1D. I initially used excel just to learn and understand Monte Carlo simulation which is what I am trying to achieve in python
desert oar
i see, how do you know what date is attached to each data point? is there a separate series for the dates?
i would still recommend using pandas, because it has good features for time series
i think you are thinking about this problem in the wrong way. "Monte Carlo simulation" is pretty easy, you just do something over and over. you need to learn "how to get data in and out of python" and "how to draw from random variables" and "how to compute summary statistics"
you won't find useful resources on "monte carlo simulation in python" that explain all that
desert oar
it's better if you keep asking questions here, i would rather not dm
chilly abyss
Alright, get it.
 sullen edge
Hey there, I noticed that when an opencv imshow window is clicked and dragged, it blocks the execution of the code till it's released. Any idea what causes this and how it can be disabled?
chilly abyss
desert oar
i see, how do you know what date is attached to each data point? is there a sepa...
The downloaded data is in this form

After Dec 2000, the next 12set of data would be Jan 2001, Feb 2001....Dec 2001, till the last set of data
desert oar
oh i see, every number is already an average
chilly abyss
No not an average
desert oar
oh sorry, the value in the table
so you have 132 numbers, corresponding to that table
and it's in a 1d array
chilly abyss
The numbers in the table are of different unit so there is a differenct
lapis sequoia
Hello friends ,
I hope you are doing well.
I am selected to work on a problem to develop ML model to predict cancer using HMM....actually problem is I am just a beginner in ML...can you guys suggest how should I proceed to work on this problem ?
desert oar
okay. but you can reshape it into the table with .reshape, then i recommend putting it into a pandas dataframe for further analysis
chilly abyss
The number in the table is a 2d with different units of the numbers in the juptyter notebook
chilly abyss
values 1 - 12 represent data for Jan to Dec 2000; values 13 to 24 reprevalues data fro Jan to Dec 2001...
chilly abyss
desert oar
okay. but you can reshape it into the table with `.reshape`, then i recommend pu...
ok, I will go read about this an implement it. 🙂
desert oar
chilly abyss
ok, I will go read about this an implement it. 🙂
import numpy as np
import pandas as pd

# Import your data however
data_1d = np.loadtxt(...)

# Reshape the data to have 12 columns, automatically
# adjusting the number of rows (with "-1")
data_2d = data_1d.reshape((-1, 12))

# Months for the column labels
months = [
    'Jan', 'Feb', 'Mar', 'Apr', 'May', 'Jun',
    'Jul', 'Aug', 'Sep', 'Oct', 'Nov', 'Dec',
]

# Years for the row labels
years = [
    str(year) for year in range(2000, 2000 + data_2d.shape[0])
]

# Build a Data Frame
data = pd.DataFrame(data_2d, columns=years, index=years)

# Optionally, save the data frame to a file so
# you don't have to do this processing again
data.to_csv(...)
now you can do table-oriented operations on data
you might also want to read the pandas user guides
https://pandas.pydata.org/docs/getting_started/intro_tutorials/index.html
https://pandas.pydata.org/docs/user_guide/index.html
pandas is more or less the standard tool for tabular data analysis
another option is to load your data as 1d data, and then do "groupby" and "rolling" operations to find the averages, but that is more advanced usage
chilly abyss
👍🏾 great
chilly abyss
desert oar
```python
import numpy as np
import pandas as pd
# Import your data however
dat...
let me run this and see ..
desert oar
it would look like this:
import itertools  # included with python

import numpy as np
import pandas as pd

# Import your data however
data_1d = np.loadtxt(...)

# Months for the column labels
months = [
    'Jan', 'Feb', 'Mar', 'Apr', 'May', 'Jun',
    'Jul', 'Aug', 'Sep', 'Oct', 'Nov', 'Dec',
]

# Years for the row labels
years = [
    str(year) for year in range(2000, 2000 + data_2d.shape[0])
]

yearmon_dt = pd.to_datetime([
    f'{year} {month}' for year, month in itertools.product(years, months)
])

data = pd.Series(data_1d, index=yearmon_dt)
i recommend reading and understanding instead of copying and pasting 🙂
that code will not work as-written. you will need to adapt it to your own data
mild dirge
you want us to sift through a script of 1766 lines to help you copy and change it?
 fast dust
I'm trying to construct a Nerual Network without ml libs
How should I construct weights?
a single float array
or
list[list[list[float]]]
mild dirge
There are weights between each pair of consecutive layers
And the weights are connections from each node to each other node
So you'd have n_layers-1 weight matrices
and each matrix' size is dependent on the previous and next layers' sizes
fast dust
thanks!
serene scaffold
fast dust
I'm trying to construct a Nerual Network without ml libs
How should I construct ...
constructing a network "from scratch" is probably a good learning exercise, but I would still allow yourself to use numpy. it will make the code easier to follow without abstracting away any key details
fast dust
serene scaffold
constructing a network "from scratch" is probably a good learning exercise, but ...
I'm using numpy :)
its not a ml library and it helps me with a lot of things
like optimized dot production
learning the underlaying math of nerual networks is really fun actually
in tutorials and articles about constructing a nerual network from scratch, they don't write the code to be re-usable.
they hard code all the weights and biases by hand. I'm trying to make a more "OOP and re-usable" version of them
 tough briar
is it alright if i skip andrew ng's course because hes not teaching with python. I'm more inclined towards sentdex's series
mild dirge
Actually coded a NN from scratch, and the article I used had quite a lot of mistakes
 tacit basin
tough briar
is it alright if i skip andrew ng's course because hes not teaching with python....
tacit basin
tough briar
is it alright if i skip andrew ng's course because hes not teaching with python....
There's repo on GitHub with python code for Andrews NG course i think. Or maybe it was introduction to statistical thinking book which is in r. Great book btw.
tough briar
tacit basin
There's repo on GitHub with python code for Andrews NG course i think. Or maybe ...
so can i skip the lecs completely and ref to the repo alone?
because andrew keeps referring to the other languages and thats hard to follow
karmic valley
hey need some help. i have 1024xy coordinates tracking some object on an image. i want to tell python to make the image above those coordinates transparent. can someone help pls?
tacit basin
tough briar
because andrew keeps referring to the other languages and thats hard to follow
I mean there are plenty of courses . So you are fine to pick one that works best for you. I kind of liked the way Andrew explained the intuition behind algos but i got lost when he was taking math :) Matlab didn't help too.
iron basalt
sullen edge
Hey there, I noticed that when an opencv imshow window is clicked and dragged, i...
Are you on windows? If so, it's a common problem with UIs there because of how the windows message loop works. Many GUI frameworks (and video games) are too lazy to fix it / don't care.
tough briar
tacit basin
I mean there are plenty of courses . So you are fine to pick one that works best...
yeah Im thinking of going with sentdex's series on it
sullen edge
iron basalt
Are you on windows? If so, it's a common problem with UIs there because of how t...
Yeah, I'm on windows. Any workaround for this? It's a pain as I'm working on a video and the frames get buffered up
iron basalt
sullen edge
Yeah, I'm on windows. Any workaround for this? It's a pain as I'm working on a v...
No work around. You would have to edit opencv's source code.
 modest mulch
sullen edge
Hey there, I noticed that when an opencv imshow window is clicked and dragged, i...
modest mulch
sullen edge
Hey there, I noticed that when an opencv imshow window is clicked and dragged, i...
Go for multithreading if you want the window to be open whilst continuing execution
iron basalt
modest mulch
Go for multithreading if you want the window to be open whilst continuing execut...
*Yeah you could ignore the main thread being blocked / do everything in a second thread.
*Some GUIs / apps do this method when they are too lazy to figure out how Windows actually works.
*It's not exactly well documented or understandable.
modest mulch
Most GUIS are blocking ones. And it does make sense why they are, has nothning to do with understanding how os actually works
iron basalt
Multithreading makes your program harder to understand.
It's often not needed and used where one can just use non-blocking IO.
A GUI should be non-blocking without any need for threading.
*In some cases you may still need threading, but general only when you actually need it so it does not become unnecessarily complex.
tacit basin
tough briar
yeah Im thinking of going with sentdex's series on it
course.fast.ai is a great couse as well. it's a free MOOC, but also soon they start live paid curse with University of Qeensland (in-person and zoom)
 lilac kindle
Hi all, anyone knows if it's even possible to debug pyspark locally with breakpoints? Always raises an error after it reaches an action method on dataframes. Thanks.
 tawdry matrix
misty flint
lilac kindle
Hi all, anyone knows if it's even possible to debug pyspark locally with breakpo...
tawdry matrix
misty flint
lilac kindle
Hi all, anyone knows if it's even possible to debug pyspark locally with breakpo...
not sure. ive only ever tried using pyspark with gcp. their dataproc service or whatever its called.
lilac kindle
no worries I'll investigate further
running pyspark locally is still a pain in the butt
I mean it's not too bad
but not the best dev experience
 rocky lantern
I have a netcdf file that has two variables lon and lat, that are 1d arrays. I want to merge them into a 2d meshgrid of tuples. The code I currently have is below
import netCDF4 as nc4
import numpy as np

nc =  nc4.Dataset('geodata.nc','r', format='NETCDF4')
#open netcdf dataset

lon = nc.variables['lon']
#lon.shape -> (541,)

lat = nc.variables['lat']
#lat.shape -> (346,)

lons,lats = np.meshgrid(lon,lat)
#lons.shape -> (346, 541), lats.shape -> (346, 541)
Is there a way to easily zip the data values of the lons, lats MaskedArrays together into one MaskedArray of tuples data?
rocky lantern
Oh, I think this might work for me.
>>> coords = np.dstack((lons,lats))
>>> coords.shape
(346, 541, 2)
Damn, that's a pain. Thanks though
sullen edge
modest mulch
Go for multithreading if you want the window to be open whilst continuing execut...
I'll try that out. Not a great option though as I would have to share a large amount of data to the thread. Any suggestions on a method for this type of data sharing? Queues are horrible wrt performance.
lilac kindle
lilac kindle
Hi all, anyone knows if it's even possible to debug pyspark locally with breakpo...
For those wondering: in windows, set a new environ variable PYTHON_PYSPARK with the full path to the python.exe of the virtual environment that you're using; bAnG: breakpoints work with pyspark + VSCode
iron basalt
sullen edge
I'll try that out. Not a great option though as I would have to share a large am...
Due to the Python GIL, there is no super fast way of doing threading in Python anyhow. So I would not worry about it, try to just get it to work at all first.
Since it's only two threads, the main one being blocked for UI, and the rest, it should be fine.
modest mulch
iron basalt
Multithreading makes your program harder to understand.
Very few languages support non-blocking IO. But still this has nothning to do with understanding how os or window works tbh
iron basalt
modest mulch
Very few languages support non-blocking IO. But still this has nothning to do wi...
My point is that no GUI needs more than one thread to not block when dragging the window, nor when reading a file, getting user input, reading from a socket, or other IO.
Nor does it even need concurrency in the sense that it's some built in language feature or "fake" threads.
Using threading for this is not ideal, but everyone does it anyhow.
modest mulch
Ah thats fair. I mean even non blocking IO does some multithreading /multiprocessing under the hood, at least thats the case in js. I guess its inevitable
iron basalt
If you look up a solution to not blocking when dragging a window on Windows you will often find that making another thread is recommended. This is wide spread misinformation about how to properly program a GUI.
Under the hood it will of course multitask. Not multithread.
There is no need for the OS to wait for the entire file to finish reading. But it will actually wait unless you tell it not to in the user's process. Because the user's code is a bit more complicated when it's not blocking.
It's more simple to just block, and often you may not care about a short block.
But when the block time is large, it can become a problem.
(Or potentially forever in the case of not handling the GUI drag events)
(Or network with no timeout)
modest mulch
True, but there's no other way if the language doesnt support non blocking IO i guess
iron basalt
C, C++, Python, etc, most do.
Python also has language level concurrency.
Coroutines too.
But you can also set IO to non-blocking directly.
Basically, not matter which language, you have to tell the OS you want non-blocking IO.
modest mulch
Thats fair i guess
iron basalt
For example for sockets: https://docs.python.org/3/library/socket.html#socket.socket.setblocking
modest mulch
I didn't actually know that most languages supported async programming
iron basalt
It makes your program way more simple than having another thread for the socket.
modest mulch
yea for sure
modest mulch
Threads management can be a pain in the ass, especially when writing to a database / file
iron basalt
Yeah most don't seem to know about this, it's sadly wide spread misinformation on how to program a GUI too. Everyone kind of just copies everyone else without fixing the bad parts and it then over time is seen as the "correct" way of doing it, and it even shows up as the first answer on stack-overflow, etc.
It used to be the way people did it by default.
Somehow that knowledge was lost over time / generations.
(A lot of things in programming are just assumed to be the right way because everyone is doing it)
modest mulch
True
iron basalt
(It does not help that Windows, etc are stupidly complex and have bad docs)
tough briar
tacit basin
course.fast.ai is a great couse as well. it's a free MOOC, but also soon they st...
ayy tysm. I'll check it out
modest mulch
Anyone knows what could work for basketball court detection? I have tried using color space info, k means clustering but these didn't work, and I don't have a dataset to train some thing like a GMM model or encoder decoder
 mint palm

GitHub
Single-Stage Instance Shadow Detection with Bidirectional Relation Learning (CVPR 2021 Oral) - GitHub - stevewongv/SSIS: Single-Stage Instance Shadow Detection with Bidirectional Relation Learning ...
in these type of git rep
how do i download and run the code?
i see some update files as well
tacit basin
mint palm
how do i download and run the code?
It's documented in the readme. Clone repo, install requirements, build package, run demo, profit :)
pseudo wren
y = y.reshape(-1, 1)
x, y = np.array(x), np.array(y)
#np.any(np.isnan(mat))
x2 = PolynomialFeatures(degree=2, include_bias=False).fit_transform(x)
model = LinearRegression().fit(x2, y)
r_sq = model.score(x2, y)
intercept, coefficients = model.intercept_, model.coef_
y_pred = model.predict(x2)```trying to preform a linear regression on my data
but i'm getting the error that says input contains NaN, infinity or a value too large
not sure what the best fix is for this
desert oar
pseudo wren
but i'm getting the error that says input contains NaN, infinity or a value too ...
well do you have any nan or infinity in your data?
pseudo wren
😔 yes
but i still need to work with the data
so i'm not sure how to manipulate it to fit
desert oar
pseudo wren
😔 yes
you need to either impute values for them, or remove those rows. there are no other options for linear regression
karmic valley
i have 1024xy coordinates tracking some object on an image of 1024 width. i want to tell code to make the image above those coordinates transparent. could someone help pls
fast dust
mild dirge
Actually coded a NN from scratch, and the article I used had quite a lot of mist...
Yea, I'm also watching 3blue1browns Nerual Networks series and it's a gem
mild dirge
yeah that ones great
cloud maple
Do you watch NeuralNine
cloud maple
pseudo wren
```x = x.reshape(-1, 1)
y = y.reshape(-1, 1)
x, y = np.array(x), np.array(y)
#np...
You don't show where x is defined.
How are you loading the data?
frigid elk
any free resources to convert address to lat/lon? need to do distance calculation in miles from central point
 elfin pulsar
frigid elk
any free resources to convert address to lat/lon? need to do distance calculatio...
elfin pulsar
frigid elk
any free resources to convert address to lat/lon? need to do distance calculatio...
You can try using geopy:
frigid elk
thanks, i'll take a look
cloud maple
pseudo wren
it's in a different cell
Yes, but that may be where the error is, since you are getting that it is not a number. On what line are you getting the message?
pseudo wren
The error message is line 8 in the cell I sent
Had no issue assigning the x and y values
cloud maple
Can you print them out?
They should be vertical columns.
this will do what you want: https://www.youtube.com/watch?v=UnJCnWum6Go&list=PL7yh-TELLS1EZGz1-VDltwdwZvPV-jliQ&index=2

In today's episode we are starting by talking about the first supervised learning algorithm which is linear regression.
Linear Regression Blog Post: https://www.neuralnine.com/linear-regression-from-scratch-in-python/
Website: https://www.neuralnine.com/
Instagram: https://www.instagram.com/neuralnine
Twitter: https://twitter.com/neuralni...
misty flint

Consider Double Thumbs Up as a way to fine-tune your recommendations to see even more series or films influenced by what you love. A Thumbs Up still lets us know what you liked, so we use this response to make similar recommendations. But a Double Thumbs Up tells us what you loved and helps us get even more specific with your recommendations. For example, if you loved Bridgerton, you might see even more shows or films starring the cast, or from Shondaland.
desert oar
you know, this makes a lot of sense
thumbsup is "not bad"
thumbsdown is "did not like"
double up is "very good"
i know people are going to say that this is backpedaling on their change away from the stars, but for all we know this has been a product roadmap for a very long time
 next phoenix
found this interesting. https://ai.plainenglish.io/23-data-science-techniques-you-should-know-61bc2c9d1b3a?sk=1680c36193eb22198974c9008d62a33c
 misty flint
desert oar
i know people are going to say that this is backpedaling on their change away fr...
misty flint
desert oar
i know people are going to say that this is backpedaling on their change away fr...
honestly i think this is better than stars bc think about the end goal
stars you could do more quantitative analyses and get probably a better overall rating about something
but this double thumbs up is all about feeding this information into a RecSys that seems like it might be a deep learning RecSys
since it can pick up certain features, it seems like
and in the end, create a more personalized RecSys based off of very strong signals

safe elk
misty flint
stars you could do more quantitative analyses and get probably a better overall ...
What's next thumbs and toes for moar signal lmao
misty flint
safe elk
What's next thumbs and toes for moar signal lmao
you always come at the worst times
desert oar
misty flint
honestly i think this is better than stars bc think about the end goal
more importantly i think it is more likely for the ape using the computer to put good data in
humans are bad at stars and 1-5
 vagrant gust
lapis sequoia
vagrant gust
lapis sequoia
Can we run machine learning programs in google colab ?
 ocean swallow
lapis sequoia
Can we run machine learning programs in google colab ?
ocean swallow
lapis sequoia
Can we run machine learning programs in google colab ?
what do you mean? You can certainly run them, but there is firewall, so you can't serve them
lapis sequoia
ocean swallow
what do you mean? You can certainly run them, but there is firewall, so you can'...
Umm, i didn't understand what u mean by "serve them"
 quasi ether
guys what is the difference between activation kwarg and Activation layer in tensorflow?
here's an example :
activation kwarg :
model.add(Dense(64,activation="relu"))
Activation layer :
model.add(Dense(64))
model.add(Activation("relu"))
im getting different results and different accuracy rate
PS: im new to tensorflow
 pastel valve
 unique flame
I'm using 180x180 and slowly go up to see the difference for a classification task. I was told to just experiment
 digital folio
Hi Guys, I need some help
I want to detach 'Date' from df so that I can convert each column as List


^ when I do date
but date exist in the table
When I do data['Open'] or any other Column

date column is attached
true elk
Hey, I need some help with pytesseract . If someone has experience with training tesseract please @ me
desert oar
digital folio
date column is attached
the date column is actually the index, and it's actually a good thing that your index is meaningful
you can just use .tolist() on each column and the index will go away
that said, it's pretty rare that I need to actually convert a series to a list. so what are you trying to do?
versed gulch
how do you stack a list of 3D arrays into 1 3D array?
lapis sequoia
Hello. I just fixed my pytorch 2d self driving car AI from spinning in circles and now it's really dumb. How can i make it learn faster and better?
true elk
- Can I achieve good results without training tesseract? I've already tried most tips I found online (psm modes, white margin, threshold, etc.)
- If I really need to train tesseract, what is the best current tool? Most tools/articles I find are very old
Also I can't figure out how to compile on my MacOS
../configure PKG_CONFIG_PATH=/usr/local/opt/icu4c/lib/pkgconfig:/usr/local/opt/libarchive/lib/pkgconfig:/usr/local/opt/libffi/lib/pkgconfig
This command is taking 100% of my CPU for ages, I had to Ctrl+C it as my PC has been frozen for more than 30mn
When trying to skip this line and doing the sudo make training-install I've got the following errors
libtool: warning: 'libtesseract.la' has not been installed in '/usr/local/lib'
libtool: install: /usr/bin/install -c .libs/ambiguous_words /usr/local/bin/ambiguous_words
libtool: warning: 'libtesseract.la' has not been installed in '/usr/local/lib'
libtool: install: /usr/bin/install -c .libs/classifier_tester /usr/local/bin/classifier_tester
libtool: warning: 'libtesseract.la' has not been installed in '/usr/local/lib'
libtool: install: /usr/bin/install -c .libs/cntraining /usr/local/bin/cntraining
libtool: warning: 'libtesseract.la' has not been installed in '/usr/local/lib'
libtool: install: /usr/bin/install -c .libs/mftraining /usr/local/bin/mftraining
libtool: warning: 'libtesseract.la' has not been installed in '/usr/local/lib'
libtool: install: /usr/bin/install -c .libs/shapeclustering /usr/local/bin/shapeclustering```
Is that related to the fact that I canceled ./configure ?Or any other suggestion for OCR?

There is a tesseract --with-training-tools install history but I can't make it work
Error: invalid option: --with-training-tools when trying to do brew install tesseract --with-training-tools
 cinder matrix
can someone tell me what type of word embedding etc gpt2 uses
lapis sequoia
Hi,
Sometimes when you are using Python in the Colab environment you may be wondering how to get your web camera video stream in Colab to be able to use it with your Python code for you ML models for example => check my new post if you are interested :
https://python.plainenglish.io/how-to-get-your-webcam-stream-in-colab-and-use-it-with-python-1f1d2c30df34?sk=f8723004313db0fc64ccc8cf4eac1f39
Medium
A step-by-step guide on getting your webcam stream in Colab and use it in your Python code
 arctic wedgeBOT
Hey @loud flame!
It looks like you tried to attach file type(s) that we do not allow (, .ipynb). We currently allow the following file types: .gif, .jpg, .jpeg, .mov, .mp4, .mpg, .png, .mp3, .wav, .ogg, .webm, .webp, .flac, .m4a, .csv, .json.
Feel free to ask in #community-meta if you think this is a mistake.
lapis sequoia
does anyone who knows python AI wanna have a dm conversation? i need to know how to make my AI smarter which i've coded with pytorch as it doesnt seem to learn
serene scaffold
@lapis sequoia you're more likely to get help if you put your question in this chat
lapis sequoia
ok
true elk
Can docker be a solution for my current Tesseract training/MacOS issue?
I'm stuck in the compiling hell 😦
lapis sequoia
So basically, I stopped my self driving car ai from going in circles after 80 generations and then it no longer had any intelligence. how do i fix the AI?
desert oar
true elk
Can docker be a solution for my current Tesseract training/MacOS issue?
did you try conda? docker is a valid option though too
true elk
Is this linked to the anaconda project? tbh I had a terrible experience with Anaconda, won't install ever again lol
(but it was a long time ago, may give another chance)
Do you have experience with training tesseract?
or fine-tuning to be exact
 rocky mason
does putting too many parameters into Gridsearch return hyper-parameters that will overfit when i use on my random forest classifier?
serene scaffold
rocky mason
does putting too many parameters into Gridsearch return hyper-parameters that wi...
I'm a bit confused by your question. the hyper parameters are set by the developer, and the parameters are what are learned during training
mild dirge
You can make sure of that with validation set
That's what you use for tuning hyper parameters
afterwards you can test your finished model on the test set, which will give a good estimate on how well it performs on new data (e.g. generalize/ not overfitting)
serene scaffold
I see. I guess I should look into gridsearch
mild dirge
Grid search is just trying many combinations of hyper parameters
serene scaffold
oh
via brute force? or does it intelligently skip combinations that are unlikely to work well based on the performance of previous combinations?
mild dirge
grid search is just brute force
that's why it's a grid, you try every combination
and you give a range of values for every hyper-param
serene scaffold
I'm learning 😄
mild dirge
You work with ml right? I'm sure you've already used it without knowing what it was called then
serene scaffold
yes, though I know what I know and don't know what I don't 
rocky mason
is validation set equivalent to your test set
mild dirge
No, the test set is not used when training the model
It is kept completely separate all the way until after you are done and finished your model
rocky mason
is splitting training set into train and validation right?
mild dirge
Then you can use it to only test how good it is, if you find out it is bad and try other hyper-parameters, then you might still overfit
mild dirge
rocky mason
is splitting training set into train and validation right?
Yes, you would have a train, validation and test set
rocky mason
because from what I know grid search do return you the best hyper-parameters available with best_params_ but it seems to be overfitting on my test set produced from the random forest, with the accuracy of validation set being far off from the accuracy of the training set even after 10 k- folds in grid search
mild dirge
yeah, that's why you keep the test set separate
How would you know it is overfitting though?
rocky mason
from what i am told after the k-fold, your train and validation accuracy should be quite close to 1 and another
and also the hyper-parameter returned me a depth of 16 to put onto the dec tree, so im sure that going to overfit as well
mild dirge
If you are using k-fold, you should only perform k-fold with some training data, which will split it into several folds, and then later test it on the test set when you are satisfied with the results
pseudo wren

Order yours today: https://lambdalabs.com/deep-learning/laptops/tensorbook?utm_source=youtube&utm_medium=link&utm_campaign=tbook22&utm_id=tbook22
Razer x Lambda = The World's Most Powerful Deep Learning Laptop.
Razer packed state-of-the-art GPU performance in an incredibly sleek and elegant machine. Lambda added expertise and software tools to...
Thought this might be of interest to the people here
tough frigate
i have a pickle file greater than 100mb, is there some way i can reduce the file size? in order to upload on github for deployment
serene scaffold
tough frigate
i have a pickle file greater than 100mb, is there some way i can reduce the file...
you could compress it, I guess, but you'd have to decompress it for deployment
 bold timber
How to read this data as csv? I have try to do, but it got an error like this:
ParserError: Error tokenizing data. C error: Expected 1 fields in line 7, saw 10
what code did you use? you would need to set # as the character for comments. you would also need to put each table in its own CSV file.
bold timber
I simply use pd.read_csv('data_csv')
can you guide me on how the code should be used?
serene scaffold
bold timber
I simply use pd.read_csv('data_csv')
can you guide me on how the code should be...
you first need to have separate CSVs for each table. There are at least two separate tables in the screenshot you showed. there might be more that aren't in the screenshot.
!docs pandas.read_csv
arctic wedgeBOT
pandas.read_csv(filepath_or_buffer, sep=NoDefault.no_default, delimiter=None, header='infer', names=NoDefault.no_default, index_col=None, usecols=None, squeeze=None, ...)```
Read a comma-separated values (csv) file into DataFrame.

Also supports optionally iterating or breaking of the file into chunks.

Additional help can be found in the online docs for [IO Tools](https://pandas.pydata.org/pandas-docs/stable/user_guide/io.html).you also need comment='#' in the read_csv function, since there are comments at the top of the CSV file. you could also delete the comments intead.
bold timber
serene scaffold
you also need `comment='#'` in the read_csv function, since there are comments a...
can you give me a clue about attributes that can be used for reading my dataset?
bold timber
serene scaffold
you also need `comment='#'` in the read_csv function, since there are comments a...
It works. Thank you so much!!!
desert oar
bold timber
can you give me a clue about attributes that can be used for reading my dataset?
!d pandas.read_csv
arctic wedgeBOT
pandas.read_csv(filepath_or_buffer, sep=NoDefault.no_default, delimiter=None, header='infer', names=NoDefault.no_default, index_col=None, usecols=None, squeeze=None, ...)```
Read a comma-separated values (csv) file into DataFrame.

Also supports optionally iterating or breaking of the file into chunks.

Additional help can be found in the online docs for [IO Tools](https://pandas.pydata.org/pandas-docs/stable/user_guide/io.html).the docs describe all the options
serene scaffold
I already linked to that
serene scaffold
it's okay. ||I don't always scroll up||
also read_csv has a metric fuckton of parameters
I scrolled for quite a while before I control+f'ed comment
desert oar
docs should always have anchors on individual parameter descriptions as well as the function itself
that way you can link directly to the parameter you are talking about
serene scaffold
I suspect the pandas team can't put that on their plate unless someone volunteers to implement/maintain it
I heard they were struggling, but I don't remember the specifics
desert oar
my impression is that they're just overloaded, too many lines of code and not enough people to work on it
like many/most things in the python ecosystem. billions of dollars in global revenue generated on the back of an understaffed underfunded team
fwiw i don't think this should be a "pandas" problem, it should be part of sphinx
serene scaffold
is it not?
misty flint
desert oar
my impression is that they're just overloaded, too many lines of code and not en...
would it help if more people contributed? i feel bad always using it so much but not giving back 
 fast rivet
I got this question from my data science class and I'm wondering what the confidence interval is. I think i have to look at the standard error of 4, but idk... I'm also not sure wether I got the average correct
 misty flint
desert oar
fwiw i don't think this should be a "pandas" problem, it should be part of sphin...
misty flint
desert oar
fwiw i don't think this should be a "pandas" problem, it should be part of sphin...
oh so its not possible with sphinx docs..? 
tough frigate
serene scaffold
you could compress it, I guess, but you'd have to decompress it for deployment
Ah that's the problem, I don't wanna do that either
Well, I'll just heroku directly
serene scaffold
tough frigate
Ah that's the problem, I don't wanna do that either
I don't know that you can have it both ways
bold timber
serene scaffold
you first need to have separate CSVs for each table. There are at least two sepa...
How to separate each table?
fast rivet
nvm my question. I already found the formula
serene scaffold
bold timber
How to separate each table?
copy each one into separate CSV files
bold timber
serene scaffold
copy each one into separate CSV files
Which means manually?
serene scaffold
bold timber
Which means manually?
yes
whoever made that file shouldn't have put more than one table in the same file. they sabotaged you.
 raw ivy
anybody know how I can make a pandas DF column with purely links clickable? They currently just export to excel as raw text
current code:
            if data[key].startswith("http"):
                df.at[index, key] = data[key] # data[key] is a URL
Oh ok, thank you for the information
serene scaffold
bold timber
Oh ok, thank you for the information
destroy them
bold timber
serene scaffold
*destroy them*
this dataset is part of my skills test to join the company; I can't do anything, but at the same time I don't understand what is this hahaha
but thank you for answering it very useful
 dusk tide
Why do we always use MSE instead of MAE as cost function?
bold timber
dusk tide
Why do we always use MSE instead of MAE as cost function?
Both are two different ways to calculate the error. The first is the average of square error and the second is the only absolute value of different targets and predictors. To evaluate the model you can use r2 to get a score of the model
and the both will following result based of your score of model
serene scaffold
!docs pandas.merge
arctic wedgeBOT
pandas.merge(left, right, how='inner', on=None, left_on=None, right_on=None, left_index=False, right_index=False, sort=False, suffixes=('_x', '_y'), copy=True, indicator=False, validate=None)```
Merge DataFrame or named Series objects with a database-style join.

A named Series object is treated as a DataFrame with a single named column.

The join is done on columns or indexes. If joining columns on columns, the DataFrame indexes *will be ignored*. Otherwise if joining indexes on indexes or indexes on a column or columns, the index will be passed on. When performing a cross merge, no column specifications to merge on are allowed.

Warning

If both key columns contain rows where the key is a null value, those rows will be matched against each other. This is different from usual SQL join behaviour and can lead to unexpected results.I want to remove many value by index, how to do that?
 rocky mason
what do you want to remove? NaN?
bold timber
rocky mason
what do you want to remove? NaN?
No, I want to remove all value from index 11 until end
rocky mason
whats the last row index for ur data
bold timber
rocky mason
whats the last row index for ur data
133
rocky mason
data = data.drop(labels=range(11, 134))
 hoary rover
bold timber
I want to remove many value by index, how to do that?
hoary rover
bold timber
I want to remove many value by index, how to do that?
Is that what you really want? Or do you want to remove all NA cells?
If there are more NA cells in your dataframe, this could affect your results as if you then try to run any diagnostics on that dataframe, SciPy and R may count those NA cells as part of the sample which will create a skew.
misty flint
raw ivy
anybody know how I can make a pandas DF column with purely links clickable? They...
not sure. are you exporting as csv? have you tried exporting as...xlsx?
oof. i think a small part of me died inside suggesting that
hoary rover
Ah yes. Excel. The glorified CSV reader.
raw ivy
misty flint
oof. i think a small part of me died inside suggesting that
hehe i am exporting as xlsx atm
when i click the link in the table once and click off it turns into a url
but rather not have to click every entry like that
hoary rover
If you want something that might perform better, look into directly importing into Google sheets.
misty flint
hoary rover
If you want something that might perform better, look into directly importing in...
oh this is a good idea
also cute pfp 
hoary rover
raw ivy
anybody know how I can make a pandas DF column with purely links clickable? They...
If you mind, can I ask what you fully trying to do here?
raw ivy
hoary rover
If you mind, can I ask what you fully trying to do here?
scraping page links/prices and getting links for them
real-estate links atm
hoary rover
Sure, are they for yourself or your workplace? My advice is to leave the links are they are and not touch them as they aren't really necessary for anything other than getting more information unless you're performing a depth text analysis
raw ivy
hoary rover
Sure, are they for yourself or your workplace? My advice is to leave the links a...
for myself, when they reach a price trigger it sends an email alert to me that the sheet is populated
 queen torrent
raw ivy
for myself, when they reach a price trigger it sends an email alert to me that t...
queen torrent
raw ivy
for myself, when they reach a price trigger it sends an email alert to me that t...
check out this link. https://www.exceldemy.com/create-a-hyperlink-in-excel/
it might be useful.
raw ivy
queen torrent
check out this link. https://www.exceldemy.com/create-a-hyperlink-in-excel/
it m...
hmm maybe something like
links = df.loc[:, "Link"]
for link in links:
    print(df[link])
    df[link] = "HYPERLINK(" + link + ")"
    print(df[link])
exactly. is it working fine?
also, how will the email be triggered? are you using SMTP module?
raw ivy
not quite i'm new with pandas struggling to get the actual location to replace in cell @queen torrent but trying to figure it out ^^
yes smtp
i.e when i get
links = df.loc[:, "Link"]
# 0     https://www.remax.ca/ab/
# 1     https://www.remax.ca/ab/
but havent found how to get the x/y to replace it :p
 tropic matrix
I'm making a machine learning model, and the input data has a lot of string data
One column (item_id) has over 2000 unique strings, so I'm wondering which would be faster to preprocess and train:
- onehot encoding that + all other categories with strings would make more than 2500 new columns to the dataset, which takes a long time to preprocess, and i'm not sure if it would affect how long it takes to train and/or the accuracy of the model
- make a new model for each item_id, which would make it much more accurate and take less preprocessing work, but would create over 2000 models that need to be trained (i'm not sure if i can utilize multiprocessing for this, so it would have to be single threaded), and save a new model file for each item_id
is there anything else I could do?
desert oar
misty flint
would it help if more people contributed? i feel bad always using it so much but...
small contributions probably help, but they probably need a funding injection from a corporation, and/or a dev who is paid to work on pandas a few hours a week
misty flint
sounds more sustainable, yeah
 dark phoenix
last_date_data["Rank"] = last_date_data["Target"].rank(ascending = False, method = 'first').astype(int) - 1
This throws a SettingwithCopyingWarning but the reference also suggests creating a new rank column in a similar way
https://pandas.pydata.org/docs/reference/api/pandas.DataFrame.rank.html
Is there a way to make that rank column and not get this warning ?
 finite coral
Hi there, I'm looking to add some empty data to the end of my dataframe. The data looks like this for example:
index      var-1  var-2 ... var-n
2022-01-01  1       2   ...   3
2022-01-01  1       2   ...   3
2022-01-01  1       2   ...   3
...
2022-01-31  1       2   ...   3
[eof]
I'm looking to add say all of February, but set the values to None; is there a simple way of doing this?
I know this is quite a noob question but I'm struggling bad peeps 💙
finite coral
finite coral
Hi there, I'm looking to add some empty data to the end of my dataframe. The dat...
Found a solution 🙂
import pandas as pd
df = [see original]
temp_df = pd.DataFrame([["2022-02-01", None, None, ..., None]], columns=df.columns)
df = pd.concat([df, temp_df])
!code
arctic wedgeBOT
Here's how to format Python code on Discord:
```py
print('Hello world!')
```
These are backticks, not quotes. Check this out if you can't find the backtick key.
karmic valley
https://paste.pythondiscord.com/luhoyasewu can you help me with some different code i want to work out average pixel whiteness of image. my code i wrote i think the library doesnt support transparency, i have transparency in my image
misty flint
more RecSys https://medium.com/nvidia-merlin/recommender-systems-not-just-recommender-models-485c161c755e
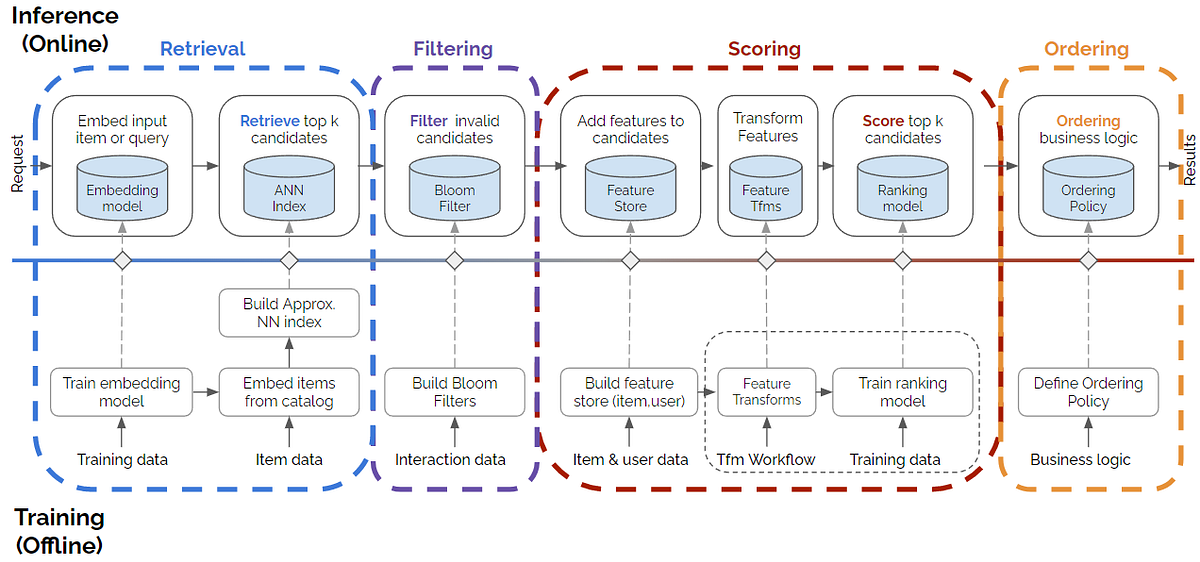
use cases
 ocean swallow
what do you mean? You can certainly run them, but there is firewall, so you can'...
ocean swallow
ocean swallow
what do you mean? You can certainly run them, but there is firewall, so you can'...
Colab notebooks doesn't allow incoming traffics from others ports other than the authed notebook port.
 wraith tapir
Anyone familiar with the jupyter notebook? mine just deleted a bunch of core system files. I already verified that they were infact deleted and reset my pc. I just want to know what happened and make sure this doesnt happen in the future.
dusk tide
bold timber
and the both will following result based of your score of model
If I use MAE to calculate the error then will it be okay?
hoary rover
tropic matrix
I'm making a machine learning model, and the input data has a lot of string data...
So initially, yes you are right, a one-hot vector is one of the correct preprocessing techniques you should be applying to large-scale categorical sets of data. With that many unique elements in your model you may benefit more from entity embedding techniques such as PCA.
https://www.ncbi.nlm.nih.gov/pmc/articles/PMC4792409/
http://www.stat.columbia.edu/~fwood/Teaching/w4315/Fall2009/pca.pdf
Please let me know if this answers your question.
:)

PubMed Central (PMC)
Large datasets are increasingly common and are often difficult to interpret. Principal component analysis (PCA) is a technique for reducing the dimensionality of such datasets, increasing interpretability but at the same time minimizing information loss. ...
hoary rover
wraith tapir
Anyone familiar with the jupyter notebook? mine just deleted a bunch of core sys...
Everyone here is familiar with jupyter notebook and no that is not at all possible without you doing something yourself. Can you give us some more information so we can help you?
wraith tapir
hoary rover
Everyone here is familiar with jupyter notebook and no that is not at all possib...
so i use jupyter through anaconda, earlier I was trying to relaunch my network after it crashed and then my desktop got deleted and I couldnt open any apps. I tried to restart my pc, but that didnt work. My documents folder, downloads folder, file explorer, and chrome were deleted along with other important stuff. I am using lucidrains version of stylegan. Does this help? I'm not sure what else I can give.
hoary rover
🤨
What exactly were you running on the jupyter notebook that would be heavy enough to tank your entire laptop?
Typically GAN's need a lot of GPU power. What exactly were you running?
wraith tapir
im training a GAN.
So ive been playing with the batch size and gradient accumulation to get the model to fit, I made some changes and tried to re launch it. It gave me a permission error first so i restarted the kernal and tried again. Then it started to delete files
hoary rover
The best mini-batch sizes to generally start with is 8 then increase from there up to and never higher than 64. Did you raise it higher than this?
I can't think of a single reason why it would start deleting your entire PC.
What loss function are you using?
wraith tapir
I never specified a loss function, so id assume the default. Here is the github for what im using https://github.com/lucidrains/stylegan2-pytorch
GitHub
Simplest working implementation of Stylegan2, state of the art generative adversarial network, in Pytorch. Enabling everyone to experience disentanglement - GitHub - lucidrains/stylegan2-pytorch: S...
Ill try to get the notebook opened so i can tell you what I have configured
hoary rover
Well despite your bug, you should use your industry knowledge to research a few loss functions and apply them to see which would better fit the model you are trying to train. Other than that I'm not sure how I can help you. My advice is to leave a ticket directly on the github page. I'm sure the author will find that hilarious.
misty flint
wraith tapir
hoary rover
Well despite your bug, you should use your industry knowledge to research a few ...

pseudo wren
Could a data scientist hypothetically become a software engineer?
(Not saying I want to change paths, but I’m wondering if there’s room to dabble in both)
Could be interesting and help me build out other parts of the artificial intelligence models I’m working on
 agile cobalt
pseudo wren
Could a data scientist hypothetically become a software engineer?
agile cobalt
pseudo wren
Could a data scientist hypothetically become a software engineer?
anyone can become anything
but depending on what you do currently and what you're thinking about doing, your experience so far could not help all that much, or it could already set you 95% of the way there
misty flint
pseudo wren
(Not saying I want to change paths, but I’m wondering if there’s room to dabble ...
i asked a somewhat related question before and i found recursive's response helpful/insightful #career-advice message
queen torrent
raw ivy
not quite i'm new with pandas struggling to get the actual location to replace i...
what are you trying to replace? what is the structure and shape of the dataframe?
agile cobalt
TIL pandas developers are planning Pandas's major version 2.0 (ETA: the end of this year) https://github.com/pandas-dev/pandas/issues/46776 / https://github.com/pandas-dev/pandas/milestone/42
GitHub
Tracking issue for the 2.0 release. (Note: pandas 2.0 is the next major release in the pandas semver-like release cycle and different from some historical discussion on pandas 2) currently schedule...
true elk
4th day of headache with Tesseract (I've even dreamed of it lol), I'm giving up
Any good OCR alternative? I've identified Calamari OCR, Keras-OCR and EasyOCR as candidates, any suggestions/comments are welcome!
I need it for two projects: a French one that I need to train on the font Open Sans, an another one for 7-segment digits (to read temperature)
Kraken seems to be only for historical. Keras-OCR seems not optimized for non english languages, so I think I'll not consider it as a viable option
Is Ocropy still a good option in 2022?
 calm nacelle
guys can somebody tell me how can i solve the quadratic formula in pycharm
 bronze spire
next phoenix
bronze spire
next phoenix
Found this interesting. Important tips https://medium.datadriveninvestor.com/efficient-code-and-optimization-techniques-for-python-1f9b95d3e6aa?sk=d2bd70b45ca814dd76e8cf756efee1e0
 serene scaffold
next phoenix
Found this interesting. Important tips https://medium.datadriveninvestor.com/eff...
serene scaffold
next phoenix
Found this interesting. Important tips https://medium.datadriveninvestor.com/eff...
I wouldn't read anything this person writes.
NumPy arrays are homogeneous and provide a fast and memory efficient alternative to Python lists.NumPy arrays vectorization technique, vectorize operations so they are performed on all elements of an object at once which allows the programmer to efficiently perform calculations over entire arrays.
but then immediately after that, they write this:
import numpy as np
def reciprocals(values):
    output = np.empty(len(values))
    for i in range(len(values)):
        output[i] = 1.0/values[i]
    return output
values  = np.random.randint(1,15,size=6)
reciprocals(values)
They clearly don't know what they're talking about.
In particular, their reciprocals function is not vectorized, and has the same efficiency as using regular Python lists. the vectorized alternative is simply 1 / values
!e
import numpy as np
values = np.arange(1, 6)
print(1 / values)
@serene scaffold :white_check_mark: Your eval job has completed with return code 0.
[1. 0.5 0.33333333 0.25 0.2 ]
 raw mountain
Hi, i am new to data science i have assignment to build a model for flower recognition. Can anyone suggest different models i can use to improve accuracy of my model
serene scaffold
raw mountain
Hi, i am new to data science i have assignment to build a model for flower recog...
is it supposed to classify images as "has flower" and "does not have flower", or is it supposed to classify specific kinds of flowers?
raw mountain
classify specific kind of flowers
serene scaffold
and this is images, right?
raw mountain
yes
serene scaffold
alright. what data set are you using?
raw mountain
one provided by kaggle
serene scaffold
link?
 serene scaffold
so every image has a flower, and there's five types of flowers to classify. I don't know much about image classification, but I think this is enough information for someone who does to help.
 strange crow
Try Aleph Alpha Magma model it's insane
serene scaffold
is that model practical for someone to train on a personal computer?
raw mountain
serene scaffold
is that model practical for someone to train on a personal computer?
no that is my college assignment basically
raw mountain
strange crow
Try Aleph Alpha Magma model it's insane
will try
serene scaffold
raw mountain
will try
if the aleph alpha magma model is "insane", it may be that it requires an especially powerful computer to train
that's why I asked Zettelkasten that question
raw mountain
ohh i see
i have to train basic model and compare accuracy
i have build one using cnn that was demonstrated in one youtube video
 loud flame
Why does a saved pickle model and a trained pickle model have different accuracies?
I can send the code and the datasets if needed

 polar depot
It depends on how you evaluate your accuracy. Dropout randomness is not disabled, batches are sampled randomly, etc.
strange crow
serene scaffold
if the aleph alpha magma model is "insane", it may be that it requires an especi...
Yes, that's why it offers a fine tuning service in the future and it's impossible to do use it on a personal computer
It's a couple hundred billion parameters
loud flame
polar depot
It depends on how you evaluate your accuracy. Dropout randomness is not disabled...
based off of the accuracy_score package from sklearn.metrics,
I just did
predictions2 = model2.predict(X_test) score2 = accuracy_score(y_test, predictions2)
do you want me to send the 1 jupyter nb and dataset?
polar depot
No. If you want more help, you can make a Colab notebook and share a link on the channel.
Ok, I looked at your notebook. Basically, you leaked test data.
loud flame
polar depot
Ok, I looked at your notebook. Basically, you leaked test data.
idu... can you explain?
polar depot
20% "test" data you used in the final evaluation are used in training.
loud flame
polar depot
20% "test" data you used in the final evaluation are used in training.
wait a min, its just fitting x and y train, predicting x test, and outside the loop it predicts x test
loud flame
polar depot
20% "test" data you used in the final evaluation are used in training.
is it because I didn't add the "random_state" argument in the train test split?
 random sapphire
loud flame
is it because I didn't add the "random_state" argument in the train test split?
random sapphire
loud flame
is it because I didn't add the "random_state" argument in the train test split?
That could be the cause
random sapphire
Hey all. I created a video about cross validation techniques for ML. Interested in getting feedback. https://youtu.be/-8s9KuNo5SA

In this video Rob Mulla discusses the essential skill that every machine learning practictioner needs to know - cross validation. Without cross validation it's easy to overfit your model and overstate it's predictive power. This video is a must watch for anyone trying to learn machine learning.
Timelime:
00:00 Intro
01:37 Setup
03:41 The Datas...
polar depot
Try to remove train_test_split in the loop.
loud flame
polar depot
Try to remove `train_test_split` in the loop.
alright
yup
no 97%
but there's a missing row of output
will that matter?
oh nvm, its the same
thanks a lot @polar depot @random sapphire
🙏
random sapphire
Any time. Setting random state in cross validation is always a good idea.
 topaz leaf
Has anyone here dealt with this issue as it pertains to computer vision before
" Termination Reason: Namespace TCC, Code 0
This app has crashed because it attempted to access privacy-sensitive data without a usage description. The app's Info.plist must contain an com.apple.security.device.camera key with a string value explaining to the user how the app uses this data."
im not sure how to change the info.plist for python IDLE mac is dumv
serene scaffold
topaz leaf
Has anyone here dealt with this issue as it pertains to computer vision before
*...
sounds like an issue with a specific library. did you look for that error message on SO?
topaz leaf
serene scaffold
sounds like an issue with a specific library. did you look for that error messag...
i dont think so its an issue with permissions ive encountered a similar issue in my brief stint with app dev apple requires all apps to state what permissions they might need prior to it being published so if i try to use camera in this case it crashes
topaz leaf
serene scaffold
sounds like an issue with a specific library. did you look for that error messag...
yeah searched it all of the answers were for Xcode
unique flame
Anyone got a good link that shows how to create a custom data set for object detection in keras? I have the images labeled using labelimg and saved according to pascal voc. Looking at the data structure on the keras tutorial (https://keras.io/examples/vision/retinanet/) I then see a lot of TFRecords..so I somehow have to cram all the images to a TFRecord?
 frigid elk
is there a faster way to get the max of a column in pyspark than below?
    # Define Working Month
    ReportMonth = dfProduct.select(F.max('monthkey').cast('int').alias('max_monthkey')).collect()[0]['max_monthkey']  # noqa
i'm using ReportMonth as a filter in dependent tables to ensure all the data is in sync (product would be the last table in the month to be updated). ... thinking about this, it seems ReportMonth should not need to be returned to the driver, but may be better suited in jvm memory. ... should i even be using a scalar for my filter or would it be more performant to store max_monthkey in a dataframe and broadcast join and filter
raw ivy
It's a pandas dataframe,
Price    Sq Footage    Bedroom(s)    Bathroom(s)    URL
$450,000    1,522    3    3    https://remax.com
i.e trying to replace all urls like that (several hundred atm)
raw ivy
queen torrent
what are you trying to replace? what is the structure and shape of the dataframe...
in case reply didnt go through :p
queen torrent
raw ivy
in case reply didnt go through :p
no clue xD
queen torrent
raw ivy
It's a pandas dataframe,
```
Price Sq Footage Bedroom(s) Bathroom(s) ...
okay... i assume you want to add '=HYPERLINK()' in the beginning of all values of the URL column, right?
raw ivy
queen torrent
okay... i assume you want to add '=HYPERLINK()' in the beginning of all values o...
you betcha, watching some pandas tutorials atm to get more knowledge as well ^^
pseudo wren
what is a way that i can physically display the MSE of my linear regression
the MSE, MAE and huber loss
bold timber
why I can't change the type of column?
 serene scaffold
bold timber
why I can't change the type of column?
serene scaffold
bold timber
why I can't change the type of column?
one of the values is something like "22.33%", which is a decimal number followed by a non-numeric character.
the values in the columns have to translate exactly to ints, or it won't work. if you can extract only the numeric part and round it up or down, then you can convert it to an int.
btw, I wouldn't access individual columns with dot notation in production code. it's often viewed as sloppy.
bold timber
serene scaffold
the values in the columns have to translate exactly to ints, or it won't work. i...
thank you for the explanation
serene scaffold
bold timber
thank you for the explanation
You are welcome 💚
grave frost
strange crow
It's a couple hundred billion parameters
did they release the size finally? source?
arctic wedgeBOT
Hey @lapis sequoia!
It looks like you tried to attach file type(s) that we do not allow (.ipynb). We currently allow the following file types: .gif, .jpg, .jpeg, .mov, .mp4, .mpg, .png, .mp3, .wav, .ogg, .webm, .webp, .flac, .m4a, .csv, .json.
Feel free to ask in #community-meta if you think this is a mistake.
serene scaffold
you'll have to put it on colab or something
@lapis sequoia
or copy and paste the specific parts of the code that are of interest.
lapis sequoia
serene scaffold
or copy and paste the specific parts of the code that are of interest.
would u help ?
can i dm u ?
serene scaffold
lapis sequoia
would u help ?
I don't know what the question is going to be or if it's something I know about. I can't commit to anything until I see the question.
lapis sequoia
serene scaffold
I don't know what the question is going to be or if it's something I know about....
okay im doing it again, but get ur server fixed 👺
hello, i'm trying to implement descent gradient from scratch
but i didnt get the best fit line, ig i have made some logical error, can anyone help me out, it wont take much time
import pandas as pd
import numpy as np
import matplotlib.pyplot as plt

def gradient_descent(x,y):
    m = b = 0
    i = 1000
    n = len(x)
    a = 0.00001

    for j in range(i):
        y0 = m * x + b
        cost = (1/n) * sum((y-y0)**2)
        dm = -(2/n) * sum(x*(y-y0))
        db = -(2/n) * sum(y-y0)
        m = m - a * dm
        b = b - a * db
        print ("m {}, b {}, cost {}".format(m,b,cost))
x= np.array([160,163,165,168,170,173,175,178,180,185,188,190,193,195,198,200])
y= np.array([50,58,59,70,67,70,78,77,79,81,87,83,92,88,99,100])
gradient_descent(x,y)

#PLOTTING THE GRAPH AFTER GETTING THE VALUE OF m AND b

y1= (0.43291477995* x) -0.00896346
plt.plot(x,y1)
plt.scatter(x,y,marker='o',color='red')
plt.xlabel("Height(cms)")
plt.ylabel("Weight(kgs)")
plt.title("Gradient Descent")
plt.show()```"not the best fit line"
 serene scaffold
lapis sequoia
okay im doing it again, but get ur server fixed 👺
serene scaffold
lapis sequoia
okay im doing it again, but get ur server fixed 👺
nothing needs to be fixed; the bot is supposed to zap file uploads.
lapis sequoia
bad bot 👎 👺
serene scaffold
lapis sequoia
"not the best fit line"
you're asserting that this isn't the best fit line? the scales don't start at 0 here, so it might be that this actually is the best fit line
arctic wedgeBOT
Don't get mad at me  I'm doing exactly what the staff programmed me to do!
lapis sequoia
serene scaffold
you're asserting that this isn't the best fit line? the scales don't start at 0 ...
🤔 but the scattered graph doesnt coincide with the line
🤔 the slope should be more
ig
idk, doing it first time 😭
serene scaffold
@lapis sequoia try making the learning rate larger, like 0.001 instead of 0.00001
lapis sequoia
arctic wedge
Don't get mad at me <:lemon_sentimental:754441881743786104> I'm doing exactly w...
🫂 🥺 okay dear, the staff is bad then 👎 👺
arctic wedgeBOT
Don't insult my creators like that  they love me
lapis sequoia
serene scaffold
<@456226577798135808> try making the learning rate larger, like 0.001 instead of...
i did, the cost is not going less than 77
lapis sequoia
arctic wedge
Don't insult my creators like that <:lemon_angrysad:817323592693841961> they lov...
🙄 ok bro, u r so dramatic
agile cobalt
it might not be returning at all
serene scaffold
it will implicitly return None if it doesn't hit any other return statements
!code
arctic wedgeBOT
Here's how to format Python code on Discord:
```py
print('Hello world!')
```
These are backticks, not quotes. Check this out if you can't find the backtick key.
agile cobalt
wList is empty?
serene scaffold
this is how you should share code, as much as possible ^
there's probably a non-iterative approach to what you're trying to do
I would need an example with all variables defined to diagnose.
lapis sequoia
lapis sequoia
"not the best fit line"
it should look like this..

 abstract cedar
Anyone know of a good tool or method for comparing two ML-generated transcripts of the same audio (two different models were used) and outputting a more accurate transcript?
serene scaffold
abstract cedar
Anyone know of a good tool or method for comparing two ML-generated transcripts ...
how is having two ML-generated transcripts supposed to help improve either of the models?
 deft spire
Does model.fit(...) handle epochs automatically or I'd have to add for loops for better accuracy (sklearn)?
bold timber
serene scaffold
the values in the columns have to translate exactly to ints, or it won't work. i...
how to translate the values to integer? the data showing like this which is a string
 serene scaffold
bold timber
how to translate the values to integer? the data showing like this which is a st...
serene scaffold
bold timber
how to translate the values to integer? the data showing like this which is a st...
Can you think of what the general steps are?
serene scaffold
deft spire
Does `model.fit(...)` handle epochs automatically or I'd have to add for loops f...
For what algorithm?
bold timber
serene scaffold
Can you think of what the general steps are?
I try to fix this with astype(float) but it doesn't works
can u give me a clue?
serene scaffold
bold timber
I try to fix this with astype(float) but it doesn't works
Why do you think it didn't work?
bold timber
serene scaffold
Why do you think it didn't work?
because the values is a string
serene scaffold
bold timber
because the values is a string
Not quite
bold timber
so, why?
bold timber
serene scaffold
See if you can think of one other possible region
because the value is float?
serene scaffold
bold timber
because the value is float?
there's a percent character. that's not part of a number.
if you had "20.33cm", the problem would be the same
 thin palm
Anybody in the consulting field and can spare me 10-15 minutes of questions I have when analyzing a business problem we're trying to solve? I'd like to pick your brain for a little bit to see how consultants think when faced with a problem. Please let me know and I look forward to hearing from you.
serene scaffold
thin palm
Anybody in the consulting field and can spare me 10-15 minutes of questions I ha...
you should always put your question in the chat. you're not going to get any takers if they have to DM you to find out if the secret question is about something they know about.
bold timber
serene scaffold
if you had `"20.33cm"`, the problem would be the same
but how to fix this?
serene scaffold
bold timber
but how to fix this?
you need to use the .str accessor to slice off the last character
look into pandas string series slice
 grand scaffold
Yo
I'm trying to learn ml
And I'm trying to make a simple neural network
So I have a problem with my code
It seems to have trouble making predictions
Ok nvm
It works
But the prediction is wrong
Lmao
 normal latch
what are you predicting? (I mean what kind of problem is )
grand scaffold
import numpy as np
feature_set = np.array([[70, 70, 60],[30, 40, 50],[60, 50, 70],[40, 50, 70]])
labels = np.array([[1, 0, 1, 0]])
labels = labels.reshape(4,1)
np.random.seed(42)
weights = np.random.rand(3,1)
bias = np.random.rand(1)
lr = 0.05
def sigmoid(x):
    return 1/(1+np.exp(-x))
def sigmoid_der(x):
    return sigmoid(x)*(1-sigmoid(x))

for epoch in range(20000):
    inputs = feature_set

    # feedforward step1
    XW = np.dot(feature_set, weights) + bias

    #feedforward step2
    z = sigmoid(XW)


    # backpropagation step 1
    error = z - labels

    print(error.sum())

    # backpropagation step 2
    dcost_dpred = error
    dpred_dz = sigmoid_der(z)
    z_delta = dcost_dpred * dpred_dz

    inputs = feature_set.T
    weights -= lr * np.dot(inputs, z_delta)

    for num in z_delta:
        bias -= lr * num


single_point = np.array([40, 40, 50])
result = sigmoid(np.dot(single_point, weights) + bias)
print(result)
is this andrew ng course?
grand scaffold
Who's that?
I learned how it works from this https://stackabuse.com/creating-a-neural-network-from-scratch-in-python/
Stack Abuse
This is the first article in the series of articles on "Creating a Neural Network From Scratch in Python". Creating a Neural Network from Scratch in...
So basically I'm trying to get how this works
abstract cedar
serene scaffold
how is having two ML-generated transcripts supposed to help improve either of th...
Neither model would be adjusted at all. The only exercise I'm interested in is perhaps a third model that is trained for comparing two manuscripts and figuring out how to blend them together in such a way as to correct some of the mistakes.
grand scaffold
And I'm having trouble
grand scaffold
Ok nvm
 bronze flume
Hello guys, im new to ML, i need help plz


 serene scaffold
@bronze flume it looks like somewhere along the way you ended up with the string '?' where a number was supposed to be. can you think of how that would have happened?
For the rest of the time that I help you (and in the future) I won't look at any screenshots of text that could have been copied and pasted as text. I won't look at screenshots of dataframes, either, so I'll give you instructions if you need to share those.
!code
arctic wedgeBOT
Here's how to format Python code on Discord:
```py
print('Hello world!')
```
These are backticks, not quotes. Check this out if you can't find the backtick key.
serene scaffold
^ This is how to show code on Discord
bronze flume
Oh sorry, thanks for ur help, i will check it out
serene scaffold
@bronze flume at some point along the way, did you replace missing data with '?'?
bronze flume
No i didnt, i used the data directly from here https://www.kaggle.com/code/semustafacevik/software-defect-prediction-data-analysis

Explore and run machine learning code with Kaggle Notebooks | Using data from Software Defect Prediction
serene scaffold
@bronze flume do you ever do model.fit somewhere that isn't shown?
bronze flume
i did it, i get the same ValueError
serene scaffold
bronze flume
i did it, i get the same ValueError
can you show the code for that part? remember the way I showed you to paste code
```py
code goes here on a new line
```
bronze flume
import pandas as pd;
from sklearn.tree import DecisionTreeClassifier
from sklearn.model_selection import train_test_split
from sklearn import ensemble
from sklearn.metrics import mean_absolute_error


data = pd.read_csv('jm1.csv')
data.head()

X = data.drop(columns=['defects'])
y = data['defects']

model.fit(X,y)

X_train, X_test, y_train, y_test = train_test_split(X, y, test_size=0.3, random_state=0)
this can't be right. you're using model before it is defined.
But assuming the way model is defined is valid, I can already see a problem: you're fitting (ie training) the model with the entire data, before creating separate train and test partitions.
bronze flume
Okey i undrestand
X_train, X_test, y_train, y_test = train_test_split(X, y, test_size=0.3, random_state=0)
model.fit(X_train,y_train)
it should be like this
 strange zealot
can someone here read partial auto correlation function plot?
 rose agate
Hi, I've been tasked with using a transformer to do time-series forecasting. I've started using the python darts library, which has a transformer implementation. The dataset I'm working with has ~1000 times series, for a whole year recorded hourly. As expected, training is impossibly slow, so for the time being I've shortened the number of time series and length of the series.
- Are there are any other transformer implementations, with optimizations like in this paper [https://arxiv.org/abs/1907.00235] that would be better suited?
- Is there any other models I should consider using instead of transformers? I've been asked to look at transformers but I'm sure if there's anything better it would be fine
- My time series (energy readings) have an hourly, daily, and monthly seasonality's, so it's obviously better to train using a whole years worth of data, however it's expensive. Is it possible to maybe only train on a few weeks of data and then use some other transform to account for the longer yearly seasonality?
loud flame
Can anyone help me improve my Random Forest Classifier Model which I made to predict the people who'd deposit in a bank based off some info,? A GridSearchCV addition can work too.
If so, I shall send the nb and datasets ( both cleaned and uncleaned ) and idrk what to do with the test dataset either.
tropic matrix
In pandas, I have a dataframe of values but I'm trying to find a way to get a new dataframe from the original where each column has at least one of every unique value from the original
for example, if i have:
0 | 1 | 2
1 | 2 | 2
2| 1 | 4
3| 3 | 1
4| 3 | 1
5| 0 | 1
I want to get:
0 | 1 | 2
1 | 2 | 2
2| 1 | 4
3| 3 | 1
4| 0 | 1
but I want to apply that same "algorithm" over a lot more rows (26), is there an efficient way to do this in pandas?
 hollow shore
Hey, i am having problems understanding how pyspark sql works in real world projects can anyone recommend a project which does this, so, i can look at the code and understand it?
rose agate
tropic matrix
In pandas, I have a dataframe of values but I'm trying to find a way to get a ne...
not sure if it's the best method, but I'd apply set to each column df.apply(set) and then create a new dataframe
tropic matrix
rose agate
not sure if it's the best method, but I'd apply set to each column `df.apply(set...
when i do that, i end up getting the rows and columns switched, and when i do .transpose() i just end up getting the image
 tough frigate
tropic matrix
In pandas, I have a dataframe of values but I'm trying to find a way to get a ne...
tough frigate
tropic matrix
In pandas, I have a dataframe of values but I'm trying to find a way to get a ne...
You can just do drop duplicates
tropic matrix
tough frigate
You can just do drop duplicates
how would i do that?
tough frigate
Documentation, and search drop duplicates lol I forgot the syntax
tropic matrix
tough frigate
Documentation, and search drop duplicates lol I forgot the syntax
oh wow that's actually really helpful
thank you!
(it's just df.drop_duplicates())
tough frigate
Hahe yeah
 jagged pewter
Hey, How do I save this model - https://www.tensorflow.org/tutorials/text/image_captioning ? it has multiple classes and is not sequential or functional.
 bold timber
What is difference between Total Sum of Squares and Residual Sum of Squares?
jagged pewter
 odd meteor
bold timber
What is difference between Total Sum of Squares and Residual Sum of Squares?
odd meteor
bold timber
What is difference between Total Sum of Squares and Residual Sum of Squares?
This is a more simpler way to understand those terminologies used in OLS
 odd meteor
TSS = RSS + ESS
RSS (Residual Sum of Squares) = the sum of squares of the error.
While OLS isn't really considered as an optimizer, it's however a non-iterative method we use to fit a model such that the RSS of observed and predicted values are minimised.
So RSS = TSS - ESS
With this understanding, your loss function MSE, when further broken down is given as
MSE = 1/N * (RSS)
You can look up the formulas in the attached image above to get more clarity
 teal mortar
hi guys, does anyone have experience with running jupyter notebooks/lab in pytorch/pytorch docker containers, how do you correctly connect to them, I bind the port of my machine with container port like -p 7000:7000 when run the docker image, so ports and the ip is set, but for some reason I cannot connect to the notebook when starting it from inside the container from bash terminal, if someone has experience doing so, please help, thank you
deft spire
serene scaffold
For what algorithm?
Let's say RFC
bold timber
Thank you @jagged pewter @odd meteor
jagged pewter
jagged pewter
Hey, How do I save this model - https://www.tensorflow.org/tutorials/text/image_...
I would appreciate any help on this as i have been training my model on pc for 2 days straight.
polar depot
This notebook has included save & restore code:

 floral valley
has anyone got any experience using the arima library and more specifically identifying the p,d,q values?
serene scaffold
deft spire
Let's say RFC
The docs will probably tell you. You can also look at the source code.
 crisp flax
I asked in R discord and got no reply, so I'm wondering if I will get anything here:
Does anyone know how I could use R's inbuilt arima function to agree better with Python's statsmodels ARIMA? I am getting very different results. I have to say I do not have all the expertise on ARIMA beyond the definitions, so understanding both R or Python's implementations is a bit beyond me
arctic wedgeBOT
Hey @loud flame!
It looks like you tried to attach file type(s) that we do not allow (.ipynb). We currently allow the following file types: .gif, .jpg, .jpeg, .mov, .mp4, .mpg, .png, .mp3, .wav, .ogg, .webm, .webp, .flac, .m4a, .csv, .json.
Feel free to ask in #community-meta if you think this is a mistake.
loud flame
Hi, can anyone help me resolve this problem which doesn't allow my code to be submitted since I donot have 22605 rows ( requirement ), but my code is alright


 serene scaffold
@loud flame are you showing the code in order? The order here doesn't look right. Order matters
Try pasting all the code in order as text
!code
arctic wedgeBOT
Here's how to format Python code on Discord:
```py
print('Hello world!')
```
These are backticks, not quotes. Check this out if you can't find the backtick key.
loud flame
but i've done it in different cells
serene scaffold
You can copy and paste each one individually.
loud flame
aight
serene scaffold
I'll be back in a few minutes to look at it
loud flame
if you can, please suggest ways in which I can improve my model's performance
loud flame
serene scaffold
I'll be back in a few minutes to look at it
the text is too huge
for discord's limit
serene scaffold
loud flame
the text is too huge
!paste
arctic wedgeBOT
Pasting large amounts of code
If your code is too long to fit in a codeblock in discord, you can paste your code here:
https://paste.pythondiscord.com/
After pasting your code, save it by clicking the floppy disk icon in the top right, or by typing ctrl + S. After doing that, the URL should change. Copy the URL and post it here so others can see it.
 serene scaffold
you can try, but McAfee is wrong about the paste bin.
serene scaffold
I see. do you still have a specific question, then?
loud flame
serene scaffold
I see. do you still have a specific question, then?
Improving the model?
after removing the cells where I removed the rowws
my accuracy went down to 89% from 90%
serene scaffold
loud flame
Improving the model?
that would require more of a deep dive than I'm interested to do. I would probably need to obtain the data and run it locally.
loud flame
serene scaffold
that would require more of a deep dive than I'm interested to do. I would probab...
I can send it in DMs
serene scaffold
I'm not interested to do that though.
loud flame
its just 3 files, the code, train, and test data
loud flame
serene scaffold
I'm not interested to do that though.
ohh, alright.
grand scaffold
Should I increase the possibilities of the training data so the machine has better accuracy?
So if I had data that's on a scale of 1 to 10 and each set of data results to a specific value
Should I use bigger numbers?
So instead I use a scale of 1 to 100 and have more accurate data?
So instead of inputting 5 I input 53 for example?
As long as the data is accurate?
grand scaffold
 hollow flare
From where should I start learning
hollow flare
From where should I start learning
Stack Abuse
This is the first article in the series of articles on "Creating a Neural Network From Scratch in Python". Creating a Neural Network from Scratch in...
This is the most easiest beginner article I have read so far
 prime hearth
@hollow flare in addition to the great article above, try to watch krish naik youtube channel his video on data science 2022. That will help you to understand what needed to get job as ML or DS
rocky mason
i think learn from supervised first,
hollow flare
rocky mason
i think learn from supervised first,
Ok
bronze spire
From where do I start learning about Data Science?
 misty flint
crisp flax
I asked in R discord and got no reply, so I'm wondering if I will get anything h...
misty flint
crisp flax
I asked in R discord and got no reply, so I'm wondering if I will get anything h...
i would probably look at their source code if i were you to see where the discrepancies are
see where the differences are in implementation
they probably make different assumptions
misty flint
idk if anybody here is familiar with statsmodels' ARIMA so idk what to tell you
but maybe
bronze spire
Guys, what's a good free source to learn Data Science from?
 rotund zenith
bronze spire
Guys, what's a good free source to learn Data Science from?
rotund zenith
bronze spire
Guys, what's a good free source to learn Data Science from?
Udemy has some pretty helpful and informative courses. However they're not free unfortunately, but they have regular sales for like $10 - $20, which ive found are far better than some of the college courses ive taken and certainly better than any free courses out there since they go really in depth
Anyone ever worked with Delta Lake and Spark?
Followed the quick start guide on the delta lake homepage, but cant get passed the first step cause of this error
/opt/spark/python/pyspark/shell.py:42: UserWarning: Failed to initialize Spark session.
  warnings.warn("Failed to initialize Spark session.")
Traceback (most recent call last):
  File "/opt/spark/python/pyspark/shell.py", line 38, in <module>
    spark = SparkSession._create_shell_session()  # type: ignore
  File "/opt/spark/python/pyspark/sql/session.py", line 553, in _create_shell_session
    return SparkSession.builder.getOrCreate()
  File "/opt/spark/python/pyspark/sql/session.py", line 233, in getOrCreate
    session._jsparkSession.sessionState().conf().setConfString(key, value)
  File "/home/faizififita/.local/lib/python3.7/site-packages/py4j/java_gateway.py", line 1322, in __call__
    answer, self.gateway_client, self.target_id, self.name)
  File "/opt/spark/python/pyspark/sql/utils.py", line 111, in deco
    return f(*a, **kw)
  File "/home/faizififita/.local/lib/python3.7/site-packages/py4j/protocol.py", line 328, in get_return_value
    format(target_id, ".", name), value)
py4j.protocol.Py4JJavaError: An error occurred while calling o30.sessionState.
: java.lang.IncompatibleClassChangeError: class org.apache.spark.sql.catalyst.TimeTravel can not implement org.apache.spark.sql.catalyst.plans.logical.LeafNode, because it is not an interface (org.apache.spark.sql.catalyst.plans.logical.LeafNode is in unnamed module of loader 'app')
        at java.base/java.lang.ClassLoader.defineClass1(Native Method)
        at java.base/java.lang.ClassLoader.defineClass(ClassLoader.java:1017)
        at java.base/java.security.SecureClassLoader.defineClass(SecureClassLoader.java:174)
        at java.base/jdk.internal.loader.BuiltinClassLoader.defineClass(BuiltinClassLoader.java:800)
        at java.base/jdk.internal.loader.BuiltinClassLoader.findClassOnClassPathOrNull(BuiltinClassLoader.java:698)
        at java.base/jdk.internal.loader.BuiltinClassLoader.loadClassOrNull(BuiltinClassLoader.java:621)
        at java.base/jdk.internal.loader.BuiltinClassLoader.loadClass(BuiltinClassLoader.java:579)
        at java.base/jdk.internal.loader.ClassLoaders$AppClassLoader.loadClass(ClassLoaders.java:178)
        at java.base/java.lang.ClassLoader.loadClass(ClassLoader.java:522)
        at io.delta.sql.parser.DeltaSqlParser.<init>(DeltaSqlParser.scala:71)
        at io.delta.sql.DeltaSparkSessionExtension.$anonfun$apply$1(DeltaSparkSessionExtension.scala:78)
        at org.apache.spark.sql.SparkSessionExtensions.$anonfun$buildParser$1(SparkSessionExtensions.scala:239)
        at scala.collection.IndexedSeqOptimized.foldLeft(IndexedSeqOptimized.scala:60)
        at scala.collection.IndexedSeqOptimized.foldLeft$(IndexedSeqOptimized.scala:68)
        at scala.collection.mutable.ArrayBuffer.foldLeft(ArrayBuffer.scala:49)
        at org.apache.spark.sql.SparkSessionExtensions.buildParser(SparkSessionExtensions.scala:238)
        at org.apache.spark.sql.internal.BaseSessionStateBuilder.sqlParser$lzycompute(BaseSessionStateBuilder.scala:124)
        at org.apache.spark.sql.internal.BaseSessionStateBuilder.sqlParser(BaseSessionStateBuilder.scala:123)
        at org.apache.spark.sql.internal.BaseSessionStateBuilder.build(BaseSessionStateBuilder.scala:341)
at org.apache.spark.sql.SparkSession$.org$apache$spark$sql$SparkSession$$instantiateSessionState(SparkSession.scala:1145)``` at org.apache.spark.sql.SparkSession.$anonfun$sessionState$2(SparkSession.scala:159)
at scala.Option.getOrElse(Option.scala:189)
at org.apache.spark.sql.SparkSession.sessionState$lzycompute(SparkSession.scala:155)
at org.apache.spark.sql.SparkSession.sessionState(SparkSession.scala:152)
at java.base/jdk.internal.reflect.NativeMethodAccessorImpl.invoke0(Native Method)
at java.base/jdk.internal.reflect.NativeMethodAccessorImpl.invoke(NativeMethodAccessorImpl.java:62)
at java.base/jdk.internal.reflect.DelegatingMethodAccessorImpl.invoke(DelegatingMethodAccessorImpl.java:43)
at java.base/java.lang.reflect.Method.invoke(Method.java:566)
at py4j.reflection.MethodInvoker.invoke(MethodInvoker.java:244)
at py4j.reflection.ReflectionEngine.invoke(ReflectionEngine.java:357)
at py4j.Gateway.invoke(Gateway.java:282)
at py4j.commands.AbstractCommand.invokeMethod(AbstractCommand.java:132)
at py4j.commands.CallCommand.execute(CallCommand.java:79)
at py4j.GatewayConnection.run(GatewayConnection.java:238)
at java.base/java.lang.Thread.run(Thread.java:829)```it looks there might be an issue when translating python code to java..? idk. i suck at reading tracebacks tbh
lapis sequoia
k
rotund zenith
misty flint
it looks there might be an issue when translating python code to java..? idk. i ...
No worries, appreciate it
My guess is the error stems from this /opt/spark/python/pyspark/shell.py:42: UserWarning: Failed to initialize Spark session.
Is that familiar to anyone?
lapis sequoia
kinda
misty flint
yes but if you follow it, look at this line:
> : java.lang.IncompatibleClassChangeError: class org.apache.spark.sql.catalyst.TimeTravel can not implement org.apache.spark.sql.catalyst.plans.logical.LeafNode, because it is not an interface (org.apache.spark.sql.catalyst.plans.logical.LeafNode is in unnamed module of loader 'app')```hey
misty flint
so im curious if the reason the spark session is not initializing may be due to the Py4J library or not
lapis sequoia
Could someone suggest me a project ?
rotund zenith
misty flint
so im curious if the reason the spark session is not initializing may be due to ...
I see. I'll look into both for now and see if i cant find something
lapis sequoia
please suggest
rotund zenith
lapis sequoia
Could someone suggest me a project ?
What kind of project?
lapis sequoia
Python of course
loud flame
lapis sequoia
Python of course
lmao
rotund zenith
Practice clustering some data using different clustering algos
loud flame
predict the various theories that we'd be able to prove and apply in the future, based on the theories and ideas we thought of years ago and have it well and running in the present day
such as AI, Electric Cars, Better Quality cameras, Better Infrastructure in cities ( all of these are too basic )
@lapis sequoia
lapis sequoia
k
loud flame
+Landing Boosters
loud flame
loud flame
+Landing Boosters
Reference : Elon Musk
the Iphone too
iphone, mac
everything
 slate hollow
i've done some research but i can't seem to find if vs (not vsc) 2022 is compatible with cuda 11.2.2
so yeah, is it?
and i'm just tryna get tensorflow set up, and from what i've seen the most recent version
of tensorflow only supports 11.2
topaz leaf
hey people anyone willing to answer some questions i have regarding my attempts at a computer vision project
tropic matrix
Is there a way to utilize multiprocessing when training DNN models with keras? I have to train nearly 2000 models, and each take around 30 seconds to train each. I was wondering if there’s a way to train multiple models at a time in order to speed up this training (assume that ram isn’t a concern)
serene scaffold
tropic matrix
Is there a way to utilize multiprocessing when training DNN models with keras? I...
why do you need 2000 models and why are they that quick to train?
tropic matrix
serene scaffold
why do you need 2000 models and why are they that quick to train?
i'm doing experimentation on my dataset using different portions of it based on different metrics
serene scaffold
tropic matrix
i'm doing experimentation on my dataset using different portions of it based on ...
alright. well, you can use the multiprocessing module. have you used it before?
tropic matrix
serene scaffold
alright. well, you can use the `multiprocessing` module. have you used it before...
I have not
serene scaffold
tropic matrix
I have not
start by making a function that takes a float between 0 and 1 as a parameter (ie the percentage of the data that you want to use), and which does everything else that you need in the function
tropic matrix
ok, and i'm assuming that function is what's duplicated in multiple processes?
serene scaffold
tropic matrix
ok, and i'm assuming that function is what's duplicated in multiple processes?
indeed
tropic matrix
should i worry or be concerned about anything else related to training? does tensorflow keras play nicely with multiprocessing?