#data-science-and-ml
1 messages · Page 392 of 1

 fickle hinge
Hey guys
So I have a dataset which contains like 28 records.
Is it feasible to run ANN on this dataset?
It's a regression problem
 misty flint
oh man i should just take a bayesian class tbh 
honestly im not even trying to go too far into bayesian stats. i only listened to that podcast bc one of my favorite podcasters was a guest on that show
but thanks for the guidance
i bookmarked the references anyway
 desert oar
fickle hinge
So I have a dataset which contains like 28 records.
Is it feasible to run ANN on...
desert oar
fickle hinge
So I have a dataset which contains like 28 records.
Is it feasible to run ANN on...
depending on the problem/data, maybe it would be ok with a small network (small number of features and hidden nodes)
but 28 is really small. like maybe even small for traditional linear regression
depending on what you actually want to do, you might want to take a more statistical approach to solving your problem
fickle hinge
Hmm okay
Thank you my sir
 sweet sequoia
[0, 1, 3, 5, 21, 22, 22, 24, 25, 25, 26, 27, 31, 32, 34, 40, 40, 42, 43, 44, 47, 50, 52, 55, 56, 56, 57, 58, 58, 59, 60, 63, 74, 76, 76, 80, 83, 84, 84, 86, 86, 87, 88, 90, 91, 91, 95, 97, 97, 100]
okay so I have a sorted array like this: to get half of it I do
half_data = data[:len(data)//2]
but for getting all the data after the half
like the first half of data gets cancelled
Um how do I get the second half of the data? or well 24th index
got it
 lapis sequoia
sweet sequoia
got it
lapis sequoia
sweet sequoia
got it
What was the problem that was happening?
 desert oar
 thin palm
maybe just say "Missions", not "Total Missions" on the y axis
also the graph makes sense but it's pretty ugly data for a histogram
what is the bin size? you should state that imo
with small datasets, histograms are really sensitive to the bin size
i'd suggest maybe adding a "rug plot" to the bottom showing all the individual missions

A rug plot is a plot of data for a single quantitative variable, displayed as marks along an axis. It is used to visualise the distribution of the data. As such it is analogous to a histogram with zero-width bins, or a one-dimensional scatter plot.
Rug plots are often used in combination with two-dimensional scatter plots by placing a rug plot o...
 mighty spoke
Hi I keep trying to run my code but its not running properly ```import scipy.integrate
import numpy as np
from matplotlib import pyplot as plt
from scipy.constants import G
from scipy.constants import m_e
from scipy.constants import m_p
from scipy.constants import c
from scipy.constants import hbar
#defining constants
C=0.86
#h_bar = 1.05457266e-34
Ye =[ 6/12,26/56] #carbon-12 nuclei and iron-56 nuclei
#c= 2.99792458e8#speed of light
#G=6.67259e-11#gravitational constant
#me = 9.1093897e-31#mass of electron
#mp = 1.6726231e-27 #mass of proton
h_bar=hbar
mp=m_p
me=m_e
rh0_0 = (mpme**3c**3)/(3np.pih_bar)#natural unit for density
#define scaling functions
R0Val=[]#natural unit of length
#cycling through the 2 values of Ye the number of electrons per nucleon
for i in Ye:
R0=np.sqrt((C3imec**2)/(4np.piGmprh0_0))
R0Val.append(R0)
#defining first order ODE's
def rhs3(x, p):
dpdx = np.zeros_like(p)
M = p[0]
q = p[1]
g=q2/3/(3*(1+q2/3)1/2)#gamma factor us a function of q
dpdx[0] = 3qx2
dpdx[1] = -(CqM)/g*x**2
return dpdx#return the two coupled 1st order ODE's
sol = scipy.integrate.solve_ivp(rhs3, [0,1], [0,1], dense_output=True)
x=np.linspace(0,1,1000)
M=sol.sol(x)[0, :]
q=sol.sol(x)[1, :]```
thin palm
desert oar
also the graph makes sense but it's pretty ugly data for a histogram
thanks so much for your help on all my questions last few days man. Been super clutch, now going to write my 5 page report. Cheers
Does anyone know any good ways to share my Jupyter Notebooks? I know the company probably wants instructions on how to use it
desert oar
thin palm
Does anyone know any good ways to share my Jupyter Notebooks? I know the company...
you can share the .ipynb file as-is and they will be able to see the outputs you saved to it
you can also use nbconvert to export it to an html file or even pdf
thin palm
desert oar
you can share the `.ipynb` file as-is and they will be able to see the outputs y...
so in my instructions they ask for "we’d also like you to include any code you wrote along the way to generate it."
Is it still okay to share the .ipynb or are they wanting something different
 mild dirge
thin palm
Does anyone know any good ways to share my Jupyter Notebooks? I know the company...
mild dirge
thin palm
Does anyone know any good ways to share my Jupyter Notebooks? I know the company...
Make a readme for this
mild dirge
thin palm
so in my instructions they ask for "we’d also like you to include any code you ...
and code can be inside a jupyter notebook
thin palm
mild dirge
Make a readme for this
man thank you for reminding me!!!!
 bold timber
Hi, I have a question: Why I got different version of PyTorch?

 serene scaffold
@bold timber must be different virtual environments
bold timber
serene scaffold
<@786960616664727572> must be different virtual environments
How to fix that?
serene scaffold
bold timber
How to fix that?
you need to start the jupyter notebook using the same virtual environment for the pip call on the left. unfortunately it would be very difficult to walk you through this remotely.
you can run import sys; print(sys.executable) in the notebook, and which pip in the terminal, and see if they're in the same folder.
 pseudo wren
I am trying to write a helper function for this json tuple that i am currently working with
i tried to unpack the tuple
but it doesn't appear to be working
strings = []
for row in r.json():
    strings.append(json.dumps(row))
strings

tooples = []
for row in strings:
    tooples.append((row,))
tooples```this is the conversion i did
i want to pull the entire row based on race
however my attempts at unpacking this are falling short so i'm not sure what i'm forgetting in trying to access this data
i'm using sqlite3
serene scaffold
no one is going to want to look at this. if you paste a few lines of it into the chat as text, that would be sufficient to establish what is happening.
 urban prism
!paste
 arctic wedgeBOT
Pasting large amounts of code
If your code is too long to fit in a codeblock in discord, you can paste your code here:
https://paste.pythondiscord.com/
After pasting your code, save it by clicking the floppy disk icon in the top right, or by typing ctrl + S. After doing that, the URL should change. Copy the URL and post it here so others can see it.
urban prism
Any context? :) @pseudo wren
pseudo wren
yes!
so
i converted this dictionary to be able to put into my sqlite3 server
i converted it into a tuple
and now i want to write a helper function that will parse through the "race" section and return rows based on race
i also want to be able to return rows based on year
i'm new to using sqlite3 with python
so i'm not super sure how to execute this. I tried to unpack it like a regular tuple, but it didn't work.
urban prism
Oh. I'd normally just use pandas, so I don't really know
pseudo wren
I did import pandas
But this is like
A tuple
With a string of dictionary inside
So i’m trying to figure out the best approach
bold timber
serene scaffold
you need to start the jupyter notebook using the same virtual environment for th...
When I want to import torch it did happen. How to fix this?
 urban prism
pseudo wren
So i’m trying to figure out the best approach
urban prism
pseudo wren
So i’m trying to figure out the best approach
Maybe get the string tuple and split it from the commas?
desert oar
thin palm
so in my instructions they ask for "we’d also like you to include any code you ...
the ipynb is the code. but you should at least also list the packages you installed that are required to run it.
serene scaffold
bold timber
When I want to import torch it did happen. How to fix this?
did you try looking into "restart jupyter notebook kernel"?
your question about why your torch versions were different is fine as there weren't any obvious leads for how to resolve it. but if you ask "how do I fix this?" every time something goes wrong, you won't really develop any debugging skills.
 kindred crag
anyone help plz
 serene scaffold
kindred crag
anyone help plz
serene scaffold
kindred crag
anyone help plz
this question belongs in #tools-and-devops
kindred crag
serene scaffold
this question belongs in <#463035462760792066>
ty
pseudo wren
urban prism
Maybe get the string tuple and split it from the commas?
It needs the commas to be read the correct way
misty flint
pseudo wren
It needs the commas to be read the correct way
!e
data = (1, '{"year": "2019", "leading_cause": "Alzheimer\'s Disease (G30)", "sex": "Female", "race_ethnicity": "Asian and Pacific Islander", "deaths": "50", "death_rate": "7.719849741", "age_adjusted_death_rate": "6.207494885"}')

import json

def tuple_unpacker(data):
  (tuple1, tuple2) = data
  dictionary = json.loads(tuple2)
  return dictionary["race_ethnicity"]

# function call
tuple_unpacker(data)
@misty flint :warning: Your eval job has completed with return code 0.
[No output]
ah shoot; forgot to print
well it returns this

but the thing is
this is just for unpacking for one row (but you can loop through it, etc.)
if you want it to return rows by race_ethnicity or by year, i recommend 1) unpacking and then 2) sending it to either an actual SQL database or pandas dataframe
so you can use the groupby function on it
otherwise you would have to create some sort of sorting algorithm if you try to do it all in one place
which does not sound like fun to me
but i mean you could do it if you want
i guess if its already unpacked, you could do a lot of things to it already

 safe elk
pseudo wren
<@!446424248479645706>
safe elk
pseudo wren
<@!446424248479645706>
Lmao coffee bribe
 hybrid mica
why is logistic regression a classification model?
 paper trellis
hey not sure if this is the right channel for this question, but what kind of graphs do you guys suggest if im trying to display frequency of data by location?
for example imagine a square separated into 3x3 sections. Each section has a numerical data associated with it, and I'd like to see which section gives me a high/low/most often etc
 rotund isle
I have a question
For sufficiently complex feature mappings, what problematic issue will we encounter that is particular to Logistic Regression
safe elk
paper trellis
hey not sure if this is the right channel for this question, but what kind of gr...
2D histogram
paper trellis
safe elk
2D histogram
Thanks! I'll give it a try, from pictures looks like something that's really applicable for my case
safe elk
hybrid mica
why is logistic regression a classification model?
Its a binary classifier
safe elk
paper trellis
Thanks! I'll give it a try, from pictures looks like something that's really app...
Actually used that once lmao
hybrid mica
does it output a number between 0 and 1? so logistic regression cannot be used with more than 2 groups? couldn't you use any regression model for binary classification?
safe elk
hybrid mica
does it output a number between 0 and 1? so logistic regression cannot be used w...
Two groups only
Ok regression can be done with two groups if we set a threshold value
hybrid mica
so
features... binary value
1 x y z 1
2 a b c 0
...
safe elk
In statistics, the logistic model (or logit model) is used to model the probability of a certain class or event taking place, such as the probability of a team winning, of a patient being healthy, etc. This can be extended to model several classes of events such as determining whether an image contains a cat, dog, lion, etc. Each object being d...
Says Mathematically, a binary logistic model has a dependent variable with two possible values, such as pass/fail which is represented by an indicator variable, where the two values are labeled "0" and "1"
So binary class
hybrid mica
is the output of logistic regression a binary class, or a decimal between 0 and 1; will it say 0, or something like 0.21?
source: https://www.analyticsvidhya.com/blog/2020/11/popular-classification-models-for-machine-learning/

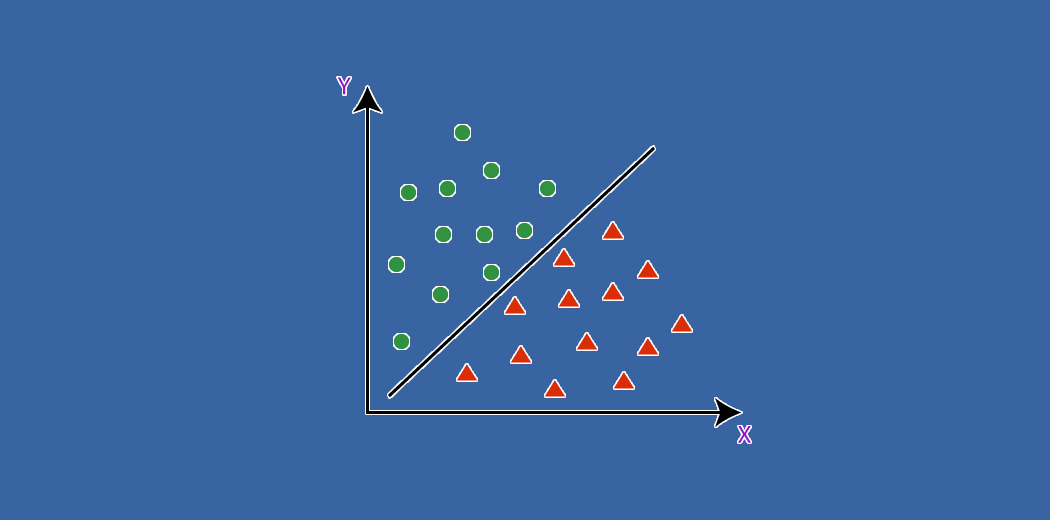
Classification is a basic type of problem every data scientist must know. Let's have a look at various classification models in ML.
safe elk
If it is a binary logistic regression 0 or 1 ...if plain logistic regression it can have intermediate I think
So least squares in linear regression vs sigmoid in logistic regression

In this step-by-step tutorial, you'll get started with logistic regression in Python. Classification is one of the most important areas of machine learning, and logistic regression is one of its basic methods. You'll learn how to create, evaluate, and apply a model to make predictions.
Sample there did binary class
Typical logistic regression use
Because they did a "common case of logistic regression applied to binary classification"
safe elk
pseudo wren
;-; don't make me cry rex
Dont cry it wont fix your code lmao
safe elk
rotund isle
I have a question
` For sufficiently complex feature mappings, what problematic ...
It is linear classifier like linear regression if the relationship between the variables are non linear or complex the model wont be too accurate
rotund isle
safe elk
It is linear classifier like linear regression if the relationship between the ...
yeah but that's not particular to logistic regression, that's in linear regression too

 safe elk
rotund isle
yeah but that's not particular to logistic regression, that's in linear regressi...
safe elk
rotund isle
yeah but that's not particular to logistic regression, that's in linear regressi...
If distribution is gaussian use linear regression if binomial use logistic regression...using logistic regression where the distribution doesnt match will hurt model accuracy
hybrid mica
how do you get the coefficients and intercept for multiple linear regression?
is jupyter notebook recommended for data science / machine learning?
safe elk
hybrid mica
how do you get the coefficients and intercept for multiple linear regression?
is...
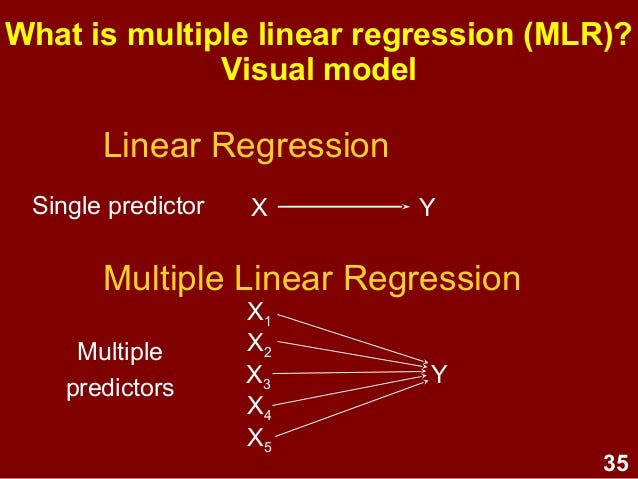
Medium
In my last article https://medium.com/@subarna.lamsal1/linear-regression-normally-vs-with-seaborn-fff23c8f58f8 , I gave a brief…
Jupyter notebook good for EDA and small scale...if you are going to deploy your model to prod avoid it
 odd meteor
Stochastic Gradient Descent updates the weight n-times.
n = sample size /number of observation.
So if your data has 5000 rows, the sample size = 5000. SGD updates the weight per each sample ; i.e in our case here 5000 times. So it updates your weight per each number of sample observation in your data.
The main difference between Gradient Descent & SGD is just how the algorithm updates the weight.
Gradient Descent takes in the data and update weight just once. (This usually don't escape getting stuck in the local minima) so using SGD helps us to avoid getting stuck in local minima
There's also Mini-Batch Stochastic Gradient Descent.
They are all variants of Gradient Descent. The major difference to me is just how each algorithm updates the weight.
odd meteor
safe elk
Jupyter notebook good for EDA and small scale...if you are going to deploy your ...
I usually use JNB for modelling part, then switch to VSCode for deployment.
safe elk
odd meteor
I usually use JNB for modelling part, then switch to VSCode for deployment.
Makes sense...
odd meteor
hybrid mica
how do you get the coefficients and intercept for multiple linear regression?
is...
By calling model.coef_ for weights (slope in Statistics) and
model.intercept for bias (in ML lingo) 😀
 small orbit
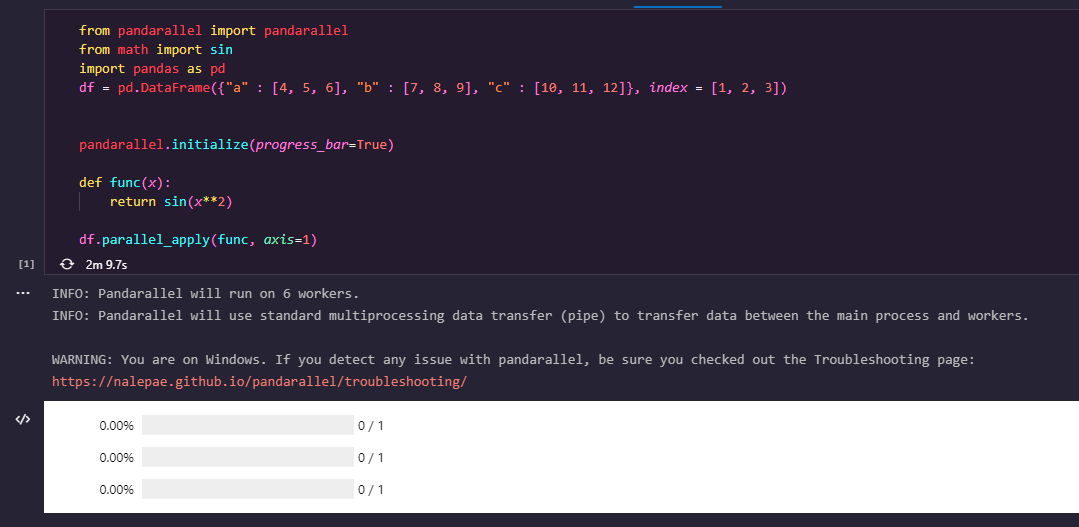
How do i get pandarallel to work? it just runs for hours without any error messages, the progress bars shows 0.00%. code: https://pastebin.com/WTHKDDSp
Pastebin
Pastebin.com is the number one paste tool since 2002. Pastebin is a website where you can store text online for a set period of time.
 drowsy hemlock
how does this code give me a negative values of y?
x=np.arange(0,100)
y=x**5
plt.scatter(x,y)
plt.show()
 serene scaffold
@drowsy hemlock thanks for giving a reproducible example! looks like the problem is that your integers are overflowing. if you do x = np.arange(0, 100).astype(float), the problem should go away.
the orange line is when I converted everything from integers to floats

!e
import numpy as np
result = np.arange(0, 100, 10) ** 5
print(result)
@serene scaffold :white_check_mark: Your eval job has completed with return code 0.
001 | [         0     100000    3200000   24300000  102400000  312500000
002 |   777600000 1680700000 3276800000 5904900000]
hmmmmmm, bad example, I guess
drowsy hemlock
serene scaffold
<@!765475236702453760> thanks for giving a reproducible example! looks like the ...
ok thanks a lot.....
so will .astype fix overflow error while handling large datasets
serene scaffold
the problem is the size of the numbers, not the size of the dataset
drowsy hemlock
i ment large numbers in the datasets😅
 orchid heart
Hi everybody i have quick question maybe someone has an idea. I am trying to learn what kind of model name branding different company are using. quick example
apple: iphone 13s, iphone 8s, iphone 12 pro…
Samsung: galaxy S21, galaxy A52, galaxy note…
so if a new modelname (G note 54)occurs without its brand my model should guess the most probable brand.
i know its quite easy here but this is just for explanation.
My main issue is idk how to transform my modelnames into a vector for the ml algorithm to use.
All i find are libraries for real text document classification but in my case its not really a whole text but only different modelnames i want to tranform and be able to transfer new occuring modelnames in the same way.
i am trying ascii encoding right now but idk if this is the smartest way
 lavish rune
Make a python progarm that continuasly asks the user for a postive interger greater than 0. For every number enetered , your program must display pass if the sum of the of the squars of even digits is less then the sum of the sqaures of odd digits otherwise it must display fail. No input checking is required
I’m stuck on this question
Can anyone help me
serene scaffold
@lavish rune this isn't a data science question, so try a help channel. see #❓|how-to-get-help
serene scaffold
orchid heart
Hi everybody i have quick question maybe someone has an idea. I am trying to lea...
you can't really do this in a generalized way. knowing that something is the "iPhone 12" only tells you the brand and the order it was put on the market. those are two features. the names of Samsung phones tell you different things (there's the S series and the A series, whereas iPhone just has one series)
mild dirge
odd meteor
Stochastic Gradient Descent updates the weight n-times.
n = sample size /numbe...
Thanks for the reply. But my problem was more that people just consider mini-batch GD as SGD
Some people just use them as synonyms which is confusing :/
serene scaffold
odd meteor
Stochastic Gradient Descent updates the weight n-times.
n = sample size /numbe...
.bm
desert oar
@odd meteor @mild dirge the point i was making is that they are synonymous because they have the same properties. it's just scaling the batch size from 1 to "N".
yes, smaller batches => more weight updates and smaller (but possibly more erratic) update steps
batch size is a parameter to the optimization algorithm, just like learning rate is
orchid heart
serene scaffold
you can't really do this in a generalized way. knowing that something is the "iP...
oh okay but wont the model learn model names including iphone is more likely apple and a modelname including galaxy or note its a samsung?
serene scaffold
orchid heart
oh okay but wont the model learn model names including iphone is more likely app...
well, iPhone is always apple.
these aren't things you need ML for.
desert oar
orchid heart
oh okay but wont the model learn model names including iphone is more likely app...
you can do that, yes. you can tokenize the model name into words and even just look at a frequency table. most model names will uniquely identify a company.
orchid heart
serene scaffold
well, iPhone is *always* apple.
like i said its just an simplified example but thats what i am generally trying to do
desert oar
the best you can do for forecasting is just incrementing the number at the end 😆
 compact rose
Hello guys, i have a question. So, i was working in a dataset and it something has caught our attention. We are working in a dataset from spotify where we want to predict the music popularity. We are know on the phase of data preparation and we saw the some songs are duplicated. However, we can't call the fuction of duplicated() because there are songs with the same name but not with the same values(In other words, they just have the same name, but songwriter are another or is it a cover). In the screenshot that i post, you can see six rows, where four of them are repeated and the others aren't. The only thing that changes are the values of the song popularity, however they are the same song because they all the same value in the other features. We want to keep the highest values or a mean of it and remove the rows that are duplicating. What line of code can i do?
 serene scaffold
desert oar
you can do that, yes. you can tokenize the model name into words and even just l...
serene scaffold
desert oar
you can do that, yes. you can tokenize the model name into words and even just l...
it's not clear if they're actually doing NLP or if they're just trying to encode the product names as features for some other purpose
desert oar
compact rose
Hello guys, i have a question. So, i was working in a dataset and it something h...
copying my response from the help channel:
a song is not uniquely identified its name. you can have 2 songs of the same name by 2 different artists
they might be 2 different versions of the same song, or they might be 2 completely different songs that have the same title. you can have 2 different versions of the same song by the same artist that are substantially different. you can have 2 cover versions of the same song that are more or less interchangeable from a listener's perspective.
so my first question is: why do you even want to deduplicate at all? what does "unique" actually mean in your project?
and copying your reply:
Oh i didn't notice that u had channel for data science. sorry. However, if you notice the columns, there are various columns that make us understand if there was any change. Some of them are completely different songs and we can check it by looking in the values ( I just noticed that my printscreen didn't catch any of it) but other just change a value in song popularity and we can understand that is duplicated! But i apreciate your answer, because it make me thinking of it !
orchid heart
serene scaffold
it's not clear if they're actually doing NLP or if they're just trying to encode...
maybe its actually encoding as features because i want to find the neareast neighbour of an unknown modelname afterwards to guess the brand then
desert oar
so you intend to use the genre scores to detect duplicates, that is a great idea @compact rose
you can't really solve this with one line of code though
you can use scipy.spatial.distance.pdist to compute the pairwise differences of all rows in an array, and then set a threshold on distance
or you can use hdbscan or hierarchical clustering
you could even manually label pairs and train a model, but that seems like overkill in this case
you can make this a lot faster if you apply the distance operation within groups of song titles, because songs with different titles probably aren't duplicates
of course you might need to do some text processing on the song titles first
compact rose
desert oar
_copying my response from the help channel:_
a song is not uniquely identified ...
Yeah, but notice that it would change the values of columns. If one was live, the value in liveness columns would increase. If was from another person, it would change at least a decimal value in speechiness. I just want to perfect it and learn how we can change it 😄
desert oar
btw where did you get this dataset? seems interesting to work with
desert oar
compact rose
Yeah, but notice that it would change the values of columns. If one was live, th...
what do you mean "from another person"? what is each row in this dataset exactly?
compact rose
desert oar
what do you mean "from another person"? what is each row in this dataset exactly...
Check the rows in 4,5,6 and 7. In that rows, you can check that all values are the same except in song popularity. If it was from another person, the speechiness would change because it measure the speech-like. And we also can look for the column with the name song duration, where it represents the time of each song. This is an assumption, but i think most of the songs that have a cover or a remake or something similar, have at least one more second or a milisecond
compact rose
desert oar
btw where did you get this dataset? seems interesting to work with
It is a class project. I am learning python and this is for a predictive model. However, if you look for predictive dataset spotify, you can check it ^^ I can also pass you the dataset if you wish
 gleaming osprey
I found a maths function that might be useful as a error function, should I show?
maybe I didnt find it, but its cool
odd meteor
desert oar
<@!519319496868233227> <@!309775277720993792> the point i was making is that the...
Yes that's true.
desert oar
compact rose
Check the rows in 4,5,6 and 7. In that rows, you can check that all values are t...
so each row is one user's judgement of a song? as in, it's their opinion of how the song sounds?
or each row is one song on spotify?
desert oar
compact rose
Check the rows in 4,5,6 and 7. In that rows, you can check that all values are t...
yes, song duration is also a good indicator of similarity. maybe good enough that you don't need to mess with the genre stuff
i see a lot of spotify datasets compiled from their web api
compact rose
It would be a spotify song, at least that is the information that we had. However, one of thing that our teacher make us understand is that dataset have always many error and most of the projects that we are going to work, we are going to use 75% of our resources in data preparation. So saying that, we think it maybe some values that professor put in purpose so we can learn how to solve it ! 😄
compact rose
desert oar
i see a lot of spotify datasets compiled from their web api
I can't say it is , however the columns are very similar to it. We have done some research and we could find there what would be the acceptable values for each column
compact rose
desert oar
yes, song duration is also a good indicator of similarity. maybe good enough tha...
I think it is the best. At least that is how we are going to support the purpose of deleting some rows in these dataset
desert oar
compact rose
It would be a spotify song, at least that is the information that we had. Howeve...
75% of our resources in data preparation
yep, that is to be expected
sounds like you are going in the right direction then
compact rose
Thank you a lot! It means much to hear that! Sometimes, i find myself looking hours in how to do one thing that is so simple, however I think it is the learning curve talking to me ^^ But i have a question, would you guys recommend learning from Datacamp? I have been spending some time there since our professor apply us as 'premium' members and I have been using my free time in learning there. I am know learning more things to do in python, but i also want to learn SQL and Power BI. Do any of you guys have any reference from it ^^
hybrid mica
jupyter notebook vs jupyter lab?
 serene scaffold
 vestal ocean
how can i reverse the effect of this?
vestal ocean
how can i reverse the effect of this?
I guess you can replace the Nones with ints
 tough frigate
why not just use .head()?
By the way, I wanna have a solid understanding of data preparation, got any resources? i'd appreciate that.
 arctic crown
please help i want to get started with ml but i dont knwo where to start
serene scaffold
arctic crown
please help i want to get started with ml but i dont knwo where to start
did you learn about k nearest neighbors yet?
arctic crown
not yet i want to start ffrom the begining
serene scaffold
that pretty much is the beginning. it's one of the simplest kinds of classifiers.
tough frigate
serene scaffold
that pretty much is the beginning. it's one of the simplest kinds of classifiers...
let him first understand what is ML and followed by Supervised and Unsupervised learning you know
arctic crown
tough frigate
let him first understand what is ML and followed by Supervised and Unsupervised ...
yea
where can i do that?
i havent fond a good tutorial yet
vestal ocean
if i have a dataframe like this, how could i plot a line graph with 10 different lines, with date on the x axis and streams on the y?

the 10 different lines for 10 different artists
vestal ocean
tough frigate
and set hue="Artist"
could u possibly provide an example?
not familar with seaborn
 jaunty belfry
 tough frigate
vestal ocean
could u possibly provide an example?
tough frigate
vestal ocean
could u possibly provide an example?

 dry lichen
hai
jaunty belfry
can someone tell what is .values[0] here? I checked the documentation but their they use only .values not .values[] with any index
vestal ocean
tough frigate
thank you, i take it flights is the name of the df?
tough frigate
yep
dry lichen
is there any projects or teams where I could join to learn some stuff about this topic?
tough frigate
jaunty belfry
can someone tell what is .values[0] here? I checked the documentation but their ...
its fetching the first value from the array that you get after .values
jaunty belfry
tough frigate
its fetching the first value from the array that you get after .values
there is only one value being fetched by the code
without values[0]
@tough frigate
tough frigate
lol your code is weird, it says, if your income's first value is less than 35000 than return the gender's first value or else return male
jaunty belfry
no @tough frigate ...its just picking a random row from dataset
then checking if this random's income is less than 35000
tough frigate
what are you trying to do there?
jaunty belfry
may be you misread
its just a question in my course
and this values[0] thing confused me
its a quiz
basically
tough frigate
.values results in an array of income, and if you do .values[0] that means it fetches the first value from your income column
jaunty belfry
@tough frigate ...thanks
it was just unrequired in this code
thats what was confusing
vestal ocean
@tough frigate im trying to rotate the x-axis labels but i get this output
 tough frigate
lol i dont remember every stuff, just go through the documentation
vestal ocean
tough frigate
lol i dont remember every stuff, just go through the documentation
yep found it, is it possible to show specific ticks like for each month and not the individual days without adding them together for the month?
cos i was a little unsure how to go about adding all the values for each month
for a df like this, how could i add all the streams for each month for each artist?

 inland mantle
what is the difference between a framework and a libary. For example Open CV and tenserflow
misty flint
from what i understand, a framework is more "opinionated" than a library - that is my loose working definition
 robust jungle
does anyone have any simple projects to get comfortable with the basics of tensorflow?
just finished a few of google's tutorials on it
 bright garden
robust jungle
does anyone have any simple projects to get comfortable with the basics of tenso...
bright garden
robust jungle
does anyone have any simple projects to get comfortable with the basics of tenso...
MNIST is a very popular dataset to get into neural networks

TensorFlow
Though I'm not sure if you're comfortable with the level of programming they're doing for this
But definitely a classic to try out whenever you can
robust jungle
bright garden
MNIST is a very popular dataset to get into neural networks
wonderful
thanks
 glad flume
 pseudo wren
  (tuple1, tuple2) = x
  dictionary = json.loads(tuple2)
return dictionary["race_ethnicity"]```helper_function_1(tooples)
so i am trying to unpack my tuple in order to access the race and ethnicity section of the dictionary housed inside of it
however when i call the helper function i wrote, it says too many values to unpack
how should i go about fixing this
serene scaffold
inland mantle
what is the difference between a framework and a libary. For example Open CV and...
libraries have functions and classes that you can import and use however you'd like. frameworks tend to have a bunch of parts that partially implement some solution, and you supply a few key parts, and it uses them to achieve the rest.
it's also sort of a matter of perspective. the two neural network libraries are library-like when you're just making tensors and using them, but start to behave more like frameworks if you use the Sequential class to make a model, since that involves saying what layers you want, and it manages passing data through it.
CC @misty flint ^
tough frigate
pseudo wren
how should i go about fixing this
Give more variables when you unpack, first learn what parameters does that function have and what output does it throw
misty flint
serene scaffold
libraries have functions and classes that you can import and use however you'd l...
start to behave more like frameworks if you use the Sequential class to make a model, since that involves saying what layers you want, and it manages passing data through it.
def 100% agree with this perspective part; i can see this making sense for both pieces
pseudo wren
tough frigate
Give more variables when you unpack, first learn what parameters does that funct...
i should explain a bit better
so right now i am experimenting with my first sqlite3 server
to put it in the server i had to pack it into a tuple
misty flint
stelercus, if you had a substack, i would subscribe and read it tbh @serene scaffold
pseudo wren
i am now trying to unpack the tuple to manipulate the data inside
i created the function to unpack the tuple to access the data
i thought if i tried entering my toople variable as a parameter, it would work
serene scaffold
misty flint
stelercus, if you had a substack, i would subscribe and read it tbh <@!253696366...
what is that
 errant fern
can i ask python pipeline related questions here ?
tough frigate
pseudo wren
i thought if i tried entering my toople variable as a parameter, it would work
I don't think that's how it works, if your tuple has 3 elements, so when unpacking you either create three different variables or use asterisk to get thr remaining elements inside a single variable making it a tuple
errant fern
errant fern
can i ask python pipeline related questions here ?
I'm getting this : Attempting to weight transformer "elo_offensive_1", but it is not present in transformer_list.
serene scaffold
errant fern
I'm getting this : Attempting to weight transformer "elo_offensive_1", but it is...
sounds like you're doing a deep learning thing. try showing the whole error message from Traceback and the relevant code in a markdown block
!traceback
pseudo wren
tough frigate
I don't think that's how it works, if your tuple has 3 elements, so when unpacki...
i understand the number of arguments has to be equal to the number of elements
however this would be an inconvenient way to solve this
as this is an entire data set with thousands of elements
errant fern
serene scaffold
sounds like you're doing a deep learning thing. try showing the whole error mess...
can i share the entire colab notebook instead ? cuz i don't know what are relevant in this case
pseudo wren
so what i'm looking for is a way to pass an argument that will unpack the entire thing
serene scaffold
errant fern
can i share the entire colab notebook instead ? cuz i don't know what are releva...
you can put the link to it here, but people are more likely to help when the question is distilled.
tough frigate
pseudo wren
as this is an entire data set with thousands of elements
Try using * after or before your variable, coz maybe this should work, there is a way to unpack all thr element in a single variable
errant fern
serene scaffold
you can put the link to it here, but people are more likely to help when the que...
oooh i see
misty flint
serene scaffold
what is that
what is a substack? heres an example https://technically.substack.com/

Technically explains software and hardware in a simple and engaging way so you can impress your boss. Click to read Technically, by Justin, a Substack publication with tens of thousands of readers.
and they usually are sent to your emails too
so you get articles in your inbox
this 'Technically' guy is hilarious tbh
 errant fern
serene scaffold
sounds like you're doing a deep learning thing. try showing the whole error mess...
errant fern
serene scaffold
sounds like you're doing a deep learning thing. try showing the whole error mess...
ValueError Traceback (most recent call last)
<ipython-input-188-caa54ef5dede> in <module>()
1 #fitting
----> 2 pipeline.fit(df_train_test, y_oh)
6 frames
/usr/local/lib/python3.7/dist-packages/sklearn/pipeline.py in _validate_transformer_weights(self)
1059 if name not in transformer_names:
1060 raise ValueError(
-> 1061 f'Attempting to weight transformer "{name}", '
1062 "but it is not present in transformer_list."
1063 )
ValueError: Attempting to weight transformer "elo_offensive_1", but it is not present in transformer_list.
pipeline.fit(df_train_test, y_oh) : the line of code with problem
serene scaffold
misty flint
what is a substack? heres an example https://technically.substack.com/
how is it different from a blog
errant fern
errant fern
pipeline.fit(df_train_test, y_oh) : the line of code with problem
pipeline = Pipeline([
# Feature Union to concatenate features
('union', FeatureUnion(
    transformer_list=[

        # Pipeline elo scores team 1
        ('elo_scores_1', Pipeline([
            ('elo_sc_1', ItemSelector(key=['elo_offensive_1','elo_defensive_1', 'elo_home_offensive_1',
                                          'elo_home_defensive_1'])),
            ('MinMaxScaler', MinMaxScaler()),
        ])),

        # Pipeline elo scores team 2
        ('elo_scores_2', Pipeline([
            ('elo_sc_2', ItemSelector(key=['elo_offensive_2','elo_defensive_2', 'elo_away_offensive_2',
                                          'elo_away_defensive_2'])),
            ('MinMaxScaler', MinMaxScaler()),
        ])),

    ],

    # 1.0 for all
    transformer_weights={
        'elo_offensive_1': 1.0,
        'elo_defensive_1': 1.0,
        'elo_home_offensive_1' : 1.0,
        'elo_home_defensive_1' : 1.0,
        'elo_offensive_2': 1.0,
        'elo_defensive_2': 1.0,
        'elo_away_offensive_2' : 1.0,
        'elo_away_defensive_2' : 1.0,
    },
)),

#Classifieur
('Classifieur', LinearSVC(random_state = 1, verbose=1)),
])
#LinearSVC(random_state = 1, verbose=1)
#RandomForestClassifier(n_estimators = 100, max_depth = 4, min_samples_split = 500)
vestal ocean
Does anyone know how i could add the streams for each day for all the months for each artist?

My df looks like this
 lavish swift
anyone know of any good resources for how to work with the apply() method on a dataframe?
hybrid mica
# Evaluating the Model Performance
from sklearn.metrics import r2_score
r2_score(y_test, y_pred)
in the sklearn library, with these lines of code, is what calculated the r-squared value or the adjusted r-squared value?
 agile cobalt
lavish swift
anyone know of any good resources for how to work with the `apply()` method on a...
agile cobalt
lavish swift
anyone know of any good resources for how to work with the `apply()` method on a...
step 1: don't
jokes aside, look up pandas dataframe apply and check the documentation. That said, you should avoid using it as much as possible - pandas supports many operations in a way that will be much faster than whatever you want to use apply() for
!d sklearn.metrics.r2_score
arctic wedgeBOT
sklearn.metrics.r2_score(y_true, y_pred, *, sample_weight=None, multioutput='uniform_average')```
\(R^2\) (coefficient of determination) regression score function.

Best possible score is 1.0 and it can be negative (because the model can be arbitrarily worse). A constant model that always predicts the expected value of y, disregarding the input features, would get a \(R^2\) score of 0.0.

Read more in the [User Guide](https://scikit-learn.org/stable/modules/model_evaluation.html#r2-score).Note that r2_score calculates unadjusted R² without correcting for bias in sample variance of y.
lavish swift
agile cobalt
step 1: don't
jokes aside, look up `pandas dataframe apply` and check the docume...
Thanks! too funny...I'm often the person telling people not to use apply() 😂 so I definitely get it. In my case though, since I'm working with parsing and evaluating strings series/columns, it seems like the most appropriate route.
agile cobalt
depending on what it's for, you might be able to just use string accessor methods, maybe with a bit of regex
lavish swift
sadly, that's not going to work in this case.
but you're right about the pandas docs...which I usually find fairly helpful! but for apply, they really aren't.
I'm definitely looking to dig more into complicated apply
 serene river
does anyone have a good vtk tutorial ?
 mild dirge
Looking at some lecture slides concerning deep Q learning/network (DQN), and the slide says the following:

I don't fully understand what the difference is between expected maximum value, and maximum expected value
Found some explanation online, but that did not really clarify it
This explanation

Could someone maybe give an example or a more intuitive explanation*?
misty flint

ah i see
hmm idk if i can explain it over mobile tbh
i might sketch something if i was on desktop
maybe someone else can help
mild dirge
Yeah dw, I'm going to sleep, if someone replies i'll be able to see it tomorow, but would appreciate it, thanks in advance 🙂
 stuck schooner
Hey anyone can give me a quick help ? I am using StandardScaler() on a dataframe, it works well but it return a ndarray. I lose index but also also other information
I found this post : https://stackoverflow.com/questions/35723472/how-to-use-sklearn-fit-transform-with-pandas-and-return-dataframe-instead-of-num

Stack Overflow
I want to apply scaling (using StandardScaler() from sklearn.preprocessing) to a pandas dataframe. The following code returns a numpy array, so I lose all the column names and indeces. This is not ...
Which mentioned sklearn_pandas library
agile cobalt
You shouldn't really care about losing that metadata
if you need of it back later, pass it when creating another dataframe
stuck schooner
I have a df containing some columns that are continious and named attr_cont = ['col1', 'col2', etc..]
agile cobalt
but usually you should not do any further manipulation with it as a dataframe after scaling
stuck schooner
But I think the DataFrameMapper() expect a pd.Index(['col1', 'col2', etc..]) object
and return those weird columns name
 agile cobalt
why do you care about losing the index etc?
stuck schooner
I am seeing no documentation on how to create such Index([]) object from a list
Because the index are linked to categorical attribute contained in dataset
And that it have already been through train_test_split()
agile cobalt
if the index itself is a feature, use df.reset_index() to throw it into a column
stuck schooner
Index isn't a feature
agile cobalt
if it is "linked" to another feature, you probably should not keep it anyway
stuck schooner
but df= df[attribute_continuous] + df[attribute_categorical]
and i want to scale only the continuous attribute
agile cobalt
use a ColumnTransformer instead of separating it yourself
scikit-learn
Examples using sklearn.compose.ColumnTransformer: Release Highlights for scikit-learn 1.0 Release Highlights for scikit-learn 1.0, Time-related feature engineering Time-related feature engineering,...
(maybe also look into Pipelines while you're at it, they allow for you to define the model - including pre-processing steps - as one single thing instead of applying multiple steps yourself)
stuck schooner
Thanks, teacher just told us : "use standard scaler on continuous attribute on a new dataframe, then use the two dataframe to train again model...."
I don't think they even realize the sort of problem this cause..
on the data itself ..
Thanks I will look into it
urban prism
Can someone help me with this?
https://stackoverflow.com/questions/71704956/running-evaluation-on-tensorflow-object-detection-api-memory-allocation-issue
Stack Overflow
I'm using Tensorflow Object Detection API and I am trying to evaluate my efficientdet_d2 model from Tensorflow Model Zoo. My evaluation TFRecords files have 8880 samples in total and when I run:
!p...
desert oar
stuck schooner
Which mentioned sklearn_pandas library
You don't need this package now, look up ColumnTransformer
stuck schooner
desert oar
You don't need this package now, look up ColumnTransformer
It returns np array and don't transform df itself. I am digging deeper into it rn
There is this solution but it imply to go through a Pipeline with the last step being :
("pandarizer",FunctionTransformer(lambda x: pd.DataFrame(x, columns = ["x", "y"]))

Data Science Stack Exchange
I am having issues with scikit-learn converting dataframes to numpy arrays.
For instance, the following code
from sklearn.impute import SimpleImputer
import pandas as pd
df = pd.DataFrame(dict(...
 iron basalt
mild dirge
Could someone maybe give an example or a more intuitive explanation*?
iron basalt
mild dirge
Could someone maybe give an example or a more intuitive explanation*?
Expected value of a die is 3.5, roll that die a bunch of times and take the max, that value is probably above the expected value (overestimated).
So in Q-learning, the values are pretty bad at first and so it will probably overestimate badly. So it will explore a bunch of overestimated state space making learning slow at first, and even after a long time, it's still generally an overestimation (not as bad as it is at first).
Expected-max, and max-expected, the order matters (you can try with a die).
(Which will probably be larger?)
hybrid mica
classifier = LogisticRegression(random_state=0)
changing the random state value on this line does not seem to do anything to my results - would anyone happen to know why?
tough frigate
Random state says no matter how many times you run your model, it will take the same observations to get you the same results. So removing that parameter will result in some change.
Geez, these bank datasets are awful, alot to clean there
 toxic marlin
https://imgur.com/a/3W9Hmfk guys what could i say about this image, its a web servers data in splunk
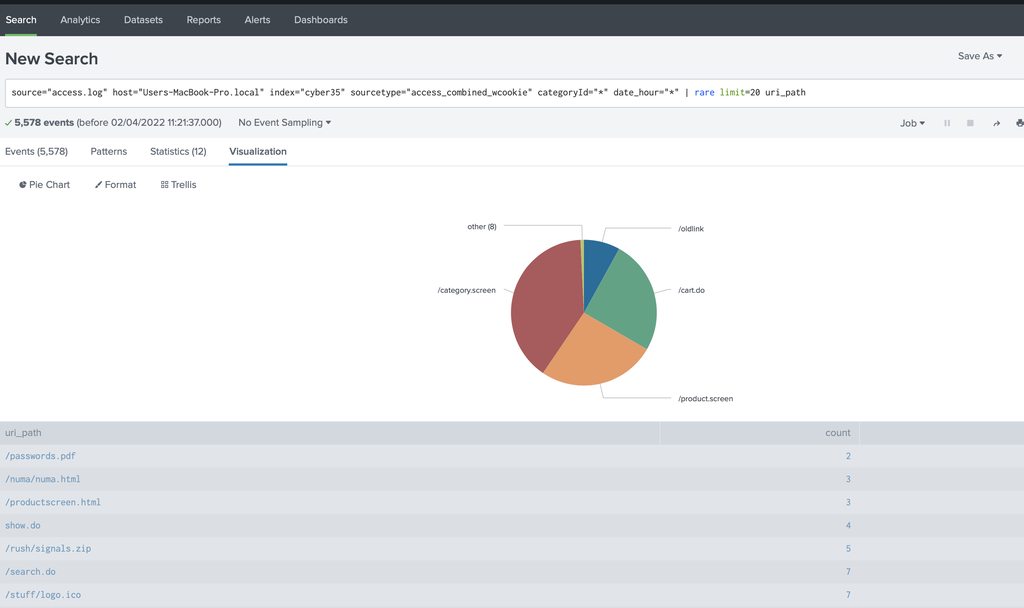
with what appears to be their assets/pages
and i did the least common ones
could i argue these are the ones that may have the least bugs/or most bugs because nobody visits them to try and exploit them?
 exotic thicket
Hello, guys is there a problem solved on concepts Perspective projection, weak projection, orthographic projection.
jaunty belfry
@tough frigate
import numpy as np

def add_to_neg_elements(mat, num):
    mat[mat<0] = mat[(mat<0)+num]
    return mat
Can you tell whats wrong with this code? Im getting an error : IndexError: index 101 is out of bounds for axis 0 with size 4
 tacit basin
jaunty belfry
```py
import numpy as np
def add_to_neg_elements(mat, num):
mat[mat<0] = ma...
tacit basin
jaunty belfry
```py
import numpy as np
def add_to_neg_elements(mat, num):
mat[mat<0] = ma...
I think you want
mat[mat<0] = mat[mat<0] + num
there are plenty of random states to set in python to get exact result, depends on lib as well
 prisma mist
how to pop rows from a pd df? first 5 rows.. then next 5 rows and so on
prisma mist
from what i can tell there is no easy way to pop rows from a df?
bold timber
I want to run the model Neural Network, but the kernel is always dead like this. What happened? How to fix this problem?
 bright garden
bold timber
I want to run the model Neural Network, but the kernel is always dead like this...
bright garden
bold timber
I want to run the model Neural Network, but the kernel is always dead like this...
Try to find a log, it might help you understand why the kernel died. A common cause is not enough RAM to support the loaded data
prisma mist
❓ how to pop rows off a df ❓
bold timber
bright garden
Try to find a log, it might help you understand why the kernel died. A common ca...
can you guide me to handle this? my ram is 16gb and it still doesn't work
bright garden
prisma mist
❓ how to pop rows off a df ❓
 bright garden
bold timber
can you guide me to handle this? my ram is 16gb and it still doesn't work
bright garden
bold timber
can you guide me to handle this? my ram is 16gb and it still doesn't work
Try to see if you can access the Kernel logs from here
prisma mist
bright garden
that's a column pop
bright garden
prisma mist
that's a column pop
Ohh yes, you're right
hmm, there doesn't seem to be an inbuilt function to do this
I found this df.T.pop(index)
and then you can transpose back to the original dataframe
mild dirge
bold timber
can you guide me to handle this? my ram is 16gb and it still doesn't work
First try to just lower the data you load in (lower batch size) see if that works
Try like 10 or something if it's images
At least then you can pretty much confirm it's a memory issue
 modest shuttle
Hello,
Is Prophet better or NeuralProphet?
hybrid mica
what does this loss actually represent? (this is an artificial neural network for regression) is there a good thumb rule to determine how many hidden layers and how many neurons in each hidden layer in an artificial neural network?
 serene scaffold
hybrid mica
what does this loss actually represent? (this is an artificial neural network fo...
serene scaffold
hybrid mica
what does this loss actually represent? (this is an artificial neural network fo...
the loss is an aggregate measurement of how far off your model is from getting it right. it looks like your loss is the same after each epoch, so your model is no longer learning.
hybrid mica
the decrease in loss is incredibly slow from 30 to 100; should i just stop the epochs at 30?
serene scaffold
hybrid mica
the decrease in loss is incredibly slow from 30 to 100; should i just stop the e...
once the rate of change for the loss gets this slow, you might as well stop, yes.
I don't know that there is
hybrid mica
it says 'Adding the input layer and the first hidden layer' but there is just one line of code in that cell. Is this code incorrect? Could you please explain?
 bold timber
mild dirge
First try to just lower the data you load in (lower batch size) see if that work...
bold timber
mild dirge
First try to just lower the data you load in (lower batch size) see if that work...
Previously I use batch_size = 128, then I try to use 64 and still doesn't work. Why did it happen?
serene scaffold
hybrid mica
it says 'Adding the input layer and the first hidden layer' but there is just on...
ann is a Sequential network, which just means that for any data that goes into it, it's a straight pass through the sequence of layers. Then you have two dense layers that the data passes through. and then the output layer is the one with the answer, so to speak.
mild dirge
bold timber
Previously I use batch_size = 128, then I try to use 64 and still doesn't work. ...
Did you try a really low amount like 10 or 5?
hybrid mica
but where is the first input layer created in the lines of code? and where is the first hidden layer created? there is one line of code but two things are created?
serene scaffold
that might actually be a mistake in the code. I only see three layers created here.
hybrid mica
so only the input layer is being created here?
 serene scaffold
hybrid mica
so only the input layer is being created here?
serene scaffold
hybrid mica
so only the input layer is being created here?
as far as I can tell, that's the first/input layer, and is thus not a hidden layer. where did you get this notebook?
you can do len(ann.layers) to see how many layers it has. but make sure you've run each cell exactly once when you do that, or you'll get an incorrect answer.
hybrid mica
ok - they say that the input layer is automatically created depending on the number of features; ill check it with what you have advised to do
hybrid mica
serene scaffold
you can do `len(ann.layers)` to see how many layers it has. but make sure you've...
output of this is 3
serene scaffold
hybrid mica
output of this is 3
then I guess the notebook is wrong
vestal ocean
How could i create a legend and have it in this format for a seaborn plot?
 modest shuttle
Hello,
Is Prophet better or NeuralProphet?
bold timber
mild dirge
Did you try a really low amount like 10 or 5?
I recently try to use 10 for batch size, but doesn't work
mild dirge
Try updating your libraries maybe
 chrome junco
vestal ocean
How could i create a legend and have it in this format for a seaborn plot?
chrome junco
vestal ocean
How could i create a legend and have it in this format for a seaborn plot?
is this matplotlib?
vestal ocean
chrome junco
is this matplotlib?
Yep
vestal ocean
ive currently got my graphs set out like this for all 6 sub plots
 vestal ocean
chrome junco
```
plt.legend(loc='upper left')
```
vestal ocean
chrome junco
```
plt.legend(loc='upper left')
```
i tried that but i wanted to have it on its own not in a graph
chrome junco
handles, labels = ax.get_legend_handles_labels()
fig.legend(handles, labels, loc='upper center')
Stack Overflow
I am plotting the same type of information, but for different countries, with multiple subplots with matplotlib. That is, I have 9 plots on a 3x3 grid, all with the same for lines (of course, diffe...
There is also a nice function get_legend_handles_labels() you can call on the last axis (if you iterate over them) that would collect everything you need from label= arguments:
you basically make them into one big axes and it pulls the legend from them all into one
@vestal ocean
vestal ocean
chrome junco
you basically make them into one big axes and it pulls the legend from them all ...
So would i need to change the code structure of mine?
chrome junco
yes,
you would need to make them into subplots
ax1
ax2
etc
I have a question for people that work with LSTM models
I am trying to predict asset prices from 60 days into the future
and it takes historical data and trains based off that data
but i have a problem with over fitting
ill show you
Epoch 1/500
237/237 [==============================] - 12s 52ms/step - loss: 3.8080e-04
Epoch 100/500
237/237 [==============================] - 11s 44ms/step - loss: 1.3932e-04
Epoch 200/500
237/237 [==============================] - 11s 45ms/step - loss: 1.1043e-04
Epoch 300/500
237/237 [==============================] - 11s 46ms/step - loss: 7.9581e-05
Epoch 400/500
237/237 [==============================] - 11s 47ms/step - loss: 6.8104e-05
Epoch 500/500
237/237 [==============================] - 11s 47ms/step - loss: 5.6542e-05
as you can see it goes from 1-4 untill like 275 then it skyrockets and hovers around 9
vestal ocean
chrome junco
you would need to make them into subplots
any idea how i could move it to take the place of the empty plot?
 chrome junco
idk why my model is over fitting
chrome junco
vestal ocean
any idea how i could move it to take the place of the empty plot?
to replace the first subplot with the legend?
 chrome junco
the reason its there is because ther fig.legend
its applying to the full figure
you would need to apply it only to the subplot you want it in
ill look online for some examples to make myself more clear
Stack Overflow
I would like to put legends inside each one of the subplots below.
I've tried with plt.legend but it didn't work.
Any suggestions?
Thanks in advance :-)
f, (ax1, ax2, ax3) = plt.subplots(3, sha...
this is for multiple legends so one for each subplot
so far thats all i can find
but I think that if you apply the full legend to a single subplot of your choice it should work
my LSTM stock prediction model
If anyone has the time to tell me why its over fit please dont hesitate to dm me
 warped dagger
yo can someone help me find a dataset which has different graphs like straight line, parabola, hyperbola, etc for a ML program (couldn't find anything on kaggle 😭)
arctic wedgeBOT
Hey @thin palm!
It looks like you tried to attach file type(s) that we do not allow (.pdf). We currently allow the following file types: .gif, .jpg, .jpeg, .mov, .mp4, .mpg, .png, .mp3, .wav, .ogg, .webm, .webp, .flac, .m4a, .csv, .json.
Feel free to ask in #community-meta if you think this is a mistake.
vestal ocean
If i have a graph like this that is currently showing the streams for the top 10 global artists, could anyone recommend a way of having the top 10 european artists on the same plot?

Preferably not as the same line format and may reduce from top 10 to top 5 so its cleaner
thin palm
vestal ocean
If i have a graph like this that is currently showing the streams for the top 10...
instead of a line plot you could do dash plots
so European artists will be noticed
vestal ocean
thin palm
instead of a line plot you could do dash plots
Do u mean do a combination of both?
Like line for global and dash for european?
vestal ocean
thin palm
instead of a line plot you could do dash plots
like this?

 cunning condor
Hi all, I was wondering what the best way (resources) to learn AI using Python; is there any books, videos, courses or modules that you guys can recommend me with?
I am currently studying Computer Science A-Level (College-equivalent).
In my final year and will be heading off to Uni this year soon.
cunning condor
Awesome. I'll start with those then, thank you so much 🙂
thin palm
vestal ocean
like this?
This is also an option, also you could do a scatter plot and define the hue by counrtries
cunning condor
Hi, I was trying to install Face_Recognition using PIP, but an error occur. I found out the issue, but was wondering if it is fine to install again; will it override old file or do I have to do something so that they don't collide?
Nvm, it just says satisfied for files already installed. But a new error has occured. I will be using one of the help channels :_
🙂
desert oar
cunning condor
Hi, I was trying to install Face_Recognition using PIP, but an error occur. I fo...
yes in general it will uninstall before installing, eg if you upgrade versions
 vagrant marsh
Hi guys, i have a question, do you know how many items at most the apriori algorithm supports in python?
serene scaffold
vagrant marsh
Hi guys, i have a question, do you know how many items at most the apriori algor...
I would think this depends on the memory of your computer rather than a set limit in the code.
misty flint
really interesting read if youre into RecSys and Personalization https://eugeneyan.com/writing/patterns-for-personalization/

eugeneyan.com
A whirlwind tour of bandits, embedding+MLP, sequences, graph, and user embeddings.
the tl;dr


desert oar
it's nice to have a tldr with actual use cases for various things
misty flint
desert oar
it's nice to have a tldr with actual use cases for various things
right? i need everything like this
 strange zealot
i am working on a time series problem to predict sales could someone point me to a resource that helps me break down the problem ?
 worldly dawn
strange zealot
i am working on a time series problem to predict sales could someone point me to...
worldly dawn
strange zealot
i am working on a time series problem to predict sales could someone point me to...
 ashen arch
Hey anyone got some time?
I've got some query about Reinforcement Learning that I want to ask
 wise pelican
Hoping anyone with knowledge of generating animated graphs with matplotlib can help me figure this out
My program takes in a CSV with one column for timestamps, and another for values recorded at those timestamps
I currently animate it in a way to show 60 timestamps of data, and it scrolls from left to right to show the next timestamp and recorded piece of data
Problem is that the timestamps are variable, and my current function to graph the data points in an animated way doesn't work for that
def init_line():
line.set_data([], [])
return (line,)
def animate_line(i):
line.set_data(x.array[:i], y.array[:i])
ax.set_xlim(x.array[i] - x.array[60], x.array[i] + x.array[60])
return (line,)
anim = animation.FuncAnimation(
my_fig,
animate_line,
init_func=init_line,
frames=length,
interval=float(100/6),
blit=True,
save_count=50,
)```
So what happens is that 1 data point is plotted per video frame (at 60fps that's 0.16667 seconds), which is not accurate to how far apart the data points are (which range from 0.08s to 0.2s)
How would I go about making it so my data points are put into the video at the same point that the timestamp is? steady basalt
What cooks distance is classed as an extreme outlier
4/n is just non extreme right?
 tidal bough
wise pelican
Hoping anyone with knowledge of generating animated graphs with matplotlib can h...
tidal bough
wise pelican
Hoping anyone with knowledge of generating animated graphs with matplotlib can h...
You can track the time elapsed in the update function (adding dt = 100/6 to the time each frame), and only move the window when the time reaches the next timestamp.
so something like
dt = 100/6 # the interval
t = 0
shown = 0
def animate_line(i):
    global t, shown
    t += dt
    if shown < len(x.array) and t >= x.array[shown]: # time for next point!
        shown += 1
        # update the data:
        line.set_data(x.array[:shown], y.array[:shown])
        ax.set_xlim(x.array[i] - x.array[60], x.array[i] + x.array[60])
    return (line,)
 abstract sinew
Hiya, I'm training a cnn on the MNIST dataset. I'm doing k-fold cross validation right now, and i've noticed that the loss varies quite a bit between each fold. Is that something I should be worried about?
Score per fold
> Fold 1 - Loss: 0.1064145416021347 - Accuracy: 97.18992114067078%
> Fold 2 - Loss: 0.05745554342865944 - Accuracy: 98.25581312179565%
> Fold 3 - Loss: 0.0768362432718277 - Accuracy: 97.86821603775024%
> Fold 4 - Loss: 0.09651391208171844 - Accuracy: 97.86821603775024%
> Fold 5 - Loss: 0.07439924031496048 - Accuracy: 98.06201457977295%
> Fold 6 - Loss: 0.1636662632226944 - Accuracy: 96.60852551460266%
> Fold 7 - Loss: 0.10331138223409653 - Accuracy: 97.48061895370483%
> Fold 8 - Loss: 0.06524728238582611 - Accuracy: 98.44810962677002%
> Fold 9 - Loss: 0.07992955297231674 - Accuracy: 97.47817516326904%
> Fold 10 - Loss: 0.09972762316465378 - Accuracy: 97.47817516326904%
------------------------------------------------------------------------
Average scores for all folds:
> Accuracy: 97.67377853393555 (+- 0.5145294907723429)
> Loss: 0.09235015846788883
what will you be working on
hybrid mica
im learning how to implement deep learning
abstract sinew
notebook should be fine
hybrid mica
when would you use lab over notebook? and when would you use some ide like spyder?
abstract sinew
now that I look at it, looks like lab might be nice to display graphs in cause you can move them around in a separate window
I might have to look into that myself
yeah spyder might be nice too
tough frigate
hybrid mica
im learning how to implement deep learning
yeah, just started with that
mild dirge
abstract sinew
Hiya, I'm training a cnn on the MNIST dataset. I'm doing k-fold cross validation...
It doesn't seem to vary that much tbh
You already have a high accuracy, so you only guess a few cases wrong. And if you guess one more or one less wrong, the loss will be quite a bit different
abstract sinew
mild dirge
You already have a high accuracy, so you only guess a few cases wrong. And if yo...
haha yeah you might be right. The problem is that I'm trying to tweak some parameters, and it's difficult to tell if It's improving or not
mild dirge
how many test samples?
And as long as the average loss over the folds does not have a very high deviation, it should be a good (or at least stable) measure
mild dirge
Alright
you get a more accurate measure with higher number of folds*
there's even leave-one-out cross validation
abstract sinew
I'll look into that
Do you think I should revert back to a model where I haven't tuned the rest of the parameters yet? That should make training a bit faster too
And then once i've found what works best, combine all of the best parts and see where we're at
I think I might do thatr
 livid crane
from pycoingecko import CoinGeckoAPI
import matplotlib.pyplot as plt
from matplotlib.animation import FuncAnimation
from datetime import datetime
cg=CoinGeckoAPI()
# print(cg.get_price(ids="bitcoin",vs_currencies="eth"))


class crypto:
    def __init__(self,crypto,currency):
        self.x_cords=[]
        self.y_cords=[]
        self.crypto_curr=crypto
        self.vs_currency=currency
        plt.title(self.crypto_curr)

    def getName(self):
        return self.crypto_curr

    def insertion(self):
        self.x_cords.append(datetime.now())
        self.y_cords.append(cg.get_price(ids=self.crypto_curr,vs_currencies=self.vs_currency)[self.crypto_curr][self.vs_currency])

    def plotting(self):
        plt.plot(self.x_cords,self.y_cords)

    def start(self):
        plt.gcf().canvas.manager.set_window_title(f"Live Plotting {self.crypto_curr}")
        plt.tight_layout()
        FuncAnimation(plt.gcf(),self.plotting,interval=1000)
        plt.show()


Btc=crypto("bitcoin","usd")
Btc.insertion()
Btc.plotting()
Btc.start()
plot lines are not showing
can someone help me
mild dirge
abstract sinew
I think I might do thatr
Well the combinations is what give good results
you can keep other params constant and tune one, and then the next etc.
But this might not give the most satisfactory results
abstract sinew
My thinking is that it should make the difference more obvious when I'm tuning if it's not already a good model
mild dirge
Yeah, but you can't be sure it's the best parameter value
since the other values will be different
abstract sinew
It should make more mistakes between each model
What I've been doing is combining them once I've found a good parameter
mild dirge
There are more efficient grid search methods though I believe
so maybe look into that instead
abstract sinew
mild dirge
since the other values will be different
Yeah I'm kind of worried about that
mild dirge
and MNIST should not* take a monstrous model, so training/testing shouldn't take too long per iteration right?
mild dirge
What are you using?
abstract sinew
density = itertools.permutations([16, 64, 128, 256], 2)
for a, b in density:
    print(a, b)
    model = Sequential()
    model.add(Conv2D(24,kernel_size=5,padding='same',activation='relu', input_shape=(28,28,1)))
    model.add(MaxPool2D())
    model.add(Conv2D(64,kernel_size=5,padding='same',activation='relu'))
    model.add(MaxPool2D())
    model.add(Flatten())
    model.add(Dense(a, activation='relu'))
    model.add(Dense(b, activation='relu'))
    model.add(Dense(10, activation='softmax'))


    k_fold(model, 10)
that's keras right?
abstract sinew
yeah
mild dirge
are you running on cpu or gpu?
abstract sinew
cpu, I have an amd gpu
mild dirge
ah dang
abstract sinew
bummer
mild dirge
that saves a lot of time 😛
abstract sinew
so yeah maybe it doesn't take too long
but I have those convo layers in there which add a bit
mild dirge
There is something called halving grid search btw
abstract sinew
and I'm doing each permutation of [16, 64, 128, 256]
and then 10 folds on top of that
mild dirge
You could always just pick out the best results after grid search with 10 folds, and then run the best results with more folds
abstract sinew
When choosing the best model should I be looking at loss or accuracy?
Hm I guess if I'm not seeing improvement, that means it's not worth changing
hybrid mica
is there any tool to visualise machine learning models in 3D?
 hollow flare
How should I learn maths for data science
?
Any method or way to study maths for data science
serene scaffold
hollow flare
How should I learn maths for data science
what math do you already know?
hollow flare
Integration, differentiation etc which I learn till 12th standard
serene scaffold
so you need to learn linear algebra next
hollow flare
Ok
hybrid mica
can you run .py files in jupyter lab?
serene scaffold
hybrid mica
can you run .py files in jupyter lab?
you have to turn them into notebooks, I think
 tough marsh
Hello, I'm not a coder but I want to learn, but I have this idea and I just want to ask if it is possible. The question: Is it possible to predict the number generator generating 1-20?
hollow flare
serene scaffold
so you need to learn linear algebra next
But should I learn maths with Machine learning algorithms or differently?
serene scaffold
hollow flare
But should I learn maths with Machine learning algorithms or differently?
you can get a high-level understanding of how the algorithms work without the math, but if you want to make a career out of it, you should probably know the math.
hollow flare
serene scaffold
you can get a high-level understanding of how the algorithms work without the ma...
Ok, thanks for your help ✌️😊
hybrid mica
are tensorflow and keras linked?
lapis sequoia
hybrid mica
are tensorflow and keras linked?
https://www.simplilearn.com/keras-vs-tensorflow-vs-pytorch-article yes, Keras is more limited in scope but easier to use than Tensorflow though
 dense creek
hi, would it be possible for chatbot to learn messaging like an user just by his private conversations? Or does it need really big amount of information?
mild dirge
big info
dense creek
I'm aksing in general not some specific
mild dirge
most state of the art natural language processing models use the entirety of wikipedia and then some
dense creek
If it's already learned from big data, would it be much easier to learn writing type or is it amount of information that decides more?
Like learning messanging from all kinds of users and then learning specific one
mild dirge
I'm sure there's some models that write like a specific person
that would probably use transfer learning
dense creek
Thanks, i'll google it
serene scaffold
@dense creek there might be a way to fine tune a language model that has learned from an exceptionally large corpus to sound like a specific author. I'm not sure how, though.
bold timber
Hello guys, I have a problem that make me frustrating. Why my code is stuck in epochs = 3
 serene scaffold
@bold timber is this in colab? You might be maxing out your free compute resources, I guess.
bold timber
serene scaffold
<@786960616664727572> is this in colab? You might be maxing out your free comput...
in jupyter notebook
misty flint
serene scaffold
<@309373423921004555> there might be a way to fine tune a language model that ha...
yes gpt-3 can do this if you have enough examples
bold timber
bold timber
Hello guys, I have a problem that make me frustrating. Why my code is stuck in e...
When I try to use num_workers = 1, it works. Why did happen?
serene scaffold
bold timber
When I try to use num_workers = 1, it works. Why did happen?
I'm not sure why that made a difference, but what that does is set the number of CPUs that you're using to one.
cunning condor
desert oar
yes in general it will uninstall before installing, eg if you upgrade versions
Thank you 🙂
 tight glacier
Can someone help me , how can I take the images and divide into non-overlapping patches?

I am using the Fashion-mnist
28x28 images
i get i have to use unfold, but struggling to implement this
 lucid spindle
Hello
I am trying to understand the PolyCollection by trying a very minimal example to plot a square (I know there are already patches/artists for that) but I would like to understand how should I specify the vertices
I have tried the following:
import matplotlib.pyplot as plt
from matplotlib.collections import PolyCollection
import numpy as np

verts = [[0.0,0.0],[1.0,0.0],[1.0,1.0],[0.0,1.0]]
verts = np.array(verts)
print(verts.shape)

poly = PolyCollection(verts, facecolors = 'blue', edgecolors='k', linewidth=1)

fig = plt.figure()
ax = fig.add_subplot(111)
ax.set_xlim(-1.5, 1.5)
ax.set_ylim(-1.5, 1.5)

ax.add_collection(poly)

plt.show()
but I get the following error:
ValueError:
'vertices' must be 2D with shape (M, 2). Your input has shape (3,).
How can I format my verts in the format expected by PolyCollection?
desert oar
bold timber
When I try to use num_workers = 1, it works. Why did happen?
Possibly a deadlock issue with multiprocessing. Maybe a bug in the library, maybe a bug in your code. Setting to num workers = 1 probably disables multiprocessing entirely. If you share your code as text (not a screenshot) i can see what you are doing better
!paste read below for sharing code:
arctic wedgeBOT
Pasting large amounts of code
If your code is too long to fit in a codeblock in discord, you can paste your code here:
https://paste.pythondiscord.com/
After pasting your code, save it by clicking the floppy disk icon in the top right, or by typing ctrl + S. After doing that, the URL should change. Copy the URL and post it here so others can see it.
 maiden pelican
Does anyone have a code for back propagation ?
maiden pelican
tacit basin
You can check here http://d2l.ai/chapter_appendix-mathematics-for-deep-learning/...
Is there an actual python code where I can copy paste in my compiler and put different values and check the results ?
tacit basin
maiden pelican
Is there an actual python code where I can copy paste in my compiler and put dif...
There's pytorch code
 mint palm
I want to write a research paper that wouuld be very interesting to mention in grad application.
Something related to computer vision is what i like.
Which direction should i look towards?
 random sapphire
I made a video comparing some of the different file formats used to store data with python/pandas. Love to hear any feedback: https://www.youtube.com/watch?v=u4rsA5ZiTls

In this video we discuss the best way to save off data as files using python and pandas. When you are working with large datasets there comes a time when you need to store your data. Most people turn to CSV files because they are easy to share and universally used. But there are much better options out there! Watch as Rob Mulla, Kaggle grandmast...
tough frigate
lol, i never used pickle this way, might try it out later
random sapphire
tough frigate
lol, i never used pickle this way, might try it out later
You should also check out parquet and feather while you're at it. They have a lot of advantages over pickle files (at least when saving pandas dataframes)
misty flint
i watched this before you posted it here lol since it was on my feed
coincidentally, i just listened to a podcast the other day about data serialization 
wise pelican
tidal bough
You can track the time elapsed in the update function (adding `dt = 100/6` to th...
Wanted to come back to thank you for that info - it certainly worked!
I tweaked it a bit just cause the indenting was a bit off, so mine looks like this:
interval = float(100 / 6)
t = 0
shown = 0

def animate_fps(i):
  nonlocal t, shown
  t += interval
  if shown < len(x.array) and t >= x.array[shown]:
    shown += 1
  line.set_data(x.array[:shown], y.array[:shown])
  ax.set_xlim(x.array[i] - x.array[60], x.array[i] + x.array[60])
  return (line,)
I use 4 spaces per indent, hence the difference
 fleet musk
hi people. so i am new to python and coding
so i was installing pycharm and saw CONDA in the drop down list while creating new project
(learning about creating virtual environments using Conda)

does it mean Conda is already installed with python, and i dont need to install it separately?
because im looking at Conda website, and it says Conda with Python 3.9 is 510 mb download
tacit basin
fleet musk
because im looking at Conda website, and it says Conda with Python 3.9 is 510 mb...
anaconda is 510mb download. for leaner version you could look into miniconda, which comes with conda and it's dependencies. then if you need any lib lika numpy, pandas, you would need to install it with conda
fleet musk
tacit basin
anaconda is 510mb download. for leaner version you could look into miniconda, wh...
miniconda requires terminal download
im not good with it at the moment, so prefer GUI installation
but why does pycharm show Conda there?
when i havent installed it yet?
do i even need to install it? if its already there in pycharm
wise pelican
tidal bough
I use 4 spaces per indent, hence the difference
I do too but discord's tab is 2 spaces so when I paste code here I just go with that
4 space tabs ftw
tacit basin
fleet musk
miniconda requires terminal download
im not good with it at the moment, so prefe...
on windows tehre is exe installer. just double click and it installs conda/miniconda. not sure but perhaps in pycharm there should be some visual conda package manager. was some time ago since i used pycharm.
if it shows conda option for you you can try to create a new env and see if that works
fleet musk
tacit basin
on windows tehre is exe installer. just double click and it installs conda/minic...
ok sure. will try that
thanks miwojo
tacit basin
fleet musk
ok sure. will try that
thanks miwojo
yeah so it seems there is visual package installer with conda/pip in pycharm: https://www.jetbrains.com/help/pycharm/installing-uninstalling-and-upgrading-packages.html#interpreter-settings
tacit basin
fleet musk
ok sure. will try that
thanks miwojo
and it seems you have to install anaconda or miniconda separately: https://www.jetbrains.com/help/pycharm/conda-support-creating-conda-virtual-environment.html
fleet musk
tacit basin
and it seems you have to install anaconda or miniconda separately: https://www.j...
so i need to install separately if i wanna create virtual environments?
but package installations can be done from conda inside pycharm?
tacit basin
fleet musk
so i need to install separately if i wanna create virtual environments?
Yes correct. Yiu can create conda Virtual environments and install packages using UI in pycharm. You need conda installed in your system by anaconda or miniconda installer
bold timber
desert oar
Possibly a deadlock issue with multiprocessing. Maybe a bug in the library, mayb...
This is my code:
#TRAINING MODEL
def loop_fn(mode, dataset, dataloader, model, criterion, optimizer, device):
    if mode == 'train':
        model.train()

    elif mode == 'test':
        model.eval()

    cost = correct = 0
    for feature, target in tqdm(dataloader, desc = mode.title()):
        feature, target = feature.to(device), target.to(device)
        output = model(feature) #feedforward
        loss = criterion(output, target) #count loss

        if mode == 'train':
            loss.backward() #backpropagation
            optimizer.step() #update weight
            optimizer.zero_grad() #zero gradient

        cost += loss.item() * feature.shape[0]
        correct += (output.argmax(1) == target).sum().item()

    cost = cost / len(dataset)
    acc = correct / len (dataset)
return cost, acc``` train_cost, train_score = loop_fn('train', train_set, trainloader, model, criterion, optimizer, device)
with torch.no_grad():
test_cost, test_score = loop_fn('test', test_set, testloader, model, criterion, optimizer, device)
#Logging
callback.log(train_cost, test_cost, train_score, test_score)
#Checkpoint
callback.save_checkpoint()
#Runtime Plotting
callback.cost_runtime_plotting()
callback.score_runtime_plotting()
#Early Stopping
if callback.early_stopping(model, monitor='test_score'):
callback.plot_cost()
callback.plot_score()
break`
train_set = datasets.ImageFolder('data/train/', transform= transform, num_workers = 2)
trainloader = DataLoader(train_set, batch_size= bs, shuffle=True)

test_set = datasets.ImageFolder('data/test', transform=transform, num_workers = 2)
testloader = DataLoader(test_set, batch_size= bs, shuffle=True)```Actually, I'm already to fix this when I don't use the number of num_workers or by default num_workers =0. But why did happened?
misty flint
lapis sequoia
Can i do this kind of thing on Python?
https://www.youtube.com/watch?v=goePYJ74Ydg

Brilliant: http://www.brilliant.org/primer
Papers:
- https://www.researchgate.net/publication/41910312_Altruism_Spite_and_Greenbeards
- https://www.reed.edu/biology/professors/srenn/pages/teaching/2007_syllabus/2007_readings/a13_Keller_1998.pdf
For discussion and updates
- Discord: https://discord.gg/NbruaNW
- Reddit: r/primerlearning
- Twitte...
lapis sequoia
lapis sequoia
Can i do this kind of thing on Python?
https://www.youtube.com/watch?v=goePYJ74Y...
I'm pretty sure that Python holds a lot of libraries to do a lot of wierd things related with AI and Neural, but I'm not sure about this
 versed gulch
hi guys is there a way of generating ground-truths of images (grey images) via automatic segmentation techniques using python?
mild dirge
Currently looking at the paper "attention is all you need", mainly focussed on positional encoding atm. It uses this formula to encode the position of the word:

Giving a result like this:

I was just wondering why we need this convoluted method of encoding the position of the word. Is it not just possible to add like an extra value to the word vector, and give that a value of 0 to 1 based on its position?
Might just not understand fully how or why this is done
iron basalt
lapis sequoia
Can i do this kind of thing on Python?
https://www.youtube.com/watch?v=goePYJ74Y...
Yes.
lapis sequoia
iron basalt
Yes.
Did you have any of librarie that I can use as a reference?
iron basalt
Panda3D/Ursina. Numpy/Numba.
 violet talon
Anyone have tips to improve pandas query performance? Long story short, I have some code that needs to query pandas often, and for 'reasons' can't switch to something more appropriate for the job like sqlite, can't really find anyone talking about pd.query performance
iron basalt
mild dirge
I was just wondering why we need this convoluted method of encoding the position...
Imagine you add one extra value between 0 and 1 for the position in the sequence. When looking at that one value the ANN can easily distinguish between 0 and 1. And 0 and 0.5, or 0.5 and 0.7, etc.
But what if the sequence is long? Then moving just one word might be like 0 and 0.0001. And ANNs have a hard time with small changes like this, not as easy to separate.
So how about two inputs? One between 0 and 1 for the whole sequence, and another that goes from 0 to 1 every 5 words.
The first can tell you where in general the position is, and the second gives a more precise answer in combination with the first.
Now do it with a bunch and you have a bunch of sin/cos waves that form a unique position encoding when combined.
That is easy to distinguish.
There are other position encoding methods, but they just decided to go with that one, and it's a pretty good way to do it, similar to how the brain actually does it (encode positions).
inland mantle
How often do data scientists use ML
iron basalt
(Also related to Fourier analysis)
inland mantle
Do they use it on a daily basis? When I look up data science, ML is always in there but I talked with a software engineer at NVIDIA and he said they rarely use it if not at all. They are more of a statistician
desert oar
violet talon
Anyone have tips to improve pandas `query` performance? Long story short, I have...
show your code, explain the current performance, and explain why it isn't meeting your requirements. also, how big is the dataframe?
 grave frost
mild dirge
I was just wondering why we need this convoluted method of encoding the position...
grave frost
mild dirge
I was just wondering why we need this convoluted method of encoding the position...
its a much neater way, but you don't really need positional encodings in a transformer
its neater because you preserve shape of the encodings/embedded vector to be added/concatted as per need
iron basalt
You can also just combine it rather than add more dimensions. ^
mild dirge
Do you multiply those positional encodings with the original word vectors or something?
Or is it a separate vector?
grave frost
yep, but their embedded version is used in the actual attention calculation
iron basalt
They add them I believe, specifically. But they could be combined in other ways technically.
grave frost
since the token indices are discrete and of variable sizes - which you don't want because that would require recomputing the computing graph at each step, making things slow AF
atleast in TPUs/XLA. I believe CUDA handles dynamic shapes more smartly
iron basalt
If you are interested in this way of encoding positions and such. I recommend learning about grid cells to see how the brain does it (in 2D). And how it can integrate motion into it to update the position (and sensory info).
desert oar
inland mantle
Do they use it on a daily basis? When I look up data science, ML is always in th...
there are imo two different definitions of "ML":
-
the problem domain of building automated systems that learn from data in order to interact with the real world somehow.
-
the broad category of "non-statistical" techniques for building models. many of these techniques were developed in service of (1) and are often used in that context, hence the name.
whether you do (1) depends on the job you have and the industry/field you practice in. whether you do (2) is a matter of what tools make the most sense for the job, and what your background/expertise is. a statistician's expertise would probably be wasted spending too much time on (2), but you can certainly use statistics in service of (1). or you can use (2) in service of other problems, such as forecasting and even exploratory analysis to some extent.
so the answer is "it depends", but hopefully what it depends on is clearer now. i'd say that the average practicing "front line" data scientists in industry use ML techniques use (2) somewhat frequently and very often act in service of (1). when they aren't using (2) ("ML techniques"), they are using "advanced undergrad" level statistics: not much more advanced than the basics, but deployed judiciously and with a deep understanding of the business problem at hand.
note that true advanced-level statisticians are significantly rarer than generalist data scientists, in part because (imo) advanced statistics is harder to apply to real problems, and moreover tends to be deployed in the face of harder problems.
mild dirge
iron basalt
If you are interested in this way of encoding positions and such. I recommend le...
I'll look it up thx, learning for an exam. the prof did not really explain attention in that much detail
But that kinda leaves us just confused with what everything means
and why stuff is done
iron basalt
(But it also does the direct sin/cos wave stuff in your ears, even more similar (Fourier analysis more or less biologically (this is where spiking neurons really shine and show why you want them rather than the crude approximation used now)))
 fallow nymph
Im trying to have OpenCV use my Nvidia T4 gpu for YOLOv3 inference. Do I need to compile it from source to have it make use of the GPU (instead of cpu) or should it work out of the box installing opencv-python
As I am getting very mixed answers from googling it.
mild dirge
iron basalt
(But it also does the direct sin/cos wave stuff in your ears, even more similar ...
Yeah pretty cool stuff, how evolution just manages to converge to useful mathematical functions hehe
fallow nymph
Using opencv dnn to be more specific
 tight flare
I think you have to build OpenCV with CUDA support
I think opencv dnn comes with a cuda flag that you can enable?
iron basalt
*To add further, there is this thing called thousand brains theory that expands on the idea of grid cells / this position encoding to encode arbitrary objects (including language). It's a general theory of how the brain works.
fallow nymph
Ok so for inference using a GPU CUDA is what I need right?
thats what I picked up from google but its very confusing 😅
misty flint
mild dirge
Currently looking at the paper "attention is all you need", mainly focussed on p...
hey! me too
iron basalt
*And it's what i'm working on now.
tight flare
You need CUDA and CUDNN
tight flare
fallow nymph
thats what I picked up from google but its very confusing 😅
just follow the instructions and you'll be fine
are you working on colab or on your machine?
fallow nymph
tight flare
are you working on colab or on your machine?
EC2
Colab isnt great for inferencing as far as I know
misty flint
mild dirge
and why stuff is done
im finding this resource really helpful atm https://jalammar.github.io/illustrated-transformer/
mild dirge
awesome thx, i'll take a look at that too
grave frost
mild dirge
and why stuff is done
that's kinda how DL is, most things look very abstract and convoluted
grave frost
it requires heavy mathematical knowledge just to scratch the surface - otherwise it just becomes learning formulas
mild dirge
I really wish we had some assignments that went more in-depth on certain topics
Instead most of the profs just cover like every single possible topic in the field
So you get the same stuff repeated like 10 times, very shallowly
grave frost
but its interesting in a way as there's plenty of opportunity to explore why it works
misty flint
mild dirge
So you get the same stuff repeated like 10 times, very shallowly
that sounds like undergrad. we go pretty in-depth here
mild dirge
doing masters :/
misty flint
oof
iron basalt
grave frost
but its interesting in a way as there's plenty of opportunity to explore why it ...
For example, what if I don't use that position encoding method?
mild dirge
masters AI to add to that lol
misty flint
mild dirge
doing masters :/
well, profs probably dont like talking about things that theyre not interested/specialized in
iron basalt
What if it's learned rather than static?
grave frost
iron basalt
For example, what if I don't use that position encoding method?
coincidentally, the model learns it automatically
misty flint
mild dirge
masters AI to add to that lol
hey me too 
grave frost
there's a paper published just today about it
mild dirge
So positional encoding is not that useful?
grave frost
transformers learn everything - implictness is key
positional encoding will remain well relevant
but its not explictly required
iron basalt
All because a model learns something without it being explicit (which is often the case), you probably still want the explicit stuff especially if you don't have much data. Because it takes time to learn it implicitly and it may not end up doing so.
mild dirge
you don't see that many people posting their research paper results on twitter haha
but pretty cool
grave frost
its a retweet BTW, guy's not the author 🙂
misty flint
iron basalt
However, it's an interesting find, because it says something about language / what it was trained on.
grave frost
iron basalt
All because a model learns something without it being explicit (which is often t...
yep, its just spending params and FLOPs for that. interesting that it can actually do stuff on its own
mild dirge
Honestly i'd probably rather go into the computer vision area
RNNs have mostly confused me up to so far
iron basalt
If you find your model learns something implicitly, maybe consider making it explicit.
grave frost
well, I'm interested in AGI so I like transformers a lot
mild dirge
deep learning seems really nice and interesting
misty flint
mild dirge
RNNs have mostly confused me up to so far
thats so funny bc im the opposite
but tbh mainly bc i hated convolutions
grave frost
idk I dont like explicitness
iron basalt
mild dirge
RNNs have mostly confused me up to so far
I got bad news for you. Image tasks being treated as sequences are winning out.
(For now)
misty flint
iron basalt
I got bad news for you. Image tasks being treated as sequences are winning out.
ive seen transformers being applied to image tasks more and more yeah
mild dirge
They're called videos, and they're beneath me
grave frost
I have more bad news - transformers are SOTA in every field, except linear regression
iron basalt
No I mean single static image. You feed the pixels as a sequence (or sections of the image).
mild dirge
really?
misty flint
yeah
mild dirge
any paper on that?
iron basalt
Yup. Transformers are used.
grave frost
by every, I mean every. animation, images, text, audio, medical, tabular, RL like AlphaGO etc.
grave frost
just tabular is left to xgboost
iron basalt
Turns out, treating things as sequences makes it work out better.
Which the human brain does too*
grave frost
or more accurately, transformers are just a superior architecture due to scalability
misty flint
so bad news, guess you gotta learn transformers
iron basalt
When you look at an image, your eyes saccade around turning it into a sequence of small patches.
Which are "high quality" and around it, it's fuzzy.
grave frost
well yes, but treating things as sequences isn't really helpful on its own. its the scalability/parallelizability of transformers
iron basalt
Yeah.
The human brain is ofc different, so for normal computers (von neumann), you want that scale/parallelization in that way.
grave frost
True.
mild dirge
"An Image is Worth 16x16 Words", seems like an interesting paper title haha
mild dirge
would be cool if there were some advances in neuro-computing
or at least something different from the transistors
Did my bachelor project on something called memristors, and how they could be used in a neural network
misty flint
sounds dope dude
mild dirge
Looking back on the project now, I was absolutely clueless with what I was doing
with python and neural networks in general
I remember reading the "attention is all you need paper" for it back then
Still don't fully understand it
misty flint
mild dirge
Did my bachelor project on something called memristors, and how they could be u...
oh wait squiggle talked about memristors before
i remember bc my search history said so
inland mantle
desert oar
there are imo two different definitions of "ML":
1) the **problem domain of bui...
Can you elaborate on number 1. What type of fields would do automation and.
 fading thunder
Hello, I want to learn python for financial analysis application (due to the growing demand in this skill). I wanted to know some good resources that can direct me towards understanding python in finance. I would like something specific towards that field if possible but also be beginner based. In an ideal world it would be a data analysis/financial analysis course aimed at finance professionals/majors with no experience in coding.
mild dirge
fading thunder
Hello, I want to learn python for financial analysis application (due to the gro...
If you have absolutely zero coding experience, I would maybe start with a beginner course to at least familiarize yourself with coding/Python.
You need to know basic data structures and syntax etc. before you can start using a code language in a specific field imho
fading thunder
is there a beginner friendly IDE that I can download and mess around w/ as i learn?
mild dirge
I Believe Thonny is a beginner friendly one, IDLE is also common for beginners
@fading thunder
serene scaffold
fading thunder
is there a beginner friendly IDE that I can download and mess around w/ as i lea...
if you're a beginner, you can also just use a plain text editor and run your code at the terminal, but it would be up to you to catch syntax and name errors.
fading thunder
ok ty. any recommendations on free course that are good?
serene scaffold
for data science, or general Python usage?
in either case, you can filter for free courses on the resources page
!resources
arctic wedgeBOT
Resources
The Resources page on our website contains a list of hand-selected learning resources that we regularly recommend to both beginners and experts.
 sharp rain
How to handle the outlier in Dataframe? Since outlier making the regression model is weird
sharp rain
I never check the description seems like the loss must exist in the model
nope, i am new in machine learning
This is my model summary which exist outlier

ys, with polynomial function with degree 2
 muted sierra
i wanted to make a recommendation system. I also found a suitable dataset for the same
what are the things I need to understand before building this?
lapis sequoia
def gram_schimdt(basis):
    """
    basis => basis of current subspace
    returns np array of new vectors and concated basis
    """
    actual_basis = np.copy(basis)
    new_basis = []
    shapes_left = basis.shape[0] - basis.shape[1]
    for _ in range(shapes_left):
        vec = np.random.rand(1, 8)
        projs = get_projection(vec, basis)
        vec = vec - projs
        vec_normalized = np.transpose(vec/np.linalg.norm(vec, axis=1))
        new_basis.append(vec_normalized)
        # print(vec_normalized.shape)
        basis = np.concatenate((basis, vec_normalized), axis=1)
    return np.squeeze(np.array(new_basis)), basis

a, b = gram_schimdt(q)
I made this to find new orthonormal vectors
can this be more vectorized
i am concerned about that outer for loop. but can't find a way to make it vectorized from iterative
 naive cove
Hello everyone,
I'm working with time series data forecasting and I'm trying to forecast with LSTM.
Preparing for LSTM

### Three month moving window size

#I splitted by 0.5
values = reframed.values
n_train_months = 255
train = values[:n_train_months, :]
test = values[n_train_months:, :]
# split into input and outputs
train_X, train_y = train[:, :-1], train[:, -1]
test_X, test_y = test[:, :-1], test[:, -1]
# reshape input to be 3D [samples, timesteps, features]
train_X = train_X.reshape((train_X.shape[0], 1, train_X.shape[1]))
test_X = test_X.reshape((test_X.shape[0], 1, test_X.shape[1]))
print(train_X.shape, train_y.shape, test_X.shape, test_y.shape)

(255, 1, 15) (255,) (1090, 1, 15) (1090,)
After preparing my data for LSTM , I ran this following code which shows me error as below:
# make a prediction
yhat = model.predict(test_X)
test_X = test_X.reshape((test_X.shape[0], n_months*11))
# invert scaling for forecast
inv_yhat = concatenate((yhat, test_X[:, :-1]), axis=1)
inv_yhat = scaler.inverse_transform(inv_yhat)
inv_yhat = inv_yhat[:,0]
# invert scaling for actual
test_y = test_y.reshape((len(test_y), 1))
inv_y = concatenate((test_y, test_X[:, :-1]), axis=1)
inv_y = scaler.inverse_transform(inv_y)
inv_y = inv_y[:,0]
# calculate MSE
mse = mean_squared_error(inv_y, inv_yhat)
print('Test MSE: %.3f' % mse)
ValueError Traceback (most recent call last)
<ipython-input-68-c36cb3d27f69> in <module>()
1 # make a prediction
2 yhat = model.predict(test_X)
----> 3 test_X = test_X.reshape((test_X.shape[0], n_months*11))
4 # invert scaling for forecast
5 inv_yhat = concatenate((yhat, test_X[:, :-1]), axis=1)
ValueError: cannot reshape array of size 16350 into shape (1090,33)
Feels like I'm slicing train_x and train y wrong. Can anyone help me fixing this mistake ?
steady basalt
Any statistician here?
tough marsh
Hello, im no programmer and still beginner and trying to learn python, what are your thoughts on this: there's a game that im playing that spits out random numbers, how are you going to approach this problem to predict what numbers will come out next? This idea is my motivation to learn i dont know, machine learning stuff neural networks
 runic zodiac
I'm using matplotlib and i cant see any grids or axis or labels why?
 odd meteor
steady basalt
Any statistician here?
odd meteor
steady basalt
Any statistician here?
Ask your question. I want to believe there are lots of statisticians here
runic zodiac
runic zodiac
I'm using matplotlib and i cant see any grids or axis or labels why?
anyone??
tidal bough
runic zodiac
I'm using matplotlib and i cant see any grids or axis or labels why?
there's no grid by default. I think the axes here might just be hidden on your background. Try plt.style.use("dark_background") before plotting.
steady basalt
odd meteor
Ask your question. I want to believe there are lots of statisticians here
Seems not
odd meteor
runic zodiac
anyone??
That's quite strange. Did you remove the axis from showing? Also, which IDE is this? Colab?
tidal bough
looks like VSCode
tidal bough
tidal bough
there's no grid by default. I think the axes here might just be hidden on your b...
hmm, probably not, it does look very different
runic zodiac
i was expecting something like this

 pastel valley
guys any idea with this warning? is it safe to ignore?
WARNING:absl:Buffer deduplication procedure will be skipped when flatbuffer library is not properly loaded
305805732
runic zodiac
tidal bough
there's no grid by default. I think the axes here might just be hidden on your b...
this worked ...cheers!
pastel valley
generated while i run this code
converter = tensorflow.lite.TFLiteConverter.from_keras_model(gt_model)
tflite_model = converter.convert()
open("gt_model.tflite", "wb").write(tflite_model)
is there a way i could get something like this
tidal bough
runic zodiac
this worked ...cheers!
@runic zodiac
It likely worked because dark_background's settings replaced your broken ones
Try doing mpl.rcParams.update(mpl.rcParamsDefault) instead, maybe? That should be matplotlib's default
You might want also to reload the kernel (to unset the dark background style) and check
import matplotlib as mpl
from pprint import pprint
pprint({k:v for k,v in mpl.rcParamsDefault.items() if mpl.rcParams[k]!=v})
That'll show all changes from default parameters in the broken parameters that your matplotlib defaults to. You can then track down where they come from.
tacit basin
tough marsh
Hello, im no programmer and still beginner and trying to learn python, what are ...
If it's random numbers you need crystal ball rather than machine learning to predict next number. Supervised Machine learning for example needs training data for train
mild dirge
misty flint
im finding this resource really helpful atm https://jalammar.github.io/illustrat...
Really nice explanation, thanks for that!
misty flint
mild dirge
Really nice explanation, thanks for that!
bro your resource also helped me with my assignment, so thanks for that as well!
steady basalt
Any statisticians in chat? I have a question about transforming data for linearity
serene scaffold
steady basalt
Any statisticians in chat? I have a question about transforming data for lineari...
It's best to just ask. "Does anyone know about x" is basically the same as "I have a question about x" but not saying what the question is.
steady basalt
If you find the assumption of linearity is violated from a box Tidwell test and using quadratic term doesn’t work, can you cube it?
 next phoenix
Found this. Basics of Neural Network with Tensorflow with a project - https://medium.com/coders-mojo/day-41-60-days-of-data-science-and-machine-learning-series-d0b6649587c9
 misty flint
this is pretty cool https://blog.google/technology/health/check-up-ai-developments-2022/

Google
At Google Health’s event, we shared new areas of research and development that look at how AI can improve healthcare around the world.
especially the focus on global health and low-resourced areas that cant afford healthcare or have access to it
 wise nacelle
what are the free sources to learn ML? can anyone help please
tacit basin
wise nacelle
what are the free sources to learn ML? can anyone help please
I like fast.ai courses course.fast.ai
You can also check python discord recommend resources page
 gentle lion
im working on a network that predicts the rotation around the up axis of objects. Because 359 degrees is almost the same as 2 degrees but would be punished very hard with a standard loss function, up until now i have worked with the sin and cos of the angle as the 2 output values. This works decently. Does anyone think it would be better to only have 1 output value (the actual angle from 0-360 normalized to 0-1 or something) and write a custom loss function that can work with the cyclic nature of the angle (so 0.99 prediction when actual value is 0.01 does not result in great loss)?
 spare briar
wise nacelle
what are the free sources to learn ML? can anyone help please
spare briar
wise nacelle
what are the free sources to learn ML? can anyone help please
my favorite intro class is https://www.youtube.com/playlist?list=PLl8OlHZGYOQ7bkVbuRthEsaLr7bONzbXS

YouTube
Cornell class CS4780. Written lecture notes: http://www.cs.cornell.edu/courses/cs4780/2018fa/lectures/index.html Official class webpage: http://www.cs.cornel...
wise nacelle
spare briar
my favorite intro class is https://www.youtube.com/playlist?list=PLl8OlHZGYOQ7bk...
wow so may free lectures, that's what I want
thanks
fleet musk
hi
So i have been learning about creating virtual envs to work in python
and was while trying to create one in VSC, encountered this error.

the venv is created, but while trying to activate it, it throws an error
serene scaffold
@fleet musk you might have to run powershell as an administrator
serene scaffold
close powershell
right click powershell
select "run as administrator"
fleet musk
this is vsc
serene scaffold
fleet musk
this is vsc
powershell is a program that comes with windows. you can just search for it at the Windows search bar.
and you'll get a command prompt that is the same one that you might get embedded in VCS
serene scaffold
you are not encountering a VSC issue. the issue you are having is strictly with powershell. the fact that the powershell window you were using was embedded in VSC has no effect.
 karmic valley
guys
serene scaffold
run the same command as before
serene scaffold
you're unable to. can you be more specific?
fleet musk
my project is in D drive. so i need to change directory and go there first
then activate
karmic valley
i see a bunch of arrays in debug mode but they are not in my code
serene scaffold
fleet musk
my project is in D drive. so i need to change directory and go there first
so use the cd command to change directory
 serene scaffold
see if you can figure out how to use the cd command to change to a directory in the D drive. I can't show you the command because I'd have to manually retype the content of your screenshot, which I am not willing to do.
fleet musk
hmm understandable
karmic valley
i have all these arrays that come up when i run code in debug mode. but none of these arrays are in my code. i want to export values of one of these arrays to excel but whenever i do some code it says cannot find array.
 fleet musk
serene scaffold
that's why it says "illegal characters in path"
fleet musk
serene scaffold
that's why it says "illegal characters in path"
ok im in. ill try that command to activate
serene scaffold
karmic valley
there's over 200 lines of code that aren't in your screenshot, and any one of them could define the arrays that you claim are not in your code
!paste
karmic valley
!pastebin
arctic wedgeBOT
Pasting large amounts of code
If your code is too long to fit in a codeblock in discord, you can paste your code here:
https://paste.pythondiscord.com/
After pasting your code, save it by clicking the floppy disk icon in the top right, or by typing ctrl + S. After doing that, the URL should change. Copy the URL and post it here so others can see it.
karmic valley
i dont think any of the arrays are in my code but my code makes loads of arrays
so i dont know what name to refer to them and how to export
fleet musk
serene scaffold
that's why it says "illegal characters in path"

what am i doing wrong
karmic valley
any ideas
serene scaffold
fleet musk
I'm sorry but I don't know what the problem is 
misty flint
fleet musk
try setting your default terminal as command prompt
why do i know this because i run into this problem everytime i set up a new venv in vscode
so now i just save that link in one of my notion docs
fleet musk
so i need to repeat above process everytime i have to create new venv?
fleet musk
🥲
misty flint
you should be able to just set your default terminal as command prompt
and you should be good
i think i had to do it in multiple places
thats why i saved it
fleet musk
misty flint
i think i had to do it in multiple places
why multiple? is there no permanent solution
misty flint
fleet musk
why multiple? is there no permanent solution
laptop, desktop, etc. just try the solution bro
you will thank me afterwards
fleet musk
yeah. im going thru ur link. looking at option 2
also found something on stackof
Stack Overflow
I am trying to run a cmd file that calls a PowerShell script from cmd.exe, but I am getting this error:
Management_Install.ps1 cannot be loaded because the execution of scripts is disabled on this
misty flint
fleet musk
yeah. im going thru ur link. looking at option 2
wait why did you not pick option 1
i even said to select the default terminal as command prompt
just do it
then set it
and forget it
misty flint
fleet musk
😂
misty flint
tbh stuff like this is why i hate windows
misty flint
fleet musk
i havent done it yet. just trying to understand how all of it works
ok you should do it and then understand afterwards
 fleet musk
misty flint
ok you should do it and then understand afterwards <:kekHands:948697940711587900...
fleet musk
misty flint
ok you should do it and then understand afterwards <:kekHands:948697940711587900...
thanks. love ur emojies
 fleet musk
im new to programming, and python, so lot of head scratching
misty flint
its ok this is only the beginning
misty flint
fleet musk
im new to programming, and python, so lot of head scratching
better than me when i started out tbh
 frank acorn
Help what is this
 fleet musk
misty flint
better than me when i started out tbh
fleet musk
misty flint
better than me when i started out tbh
add me 😄
steady basalt
@frank acorn Did u miss a bracket
frank acorn
Also cool story I accidentally deleted this file so I need to type it out painstakingly again :}
frank acorn
steady basalt
<@!689126448971382799> Did u miss a bracket
I don't think I did, the error was at a comment
frank acorn
Wait why
frank acorn
Where 👀
frank acorn
I tried that but it became part of the comment
frank acorn
Oh the second last line is part of the third last line
steady basalt
No prob 😂
frank acorn
It started working :D
steady basalt
I have eagle eye
frank acorn
See you, going to fill in the other 200 subplots
steady basalt
Good luck
frank acorn
This is why I always get an error  👍
👍
hybrid mica

 steep oyster
any simple tutorial of 5-10 min explaining ai play games generation shit?
like for example flappy bird and learning how to make the ai start random and select the best guy
modest shuttle
Can someone explain the details of this plot?
 grave frost
hybrid mica
https://paste.pythondiscord.com/inixuhejil
grave frost
hybrid mica
https://paste.pythondiscord.com/inixuhejil
training loop problems - you are iterating infinitely
hybrid mica
grave frost
training loop problems - you are iterating infinitely
how do you fix it?
grave frost
hybrid mica
how do you fix it?
debug
tough frigate
modest shuttle
Can someone explain the details of this plot?
looks seasonal
grave frost
thats tqdm if you want some leads
arctic crown
please help how can i get started with ml i cant find a good tutorial or course
serene scaffold
arctic crown
please help how can i get started with ml i cant find a good tutorial or course
You have asked this here several times, and I suspect that everyone who has an answer has already provided it.
arctic crown
serene scaffold
You have asked this here several times, and I suspect that everyone who has an a...
i know i have and i am sorry that i am asking this again but the i swear this is the last time, can someone please provide me with a good tutoriial
serene scaffold
arctic crown
i know i have and i am sorry that i am asking this again but the i swear this is...
a single tutorial isn't going to be enough. I've heard a lot of people recommend the Andrew Ng course, but I have not taken it. I do recommend the free data science resources on our website
!resources data science
arctic wedgeBOT
Resources
The Resources page on our website contains a list of hand-selected learning resources that we regularly recommend to both beginners and experts.
arctic crown
serene scaffold
a single tutorial isn't going to be enough. I've heard a lot of people recommend...
ty
modest shuttle
tough frigate
looks seasonal
what?
misty flint
serene scaffold
You have asked this here several times, and I suspect that everyone who has an a...
also
i like that there are DS resources now
serene scaffold
always have been  🧑🏻🚀
🧑🏻🚀


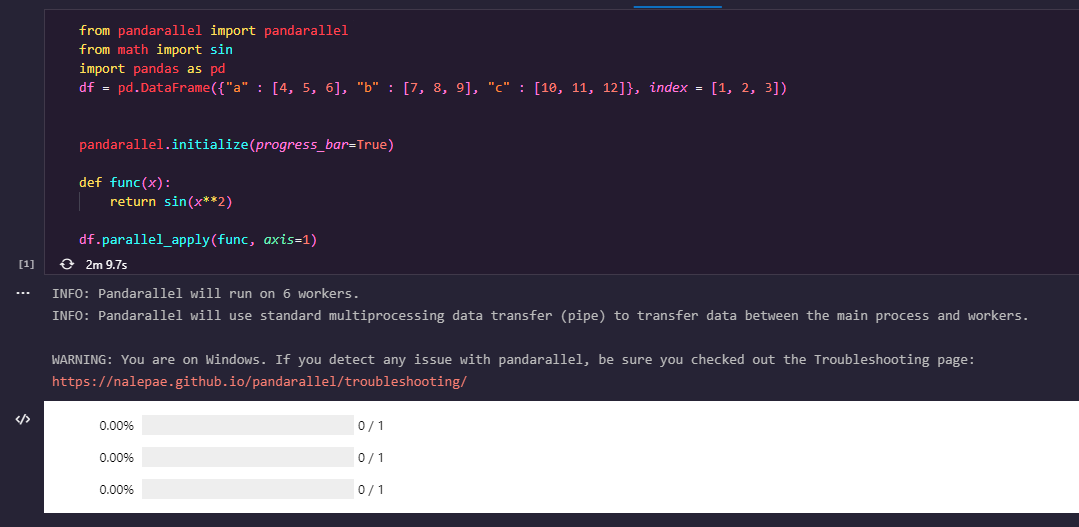 serene scaffold
but you can put a topic after the !resources command now to pre-filter them in the URL
steep oyster
steep oyster
any simple tutorial of 5-10 min explaining ai play games generation shit?
?
mild dirge
If there were a 5-10 min video about that, you couldn't recreate it after watching that if you don't know anything about ai or evolutional algorithms
yt videos are really mostly good for getting intuition
iron basalt
arctic crown
i know i have and i am sorry that i am asking this again but the i swear this is...

Pattern Recognition and Machine Learning (Information Science and Statistics)
hybrid mica
hybrid mica
https://paste.pythondiscord.com/inixuhejil
just updated my tf version and now this problem is fixed!
 brave latch
anyone know details on how fingerprint identification like touch id works?
I presume it uses some sort of CNN/classifier but it amazes me that the false positive rate is only 1/50,000 according to apple
I think something that could work is predicting a transformation (scale + rotation + translation) and then verify the transformed captured image against one of the enrolment images
iron basalt
brave latch
anyone know details on how fingerprint identification like touch id works?
You can just use https://en.wikipedia.org/wiki/Harris_corner_detector to extract keypoints and check for a match. Can be done with just built-in OpenCV stuff.
The Harris corner detector is a corner detection operator that is commonly used in computer vision algorithms to extract corners and infer features of an image. It was first introduced by Chris Harris and Mike Stephens in 1988 upon the improvement of Moravec's corner detector. Compared to the previous one, Harris' corner detector takes the diffe...
brave latch
i'm not trying to do it personally
iron basalt
Nothing crazy needed with CNNs and whatever.
brave latch
just looking for more detail on how the high tech ones work 😄
desert oar
https://data-apis.org/ interesting stuff
iron basalt
brave latch
just looking for more detail on how the high tech ones work 😄
Just some extra denoising and stuff. They could start using CNNs and such, but probably don't need to.
iron basalt
desert oar
https://data-apis.org/ interesting stuff
Yeah it's what is followed to make stuff like numpy, cupy, and such consistent.
desert oar
i figured you would know about it if anyone would