#data-science-and-ml
1 messages · Page 365 of 1
 thin palm
What I did was take that same X and y (that I ran my Cross Validation on) and took my model.fit(X,y)
best_k = 7
model = KNeighborsClassifier(n_neighbors=best_k)
cv_results = cross_validate(model, X,y, cv = 10)
cv_results['test_score'].mean()
-> 0.8120430107526883
model.fit(X,y)
model.score(X,y)
->0.8613861386138614
 serene scaffold
thin palm
What I did was take that same X and y (that I ran my Cross Validation on) and t...
serene scaffold
thin palm
What I did was take that same X and y (that I ran my Cross Validation on) and t...
that doesn't sound quite right. When you do 10-fold cross validation, the data is partitioned into 10 groups, and each one takes a turn being the evaluation set.
10-fold cross validating would involve fitting the model 10 times, so there isn't one (X, y) for the entire process.
thin palm
because I get confused on when to use Train / Test or to use Cross Folds
 desert oar
thin palm
best_k = 7
model = KNeighborsClassifier(n_neighbors=best_k)
cv_results = cross_v...
desert oar
thin palm
best_k = 7
model = KNeighborsClassifier(n_neighbors=best_k)
cv_results = cross_v...
this looks okay to me
what is cross_validate, is that a scikit-learn function? or something you wrote?
thin palm
desert oar
what is `cross_validate`, is that a scikit-learn function? or something you wrot...
it is Scikit-Learn
desert oar
scikit-learn
Examples using sklearn.model_selection.cross_validate: Categorical Feature Support in Gradient Boosting Categorical Feature Support in Gradient Boosting, Combine predictors using stacking Combine p...
thin palm
desert oar
this looks okay to me
but it's okay that the score went up by this much? I was just hoping I didn't commit data leakeage
desert oar
oh i see. no it's not okay. yes you are committing "data leakage"
thin palm
See this is what I thought
desert oar
stelercus explained cross validation. do you understand their explanation?
thin palm
Yes I do understand Cross Validation
desert oar
cv fits the model 10 different times, each time using a different chunk of the data as a hold-out set
thin palm
it's just a matter of what steps I need to do next
desert oar
your final .fit and .score does not use a holdout set
you are just measuring performance on the training set
which will always be inflated and a poor estimate of true performance
i always try to keep a holdout set that i don't use for cross validation
i ignore it entirely until i am done tuning my model
then i use it for final evaluation to see if my model is actually any good
the entire parameter tuning process is really part of the model fitting. it is easy to "overfit" the entire process
obviously you can't do this if you have limited data
in which case you have to look a bit more carefully at things and maybe make some assumptions, or try oversampling, etc.
but if you have a big data set it's good to not "burn" all of your data at once
thin palm
I think what makes sense to do is this:
1.) Split the data to create your X_train X_test and y_train y_test
2.)cross validate a model on those trains
3.)fit the model on the TRAINS
4.)then score your model on the tests
would this be accepted?
serene scaffold
thin palm
I think what makes sense to do is this:
1.) Split the data to create your X_trai...
The scores you get from cross validation are what you should use to ascertain the performance of the model.
thin palm
makes sense, I see thank you for this.
serene scaffold
scoring is part of the cross validation process--if step two is "cross validate", scoring them can't be separated from that.
 tender trellis
Hey guys, Im making an app which takes input from user's camera. So I am using opencv and face recognition. The app is working fine, the problem lies with deployment. Does anybody have any idea regarding deploying opencv camera based applications?? If so, pls do help
serene scaffold
tender trellis
Hey guys, Im making an app which takes input from user's camera. So I am using o...
what problem are you having deploying it?
 lapis sequoia
Hello guys, is anyone willing to help with a question regarding the use of np.tensordot()?
serene scaffold
lapis sequoia
Hello guys, is anyone willing to help with a question regarding the use of np.te...
Try giving enough information about your question so someone can start answering it.
tender trellis
serene scaffold
what problem are you having deploying it?
I don't know how to deploy it. Can you tell me how
serene scaffold
tender trellis
I don't know how to deploy it. Can you tell me how
do you know how to deploy Python programs in general?
tender trellis
serene scaffold
do you know how to deploy Python programs in general?
Yes I do know how to deploy deploy python programs in general. Here I am using a Flask based server and running opencv which uses user's camera
serene scaffold
tender trellis
Yes I do know how to deploy deploy python programs in general. Here I am using a...
what about this is different from deploying a different flask app?
tender trellis
serene scaffold
what about this is different from deploying a different flask app?
Here it uses a camera from the user. Normally I would use cv2.VideoCapture(0), but this is not going to work on a server
serene scaffold
tender trellis
Here it uses a camera from the user. Normally I would use cv2.VideoCapture(0), b...
so, the problem is that you don't know how to interact with the user's hardware, since your program will be running on a server. Try conveying that in #web-development, as you'd have to write it in such a way that it requests camera data from the browser.
desert oar
thin palm
I think what makes sense to do is this:
1.) Split the data to create your X_trai...
i think you are describing what i'm describing
tender trellis
serene scaffold
so, the problem is that you don't know how to interact with the user's hardware,...
Oh okay, I will convey the same to the #web-development. Thank you very much for your help
lapis sequoia
My question regarding the np.tensordot is the following. Assuming that I have an array of the shape (N, 2, 1),so for example arr = [ [[ 0.5], [0.5]] , [[ 0.3], [0.3]] , .... ]. I would like to use the np.tensordot() on this array such that the dot product of (2,1) "vector" is being made. Therefore, the input would be arr and then the output would be outputDotProd = [ 0.5 , 0.18 , .... ] of shape (N,1), as 0.5 is the dotproduct of [[ 0.5], [0.5]] with iteself, and 0.18 is the dotproduct of [[ 0.3], [0.3]] with itself. I have read about how to use np.tensordot() but I cannot get a good grip on it. Any help would be extremely helpful.
desert oar
@thin palm more or less like this
x_train, y_train, x_test, y_test = train_test_split(x, y)

grid_search = GridSearchCV(model)
grid_search.fit(x_train, y_train)

final_model = model.clone()
final_model.set_params(**grid_search.best_params_)
final_model.fit(x_train, y_train)
pred_test = final_model.predict(x_test)
final_accuracy = accuracy_score(y_test, pred_test)
>>> a.shape
(N, 2, 1)
>>> np.tensordot(a, b).shape
(2, 1)
You want to know what the shape of b must be for this to be the result?
lapis sequoia
serene scaffold
```py
>>> a.shape
(N, 2, 1)
>>> np.tensordot(a, b).shape
(2, 1)
```
You want to ...
If a.shape is (N, 2, 1) then np.tensordot(a, a, axes = (......)).shape, would be (N, 1). So the output would contain the dot product of each vector element of shape (2,1) within a.
 slow vigil
Does pandas have anything where I can easily convert large numbers to an abbreviated notation like 1000000 to 1M
?
or is there something in python that does it that I could apply to a pandas column
serene scaffold
slow vigil
Does pandas have anything where I can easily convert large numbers to an abbrevi...
is there a name for that abbreviation schema?
 stone marlin
Wait, if you have the dotproduct of, like, [0.5] and [0.5], doesn't this reduce to the usual product?
slow vigil
Not that I know of

Stack Overflow
is there a python library that would make numbers such as this more human readable
$187,280,840,422,780
edited: for example iw ant the output of this to be 187 Trillion not just comma separated. ...
I found this
pretty ugly but I suppose it works
 hazy escarp
Do you guys know any popular library for drawing nn like you pass in inputs outputs etc and it gives you back a drawn nn
stone marlin
Haha, suspiciously good accuracy!
We could all be so lucky as to have clean data. :']
serene scaffold
slow vigil
Not that I know of
I don't know what to suggest except, when it comes time to display the dataframe, convert those columns to strs and apply one of these: https://python-humanize.readthedocs.io/en/latest/number/
stone marlin
Yeah, hopefully this is for display purposes only and not manipulation. If you need to have some numbers more easily readable AND do manipulation, scientific notation is prob gonna be the best way to do it. Engineering Notation? Whatever that E notation is called.
slow vigil
The intword feature
Yeah this is for display only
Twitter and their dang character limits
lol
desert oar
slow vigil
Does pandas have anything where I can easily convert large numbers to an abbrevi...
just do .apply with a function that formats your text however you want
 odd meteor
hazy escarp
Do you guys know any popular library for drawing nn like you pass in inputs outp...
odd meteor
hazy escarp
Do you guys know any popular library for drawing nn like you pass in inputs outp...
I know plot_model()function in Keras is capable of doing this.
Here's something to play around with.
https://keras.io/api/utils/model_plotting_utils/#:~:text=plot_model function&text=Converts a Keras model to dot format and save to a file.&text=rankdir%3A rankdir argument passed to,LR'%20creates%20a%20horizontal%20plot.
 stone marlin
Haha, I'm doin' some take-home stuff for an interview, and the directions on this one say at the top: "Do NOT use a Neural Network or XGBoost to solve this." I guess they got a bunch of people throwing their data into a nn or xgb without thinkin' too hard? Haha, who knows. [It's a fintech place.]
Maybe my next one will only want me to use XGB and NNs. :']
 serene crystal
not sure this is necessarily the best channel for this but has anyone ever plotted live data? I'm using pandas, matplotlib, and serialpy and I'm kinda stuggling to get it to get the data and plot it as I get it without it absolutely chugging as more data is added.
I just have a simple arduino nano hooked up that is just giving me the voltage from a photoresistor but eventually I'll be taking in data from a lot more sensors, this is just kinda a proof of concept
stone marlin
Like streaming data? There's definitely limits to it, so I'll usually paginate my data.
desert oar
stone marlin
Haha, I'm doin' some take-home stuff for an interview, and the directions on thi...
i like this
stone marlin
Haha, it was kind of weird seeing it since I've never seen that restriction before!
Also, IIRC, matplotlib screwed up their "update plot" feature with something (perhaps intentionally?) so I'm not sure how to do this in matplotlib without clearing and replotting a "shifted window" of the data. EDIT: This may no longer be the case, see the below comments.
desert oar
show your code?
serene crystal
what is pagination?
stone marlin
I'm using the term wrong, I mean a shifted window sort of thing. So that you're only showing your most recent N datapoints.
Like, you're gonna be plotting df.head(N) instead of df.
serene crystal
ah that makes sense
this is my code, ik it's kinda bad I'm just moving to python from C and C++ lol I'll be cleaning it up when I get it working better
ik having the getData in the animate is what's screwing it up I just don't know how to get the data and animate it at the same time, maybe asynchronousl? But that's a whole other can of worms
#create figure for plotting
fig = plt.figure()
ax = fig.add_subplot(1,1,1)
xs = [] #data index
ysPV = [] #photoVolt
ysPR = [] #photoRead
#acquire data from serial port and append
df = pd.DataFrame(columns=['index', 'photoRead', 'photoVolt'])
def getData(xs, ysPV, ysPR, df):
    #acquire data from serial port & parse
    line = ser.readline() #read serial data in as bytes; will be in ASCII
    splitLine = line.split(b',') #split data into index PR and PV
    ind = int(splitLine[0]) #get index
    pr = int(splitLine[1]) #get photoRead
    pv = float(splitLine[2]) #get photoVolt

    #append data to lists
    df.loc[len(df)] = [ind, pr, pv] #append data to dataframe
    xs.append(ind)
    ysPV.append(pv)
    ysPR.append(pr)
Edit:Got it to update quickly and not slow down, not instantaneous but it works well enough for what I need, if you know a better way please lmk
#animate figure
def animate(ind, xs, ysPV, ysPR, ax):
    #get data from serial port
    getData(xs, ysPV, ysPR, df)
    if(xs[-1] % 10 == 0):
        #limit data to MAX_POINTS
        MAX_POINTS = -50
        xs = xs[MAX_POINTS:]
        ysPV = ysPV[MAX_POINTS:]
        ysPR = ysPR[MAX_POINTS:]
        #plot data
        ax.clear()
        ax.plot(xs, ysPV, color = 'blue', label = 'photoVolt')
        ax.plot(xs, ysPR, color = 'red', label = 'photoRead')
        #format plot
        ax.set_title('Photoresistor Data')
        plt.xticks(rotation=45, ha='right')
        ax.set_xlabel('Data Index')
        plt.tight_layout()
        plt.legend()
ani = animation.FuncAnimation(fig, animate, fargs=(xs, ysPV, ysPR, ax), interval=100)
plt.show()
Strangely, I'm doing almost exactly the same project (except with fake sensor data!) as a portfolio project, and my "good enough" solution for mattplotlib was to clear the chart and re-plot with a new "head" every few seconds. Also, I used streamlit to show it off, so thanks whoever recommended that here!
desert oar
there's a way to replace the data in an Axes object without recreating the figure from scratch
it's used in matplotlib animation for example
serene crystal
I'll look into those ways, thank you both so much!
stone marlin
Oh, this is what I thought was broken, but it works now? I'll edit my previous response, that's cool.
I'll try this anyway, since I've gott'a do pretty much the same thing for my sensor project. haha.
desert oar
idk, maybe it's buggy or has limitations
stone marlin
Who knows, haha. I'll report back with whatever I find out about it.
 iron basalt
I prefer interactive mode on, and plt.pause, change xdata and ydata in a loop.
stone marlin
Huh, I didn't even know there was an interactive mode. I don't use matplotlib v often, except for, like, the basic pandas methods that call it. Nice.
iron basalt
I usually just use https://github.com/hoffstadt/DearPyGui now

GitHub
Dear PyGui: A fast and powerful Graphical User Interface Toolkit for Python with minimal dependencies - GitHub - hoffstadt/DearPyGui: Dear PyGui: A fast and powerful Graphical User Interface Toolki...
stone marlin
Oh! I do remember this, I think this is what I'm remembering as the thing that they took out around 3.3.x: the flush events thing.
iron basalt
plt pause is a convenience, it sleeps and runs the event loop in one call.
stone marlin
But it looks to be back in, so, you know, let's go for it.
iron basalt
Can run the two functions separately too.
stone marlin
I've got dearpygui on my to-do list, but for this thing I'm using streamlit to display a page and I don't think it supports implot.
DearPyGUI looks really sweet, though. I've had a lot of GUI projects I've put on hold because I can't stand using tk.
iron basalt
matplotlib is designed to use different backends so it's the best option for putting a graph into a website.
But anything that's an actual application I use dearpygui.
tk is old and very primitive, it's like using java swing in 2022.
stone marlin
Yeah, that's what I learned when I tried to use my fav plotting lib Altair on it. It works but --- haha.
Tk'll "get the job done" and Qt is okay if you wanna pack all the deps in with it, but neither one really strikes me as "Pythonic" or user-friendly.
serene scaffold
iron basalt
I usually just use https://github.com/hoffstadt/DearPyGui now
I guess this is a good library? I first heard of it probably over a year ago now when one of their contributors started camping #user-interfaces to promote it at every possible opportunity, so I assumed it was some crazy culty thing.
stone marlin
I asked around on the local tech + ds slack, and there were a few peeps who used it for their job, so I'm assuming it's pretty good. Docs looked fine to me.
We'll see once we get in there, I guess!
iron basalt
serene scaffold
I guess this is a good library? I first heard of it probably over a year ago now...
I have used dear imgui for a long time now and this is based on it. It's pretty good. Of course could use even more documentation, but it has whatever dear imgui has (plus implot and imnodes extensions).
In the last few years dear imgui exploded. Now it's used everywhere by everyone and it has a lot of big sponsors.

GitHub
Dear ImGui: Bloat-free Graphical User interface for C++ with minimal dependencies - GitHub - ocornut/imgui: Dear ImGui: Bloat-free Graphical User interface for C++ with minimal dependencies
Platinum-chocolate sponsors

    Blizzard

Double-chocolate sponsors

    Ubisoft
    Google
    Nvidia
    Supercell

Chocolate sponsors

    Activision
    Adobe
    Aras Pranckevičius
    Arkane Studios
    Epic
    RAD Game Tools
If that let's you know how good / serious it is.
While dearpygui is NOT a port of it. It has the same functionality. There are direct python ports of imgui.
As long as you have something that can create an opengl window for you, you can use the direct ports.
I have used the direct port of imgui (I think it was pyimgui) with Ursina (Panda3D).
Dear imgui has a distinct default look to it and if you ever watch any of the promotional materials from say, Ubisoft, etc, where they show some of the screens in the office you will notice a lot of dear imgui being used for the internal tooling.
If i'm not doing interactive plotting / don't really need an app I still use matplotlib since it's less typing and setup.
But if it's going to be a project then I do.
 ornate acorn
I have a homework, why is food wasted in a cafeteria or why food is scarce for people? We have enough data, but we have to turn it into artificial intelligence
Help me please :((((,
desert oar
ornate acorn
I have a homework, why is food wasted in a cafeteria or why food is scarce for p...
this seems ill-posed. can you provide more detail on the assignment + what data you are given?
ornate acorn
No data was given to us. We were asked to do it all ourselves.
but our teacher didn't teach anything.
Thıs ıs turkey...
ornate acorn
desert oar
this seems ill-posed. can you provide more detail on the assignment + what data ...
We wrote the data ourselves
Salt egg We have 50 data like
desert oar
so what did the teacher ask you to do?
ornate acorn
This asked us to make an artificial intelligence program with the data we prepared.
So why is food wasted? Because the number of people to eat is 500 people, but 600 people have been cooked.
Or the food has too much salt, people cannot eat it. Food is thrown away. An artificial intelligence program to prevent this
basic level
desert oar
i think you have set a difficult task for yourself
what data did you collect? just the menu items for that day and how much of it was eaten vs thrown away?
ornate acorn
I didn't choose this 😦
desert oar
This asked us to make an artificial intelligence program with the data we prepared.
it sounds like you had a lot of freedom to choose your own data and choose your own AI task
i am suggesting that this task is ill-posed and that the data you have probably isn't sufficient
why is food wasted? can you quantify a "why"?
that's a very difficult thing to do even for serious researchers
ornate acorn
The teacher chose the subject. We just prepared the data.
desert oar
ok, so the teacher told you to build an "AI program" related to the topic of food waste?
ornate acorn
Yesss
The data we have is;
How many people are eating
How many people in the cafeteria...

asked for 50 variables
desert oar
i see. can you be more specific about what the teacher asked? i want to help but i don't want to give bad advice
ornate acorn
I need to learn machine learning or artificial intelligence in about a day
 true beacon
How does pandas handle #REF!?
ornate acorn
If you tell me the codes, I can do the rest myself
desert oar
ornate acorn
I need to learn machine learning or artificial intelligence in about a day
it seems like you have set way too big a task for yourself... how long did you have to do this project?
desert oar
true beacon
How does pandas handle `#REF!`?
i think it's just missing, not sure though
ornate acorn
desert oar
it seems like you have set way too big a task for yourself... how long did you h...
Turkish education system xdddd
2 day
JUST 2 DAY XD
 vague moon
Hey, I am having some trouble trying to get results for single predictions from my cnn model that has multiple outputs. With binary outputs I have used result = cnn.predict(test_image) print(result[0][0]) which has worked, I would either get a one or a zero back, but now I am getting 1.0 4.0368886e-36 9.390638e-27 0.005686598 1.0 0.90156376 1.0 1.0 despite showing my webcam the same thing with a high accuracy model
desert oar
ornate acorn
JUST 2 DAY XD
but you don't know any programming or anything? that seems like a strange task
hazy escarp
Do you guys know any popular library for drawing nn like you pass in inputs outputs etc and it gives you back a drawn nn anywhere on the screen?
ornate acorn
Just python basic I'm in first grade
true beacon
ok thanks salt rock!! I will test it out!
desert oar
ornate acorn
Just python basic I'm in first grade
in the usa that means you're 6 years old. i assume that means something different in turkey
 fading wigeon
I'm trying to find box cox transforms that can handle negative values. Trying to avoid developing it from scratch. (I'd still want to swing through all the possible lambdas, but look at the data set for the lowest negative value and create an offset with a buffer) Hopefully this already exists?
desert oar
anyway if they gave you only 2 days, it sounds like they are not expecting much
i recommend reading the pandas tutorial documentation, so you can at least read the data
desert oar
fading wigeon
I'm trying to find box cox transforms that can handle negative values. Trying t...
does it have to be box-cox specifically?
fading wigeon
Well, I'm searching for transforms to some variables that are new to the industry, so I've been flinging all the popular transforms at each variable and seeing what performs the best, lol.
So I suppose it doesn't have to be box-cox specifically if you have any good ideas
desert oar
you can do something like parameterized inverse hyperbolic sine (IHS) ihs(θ, y) = arcsinh(θ * y) / θ

Cross Validated
I'm trying to use an inverse hyperbolic sine transformation to reduce the effect of outliers in my target variable. Unfortunately, I don't appear to have access to the basic papers on it. I've foun...
it's popular in econometrics
desert oar
fading wigeon
Well, I'm searching for transforms to some variables that are new to the industr...
maybe try checking mututal information pairwise with other "interesting" variables used in your industry
fading wigeon
Not a bad idea
desert oar
also pearson and spearman correlation, why not right?
fading wigeon
Yup
odd meteor
ornate acorn
Since you have 2 days to come up with something, I feel the teacher probably wanna guage y'all thought process and creativity (especially, since you claimed she hadn't taught it in class)
I don't 💯 understand the task yet but if you could translate to English each of the 5 variables in your dataset, I might be able to help
odd meteor
ornate acorn
asked for 50 variables
Oh you still need to come up with more 45 variables? I woulda recommended using a survey instrument but you only have 2 days for this 😀
serene scaffold
odd meteor
Since you have 2 days to come up with something, I feel the teacher probably wan...
you are Nigerian and yet you have said "y'all" 
odd meteor
serene scaffold
you are Nigerian and yet you have said "y'all" <:surprisedPika:73535745657785558...
😀 We say "y'all" in Nigeria as well
 light hemlock
How to modify if statement to create new column that have value 1 if it matches class, and 0 if not
Dataset: iris dataset (names=["sep_len","sep_wid","pet_len","pet_wid","class"])
I follow this guide https://towardsdatascience.com/multi-class-classification-one-vs-all-one-vs-one-94daed32a87b
def A_flower(data):
    grouped_df = data.groupby('class')
    for column, row in grouped_df:
        if data["class"[row]] == 1:
            data["classifier"] = 1
        else:
            data["classifier"] = 0
    return data
 serene scaffold
light hemlock
How to modify **if** statement to create new column that have value 1 if it mat...
serene scaffold
light hemlock
How to modify **if** statement to create new column that have value 1 if it mat...
it's unlikely that this does what it's intended to do
light hemlock
serene scaffold
it's unlikely that this does what it's intended to do
True, it does nothing
serene scaffold
light hemlock
True, it does nothing
can you do print(data.head().to_dict('list')), show the result as text, and explain what you want to be different about it?
I'll wait up to two more minutes for that before I go do something else.
I must now go.
light hemlock
serene scaffold
can you do `print(data.head().to_dict('list'))`, show the result as text, and ex...
{'sep_len': [0.611111111111111, 0.22222222222222213, 0.1666666666666668, 0.1666666666666668, 0.6944444444444443], 'sep_wid': [0.41666666666666663, 0.20833333333333331, 0.4583333333333333, 0.4583333333333333, 0.41666666666666663], 'pet_len': [0.711864406779661, 0.3389830508474576, 0.0847457627118644, 0.0847457627118644, 0.7627118644067796], 'pet_wid': [0.7916666666666666, 0.4166666666666667, 0.0, 0.0, 0.8333333333333334], 'class': [3, 2, 1, 1, 3]}
I'm trying to make knn , data is normalised. To perform 1-vs-all it is said to make training datasets by making classifiers:
Classifier 1:- [Setosa] vs [Versicolour, Virginica]
Classifier 2:- [Virginica] vs [Setosa, Versicolour]
Classifier 3:- [Versicolour] vs [Virginica, Setosa]
serene scaffold
I see that you posted it and then changed it. It was usable before, now it is not.
I'm on mobile but I might be able to help later.
serene scaffold
light hemlock
{'sep_len': [0.611111111111111, 0.22222222222222213, 0.1666666666666668, 0.16666...
In [8]: df
Out[8]:
    sep_len   sep_wid   pet_len   pet_wid  class
0  0.611111  0.416667  0.711864  0.791667      3
1  0.222222  0.208333  0.338983  0.416667      2
2  0.166667  0.458333  0.084746  0.000000      1
3  0.166667  0.458333  0.084746  0.000000      1
4  0.694444  0.416667  0.762712  0.833333      3

In [9]: df.assign(**{'class': df['class'].eq(1).astype(int)})
Out[9]:
    sep_len   sep_wid   pet_len   pet_wid  class
0  0.611111  0.416667  0.711864  0.791667      0
1  0.222222  0.208333  0.338983  0.416667      0
2  0.166667  0.458333  0.084746  0.000000      1
3  0.166667  0.458333  0.084746  0.000000      1
4  0.694444  0.416667  0.762712  0.833333      0
you can use assign to create a copy of the DataFrame where the class labels are binarized.
(don't let **{...} trip you up. it's just that df.assign(class=...) isn't syntactically legal.)
 hot kayak
Can someone help me with downgrading python from a higher version onto a lower version, I'm currently trying to use anaconda, however after I run conda install python=3.7.4 my python version still stays at a version I dont want it to be at :/
serene scaffold
hot kayak
Can someone help me with downgrading python from a higher version onto a lower v...
my advice would be to ignore that Anaconda exists unless you're sure that one of your dependencies has to be a compiled non-Python binary.
with regular Python venv, you can have more than one version of Python installed, and make a virtual environment of whichever one you want to use for a given project.
hot kayak
I want to just make my default version at a specific version because that is what is required would you have any recommendations for that?
light hemlock
requirements.txt ? And load packages from it?
serene scaffold
hot kayak
I want to just make my default version at a specific version because that is wha...
what OS?
hot kayak
mac
hot kayak
light hemlock
requirements.txt ? And load packages from it?
are you talking to me? because this is what I want to do and its just not working lol
serene scaffold
I've never used mac so I don't know, though that's probably a #tools-and-devops question.
light hemlock
serene scaffold
```py
In [8]: df
Out[8]:
sep_len sep_wid pet_len pet_wid class
0 0.6...
Thank you, it is too verbose but i'll try to make it simpler
serene scaffold
light hemlock
Thank you, it is too verbose but i'll try to make it simpler
it really is not.
light hemlock
Yeah, i just don't know what do i need exactly
stone marlin
I usually do that sklearn multilabel binary-izer and stick whatever I need on the end of the df, idk why I never thought to do that solution above. Sheesh.
light hemlock
hot kayak
are you talking to me? because this is what I want to do and its just not workin...
Yeah, i used it on older projects , then just pip install -r requirements.txt
desert oar
stone marlin
I usually do that sklearn multilabel binary-izer and stick whatever I need on th...
there's also pd.get_dummies
stone marlin
You know, I never thought to do that on non-categorical data.
serene scaffold
!docs pandas.get_dummies
 arctic wedgeBOT
pandas.get_dummies(data, prefix=None, prefix_sep='_', dummy_na=False, columns=None, sparse=False, drop_first=False, dtype=None)```
Convert categorical variable into dummy/indicator variables.Yeah, I always use this for my categoricals. I didn't even think it would work with ints, haha. EDIT: (It does work with ints, for anyone reading this in the future, I just didn't know it!)
 stone marlin
Is this... a screenshot of a discord channel with a screenshot of data...? The holy grail.
 stone marlin
Oh, so there's legit just a column Outcome with those two values? Huh.
 marsh yacht
yea
i need the outcome column
but only true values
and just how bad the outcome column is the column is not a bool
so like i cant filter out simply
i can do it but itll take a little bit of space
stone marlin
Like, the best I can think of, because that col isn't a bool, is:
In [10]: df
Out[10]:
              outcome
0          True Thing
1         False Thing
2          True Thing
3  Another True Thing
4           False????

In [11]: df[df["outcome"].str.contains("True")].value_counts()
Out[11]:
outcome
True Thing            2
Another True Thing    1
dtype: int64
I would probably cut that column into two or something if I was gonna really be working on it. It's encoding two pieces of info, but it's one column, and that's really awkward.
marsh yacht
oh damn
stone marlin
This will work, but it won't if there's something "false" that still has the word true in it. Like, "Not True" will still come up in the outcome above.
stone marlin
No prob. You can expand the column if you like in this way:
In [14]: df = pd.DataFrame({"outcome": ["True None", "False None", "True 1"]})

In [15]: df["outcome"].str.split(' ', expand=True)
Out[15]:
       0     1
0   True  None
1  False  None
2   True     1
The output dataframe can then be appended, if you want.
marsh yacht
oh yea yea
stone marlin
(It may have to be converted to a type, but, you know, better than nothin'.)
marsh yacht
stone marlin
(It may have to be converted to a type, but, you know, better than nothin'.)
yep
serene scaffold
stone marlin
Is this... a screenshot of a discord channel with a screenshot of data...? The ...
this is the best thing I've read all day 
desert oar
marsh yacht
In general, expending a minimum of effort to explain your question and copy and paste a few items of data will make it easier for people to help you
 inland zephyr
Hello sorry to bother you all
is anyone have good suggestion for image embedding model references? I try using Arcface VGG and Facenet, but still unsatisfied for several faces recognition cases
 untold hare
Does anyone know any situation where a deep CNN in Tensorflow would sometimes "stop learning"?
Situation: I have a deep CNN which I use to classify images. The images are numpy ndarrays and the labels are numpy vectors of 1's and 0's to indicate presence or not. I am running a few Conv2D layers using RELU activation, then a flatten, and a few Dense Layers also with RELU. Output layer is softmax and loss function is sparse categorical crossentropy. This is the results after training and validation:

This is another session, no code change
 desert oar
@untold hare the first one seems like an error in your code or data
i find it hard to believe there was no code change
untold hare
desert oar
i find it hard to believe there was no code change
I guarantee you it is not
desert oar
untold hare
I guarantee you it is not
is this in jupyter notebook?
untold hare
I literally ran the second one the moment after saving the first plot
No, I have it in a conda env locally
desert oar
you can use conda envs as jupyter kernels
so you ran a script?
the data didn't change?
did you set a random seed?
untold hare
I have set random seeds in the places I know where there is some RNG going on
untold hare
desert oar
did you set a random seed?
I read the images from disc, normalize em, check normalization is ok, check for nan's, split em up into three sets (training, testing, validation). There is shuffling involved in the split so I set a seed there. Then I start training.
desert oar
in a script? like a .py script?
untold hare
Yeah it's python
desert oar
and you run it with python train.py or whatever?
untold hare
yeah
desert oar
so you aren't entering commands into ipython or anything like that?
untold hare
No, i'm oldschool lol I don't know how to use jupyter and those things
Just regular ol python in an anaconda environment
I forgot to add I have some dropout layers as well, but those are seeded
stone marlin
Pucccch. I don't know how to solve your problem, but.
untold hare
stone marlin
Pucccch. I don't know how to solve your problem, but.
Hey mel, I figured I might drop you an @ for this but didn't want to seeing as you might have been busy 😄
stone marlin
The first one does look like an error --- hm. Second one seems pret normal though.
untold hare
Yes, I know. First one seems very sus
stone marlin
Literally I would have asked you the same thing as salt rock. I have no idea, that's wild.
untold hare
I'm confused out of my head seeing as there was no code change at all between those, and I have seeded everything that I know is random. I figured maybe people here knew about a bug or maybe more places that needs to be seeded
stone marlin
I'm not a pro with NNs so I'm not exactly sure. You could drop your code in and I could try to repro it later. That's wacky tho.
!code
Wait, no.
What's the dang pastebin one.
untold hare
Hold on, I'll get a pic of the model
stone marlin
!paste
arctic wedgeBOT
Pasting large amounts of code
If your code is too long to fit in a codeblock in discord, you can paste your code here:
https://paste.pythondiscord.com/
After pasting your code, save it by clicking the floppy disk icon in the top right, or by typing ctrl + S. After doing that, the URL should change. Copy the URL and post it here so others can see it.
stone marlin
Whew, crisis averted.
untold hare
This is the layout of the model. Dropout layers are all seeded, so they should yield the same random drops every session.
 stone marlin
Hm, this is beyond my paygrade, but I will try to check it out a bit later. Hmmmm.
untold hare
stone marlin
Hm, this is beyond my paygrade, but I will try to check it out a bit later. Hmm...
No worries, as I said I just wanted to check if anyone had encountered a similar problem or knew about any bugs that might lurk in there. I realize this is maybe not a simple issue that is easy to solve.
desert oar
my guess is "something weird" happened
and as long as it doesn't keep happening then you're fine
untold hare
Sadly, it does 😅
desert oar
cosmic rays, who the hell knows
oh, it keeps happening?
now we're getting somewhere
untold hare
I get maybe 4/5 failed trainings and 1/5 successful
desert oar
!paste post the code
arctic wedgeBOT
Pasting large amounts of code
If your code is too long to fit in a codeblock in discord, you can paste your code here:
https://paste.pythondiscord.com/
After pasting your code, save it by clicking the floppy disk icon in the top right, or by typing ctrl + S. After doing that, the URL should change. Copy the URL and post it here so others can see it.
desert oar
in that case my guess is that you are modifying something on disk in a way that's persistent between runs
overwriting your checkpoint files or whatever
 worthy star
i have a question
 lilac dagger
shoot
worthy star
?
untold hare
Also the code is woefully undocumented as I usually try to document last thing I do. Personal thingie
lilac dagger
shoot your question
lilac dagger
wait i have a better joke
arctic wedgeBOT
5. Do not provide or request help on projects that may break laws, breach terms of services, or are malicious or inappropriate.
worthy star
i have a code that can shut down someones internet and anything around it for an entire month?
does it sound cool
desert oar
thanks, this is helpful
lilac dagger
well no-one can physically stop you from crafting malicious code but you can't talk about it here
or ask hellp of it
lilac dagger
worthy star
i have a code that can shut down someones internet and anything around it for an...
eh?
arctic wedgeBOT
:incoming_envelope: :ok_hand: applied mute to @worthy star until <t:1641446529:f> (9 minutes and 59 seconds) (reason: burst rule: sent 8 messages in 10s).
lilac dagger
lmfoa
desert oar
@untold hare does it happen when you pass .fit(..., shuffle=False)?
untold hare
desert oar
<@!161152876415025153> does it happen when you pass `.fit(..., shuffle=False)`?
Does fit shuffle the data? Interesting. I will give it a few runs and get back to you, thanks!
desert oar
untold hare
Does fit shuffle the data? Interesting. I will give it a few runs and get back t...
yes, but normally that's a good thing
i have no idea, i'm pretty stumped honestly. i don't have a discrete gpu on this computer so idk if i want to try running it
untold hare
desert oar
yes, but normally that's a good thing
Of course, but I didn't know this 😄
desert oar
TensorFlow
Model groups layers into an object with training and inference features.
untold hare
As we say at work: 5 hours of debugging can save you 5 minutes of reading documentation
desert oar
that's a good one
iron basalt
TensorFlow
Sets all random seeds for the program (Python, NumPy, and TensorFlow).
untold hare
iron basalt
https://www.tensorflow.org/api_docs/python/tf/keras/utils/set_random_seed
Thank you!
desert oar
i figure it's ok in this case to not shuffle because they're already shuffling the data for the train/test split
ooh wait it shuffles before each epoch
iron basalt
Btw, os.walk is not necessarily deterministic. You could be adding images in random order each time.
untold hare
Isn't shuffling per batch a good thing since the model might start overfitting otherwise?
iron basalt
A quick fix would be to sort by filename.
untold hare
iron basalt
A quick fix would be to sort by filename.
That's a good point, i'll do that
untold hare
desert oar
ooh wait it shuffles before each epoch
Also the shuffle=False did not help, still produces different results between runs
desert oar
does it matter what order the images get added in?
untold hare
I'll try to set global seed and change os.walk like @iron basalt suggested
desert oar
with all that shuffling, i would think the image loading order shouldn't matter
stone marlin
TIL os.walk isn't deterministic.
iron basalt
desert oar
with all that shuffling, i would think the image loading order shouldn't matter
But it's not deterministic.
While the split is seeded, the original input array may be random each run different.
desert oar
sure, but is that important? they read it all into memory up-front and then shuffle. it's not like they're using a data loader
fair enough
actually that's a really good catch. i'll have to keep that in mind
arctic wedgeBOT
:incoming_envelope: :ok_hand: applied mute to @worthy star until <t:1641447248:f> (9 minutes and 59 seconds) (reason: chars rule: sent 6000 characters in 5s).
iron basalt
It probably does not matter, but remove all possible causes of the runs being different is the goal here.
Program determinism is tricky sometimes because of stuff like this. It can also depend on your hardware as some CPUs may have non-deterministic floating point stuff, etc. But it probably does.
desert oar
how do people normally store datasets of images? hdf5?
assuming they've already been processed from jpg or whatever
binary blobs in a database?
iron basalt
Random rounding of floats can improve accuracy, but it's no longer deterministic.
Random rounding tends to be better than fixed rounding rules.
desert oar
interesting, better than using 16-bit floats?
i have read that can help accuracy as well as obviously reducing memory usage
iron basalt
It applies to any bit count, most CPUs will not have random rounding because they want some determinism, but from some experiments done it would have better results if you give up the determinism.
iron basalt
However, floating point arithmetic is often different across different machines and so stuff like video games that use lockstep networking will often used fixed point precision instead, even though it's often slower.
(like starcraft 2 for example IIRC)
Because it needs to be deterministic to work, the different machines can't have different outcomes.
But for ML, you might not care and can benefit from this trick.
desert oar
makes sense
untold hare
So, I've made the modifications now. I'm a let it run 5 or so times or until I see any change in behaviour. I should add that I'm on tensorflow 2.5 because my conda env didn't want to work with 2.7, so I have no set_global_seed function, instead I set random.seed, np.seed, and tf.random.set_seed instead
Thanks for the great help! You caught some stuff that I had no idea about 😄
iron basalt
Btw walk uses listdir, and from the python docs:
 os.listdir(path='.')

    Return a list containing the names of the entries in the directory given by path. The list is in arbitrary order, and does not include the special entries '.' and '..' even if they are present in the directory. If a file is removed from or added to the directory during the call of this function, whether a name for that file be included is unspecified.
The list is in arbitrary order
untold hare
Yes, I have added a .sort on the file list after the walk
so it should get alphabetically sorted
iron basalt
*lexicographically
untold hare
Still seeing some different results sadly
1'st and 2'nd run was similar, not learning as it should. 3'rd run is learning
iron basalt
stone marlin
TIL os.walk isn't deterministic.
It could be deterministic, but the python docs don't guarantee that, it probably depends on whatever the OS feels like and the general context. It could even just randomize it in the implementation just because.
stone marlin
It's good to know this stuff anyhow, haha, just in case I run into something weird in the future.
untold hare
If you decide to pick NN's up again you mean? 😄
I 110% understand what you mean when you said they were difficult to explain to customers lol
stone marlin
I promised them here that I'd learn re-learn some NNs and look at some new ones! I gott'a do it, it's on my to-do list, haha.
desert oar
untold hare
1'st and 2'nd run was similar, not learning as it should. 3'rd run is learning
can you print the gradient at each epoch?
untold hare
desert oar
can you print the gradient at each epoch?
How do I do that?
desert oar
untold hare
How do I do that?
Stack Overflow
I'm training neural networks in TensorFlow Keras by using basic code like this:
model.fit(x_train, y_train, epochs=5)
Is there a way to print out and also save the loss function value, the gradien...
you pass a function that gets called at each epoch
in this case all it has to do is print or save the gradient
untold hare
aah, callbacks, gotcha
untold hare
desert oar
https://stackoverflow.com/a/67763190/2954547
Ok, so I'm getting a bunch of arrays as output. Variables and Bias. What do I look for? changes in the variables between epochs?
desert oar
untold hare
Ok, so I'm getting a bunch of arrays as output. Variables and Bias. What do I lo...
are they huge, or tiny?
untold hare
desert oar
are they huge, or tiny?
the numbers or the arrays?
desert oar
the numbers
untold hare
No, I wouldn't say so. This is from a successful run and they seem to be in the .0x order
desert oar
ok. i'm wondering if you're hitting near-0 gradients and the model stops learning. but normally it would still bounce around a bit, not go totally flat
you can also look at the average gradient per layer
untold hare
desert oar
ok. i'm wondering if you're hitting near-0 gradients and the model stops learnin...
That was one of my first guesses, but I ruled it out since we got a flatline, not a small jiggle like you normally get when your learning is slowing down
desert oar
right
https://machinelearningmastery.com/how-to-fix-vanishing-gradients-using-the-rectified-linear-activation-function/ apparently tensorboard has cool plots for this stuff

The vanishing gradients problem is one example of unstable behavior that you may encounter when training a deep neural network. […]
if you do a failed run, what do the gradient values look like? do they fall to exactly 0 or something?
untold hare
Just did one, they fall lower, around 5e-3
untold hare
desert oar
https://machinelearningmastery.com/how-to-fix-vanishing-gradients-using-the-rect...
Ok so I have discovered something interesting. If you look at the model layout that I posted here: #data-science-and-ml message
You can see that I have quite many filters in the conv layers. I tried reducing them from 256->128 and 512->256. I get much more successful trainings now, maybe 2/3. I have seen previously in tensorflow that when I crank things up a lot it starts behaving weird, like getting a ~10% accuracy when it gets >90% before. I have never gotten a flatline like this though, but maybe it is some resource related thingie causing this.
I don't think that's the sole problem. Just had a horribly failed training over 15 epochs with the smaller model.
desert oar
huh, but 5e-3 isn't 0
are the actual parameter estimates changing at each epoch in a failed run?
are they changing a tiny bit? not at all?
untold hare
From the looks of it, not at all
desert oar
that's how the chart looked. but i'm curious about the actual numbers
untold hare
Epoch 0:
Epoch: 0
 [<tf.Variable 'conv2d/kernel:0' shape=(7, 7, 3, 128) dtype=float32, numpy=
array([[[[-1.13557996e-02,  2.01006103e-02,  1.66046806e-02, ...,
          -9.92844813e-03, -1.90516058e-02, -2.28788555e-02],
         [-1.71531655e-03, -2.92396173e-02, -1.23373559e-02, ...,
           1.88532490e-02, -3.01137734e-02, -2.76901051e-02],
         [ 1.03314370e-02,  8.91065132e-03, -3.58154299e-04, ...,
           7.11166067e-03,  2.41959114e-02,  1.03156036e-02]],
Epoch 6:
Epoch: 6
 [<tf.Variable 'conv2d/kernel:0' shape=(7, 7, 3, 128) dtype=float32, numpy=
array([[[[-1.13562988e-02,  2.01006103e-02,  1.70715395e-02, ...,
          -9.92844813e-03, -1.88494846e-02, -2.28788555e-02],
         [-1.71582482e-03, -2.92396173e-02, -1.17471032e-02, ...,
           1.88532490e-02, -2.99528260e-02, -2.76901051e-02],
         [ 1.03309127e-02,  8.91065132e-03,  4.12195368e-04, ...,
7.11166067e-03, 2.42567845e-02, 1.03156036e-02]],```what about between 6 and 7 for example
untold hare
Epoch: 8
 [<tf.Variable 'conv2d/kernel:0' shape=(7, 7, 3, 128) dtype=float32, numpy=
array([[[[-1.13562988e-02,  2.01006103e-02,  1.63121261e-02, ...,
          -9.92844813e-03, -1.88494865e-02, -2.28788555e-02],
         [-1.71582482e-03, -2.92396173e-02, -1.24857742e-02, ...,
           1.88532490e-02, -2.99528260e-02, -2.76901051e-02],
         [ 1.03309127e-02,  8.91065132e-03, -3.02641129e-04, ...,
           7.11166067e-03,  2.42567845e-02,  1.03156036e-02]],
Epoch: 7
 [<tf.Variable 'conv2d/kernel:0' shape=(7, 7, 3, 128) dtype=float32, numpy=
array([[[[-1.13562988e-02,  2.01006103e-02,  1.70692150e-02, ...,
          -9.92844813e-03, -1.88494846e-02, -2.28788555e-02],
         [-1.71582482e-03, -2.92396173e-02, -1.17500601e-02, ...,
           1.88532490e-02, -2.99528260e-02, -2.76901051e-02],
         [ 1.03309127e-02,  8.91065132e-03,  4.10888402e-04, ...,
           7.11166067e-03,  2.42567845e-02,  1.03156036e-02]],
those look almost identical but not quite identical
so they are just changing very very slowly
untold hare
I did not see any difference
untold hare
where can I see those? I thought the tf.variable was the gradients
untold hare
Those should be the gradient values for conv2d_1, shouldn't they?
desert oar
what are you printing here? trainable_variables?
i think those might just be the parameter values
i'm not really a tensorflow user
at least not in any serious capacity
untold hare
desert oar
what are you printing here? `trainable_variables`?
Yes, from what I understood those list all trainable variables, weights and bias and such in the model
desert oar
right, i'm wondering about the gradients with respect to those values. i would expect that they're all really tiny, ~0
untold hare
Code that logs these values:
class myCallback(tensorflow.keras.callbacks.Callback):
    def on_epoch_end(self, epoch, logs={}):
        with open('grads.txt', 'a') as log_file:
            log_file.write(f'Epoch: {epoch}\n {model.trainable_variables}')
yeah those aren't gradients, they're the parameter values at the current epoch
maybe this is just a case of vanishing gradients
idk if that's still an issue with relu
untold hare
It could be, yeah. I remember reading up on that in a book, and that RELU in particular was vulnerable to this
desert oar
i was under the impression of the opposite, that vanishing gradient was a much bigger problem before relu was introduced
e.g. with sigmoid activation
untold hare
Yeah I need to re-read this, two seconds. I remember RELU having some issue though
Yeah, so apparently keras uses some Glorot initialization by default, and that for RELU one should use He instead, to avoid vanishing grad
desert oar
i think you get some cases with too many 0 gradients with relu, but i never heard of it "killing" the entire NN
untold hare
I'm gonna try that, two seconds
desert oar
oh interesting
untold hare
Ok right so the RELU problem I was thinking about is called "Dying RELU:s" and what happens is that some neurons just dies and start outputting 0
Solution for that is to use something called Leaky RELU instead
I'm gonna try to change the initialization strategy first
desert oar
yeah that's what i was saying
but that shouldn't kill the entire network in a few epochs
untold hare
Ok so He intialization didn't work, gonna try to use SELU with lecun intialization instead of RELU
desert oar
idk
untold hare
if that does not work I'm going to attempt to add batch normalization as a last ditch attempt
untold hare
according to the book I read BN helps against vanishing grad when it occurs later in training, but RELU with improper initialization can cause van grad to happen early
desert oar
hmmm
what happens if you train on a sample of the dataset?
or if you remove a layer?
untold hare
remove a layer? You mean like running the shallow version of the model with just CNN input and dense output?
desert oar
yeah
but at this point we're both just guessing
can't hurt to try the other activations if you want to
untold hare
Ok, so I switched RELU + He out for SELU + LeCun and 5/5 times now it is learning. So the issue could have been related to RELU and its initialization causing some vanishing gradient-like problem. SELU does not learn as well as RELU though, so I am getting about 75% after 15 epochs.
untold hare
desert oar
at least it learns now
So it is! Thank you for all the help with this! 😄 I think you were correct in that this was the vanishing gradient problem and without you pointing that out I would prolly never had thought of that. Looked too much like a bug in tensorflow to me, and not a mathematical issue
odd meteor
untold hare
This is another session, no code change
This learning curve is very much better than the 1st static learning curve, however, its performance is still very bad. It's greatly overfitting but let's leave that problem for now and face the more serious one.
Something is definitely wrong and I can't figure it out yet. Can you restart and retrain for the third time? Did the learning curve differ from the first two?
At this point I'd have to plea 😀 Lol pleaseeeeeeeeeeeeee can you use Jupyter notebook to build the same neural nets? I want to see the outcome
odd meteor
untold hare
So it is! Thank you for all the help with this! 😄 I think you were correct in t...
Ooh great it's been resolved 😀
untold hare
odd meteor
This learning curve is very much better than the 1st static learning curve, howe...
No, it is not overfitting. Overfitting would show itself as an increase followed by a decrease in validation accuracy at the same time as training accuracy remains constant or improves. There is no such thing in those graphs.
odd meteor
untold hare
No, it is not overfitting. Overfitting would show itself as an increase followed...
Dang, that's correct... I just realized the lines are actually two. 🤦🏾♂️ Just waking up from bed 😂😂
untold hare
odd meteor
Dang, that's correct... I just realized the lines are actually two. 🤦🏾♂️ Just...
No worries, just try to read through all the information before you give advice next time. I spent a lot of effort presenting the issue, so I think it's only fair if people answering do the same.
odd meteor
untold hare
Ok, so I switched RELU + He out for SELU + LeCun and 5/5 times now it is learnin...
I've never heard of SELU and LeCun before. I'll have to check 'em out
 ashen umbra
Hi, i have a list of list that looks like this

I was wondering how can the duplicates be removed
I have done the following but it wont remove the more than one duplicates

Any advice would be really helpful!
 warm jungle
well - if the structure of all of those dictionaries is identical: ```python
l = [[{'work': 2}, 2], [{'work': 6}, 4], [{'work': 6}, 4], [{'work': 6}, 4]]
[[{'work': y[0]}, y[1]] for y in set((x[0]['work'], x[1]) for x in l)]
[[{'work': 6}, 4], [{'work': 2}, 2]]```
arctic wedgeBOT
:incoming_envelope: :ok_hand: applied mute to @still estuary until <t:1641471326:f> (9 minutes and 59 seconds) (reason: duplicates rule: sent 4 duplicated messages in 10s).
 jolly nest
warm jungle
well - if the structure of all of those dictionaries is identical: ```python
>>>...
jolly nest
warm jungle
well - if the structure of all of those dictionaries is identical: ```python
>>>...
but what if it isn't?
!e ```py
lst = [[{'work': 2}, 2], [{'work': 6}, 4], [{'work': 6}, 4], [{'work': 6}, 4]]
def filter(lst):
filtered_lst = []
for l in lst:
if l not in filtered_lst:
filtered_lst.append(l)
return filtered_lst
lst = filter(lst)
print(lst)
@jolly nest :white_check_mark: Your eval job has completed with return code 0.
[[{'work': 2}, 2], [{'work': 6}, 4]]
sure - depends whether it matters; but you're scanning the results for every entry - doesn't matter for small data, but it might if it's big
jolly nest
if it was a list of hashable objects I would've introduced my x = [*{*x}] trick
if it was big data I would store it in hashable format
warm jungle
yeah, which may well be the right thing to do anyhow; but need more context to decide
 rapid pasture
Hello guys, Sorry to interrupt you here
Anyways, I am doing some research on noise reductions of sound signals
 wicked grove
odd meteor
Dang, that's correct... I just realized the lines are actually two. 🤦🏾♂️ Just...
wicked grove
odd meteor
Dang, that's correct... I just realized the lines are actually two. 🤦🏾♂️ Just...
Hello,I'm trying to solve a classification problem w transfer learning and im using efficientnetb6
rapid pasture
rapid pasture
Anyways, I am doing some research on noise reductions of sound signals
And wondered if I could use LOESS smoothing for it
I mean, is it an appropriate way to remove noises from sound curves
wicked grove
wicked grove
Hello,I'm trying to solve a classification problem w transfer learning and im us...
This model takes an input of 528 but all my images are 512×512...will this decrease the accuracy or cause further errors??
lapis sequoia
wicked grove
This model takes an input of 528 but all my images are 512×512...will this decre...
As long as you manage to convert images to 528x528 it will not cause error. You can add extra padding. Although that answer is to say that it 'will work', I'm not really sure if it would be less accurate or not.
wicked grove
lapis sequoia
As long as you manage to convert images to 528x528 it will not cause error. You...
If i don't convert it to 528×528?
Oh okayy i will try adding padding
 upbeat prism
When training a neural network, we usually take a small part of the training set and make a validation set. We run the trained neural network on the validation set. We do that to check for overfitting, right? Is there any other reason we do that?
 mighty spoke
Hi does anyone know how I can find 34% either side of the median in my gaussian like histogram plot?

 lilac iris
hey, so i wanna learn machine learning and ive decided to challenge myself by making my own ai library from scratch
so far im watching 3blue1brown's series and am gonna watch sentdex's nnfs
any video suggestions?
upbeat prism
mighty spoke
Hi does anyone know how I can find 34% either side of the median in my gaussian ...
upbeat prism
lilac iris
any video suggestions?
learn basics of statistics next to it, but no idea about videos.
lilac iris
linear algebra and stuff?
3b1b also has a series on that, ive watched a couple of them to make glsl shaders
rapid pasture
Hello guys, can we remove noise from an acoustic signal using the LOESS smoothing?
I have to do a research about noise reduction in the sound industry, but got totally lost
upbeat prism
lilac iris
linear algebra and stuff?
not linear algebra - I mean that's also useful but really statistics. The statquests videos are good. They are extremely basic but very good to build an idea about what's going on. But in the end, maybe just take one of the books that first cover all the math and then the ML/DL stuff and just code on your own projects on the side?
edX
Take online machine learning courses from top schools and institutions. Learn machine learning skills and concepts online to advance your education and career with edX today!
or just take one of those lectures?
 normal stream
hi, i want to play a bit with the AI that transform text into images...do you have some easy to use github repo?
odd meteor
upbeat prism
When training a neural network, we usually take a small part of the training set...
Not exactly. Just as the name suggests "Validation Set' we use the validation set to validate or guage how well our model generalizes on unseen data.
Next, we then use model result from the train set and validation set to check if our model is overfitting or not
serene scaffold
ashen umbra
Hi, i have a list of list that looks like this
I'm not sure how this is a data science question, but here's a data science-oriented solution.
In [20]: stuff = [[{'work': 6}, 3], [{'work': 7}, 2]]

In [24]: pd.DataFrame([(d[0]['work'], d[1]) for d in stuff], columns=['work', 'value']).drop_duplicates()
Out[24]:
   work  value
0     6      3
1     7      2
honestly I still don't fully comprehend how the validation set differs from the test/evaluation set 
||but then at times I also don't fully comprehend how it is that I do data science professionally.||
odd meteor
serene scaffold
honestly I still don't fully comprehend how the validation set differs from the ...
Validation set and Test Set are both Holdout Set. The model is trained on the train set only.
Ordinarily the data set is meant to be divided into 3 sets.
-Train set
-Validation set
- Test set
However, in scenarios like in Hackathons, 2 datasets are usually given. Train and Test data (minus the submission sample) so that's why we use train_test_split to further split the Train set into X_train and X_test
So X_test == Validation data
X_train == Train data
Test set == Test data.
The hyperparameters tunning is done on the validation set so we can then use the Test set (Test data) for making our final prediction.
So technically, Validation/Evaluation set & Test set == Holdout set
desert oar
serene scaffold
honestly I still don't fully comprehend how the validation set differs from the ...
bad terminology basically
like emyrs said, they are two different kinds of holdout sets
imo the "validation" and "test" labels should be swapped
but 🤷♂️
serene scaffold
@odd meteor @desert oar thanks for your answers
upbeat prism
odd meteor
Not exactly. Just as the name suggests "Validation Set' we use the validation se...
model result?
lilac iris
normal stream
hi, i want to play a bit with the AI that transform text into images...do you ha...
text into images? what do you mean? setting the concept of ai aside, could you explain how you would if you wanted a human to do something like this?
you can always search for a keyword in a database of images

or if you're talking about something for captcha, there are probably libraries to make it weird. you could also make your own using pillow
upbeat prism
so I have a data set with 200k entries. I do a 2 class classification ("bianry") i.e. I have two labels. I have 50% of label A and 50% of label B. I do 80% for training and 20% for validation. The first epoch looks like this:
Epoch | Training Loss | Validation Loss
0 | 107.355379268527 | 0.019617185979
Now I am really suspicious that the traing loss is that different to the validation loss. Why would my network work that much better on the validation set after only 1 epoch?
desert oar
lilac iris
text into images? what do you mean? setting the concept of ai aside, could you e...
i believe there are actually models that do this now. they can generate images from captions
i can't remember the name.. was a recent development that i read about
lilac iris
yea ig there are probably
but it seems impractical when you could get better results by just searching from a big database
desert oar
upbeat prism
so I have a data set with 200k entries. I do a 2 class classification ("bianry")...
that does seem odd. did you forget to shuffle your data before splitting? what loss function are you using? are you doing batch gradient descent? what kind of model is this? i assume it's a neural network because you said "epochs"
lilac iris
depends on your original need
desert oar
show your code @upbeat prism and ideally also link to the dataset you're using if it's available
desert oar
lilac iris
but it seems impractical when you could get better results by just searching fro...
depends on what you are trying to do, but yeah
i am sure google et al have been working on "text <-> image" vector search type of stuff for a while
odd meteor
upbeat prism
model result?
Model result i.e the result of the metric you used to guage your model performance
 fiery adder
Hello. I am introducing to you our newest state of the art tabular model incorporating attention and gating. https://github.com/radi-cho/GatedTabTransformer Stars for the repository or any feedback will be highly appreciated!

GitHub
A deep learning tabular classification architecture inspired by TabTransformer with integrated gated multilayer perceptron. - GitHub - radi-cho/GatedTabTransformer: A deep learning tabular classifi...
arctic wedgeBOT
Hey @upbeat prism!
Uh-oh! It looks like your message got zapped by our spam filter. We currently don't allow .txt attachments, so here are some tips to help you travel safely:
• If you attempted to send a message longer than 2000 characters, try shortening your message to fit within the character limit or use a pasting service (see below)
• If you tried to show someone your code, you can use codeblocks
(run !code-blocks in #bot-commands for more information) or use a pasting service like:
upbeat prism
arctic wedge
Hey <@211756283584446475>!
and where is it now? o.O
upbeat prism
desert oar
show your code <@!211756283584446475> and ideally also link to the dataset you'r...
I search for gravitational wave signals in a noisy strain. Think a microphone recording non stop but sometimes someone says something and you wanan figure out when something was said.
I generate 100k pure signals of 1s and 100k pure noise samples of 1s. I Take the 100k signals and inject it into the 100k noises. I then have 100k noise+signal samples. I then shuffle the same 100k pure noise samples int othe 100k noise+signal samples resulting in 200k samples.
Because I just shuffled it, I don't shuffle the data set before splitting. I also don't shuffle it while looping over it. I can change the seed and get a total different data set.
I make a 80/20 split and average the loss over the amount of batches. Resulting in:
Epoch training loss validation loss
0 | 0.046411005077 | 0.000001013280
Before I did the averaging wrong but the values are still terrible. There is no explanation really to have such a difference, not in the first epoch. At least to my knowledge.
Here's my train.py https://bpa.st/2YIA there are a ton of more files but I can't share the repo. The data generation can be assumed to be correct since I looked over it with someone who knows it quit well.
Also note: Now the validation loss doesn't change at all, it stays at 0.000001013280
also, since I have two labels and each label has teh same amount of samples, I don't use any weights for the loss.
 midnight fossil
hi
upbeat prism
Furthermore: test data is 10s. I have a window of 1s (since my NN takes 1s). I move through it with a sliding window of 0.1s => I have 90 evaluations. For eac hevaluation I expect a value between 0 and 1. I get this plot. Note the last plot is the "score" from my NN. It's not at all distributed between 0 and 1. (but that's also not a lot of training since the validation loss doesn't do anything)

also everything is drawn uniformly.
midnight fossil
Damn
upbeat prism
desert oar
that does seem odd. did you forget to shuffle your data before splitting? what l...
the model is a bunch of convolutional layers and some dropouts.
Basically this (not my code but I use their paper) https://github.com/gwastro/ml-training-strategies/blob/master/Pytorch/network.py

GitHub
Data release for the evaluation of different training strategies for deep learning gravitational wave search algorithms. - ml-training-strategies/network.py at master · gwastro/ml-training-strategies
desert oar
@upbeat prism if something doesn't change at all, consider it's possibly a vanishing gradient situation. do you have learning curves? e.g. loss and accuracy at each epoch
it's hard to say anything intelligent about loss numbers except to compare them on a relative scale
did you compute accuracy, f1, etc?
upbeat prism
desert oar
it's hard to say anything intelligent about loss numbers except to compare them ...
but on the first epoch, they should be kinda similar no? I don't see a reason why not.
I can't really compute accuracy and f1 since those don't make sense for the little 10s test input. Furthermore to be able to compute accurancy I'd have to set a treshhold because I have a "probabilistic" value between 0 and 1 but most values are very close together, so I can't set a resonable treshhold. They aren't distributed between 0 and 1.
The measurement I use is something called "sensitivity distance". The actual test data is 1month long (compared to my 10s) and has way way more signals. Then I basically could compute accurancy but again, since it's "continuous" data, that doesn't make much sense.
I think the fact that I have:
- No change in validation loss
- Values are very close together and not fully take advantage of the interval [0,1]
Is a hint that my implementation (either data generation or the actual pytroch implementation) sucks. The NN should work, there are papers about it.
I really think it's an issue with how I use pytorch. hmm.
that's what I expect.
 arctic wedgeBOT
:incoming_envelope: :ok_hand: applied mute to @dull pumice until <t:1641500906:f> (9 minutes and 58 seconds) (reason: duplicates rule: sent 4 duplicated messages in 10s).
normal stream
lilac iris
text into images? what do you mean? setting the concept of ai aside, could you e...
i saw some funny app online that transform to image whatever you write in the prompt......i'm an AI noob so i barely know how to move, i was searching for something easy to use....the name is something like generative-adversarial-networks......
i found on github VQGAN-CLIP that do this kind of stuff but it's kind of hard for me
 mild dirge
Anyone know what type of graph this is?

 tidal bough
mild dirge
Anyone know what type of graph this is?
tidal bough
mild dirge
Anyone know what type of graph this is?
that just looks like a normal line graph, just with error bars
and, uhh, only two points for each line, lol
mild dirge
yeah think it's jsut an error bar, it's from some R code of my prof
just rewriting it to python because I have no clue how R works and it's not that relevant for the course :/
serene scaffold
Sorry @feral spoke, I had to remove your comment, as this isn't a platform for seeking out paid opportunities.
 feral spoke
serene scaffold
Sorry <@!601276368436723723>, I had to remove your comment, as this isn't a plat...
feral spoke
serene scaffold
Sorry <@!601276368436723723>, I had to remove your comment, as this isn't a plat...
My bad, I was looking for an opportunity in the field of data analyst.
But thanks for the heads-up will keep this in mind
Do we have any specific channel were open positions are posted @serene scaffold?
serene scaffold
feral spoke
Do we have any specific channel were open positions are posted <@!25369636695231...
No, we don't do that
feral spoke
serene scaffold
No, we don't do that
Don't you think that it can benefit people from the community?
Like what's the thought process behind not having such a channel?
serene scaffold
feral spoke
Don't you think that it can benefit people from the community?
Like what's the t...
We already spend a lot of time moderating the server, and we don't want to have to deal with job listings that are unethical, scams, etc.
there are already plenty of websites that handle job searching better than we ever could.
feral spoke
serene scaffold
there are already plenty of websites that handle job searching better than we ev...
Yes, I understand that.
But here the roles can only be related to python and hence benefit the community.
Plus addressing your part on unethical and scam issue I understand but people can verify on their own.
I am just giving a suggestion
serene scaffold
feral spoke
I am just giving a suggestion
Thanks for the suggestion. Unfortunately this is something we've discussed at length internally, and we know it's not something we want to take on. If you have other suggestions or feedback, let us know in #community-meta.
 rare grove
I made a thing and I'm not sure what words to use to describe it exactly, but I think it falls into machine learning data sciency territory.
Using the zxcvbn-python library as a sort of reference for password anatomy, I created a generator that uses a pair of stochastic models similar to Markov chains to produce candidate passwords. One model stores structural information about the composition of passwords, and the other stores actual data (like wordlist entries). The system samples from the structural model and then tries to populate the structure either by sampling the data model or calling one of several functions to generate random data conforming to some pattern.
The result produces very believable password guesses. I haven't tested it on a production data set yet but I'm optimistic it will perform well. What I'm trying to figure out is... what have I built? Is there a term for this kind of thing, and am I reinventing some known machine learning algorithm that I could have saved myself a lot of time by reading about?
 brave sand
so I got a 3070 for some basic ml and gaming, is 8 gb enough to fit larger models?
vague moon
Hey, I am having some trouble trying to get results for single predictions from my cnn model that has multiple outputs. With binary outputs I have used result = cnn.predict(test_image) print(result[0][0]) which worked, I would either get a one or a zero back, but now I am getting results such as 4.0368886e-36 9.390638e-27 0.005686598 1.0 0.90156376 1.0 1.0despite showing my webcam the same thing with amodel that has 99% accuracy
serene scaffold
brave sand
so I got a 3070 for some basic ml and gaming, is 8 gb enough to fit larger model...
what do you mean by "larger"? you can train any model that takes less than 8 GB to train.
serene scaffold
brave sand
Like is it enough? Do I need at least 12 gb?
it depends on what model you're training, how much training data you have, how much of it needs to be in memory at a time, etc.
there's no one-size-fits-all "this GPU is big enough for machine learning".
brave sand
so the 3070 will suit me well until I need more vram and need to upgrade
right? what gpu are you using?
serene scaffold
my gaming computer has a 3070, coincidentally. Though my company has a high-performance computer for model training.
for as much as GPUs cost (and their availability these days), I think the 3070 will be fine.
what ML do you plan to do?
brave sand
ive been doing some computer vision, projects like SLAM etc. trying to get into reinforcement learning but I have to learn the basics first
 tidal patrol
how much Pandas and Numpy should ik before CV?
brave sand
serene scaffold
my gaming computer has a 3070, coincidentally. Though my company has a high-perf...
is ur gaming computer enough for prototyping? or training?
serene scaffold
brave sand
is ur gaming computer enough for prototyping? or training?
you'll have to look at the memory overhead of the algorithms you want to train to figure out if 8 GB is enough for your purposes.
brave sand
serene scaffold
you'll have to look at the memory overhead of the algorithms you want to train t...
since I’m not that advanced yet, I think I’ll keep the 3070
in the future if I see a 3080 I’ll buy it
 twilit jay
you're not doing workloads on the 30x I hope?
 slender sand
What is the fastest, simplest way to detect if an image is of a person or not?
I want to use it with a crawler so I need something simple and fast
thin palm
what's up Python gang
I have a question about scaling. Are we supposed to scale the X_test as well? during the train_test_split?
for example,
scaler.fit(X_train) #fit scaler to feature
scaler.transform(X_train) #scale```
Now what do we do with X_test?ahh I think we just transform
brave sand
twilit jay
you're not doing workloads on the 30x I hope?
yeah I am?
serene scaffold
slender sand
What is the fastest, simplest way to detect if an image is of a person or not?
Are you trying to develop a model that does that, or use one that already exists?
brave sand
just use mobilenetssd
slender sand
already exists, preferably
i'm not looking for faces in crowds, these will plainly be either people or palm trees or handkerchiefs etc
serene scaffold
So what you really need is a face detection model
Have you looked into what options exist?
Also, while face detection is probably one of the more researched areas of image processing, I would temper your expectations about finding a "fast and simple" solution. There might not be one that's as fast as you want, that's also as accurate as you want
slender sand
i've been looking at cv2 but not having tons of luck
i've built object detection models with tensorflow but I don't think I need anything that heavy for this
brave sand
any idea how I could predict the result of a tennis match?
I was thinking of use SVM and a logistic regression model?
slender sand
sounds like a neat task
tried to do that with a NHL dataset but just way too many factors for an amateur
brave sand
slender sand
sounds like a neat task
neat?
yeah, I'm doing tennis so it shouldn't be too complex
slender sand
yeah, fun, interesting, stimulating
brave sand
I already have the csv file, now what?
slender sand
well what's in it?
brave sand
all the tennis match results from 2000-2017
slender sand
court conditions? player history I assume? any injury reports?
brave sand
just aces, double faults, serve points, etc
ace = absolute number of aces
df = number of double faults
svpt = total serve points
1stin = 1st serve in
1st won = points won on 1st serve
2ndwon = points won on 2nd serve
SvGms = serve games
bpSaved = break point saved
bpFaced = break point faced
slender sand
I'd start by maybe creating feature groups with nearest neighbors and then checking feature importance with a classifier
but like i said, amateur
serene scaffold
@brave sand I guess this dataset doesn't give you timestamps? It would be interesting to see if players improve or get worse over time, and take that into account
brave sand
serene scaffold
<@!765319974469238814> I guess this dataset doesn't give you timestamps? It woul...
https://www.kaggle.com/gmadevs/atp-matches-dataset
no, I don't think so

ATP tournament results from 2000 to 2017
so it doesn't show timestamps
but I could figure it out though
slender sand
so players with fastest serves will potentially outperform against players who get caught looking at aces a higher % of the ttime
brave sand
yeah, that does make sense. noob question but there's like several csv files, do I combine them? or keep the seperate?
brave sand
so I could test it on one csv file correct?
serene scaffold
brave sand
yeah, that does make sense. noob question but there's like several csv files, do...
do they have the same schema? (like column names and types)
slender sand
depends on the size
brave sand
yeah they do
serene scaffold
what are the names of the files?
slender sand
how many total records?
brave sand
atp_matches_2000.csv
serene scaffold
oh I see, each csv is for a different year
serene scaffold
so you can use time as a feature, just to a limited extent.
brave sand
yeah, like you were saying
I could see if they improve or not improve
or get injured based on poor performance
slender sand
the whole thing is under 100k rows, I think you can load it all
17csvs x ~3300 records ea
brave sand
but don't I need to save one for testing?
to test my model on that dataset that it's never seen?
slender sand
thats done in the script usually
though you can load 2 separately if you prefer
or you can just load the one and tell it to train on x% and test on y
brave sand
but if I just load the year 2000, wouldn't it not be accurate?
so I have to do something like this?
df = pd.read_csv('/home/ethan/Documents/Machine Learning/archive/atp_matches_2000.csv')
but multiple times?
brave sand
so I'll do that 16 times
slender sand
just make a loop.... tell os to give you a list of files, then make an empty df, and every loop just open the csv and concat
slender sand
really for under 60k records i'd do that once and at least save a copy of the full file
brave sand
so combine them your saying?
slender sand
loading that many small files will be nearly instant with low overhead. But if for any number of reasons you don't want to do that every time you run your script, you could keep that number of records in one file no problem
i usually split between 200k-400k records depending on number of columns
 low plover
So it would be ok to have repeat data if that data point is unique but the data is the same as a past point. Like two teams run the same heroes twice and the result is the same both times
 plucky ravine
I need help i am working with my college project
In that project i want to detect the blank line (i.e. ________ ) using opencv but its works in only one image if i insert different image its not detect the line
If anyone have idea please DM me
😊
 sacred oracle

YouTube

Generative Adversarial Networks (GANs) are a model framework in which two models are trained concurrently, one learns to generate data from the same distribution as the training set and the other learns to distinguish true data from generated data. In this video, you will learn how to implement a basic GANs model using TensorFlow on the MNIST da...
untold hare
You don't need GAN's or CNN's to detect a horizontal line. That's overkill on so many levels. Even a simple dense network can detect horizontal lines no issues. OP also stated that he/she uses OpenCV so why are you sending tensorflow videos?
Sobel filter is what OP is after:
https://docs.opencv.org/4.x/d5/d0f/tutorial_py_gradients.html
canny also works: https://docs.opencv.org/3.4/da/d22/tutorial_py_canny.html
slow vigil
Anyone familiar with pandas resample()? I'm trying to convert some stock data from minute candles to 5-minute candles and the values aren't matching up with the values on the charts from the data provider and I'm also getting things where it'll be like 3:08 and I'll already have a candle for 3:10 in my dataframe
I know there's the 'close=right' setting but I'm not sure if that's what I'm after
serene scaffold
!docs pandas.DataFrame.resample
arctic wedgeBOT
DataFrame.resample(rule, axis=0, closed=None, label=None, convention='start', kind=None, loffset=None, base=None, on=None, level=None, origin='start_day', offset=None)```
Resample time-series data.

Convenience method for frequency conversion and resampling of time series. The object must have a datetime-like index (DatetimeIndex, PeriodIndex, or TimedeltaIndex), or the caller must pass the label of a datetime-like series/index to the `on`/`level` keyword parameter.hmm, I haven't used it before
slow vigil
I've fooled around with label='right' and closed='right' but i don't think that was working
What I'm really wondering is if the first value of my dataframe is at like 3:03 and I resample it into 5-min buckets is it smart enough to do that without mixing the data
because that's what it kind of feels like is happening
or like if I try to resample and the last row was at 5:04, it probably won't just leave out the last 4 rows
or like if I'm missing a candle
does it know to use the timestamps and not the number of rows?
and what if I'm missing 6 rows
 vast yacht
AI/ML is one those things that really needs investing a huge amount of time to actually do the job. I know what I should focus but school always get in the way. I cant focus on important things and unnecessary subjects at school at the same time. If I split the time, my productivity will be splitted too. If I focus on what's important, I'd fail some subjects at school. school cant never give me enough practical knowledge. Any advice?
serene scaffold
vast yacht
AI/ML is one those things that really needs investing a huge amount of time to a...
what level of education are you currently in?
 desert bear
Hey, I have a question related to building a multi-class classification model. In my datasets I have some sequence of vectors that are unique for a specific class. Do you think that throwing this UNIQUE vector into an unsupervised model is a waste of resources? To classify these samples I can just use simple if condition and focus on these samples that are not so obvious
vast yacht
serene scaffold
what level of education are you currently in?
i'm a Data science junior at uni
serene scaffold
vast yacht
i'm a Data science junior at uni
Don't take advice from randoms on the internet at face value, but I would probably focus on doing well in the courses, even if you're not sure that what you're learning is what you'll actually need to apply on the job. You need the degree to be competitive in the job market.
Once you have a job, there's probably going to be time to catch up. (At least, that's how it has worked out for me.)
vast yacht
serene scaffold
Don't take advice from randoms on the internet at face value, but I would probab...
thanks for your advice. I'm the type of person who always want to give the best in everything I do and sometimes I burn myself out
wicked grove
serene scaffold
Once you have a job, there's probably going to be time to catch up. (At least, t...
Hello i have a doubt in numpy
dummy_IMG_rgb = np.ndarray(shape=(X_train.shape[0],X_train.shape[1],X_train[2],3),dtype=np.float32)
dummy_IMG_rgb[:,:,:,0]=X_train[:,:,:,0]
dummy_IMG_rgb[:,:,:,1]=X_train[:,:,:,1]
dummy_IMG_rgb[:,:,:,2]=X_train[:,:,:,2]
im trying to create a dummy array whose size is 3390,512,512,3 and want to copy the data to these axes but the above code throws this error ... could you please tell me why
<ipython-input-18-ffb33075ee34> in <module>
      2
      3 IMG_SIZE = (512, 512)
----> 4 dummy_IMG_rgb = np.array(shape=(X_train.shape[0],X_train.shape[1],X_train[2],3),dtype=np.float32)
      5 dummy_IMG_rgb[:,:,:,0]=X_train[:,:,:,0]
6 dummy_IMG_rgb[:,:,:,1]=X_train[:,:,:,1]```only integer scalar arrays can be converted to a scalar index
arctic wedgeBOT
:incoming_envelope: :ok_hand: applied mute to @lapis sequoia until <t:1641551505:f> (9 minutes and 59 seconds) (reason: duplicates rule: sent 4 duplicated messages in 10s).
warm jungle
pfft - so unreasonable 🙂 numpy.core._exceptions._ArrayMemoryError: Unable to allocate 570. TiB for an array with shape (8851744, 8851744) and data type int64
 south gull
yeah well, numpy is not all that great
the arrays are too low-level
unlike python lists
warm jungle
sure, but the performance is very different
warm jungle
I guess it's not just that - there are a lot of useful things for manipulating ndarrays; probably the main trade off is that you need homogeneous data
 muted sapphire
Hi everyone. Where should I ask a question about pytorch?
south gull
warm jungle
I guess it's not just that - there are a lot of useful things for manipulating n...
True
so many
 marble vapor
HeyHelloHi! Quick question! Whats a good image sample size for a training dataset?

 glass minnow
sure
<!DOCTYPE html>
<html lang="en">
  <head>
    <meta charset="UTF-8" />
    <meta http-equiv="X-UA-Compatible" content="IE=edge" />
    <meta name="viewport" content="width=device-width, initial-scale=1.0" />
    {% if title %}
        <title>Flask Blog - {{ title }}</title>
    {% else %}
        <title>Flask Blog</title>
    {% endif %}
  </head>
  <body>
      <!--
        We can write for loop inside code block
        what is code block?
        code block is a block of code that is indented(%) and surrounded by curly braces {}
    -->
    {% for post in posts %}
    <!-- {{}} we write variable inside this -->
        <h1>{{ post.title }}</h1>
        <p>By {{ post.author }} on {{post.date_posted}}</p>
        <p>{{ post.content }}</p>
    {% endfor %}
  </body>
</html>
jinja2.exceptions.TemplateSyntaxError

jinja2.exceptions.TemplateSyntaxError: Expected an expression, got 'end of print statement'

```.I am getting this error
please help
stone marlin
Do you have the python part of the code?
Usually, this error means that either your expression in the {{}}'s is malformed, or empty, or something. A lot of people do {{post.date posted}} and that's the issue, but you have it correct here. So the error might be on the python side.
glass minnow
thanks man i was able to figure out the issue
<!-- {{}} we write variable inside this --> this thing was causing error
stone marlin
Haha, ohhh, that's right. Flask is very strange about comments.
stone marlin
I used this video when I was teaching, it's something like "Full-Featured" Web App or something on youtube, so I saw a ton of students getting errors, haha. No problemo.
slow vigil
data = data.reset_index()
data = data.iloc[::-1]

for id, row in data.iterrows():
  if row['Time'].minute % 5 == 0 or row['Time'].minute == 0:
  try:
    extras = pd.DataFrame(data.iloc[:id])
    data = pd.DataFrame(data.iloc[id:])
    break
  except:
    data = pd.DataFrame(data.iloc[id:])
    break

data = data.sort_index(ascending=True)
Something is happening somewhere in this code that isn't allowing my dataframe to be sorted by that last line. It seems like using iloc on it changes the structure somehow, but it's still a dataframe object. I just can't operate on it anymore. I tried declaring those iloc calls explicitly as dataframes in the for loop but that didn't work. Not sure what happened. The original iloc call at the top did work to flip the dataframe
stone marlin
Just so I know, you're trying to get all the data before the first five minutes, or something like this?
slow vigil
I'm resampling data into 5-min buckets so I'm trimming off excess minutes that don't fit neatly into the buckets
stone marlin
Resampling with what? With sum? Or mean?
stone marlin
So, when you sort, nothing happens on the last line? If you switch to "False" nothing happens?
slow vigil
Checking now, but I believe it won't work because there are operations after this that also aren't being applied
upbeat prism
What could be the reason that a timeseries becomes nan nan nan after whitening?
slow vigil
stone marlin
So, when you sort, nothing happens on the last line? If you switch to "False" n...
didn't work
slow vigil
upbeat prism
What could be the reason that a timeseries becomes nan nan nan after whitening?
wym whitening
stone marlin
I don't think I've ever seen whitening return NaNs --- maybe you have two features which are exactly the same? If you post code, that'd help debug.
import random
import pandas as pd

df = pd.DataFrame(random.choices("abcd", k=100), pd.date_range("2022-01-07", freq="30s", periods=100))
df1 = df.reset_index()

df1 = df1.iloc[::-1]

for id, row in df1.iterrows():
  if row['index'].minute % 5 == 0:
    try:
        extras = pd.DataFrame(df1.iloc[:id])
        df1 = pd.DataFrame(df1.iloc[id:])
        break
    except:
        df1 = pd.DataFrame(df1.iloc[id:])
        break

df1.sort_index(ascending=True)
So, this works for me, and I'm able to sort it both ways, which is basically your code with synthetic data.
slow vigil

upbeat prism
slow vigil
wym whitening
A whitening transformation or sphering transformation is a linear transformation that transforms a vector of random variables with a known covariance matrix into a set of new variables whose covariance is the identity matrix, meaning that they are uncorrelated and each have variance 1. The transformation is called "whitening" because it changes ...
slow vigil
I literally haven't slept because of this flipped over dataframe lol
upbeat prism
stone marlin
I don't think I've ever seen whitening return NaNs --- maybe you have two featur...
11     def whiten(self, sample):
 10         # Whiten
  9         sample = pycbc.types.TimeSeries(sample, delta_t = 1.0 / self.sample_rate)
  8         # TODO: How coose params for whiten?
  7         # TODO: After whitening we only have 1s left. Input was 1.5s.
  6         # How do we get exaclty 1s?
  5         # ASSUMING 1.25 s
  4         sample = sample.whiten(0.5, 0.25, remove_corrupted = True,
  3                 low_frequency_cutoff = 18.0)
  2         sample = sample.numpy()
  1
156         return sample
I doubt that helps much. 😄
slow vigil
does sort flip the index with the data?
upbeat prism
stone marlin
upbeat prism
```py
11 def whiten(self, sample):
10 # Whiten
9 sample =...
Do you have any small sample data? Like, where it becomes NaN?
wicked grove
stone marlin
Do you have any small sample data? Like, where it becomes NaN?
Hello, i need some help w numpy im stuck
stone marlin
Please don't ping individual people, and please just post your question in the room.
upbeat prism
slow vigil
does sort flip the index with the data?

Signal Processing Stack Exchange
What is meant by "spectral whitening" in DSP?
What effect does spectral whitening have when used in image processing? (visually or otherwise...)
Where might spectral whitening be useful in audio
wicked grove
dummy_IMG_rgb = np.ndarray(shape=(X_train.shape[0],X_train.shape[1],X_train[2],3),dtype=np.float32)
dummy_IMG_rgb[:,:,:,0]=X_train[:,:,:,0]
dummy_IMG_rgb[:,:,:,1]=X_train[:,:,:,1]
dummy_IMG_rgb[:,:,:,2]=X_train[:,:,:,2]
I can make you an example sure
but takes a second
stone marlin
@slow vigil Let's step back for a second. When we resample, usually what that means we have data at uneven time intervals or at some spacing we don't like --- minutes when we want hours, for example. I know you know this, I'm restating for other's reference. In your case, what are you trying to do with your data + resampling?
wicked grove
wicked grove
```py
dummy_IMG_rgb = np.ndarray(shape=(X_train.shape[0],X_train.shape[1],X_trai...
im trying to create a dummy array whose size is 3390,512,512,3 and want to copy the data to these axes but the above code throws this error ... could you please tell me why
 earnest widget
Hi, is it normal for training accuracy to be a bit different each time it is ran? It's not that big of a difference though.
wicked grove
<ipython-input-18-ffb33075ee34> in <module>
      2
      3 IMG_SIZE = (512, 512)
----> 4 dummy_IMG_rgb = np.array(shape=(X_train.shape[0],X_train.shape[1],X_train[2],3),dtype=np.float32)
      5 dummy_IMG_rgb[:,:,:,0]=X_train[:,:,:,0]
      6 dummy_IMG_rgb[:,:,:,1]=X_train[:,:,:,1]
only integer scalar arrays can be converted to a scalar index```@stone marlin thanks.
slow vigil
stone marlin
<@!296753868790956032> Let's step back for a second. When we resample, usually ...
It's minute stock data that I'd like to be 5 minute stock data
stone marlin
wicked grove
```TypeError Traceback (most recent call last)
<...
When you create a numpy array like that, you need to pass in an object, like a list. If you want all ones or all zeros, you can do np.zeros(...) or np.ones(...).
stone marlin
slow vigil
It's minute stock data that I'd like to be 5 minute stock data
Okay, got'cha. And then you have a col with the transforms. Okay, give me a sec to make a little toy.
wicked grove
even if i put np.zeros i get the same error
 robust granite
How can i use this field for financial purpose?
stone marlin
This works for me np.zeros(shape=(100, 100, 100, 3), dtype=np.float32) so try printing out the x_train things to see if something is weird.
robust granite
robust granite
How can i use this field for financial purpose?
I am new to the field, i am still learning and my emd goal is to be financial analyst.
If anyone could tell me where to start, that would be helpful
slow vigil
Well, I think it would help you to learn about financial analysis first. Once you learn about all the calculations that happen in financial analysis you'll have a clear idea of how to use data science to help you. For a good intro to data science I recommend Kaggle
It's free
wicked grove
stone marlin
This works for me ```np.zeros(shape=(100, 100, 100, 3), dtype=np.float32)``` so ...
<ipython-input-20-28ff12873323> in <module>
      2
      3 IMG_SIZE = (512, 512)
----> 4 dummy_IMG_rgb = np.zeros(shape=(3390,512,512,3),dtype=np.float32)
      5 dummy_IMG_rgb[:,:,:,0]=X_train[:,:,:,0]
      6 dummy_IMG_rgb[:,:,:,1]=X_train[:,:,:,1]

MemoryError: Unable to allocate 9.93 GiB for an array with shape (3390, 512, 512, 3) and data type float32```this is the traceback i getWell, that error message sounds pretty self-explanatory.
stone marlin
slow vigil
It's minute stock data that I'd like to be 5 minute stock data
import random
import pandas as pd

agg_fns = {"col_1": np.sum, "col_2": np.mean}

df = pd.DataFrame(
  {"col_1": np.random.normal(size=107), "col_2": np.random.normal(size=107)},
  pd.date_range("2022-01-07", freq="30s", periods=107)
)

df1 = df.resample("5min").agg(agg_fns)
Maybe something like this would work for you?
upbeat prism
stone marlin
Do you have any small sample data? Like, where it becomes NaN?
Someone just gave me the idea that my low freq. cutoff might be an issue. Also I wasn't able to reproduce in a minimal setting but I have a meeting now and can't test it anymore. Might send you an example later if I don't figure it out if it's ok.
slow vigil
stone marlin
```python
import random
import pandas as pd
agg_fns = {"col_1": np.sum, "col_2"...
That's essentially what I'm doing, but I have data coming in constantly from a websocket and I can't always be sure of how many rows I'm going to need to process at once
wicked grove
stone marlin
Well, that error message sounds pretty self-explanatory.
could you please what i can do to solve it ://??
stone marlin
wicked grove
could you please what i can do to solve it ://??
There's no way to solve this unless you get a better computer or work on the cloud in a better computer. EDIT: That's not totally true, you could chunk this up in a nice way and all that, but if you're looking at this much data, you'll need to change the way you're going to analyze it.
wicked grove
ohh shitt, thank youu!!
stone marlin
slow vigil
That's essentially what I'm doing, but I have data coming in constantly from a w...
Ah, so you're sort of trying to find the "extras" and then add to that list, and then go back and do the resampling that way?
wicked grove
stone marlin
There's no way to solve this unless you get a better computer or work on the clo...
I didn't really get the edit
Could you please tell me how i can chunk it up
I'm using transfer learning to analyse
stone marlin
Maybe you could have a smaller dataset to start with?
slow vigil
stone marlin
Ah, so you're sort of trying to find the "extras" and then add to that list, and...
I'm trying to remove the extras, resample, do calculations, then add the extras back and write the dataframe back to parquet
stone marlin
Streaming conversion is kind of a weird one, and I've not really seen any way to do this nicely in pandas that isn't weird and convoluted --- others may have seen it, though, so others feel free to chime in. What I've usually done, at minimum, is to do the following:
Data streams into a database, script queries the DB to see if the last X minutes of data is in, and, if it is, then pull it and do the aggregation there, then push it to another DB with the aggregated data.
wicked grove
stone marlin
Maybe you could have a smaller dataset to start with?
Hmm but i need 3000 images atleast for this particular project
slow vigil
lol yep that's basically my flow
stone marlin
I'm sorry, I don't know what to do then, urjaaa. Perhaps someone else, when they wake up, will see your question and ping you.
slow vigil
stream ---> parquet ---> grab and resample ---> back to parquet
I'm thinking it has something to do with putting those inside a try catch
I'm gonna tinker around with that
stone marlin
I'm not sure, it works on my end --- but there's also a few weird things. Like, you're resetting the index, but then sorting on the index at the end (which is now a new index) but I'm not sure if that's tripping anything up in the future.
slow vigil
idk. Mine is inside another try/except so there are a lot of things going on and a lot of break statements. I'm just gonna clean it up anyway
stone marlin
Yeah, I'm not sure. We have used Parquet for timeseries stuff before, but when we aggregated it was usually some multiple of the partition set, so we could check to see if we had enough rows in the files to do an aggregation, and then we'd save that agg to like, redshift or something.
slow vigil
Yeah very similar to what I'm doing. I'm just saving the resampled 5-min data into a new parquet file and then adding the new data to that one every 5 mins or so, but the data stream I'm using is sloppy and unpredictable
stone marlin
Yeah, that's what we had to work with: we checked to see if a row existed in redshift, and, if it didn't, it looked for the files in that partition of our pq, and, if those existed and were full, it did the aggregation; otherwise, it returned NA or something. It's pretty tricky to do this kind'a thing.
slow vigil
Glad to know I'm not struggling out of ineptitude lol
stone marlin
I'd say: if you don't need to use pq for this (ie, if you're doing this for a project or whatever and not work, and you aren't using TBs of data), maybe postgres would be a better option for storing.
Nah, it's a tricky thing. Even when you get it "right", there's always something to fix or maintain about it.
slow vigil
I tried postgres previously and I wasn't crazy about it. It was pretty sluggish when doing large reads/writes and when the database got really large I couldn't even load the GUI which was half the draw of postgres for me to begin with
Stock data gets pretty big pretty quick and parquet has pretty darn good compression and pretty quick read/write speeds
brave sand
oh hey @slow vigil
slow vigil
lol hey
brave sand
didn't know u did data science too
slow vigil
lol I dabble
stone marlin
Yeah, it's just a pain to work with sometimes. PG should be fine for that, but if you've been having issues with your particular workflow, then, you know, stick to what works. We've used pg/redshift for large amounts of data and it's been okay, but both are okay solutions.
I just hate working with pq unless I really need to, but other people love it, so, who am I to say what's right, haha.
slow vigil
Yeah parquet was daunting to start with but once I started using it I was like, "oh this is pretty easy". Has it's quirks like anything, but honestly pandas is giving me more trouble than anything lol. Never realized how huge it is
brave sand
so if i wanted to predict the outcome of a tennis match based on previous stats, would I use logistic regression?
stone marlin
Pandas is really nice for this kind'a thing, but it's really easy to screw something up in it. As much as I hate suggestion Spark, PySpark might be a better tool if you're going to be doing a TON of data ingest at any point.
The workflow you're doing, with the "extras" thing, seems a little brittle to me --- for example, if it errors out, then there's no way to recover that data. It's also always worrying, for me, to have nested try-excepts with this kind of thing. Having said that, you prob could make something totally workable in pandas just doin' what you're doin'. Unfortunately, it'll take a little debuggin'. :']
stone marlin
brave sand
so if i wanted to predict the outcome of a tennis match based on previous stats,...
What stats do you have?
brave sand
the match results and number of aces, double faults, serve points, points won on first serve, and points won on second serve, number of break points faced and saved
stone marlin
I'm not too knowledgeable about tennis, but that sounds okay to use logistic regression for. Perhaps someone else may know more about tennis than I do and can say a bit more about it.
slow vigil
Sports prediction is erratic at best, but you're on the right track. Something that plays a big part in sports outcomes is the player's personal mental health, so you can do things like NLP to find articles about the player and gauge if they are negative or positive etc
stone marlin
Yeah, there's whole industries geared towards this kind of thing, and they go into very, very minute detail. It's wild.
brave sand
yeah, I know its not going to be accurate, but I'm doing this for like learning and not for professional work
slow vigil
I think you'll want as much data as you can get
If you have data for only one match you're going to have a tough time getting anything worthwhile
brave sand
it's every match from 2000-2017
slow vigil
ohh that's good
brave sand
I combined all the csv files into one
slow vigil
I'm not an expert in it either, but I'd say yeah feed your data into a model and see what pops out lol
stone marlin
Yeah, without knowing any of the details of tennis, maybe just popping things in will give a good result.
brave sand
So popping things into a logistic regression model and just see the result? this is like my 3rd ml project so I'm not so certain of what I'm doing lol
 stone marlin
If you've not done a lot of logistic regression before, or only done it a bit, I'd recommend going through something similar, like: https://www.datacamp.com/community/tutorials/understanding-logistic-regression-python for example. That way you sort of know what's going on, and what your model will even be doing.
brave sand
thanks for the resource, I'll have a read later. do I need to group the data in any way?
stone marlin
You may need to, depending on its format and what you're trying to do with it. It's hard to tell without lookin' at it all and knowing what you're going to be doing in the model.
brave sand
stone marlin
You may need to, depending on its format and what you're trying to do with it. ...
https://www.kaggle.com/gmadevs/atp-matches-dataset
here's the data, I don't think I'll have to group the data right? and my goal is to be able to predict the winner of a tennis match basically (I already know it won't be accurate lol)
ATP tournament results from 2000 to 2017
stone marlin
You could group the data in certain ways, or feature-engineer, but you probably don't need to.
Try it out and see what you run into.
vast yacht
my teacher said he could process 500GB of data back in 2005 with this kind of computer by writing optimized code. should i believe? serious question tho 😐
 stone marlin
I don't see why not.
upbeat prism
stone marlin
Do you have any small sample data? Like, where it becomes NaN?
It seems the issue why it became nan was simply that I stored the generated unwhitened data in single presicion and then read it again. Now it never became zero but it probably cut off some presicion which then, for whatever reason, let to the issue of Nan.
So it's due to a numerical issue. I hate those :p
upbeat prism
vast yacht
my teacher said he could process 500GB of data back in 2005 with this kind of co...
It really depends on the data and what processing means but of course. It's just slow, probably. Also you can really get a lot of speed out of your code if you know what you do e.g. using numpy slicing operators is 280x faster than a normal python loop. If you are interested in this topic I highly suggest taking a systems programming and computer architecture course (it will make you gigachad coder based).
lapis sequoia
 upbeat prism
lapis sequoia
upbeat prism
lapis sequoia
h5py is a bit tricky, did oyu read their documentation?
stone marlin
Got it, makes sense --- that's prob why I've never seen it happen! It'd be weird to happen naturally, without numerical issues.
lapis sequoia
I also used classic "save" method, but it didnt work with transformer
upbeat prism
Basically you can make a group and datasets. E.g. group is e.g. "fruits" and dataset would be "apples" or "bananas" and the nstore the data inside apples or bananas.
So when working with h5py you have to:
- Open the file with write permissions
- Initialize groups (optional)
- Initialize datasets (that is a must)
- write to dataset
- close file
E.g.
file = 5py.File(filename, 'w')
file.create_dataset("mydata", (2, 4), dtype='f')

mydata = file['mydata']

mydata[0] = [1,2,3,4]
mydata[1] = [3,4,5,6]

file.close()
so you have to tell h5py beforehand how much space you want (that what create dataset does).
hdf aka h5py is good for big files or complex data files.
I don't know keras but https://www.tensorflow.org/guide/keras/save_and_serialize ?

TensorFlow
lapis sequoia
upbeat prism
I don't know keras but https://www.tensorflow.org/guide/keras/save_and_serialize...
It didnt work
 twilit current
Hey friends. I have a vaguely data-science related question on how to go through dataframes in the pandas library- it's in #help-bread, so feel free to check it out 😊
lapis sequoia

I success saved my model, but when I want to load this, I got error.
Transformer neural network
 merry wadi
What’s up guys. Have a quick question, within an if statement is there a way in pandas to check if multiple columns contain a string(s).
Right now I am doing
if columnA == Apple or columnB == Apple
etc and I’d like to streamline it
desert oar
merry wadi
What’s up guys. Have a quick question, within an if statement is there a way in ...
or won't be valid here. == returns a boolean-valued series, not a single bool value
if ((columnA == 'Apple') || (columnB == 'Apple')).any():
    ...
or
if (columnA == 'Apple').any() or (columnB == 'Apple').any():
    ...
If it’s from a dataframe is there anyway to do if df[[‘columnA’,’columnB’]].any() == (Apple | banana )
desert oar
merry wadi
If it’s from a dataframe is there anyway to do if df[[‘columnA’,’columnB’]].any(...
if (df[['columnA', 'columnB']] == 'Apple').any().any():
    ...
if (df[['columnA', 'columnB']].isin({'Apple', 'Banana'}).any().any():
    ...
no, the first one applies .any to each column, resulting in a series of boolean values. the second one applies .any to that resulting series
!d pandas.DataFrame.any
arctic wedgeBOT
DataFrame.any(axis=0, bool_only=None, skipna=True, level=None, **kwargs)```
Return whether any element is True, potentially over an axis.

Returns False unless there is at least one element within a series or along a Dataframe axis that is True or equivalent (e.g. non-zero or non-empty).oh nice you can do axis=None and just do 1 .any
if (df[['columnA', 'columnB']].isin({'Apple', 'Banana'}).any(axis=None):
    ...
same thing as the double-any above
i thought pandas didn't support that, now i know
arctic wedgeBOT
:incoming_envelope: :ok_hand: applied mute to @vestal quiver until <t:1641588387:f> (9 minutes and 59 seconds) (reason: duplicates rule: sent 4 duplicated messages in 10s).
lapis sequoia
Hi. This code is running more than 20 min and I got printed just first directory - there are 850 photos per directory.
# DATA DUPLICATON - check whether there is photos that are identical in same folder
# As manually it was seen that there isn't a case that particular photo is placed in wrong folder, then we will check for duplication is same folder where is photo located
for directory in directories_within_dataset_directory:
    print(directory)
    files_inside_directory = os.listdir(os.path.join(dataset_folder, directory))
    for i, file in enumerate(files_inside_directory):
        path_to_current_file = os.path.join(dataset_folder, directory, file)
        files_next_to_current_file = files_inside_directory[i + 1: len(files_inside_directory)]
        for file_from_files_next_to_current_file in files_next_to_current_file:
            path_to_file_from_files_next_to_current_file = os.path.join(dataset_folder, directory,
file_from_files_next_to_current_file)
            image1 = cv2.imread(path_to_current_file)
            image2 = cv2.imread(path_to_file_from_files_next_to_current_file)
            difference = cv2.subtract(image1, image2)
            b, g, r = cv2.split(difference)
            if cv2.countNonZero(b) == 0 and cv2.countNonZero(g) == 0 and cv2.countNonZero(r) == 0:
                print("The images are completely Equal")
@lapis sequoia Please don't try to ping @everyone or @here. Your message has been removed. If you believe this was a mistake, please let staff know!
 :ok_hand: applied mute to @lapis sequoia until <t:1641593109:f> (9 minutes and 59 seconds) (reason:
 duplicates rule: sent 4 duplicated messages in 10s).
upbeat prism
Once I have a a network trained and stored its state and then reload it to evaluate my test set - what do I need to consider?
Like e.g. I think I'd have to use model.eval() right?
hazy escarp
guyz i made a lib that automatically draws nn for u using pygame, wanna pypi link?
 willow kiln
Hi, we don't allow recruitment, or advertising here.
low plover
ok this is my first ML project
im my dataset would it be ok if I just make a bunch of true false conditions so 0s and 1s and expect it to predict a win or loss? ofc I will be training it with csv data of the same
 crisp vapor
What's the fastest way to perform face recognition? I tried using face_recognition but it was too slow for my use case.
serene scaffold
crisp vapor
What's the fastest way to perform face recognition? I tried using face_recogniti...
Did you try this? https://realpython.com/face-recognition-with-python/

In this tutorial, we'll show an example of using Python and OpenCV to perform face recognition.
lapis sequoia
lapis sequoia
I success saved my model, but when I want to load this, I got error.
Transformer...
Please
serene scaffold
also, how did you ascertain that face_recognition was (a) the bottleneck for what you were doing and (b) prohibitively slow?
serene scaffold
lapis sequoia
Sorry, but it's not reasonable to ask people to read this camera picture of a screen. Please copy and paste the text into a pastebin as text.
!paste
arctic wedgeBOT
Pasting large amounts of code
If your code is too long to fit in a codeblock in discord, you can paste your code here:
https://paste.pythondiscord.com/
After pasting your code, save it by clicking the floppy disk icon in the top right, or by typing ctrl + S. After doing that, the URL should change. Copy the URL and post it here so others can see it.
 rose pasture
Hey guys quick question, while doing EDA at work or project, how do you know which type of questions to explore? Or which data to plot against each other? Do you use correlation or pairplots to give yourself an idea of what to do?
serene scaffold
vast yacht
my teacher said he could process 500GB of data back in 2005 with this kind of co...
well, sure. the theory of computation hasn't changed in decades. though "processing data" can mean a lot of things, and training a deep neural network with millions of parameters would have taken prohibitively long on that machine, regardless of how optimized the code is.
GPU computation, for example, isn't some hardware trick that lets one get away with writing unoptimized code. GPUs allow for massive parallelization, and when you're doing operations over huge arrays that can't be reduced in scope with clever program design, that's an important advantage.
stone marlin
Pairplots are great, corr is good, there's a lot of timeseries stuff you can do to try to find seasonality and trends and stuff. Those are pret much the "try this first" stuff.
lapis sequoia
serene scaffold
Sorry, but it's not reasonable to ask people to read this camera picture of a sc...
I success saved my model, but when I want to load this, I got error.
Transformer neural network
https://colab.research.google.com/drive/1vhJiMvCnxT7y4KhMv7wez_zBqwI-7yqu
My google colab code. (Dont try to start it)
 rose pasture
stone marlin
Pairplots are great, corr is good, there's a lot of timeseries stuff you can do ...
rose pasture
stone marlin
Pairplots are great, corr is good, there's a lot of timeseries stuff you can do ...
oh ok I haven't learned about time series stuff yet that's why I was curious as to how people proceeded. Thanks man!
stone marlin
No problemo, time series stuff is pretty fun. There's a good online guide to them here: https://otexts.com/fpp3 but it uses R. The content in it is good tho, and you can do almost all the stuff with similar Python code.
rose pasture
stone marlin
No problemo, time series stuff is pretty fun. There's a good online guide to th...
Awesome ill check it out!
lapis sequoia
lapis sequoia
I success saved my model, but when I want to load this, I got error.
Transformer...
I also got this warning, while save model.
crisp vapor
serene scaffold
Did you try this? https://realpython.com/face-recognition-with-python/
The article covers face detection (is this a human face?). I want to perform face recognition (whose face is this?).
I tried face_recognition library
serene scaffold
I see. How many profiles are you trying to distinguish?
And are you including the possibility that a given face won't be one of your enrolled profiles?
stone marlin
I dunno if this will help, but sklearn has the eigenface example from the LFW dataset: https://scikit-learn.org/stable/auto_examples/applications/plot_face_recognition.html
lapis sequoia

GitHub
I got this error, while trying to load my transformer model. Model: Layer (type) == Output Shape == Param # == Connected to =========================================================================...
 kind island
Anybody have experience with plotly? i have an issue
plot_fig.add_trace(
        go.Scatter(
            x=strategy.df['date'],
            y=sell_signals_none,
            mode='markers',
            marker=dict(
                color='red',
                size=12
            )
        ), row=1, col=1
    )
No markers are showing up on my plot when i use this
upbeat prism
okay so I finally found the issue with my CNN. It now works great and as expected! Now great doesn't mean the results are good but at least they are as I would expect them to be. Now I use a softmax layer and CEloss and I only get down to around 0.2-0.3 loss. What are good things to try to make it better? The network itself should be fine, it's used in several papers and was shown to work. Now the data I feed it might be a bit different but not too much (everyone uses self generated data using the same library but a tad bit different parameter space to generate it).
So what are so basic things I can try to improve it?
arctic wedgeBOT
:incoming_envelope: :ok_hand: applied mute to @lapis sequoia until <t:1641646942:f> (9 minutes and 59 seconds) (reason: duplicates rule: sent 4 duplicated messages in 10s).
wicked grove
hello, i have a numpy array as x_train with 3390 images and another array as y_train which are the labels...i am trying to do transfer learning but i am stuck.How do i split x_train and y_train as train and validation sets...should i use sklearn? and should i pass a batch of images to the model and decode the predictions before training?
slow vigil
df = pd.DataFrame(some_info)
length = len(df.index)
for idx, row in df.iterrows():
  opposite_index = length - (idx + 1)
  if row['whatever'] == whatever:
    #do something
  if df[opposite_index]['whatever'] == whatever:
    #do something
@stone marlin Realized I don't need to flip the dataframe at all
Loop it forward and backward at the same time
earnest widget
What is the reason for why validation accuracy fluctuates or jumps a lot?
Like this for example..
 serene scaffold
wicked grove
hello, i have a numpy array as x_train with 3390 images and another array as y_t...
serene scaffold
wicked grove
hello, i have a numpy array as x_train with 3390 images and another array as y_t...
you can use sklearn to partition the data, yes.
serene scaffold
slow vigil
```py
df = pd.DataFrame(some_info)
length = len(df.index)
for idx, row in df.ite...
what are you trying to do here? pretty sure there's a better way
wicked grove
serene scaffold
you can use sklearn to partition the data, yes.
Okayy,thank you! And i should do one hot encoding for the y label?
My label is like this
[0,0...2,2...1,1]
serene scaffold
wicked grove
Okayy,thank you! And i should do one hot encoding for the y label?
are you doing image classification, or what?
serene scaffold
one hot makes sense to me, but I've never done any amount of image classification.
wicked grove
Oh alright
serene scaffold
wicked grove
Oh alright
sklearn has a one-hot encoder that you can use
wicked grove
serene scaffold
sklearn has a one-hot encoder that you can use
Yess i was looking at that,thank youu:))
Is it necessary to use it w a columntransformer??
serene scaffold
wicked grove
Yess i was looking at that,thank youu:))
Is it necessary to use it w a columntra...
uhhhhh, what's a column transformer?
wicked grove
It allows different columns of the array to be transformed...so im guessing i should reshape the array first if i use it
wicked grove
serene scaffold
uhhhhh, what's a column transformer?
scikit-learn
Examples using sklearn.compose.ColumnTransformer: Release Highlights for scikit-learn 1.0 Release Highlights for scikit-learn 1.0, Time-related feature engineering Time-related feature engineering,...
serene scaffold
wicked grove
http://scikit-learn.org/stable/modules/generated/sklearn.compose.ColumnTransform...
I was just thinking of https://scikit-learn.org/stable/modules/generated/sklearn.preprocessing.OneHotEncoder.html
scikit-learn
Examples using sklearn.preprocessing.OneHotEncoder: Release Highlights for scikit-learn 1.0 Release Highlights for scikit-learn 1.0, Release Highlights for scikit-learn 0.23 Release Highlights for ...
 grand imp
Any recommended pre-trained speech recognition algorithms I can train on my own voice? I'm looking for a tutorial/documentation on how to do this but I haven't found any so far.
wicked grove
serene scaffold
I was just thinking of https://scikit-learn.org/stable/modules/generated/sklearn...
Ohhh okay, yeah this is easier🙈
slow vigil
serene scaffold
what are you trying to do here? pretty sure there's a better way
was trying to figure out yesterday how to iterate over a dataframe backwards. you can do for x, y in dataframe[::-1].iterrows(), but I had a use case of needing to trim rows off of the top and bottom of the dataframe so the thing I posted above works pretty well
lapis sequoia
Hey y'all! Do you have a good suggestion on how to merge datasets with different timeseries? I mean I usually have timeseries data with different starting and end points (e.g. dataset 1 starting in 01.01.2000 and dataset 2 starting in 05.08.1995, etc.); then i also have timeseries in different formats (e.g. unix timestamps vs. YYYY-MM-DD format etc.), and then also datasets with different intervals (hourly data, vs. daily, monthly, quarterly). Is there some "easy" library or jupyter notebook template that can easily merge those datasets on a selected timeseries? I mean i cannot be the first one always struggling with this, right? How do you usually solve this? and is there a "one-size-fits-all"-Solution?
slow vigil
@lapis sequoia You may need to use something like this before trying to merge your datasets https://dateutil.readthedocs.io/en/stable/parser.html
Not a magic bullet but the only thing that can do what you're asking is google's ai data engine thing I forget what it's called. Big something
This looks interesting also
Maybe I'm behind the times
serene scaffold
slow vigil
was trying to figure out yesterday how to iterate over a dataframe backwards. yo...
but why are you trying to iterate over the dataframe? whatever your end goal is, there is almost always a better solution.
slow vigil
I'm resampling one-minute data into 5-minute data. I want to start and end on times where the minute is divisible by 5 i.e. 20:30 or 15:55. So sometimes I have a few rows at the start and finish that I need to be rid of and I throw out the rows at the beginning and save the rows at the end to be added back in during the next resampling job in the future
serene scaffold
lapis sequoia
Hey y'all! Do you have a good suggestion on how to merge datasets with different...
for the unix timestamps, do they always represent midnight for a given day, or can they be as specific as 01/07/21 13:44:39?
sorry, you mentioned that they have different resolutions
well, you can convert all of them to unix timestamps, but that might skew your data
lapis sequoia
serene scaffold
for the unix timestamps, do they always represent midnight for a given day, or c...
can be all kinds of timestamps. sometimes i crawl reddit posts and merge them on hourly crypto data for example. so the crypto timestamps are hourly but the reddit posts can be all kinds of seconds
serene scaffold
because you'd be including data points that are lower resolution
if you were doing weather predictions, or something, you probably wouldn't want to combine datasets that contain readings taken every hour and readings taken every day.
lapis sequoia
but the parser looks quite good that @slow vigil pointed at. I will look into that
serene scaffold
the parser?
lapis sequoia
serene scaffold
the parser?
serene scaffold
are you representing timestamps as strings?
converting string timestamps to a proper time format is an important part of data cleaning, yes.
lapis sequoia
depends. sometimes i have really messy data, or .csv's that have strings or other stuff in it that i need to clean to get the time.
lapis sequoia
serene scaffold
if you were doing weather predictions, or something, you probably wouldn't want ...
the thing is i sometimes also do some research on macroeconomic data that goes way back but is only quarterly, e.g.: https://fred.stlouisfed.org/series/GDPDEF
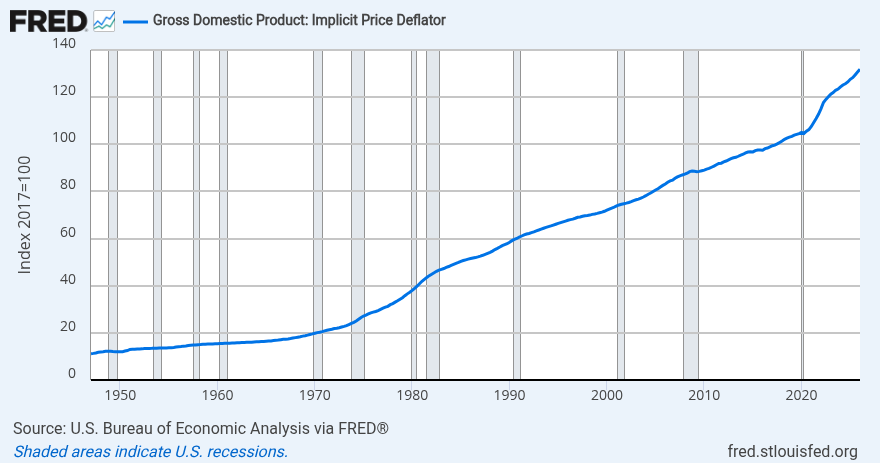
Gross Domestic Product: Implicit Price Deflator
sometimes i cannot do better than taking quarterly stuff like that and interpolate the data in between
 spark fox
in tweepy, using streamlistener how do i get extended tweets? right now im capped to 140 charachters
 solemn oracle
Can anyone link an article or video that has an example of an simple nn where 1d numerical imputs (market data) are predicted as labels instead of numerical outputs
My issue is im trying to predict a label of -1 or 1, but model is essentially limiting MSEloss by guessing average each time.
I would like to have it optimized by its ability to classify as either 1 or -1, as if this were an image recognition task.
 lucid spindle
Hello
I am using the PILLOW module to apply a perspective transformation on images.
For PNG files it works without any issues
however, for JPG files, the result is weird
E.g

Any ideas how to fix that?

 quiet vault
Is there a reason why you need to use JPG files?
You can convert the image to s PNG before doing this and the convert it back, yes it takes more computational power but I assume it will not be much
wicked grove
Hello, what loss function can i use for a 3class classification
 loud kindle
anyone here have experience with huggingface and their datasets library? specifically with the ClassLabels?
I want to convert my sentiment column of {-1, 0,1} into a ClassLabel with mappings of ["negative", "neutral", "positive"] respectively. I can create the classlabel, but it'll just map them to {0,1,2} and i don't see where i can specify this...
quiet vault
wicked grove
Hello, what loss function can i use for a 3class classification
categorical_crossentropy
 sour tree
Does anyone have twitter api with academic research access? I would like to get last one year tweet data. My request got rejected. It would be very helpful if someone could help asap
quiet vault
Why am I getting predictions higher than 1 with the softmax activation function on the last layer?
I am using this model:
model = Sequential()
model.add(Dense(128, input_dim=4, activation='relu'))
model.add(Dense(256, activation='relu'))
model.add(Dense(3, activation='softmax'))
model.compile(optimizer='adam', loss='categorical_crossentropy', metrics=[tf.keras.metrics.CategoricalAccuracy()])
here is a sample prediction:
[0.11697997897863388, 0.8829441070556641, 7.598652155138552e-05]
Does anyone know how to fix this?
 violet kernel
Hi everyone, I am new to datascience and machine learning and have ran into an error that says, "predict_proba is not available when probability=False". I have no idea why this is the case, would anyone be able to visit #help-dumpling to look at why it is doing this? I'm just doing this for fun so I don't have like a professor or anyone to help me lol. Thank you :)
 untold yew
Me and my teammates made a small car for a competition the school organizes and we want to make an object detection model, that can recognize parts of the car held infront of the camera live and display information about them on a screen. I have decided to want to use YOLO for it, because the team that previously won did that aswell. Is there any good tutorial on YOLO that explains how to use it for your own custom objects/images?
lucid spindle
@quiet vault : Thank you for your reply
I have managed to solve that issue by creating a new RGBA image and pasting the old one. Here is the implementation:
GitHub
Apply a perspective transformation to a raster image inside Inkscape (no need to use an external software such as GIMP or Krita). - GitHub - s1291/InkRasterPerspective: Apply a perspective transfor...
rose pasture
Hey guys quick question. While using train_test_split from scitkit why do people keep using the same fixed number for random_state instead of not specifying any numbers at all? I get that the random_state is to keep the outcome constant. But wouldn't you want to go through different train and test data to find the best one with the best performance?
 safe elk
untold yew
Me and my teammates made a small car for a competition the school organizes and ...
safe elk
untold yew
Me and my teammates made a small car for a competition the school organizes and ...

Object Detection as a task in Computer Vision We encounter objects every day in our life. Look around, and you’ll find multiple objects surrounding you. As a human being you can easily detect and identify each object that you see. It’s natural and doesn’t take much effort. For computers, however, detecting objects is a task […]
You will spend a lot of time gathering and annotating images unless you have them ready...have a machine with a good gpu for training. We only a had one project with YOLO and that was some time ago.
stone marlin
rose pasture
Hey guys quick question. While using train_test_split from scitkit why do people...
If you're training a model and it's a relatively stable dataset, you're not looking to improve your metrics by getting lucky with your training set --- if you are, then that's a different problem entirely. In the case of setting random seeds to a set value, I usually do this so that I can have anyone reproducing the code get the same results as I do, and can note things about the results in the notebook or whatever.
This is true for most random things that you want to "make steady" before giving it to someone else to run / review.
To add to this, to make the beginning more clear: the point of training and testing a model is to say, given data which is generally similar to the data you have now in the entire set, how will the model perform on new data. You can change the training size, of course, or get more data --- these are valid things to do --- as well as stratifying the sample, so that the train / test set have approx equal features corresponding to different classes ---
But once you've done these things, there's no reason to keep swapping out training and test sets to find the best one. Ideally, you're training in such a way that, given N test sets, your variance is fairly low w/rt the metrics you're returning, and, therefore, it should also predict new data in a similar way.
rose pasture
Thank you so much for making it clear to me! It makes sense in my head now lol I appreciate you man you're always helping me out! @stone marlin
stone marlin
No problemo, a lot of this stuff is weird and takes time to get!
rose pasture
stone marlin
No problemo, a lot of this stuff is weird and takes time to get!
Yeah it takes me time to understand a few concepts lol
 olive river
 safe elk
HAL 9000 said sorry I cant to that ...an AI and meme too
wicked grove
hello,i am doing transfer learning with efficient net and i keep getting this error
alueError: Dimensions must be equal, but are 3 and 17 for '{{node Equal}} = Equal[T=DT_FLOAT, incompatible_shape_error=true](IteratorGetNext:1, Cast_1)' with input shapes: [?,3], [?,17,17].```i can't understand
my x_train has (2712,528,528,3)
stone marlin
I dunno how your thing is set up, but one of your outputs is outputting a thing of size 3, and the input is of size 17, I'm guessing?
wicked grove
history = model2.fit(x_train,
    y_train,
    batch_size=32,
    epochs=50,

    # We pass some validation for
    # monitoring validation loss and metrics
    # at the end of each epoch
    validation_data=(x_test, y_test))
The error suggests https://stackoverflow.com/questions/61069068/keras-valueerror-dimensions-must-be-equal-but-are-6-and-9-for-node-equal
I dunno what model2 is, though.
(The SO article is for a general NN, not the one you're using in particular.)
wicked grove
def fundus_model(image_shape=IMG_SIZE):
input_shape = image_shape + (3,)```when i do this i have assigned image_shape to IMG_SIZE right?ohhh okayy