
#data-science-and-ml
1 messages · Page 352 of 1
 night dragon
same column letter each time?
 crude needle
Can you elaborate?
night dragon
also looks like p haha
crude needle
I have these multiple csv file and I want to extract only "p" data then I want to transpose and concatenate all the p datas stacked
I just want to automate the process as I have hundred of the csv files.
night dragon
are all the files in the same folder?
crude needle
yes
night dragon
give me a sec
crude needle
sure
night dragon
You still there @crude needle ?
crude needle
yes
night dragon
import csv
import pathlib


def main():
    p = pathlib.Path(r'path_to_csv_folder')
    csv_files = [f for f in p.iterdir() if f.suffix == '.csv']

    with open('new_file.csv', 'w', newline='') as new_file:
        writer = csv.writer(new_file)
        for file in csv_files:
            with open(file, 'r') as csv_file:
                reader = csv.reader(csv_file)
                row_data = []
                for row in reader:
                    if row[-1] != 'p':
                        row_data.append(row[-1])
                writer.writerow(row_data)


if __name__ == '__main__':
    main()
should do the trick
 night dragon
must be an end column that is different
night dragon
if row[-1].isdigit() and row[-1] != 0:
I didn't specify the column, just took the last element
 frozen marten
if we want to begin a career as a data scientist what are the skills required? and what role should we take up as a fresher?
 lapis sequoia
where do i learn tenser flow 
 shy nimbus
Hello, how i can fit SVC ( sklearn ) by a few text data vectorized by Tfidf?
from sklearn.feature_extraction.text import TfidfVectorizer
from sklearn.svm import SVC

vectorizer = TfidfVectorizer()

keywords = vectorizer.fit_transform(train_df['keyword'].astype('str'))
locations = vectorizer.fit_transform(train_df['location'].astype('str'))
texts = vectorizer.fit_transform(train_df['text'].astype('str'))

features = np.hstack((keywords, locations, texts))

classifier = SVC()
classifier.fit(features, labels)
This raise
TypeError                                 Traceback (most recent call last)
TypeError: float() argument must be a string or a number, not 'csr_matrix'

The above exception was the direct cause of the following exception:
ValueError: setting an array element with a sequence.
How i can fit SVC by multi-feature data?
 rough mountain
Always a good sign in binary classification: val_accuracy: 0.5000
lapis sequoia
Hey all, I am a post graduate data science researcher trying to develop an AI tool to help league of legends players improve their gameplay. Before I start I need to do some preliminary data collection on the sentiment towards existing improvement tools. I would greatly appreciate if LoL players take a look at this survey, its aprox. 3 mins
https://unibocconi.qualtrics.com/jfe/form/SV_06PRQq80VZE3lEa
Qualtrics sophisticated online survey software solutions make creating online surveys easy. Learn more about Research Suite and get a free account today.
lapis sequoia
lapis sequoia
where do i learn tenser flow <:lemon_eyes:754441879885447296>
bump
lapis sequoia
for this question i would have thought that the bigo notation would have been O(1) due to the list being sorted and that unsorted lists have to have space made for additional objects where a sorted list does not? or am i miss understanding something here?
if someone can tag me too with a reply that would be wonderful!

 serene scaffold
lapis sequoia
for this question i would have thought that the bigo notation would have been O(...
serene scaffold
lapis sequoia
for this question i would have thought that the bigo notation would have been O(...
also we can't really read that screenshot. Try regular text.
 odd meteor
shy nimbus
Hello, how i can fit SVC ( sklearn ) by a few text data vectorized by Tfidf?
```...
odd meteor
shy nimbus
Hello, how i can fit SVC ( sklearn ) by a few text data vectorized by Tfidf?
```...
Hi rokiboxoffical, after vectorizing your text, your output is gon be a sparse matrix. So I think you should convert it to a 'dense' numpy array which you can ultimately pass into a pandas DataFrame.
Example
vect = TfidfVectorizer()
vect.fit(df[['keyword', 'location', 'text']] )
X = vect.transform(df[['keyword', 'location', 'text']] )

X_df = pd.DataFrame(X.toarray(), columns = vect.get_feature_names())

X_df.head()
Then you can proceed further to train your model with SVC
odd meteor
shy nimbus
Hello, how i can fit SVC ( sklearn ) by a few text data vectorized by Tfidf?
```...
I do have a question... How are you able to post your python code here? Is there a special command to use to fo this on Discord?
serene scaffold
odd meteor
Hi rokiboxoffical, after vectorizing your text, your output is gon be a sparse m...
converting it to dense might use up all their memory
serene scaffold
odd meteor
I do have a question... How are you able to post your python code here? Is there...
!code
 arctic wedgeBOT
Here's how to format Python code on Discord:
```py
print('Hello world!')
```
These are backticks, not quotes. Check this out if you can't find the backtick key.
serene scaffold
shy nimbus
Hello, how i can fit SVC ( sklearn ) by a few text data vectorized by Tfidf?
```...
you don't want to call fit_transform more than once with the same vectorizer. This will reset how the vectorizer works and make your results meaningless.
odd meteor
serene scaffold
converting it to dense might use up all their memory
What do you suggest is the best way to mitigate the memory problem? I usually convert mine back to a numpy array though without having any memory issues.
Right now, the only thing I can think of that can help a bit as regards the memory concern is perhaps specifying the max_features argument inside the vectorizer.
I'd like to know how you'd personally approach such if you were to be having such challenge.
serene scaffold
odd meteor
What do you suggest is the best way to mitigate the memory problem? I usually co...
I'm pretty sure you can use sparse arrays with sklearn
 hollow ember
 hollow ember
https://paste.pythondiscord.com/raw/rabonatemi
hollow ember
hollow ember
https://paste.pythondiscord.com/raw/rabonatemi
error in the link
@serene scaffold senpai
 serene scaffold
hollow ember
serene scaffold
hollow ember
please do car_missing.dtypes
hollow ember
 serene scaffold
hollow ember
serene scaffold
hollow ember
going forward, please copy and paste text directly. I do not like to read screenshots of text.
it appears that the Odometer (KM) column is either all strings, or contains a mix of floats and strings.
try car_missing['Odometer (KM)'].astype(float) and see if that causes an error.
serene scaffold
hollow ember
https://paste.pythondiscord.com/raw/ujunifeyed
so you have the string 'missing' in the column, and this cannot be converted to a number.
Try car_missing.loc[car_missing['Odometer (KM)'] == 'missing', 'Odometer (KM)'] = pd.NA
 limber depot
hi, does anyone know how to use pandas to drop duplicate rows, where values in specific columns match? for example
df = pd.DataFrame({
    'a':[1,1,3,4],
    'b':[1,1,3,4],
    'c':[1,1,3,4],
    'd':[1,2,3,4],
})
So for the above dataframe, I want to remove index 0 and 1, where the values in a, b and c match, ignoring the value in column d
hollow ember
serene scaffold
Try `car_missing.loc[car_missing['Odometer (KM)'] == 'missing', 'Odometer (KM)']...
@serene scaffold no output
serene scaffold
hollow ember
<@!253696366952316929> no output
that statement was not intended to have an output. Try doing fillna again.
hollow ember
it worked
serene scaffold
limber depot
hi, does anyone know how to use pandas to drop duplicate rows, where values in s...
!docs pandas.DataFrame.drop
arctic wedgeBOT
DataFrame.drop(labels=None, axis=0, index=None, columns=None, level=None, inplace=False, errors='raise')```
Drop specified labels from rows or columns.

Remove rows or columns by specifying label names and corresponding axis, or by specifying directly index or column names. When using a multi-index, labels on different levels can be removed by specifying the level. See the user guide <advanced.shown\_levels> for more information about the now unused levels.Aah columns edit: nope, couldn't work it out. lol
hollow ember
can u explain the whole thing in simple language pls? @serene scaffold
serene scaffold
hollow ember
can u explain the whole thing in simple language pls? <@!253696366952316929>
the string "missing" is not the same as a NaN, so fillna won't know what to do with it. So car_missing.loc[car_missing['Odometer (KM)'] == 'missing', 'Odometer (KM)'] = pd.NA replaces all the "missing" strings with a NaN (that's what pd.NA is), and then you can do fillna as normal.
hollow ember
got it thank you
serene scaffold
limber depot
Aah columns edit: nope, couldn't work it out. lol
do you know how to get a boolean series of which rows you want?
limber depot
I don't. I'm not sure of the best approach for it. I have tried drop_duplicates, but i don't know how to do it across multiple columns
serene scaffold
limber depot
I don't. I'm not sure of the best approach for it. I have tried drop_duplicates,...
!e
import pandas as pd
df = pd.DataFrame({
    'a':[1,1,3,4],
    'b':[1,1,3,4],
    'c':[1,1,3,4],
    'd':[1,2,3,4],
})

result = df.query("(a == b) & (b == c)")
print(result)
 junior matrix
can any0ne help me with pyspark
arctic wedgeBOT
@serene scaffold :white_check_mark: Your eval job has completed with return code 0.
001 |    a  b  c  d
002 | 0  1  1  1  1
003 | 1  1  1  1  2
004 | 2  3  3  3  3
005 | 3  4  4  4  4
hmm that's not what I wanted
serene scaffold
junior matrix
can any0ne help me with pyspark
you should say what help you need with pyspark. "asking to ask" actually slows down the process.
junior matrix
jus a sec
limber depot
serene scaffold
hmm that's not what I wanted
It worked. Just changed it to
result = df.query("~(a == b) & (b == c)")
print(result)
it removed the matching rows. Thanks a lot!
I'll look further into .query
junior matrix
i need to explode dwells into two colums named march and april and get the values of mapType in the columns...
 serene scaffold
limber depot
```
result = df.query("~(a == b) & (b == c)")
print(result)
```
serene scaffold
limber depot
```
result = df.query("~(a == b) & (b == c)")
print(result)
```
might want to do ~((a == b) & (b == c)) so you get the right order of operations
~(a == b) & (b == c) is the same as (a != b) & (b == c)
limber depot
lovely. Thnks a lot
junior matrix
I tried the hardcoded method but i need something more general..
dfkom=(dfL
.withColumn('April', dfL.dwells['2020-03-30'])
.withColumn('March', dfL.dwells['2020-03-02'])
)
.drop('safegraph_place_id', 'dwells')
.fillna('N/A', ['March', 'April'])
dfkom.show()
odd meteor
limber depot
hi, does anyone know how to use pandas to drop duplicate rows, where values in s...
!e
import pandas as pd
df = pd.DataFrame({
    'a':[1,1,3,4],
    'b':[1,1,3,4],
    'c':[1,1,3,4],
    'd':[1,2,3,4],
})

df.drop_duplicates(keep='first', inplace=True)

print(df)
Thanks! It feels like there are a million ways to do the same thing in python 🙂
 wicked grove
hello,i have an image dataset and the labels for these images are in a csv
i used the below code to load the images
to preprocess these images, should i put it in a list and do the same?
from os import walk
for dirname,_,filenames in os.walk(r'D:\dataset'):
    for filename in filenames:
        image = Image.open(os.path.join(dirname, filename))
since the labels are in a csv im unable tp understand how i should train the model such that it know this image is for this label
 robust night
Hi, I have two different files of data with different samples that correspond to a type of cancer, file 1 specifies which sample corresponds to which cancer, while file 2 just has a whole list of these kinds of samples. I have categorise and calculate how many samples corresponds to what type of cancer in file 2. Any idea how to do this using file 1 data?
junior matrix
I am getting index 0 out of bounds for axis 0 with size 0 when using join in pyspark…any idea why that might be?
 mighty spoke
Hi, I'm trying to make a loop, where I have two columns x1 and x2 I want to take the first element in x1 and subtract it from the first element from x2 then I want to move on to the next element in x2 and take away the first element in x1 repeat this until i have subtracted the first element in x1 from every element in x2, once I have done this I move on the second element of x1 and repeat the above steps. This is my code so far but i'm not sure its right; the columns are from csv files, appreciate any help!

 smoky birch
How do you fine tune a bert model?
 desert bear
Hello, can anyone help me with some definitions related to genetic algorithms?
Basically I don't know if I understand this correctly.
Population is for example list of sequences: ["12345", "54321", "25431"]
An individual is a sequence from the population: e.g. "12345"
Gene (in that context) is a random integer from that individual: e.g. 5
Is it called a gene or a genotype?
 uncut barn
hi is there a way to convert this binary image into a network (i.e. with nodes and edges)?

 cobalt jetty
You might want to look into something called Topological Data Analysis, where the idea is that you can create graphs/topological spaces out of such pictures. For something more in-depth, you might want to read up on the concept of simplicial complexes (and how to grow them via the Vietoris-Rips method).
There is a library that allows you to do such a thing called GUDHI, a free-to-use library created at the French INRIA: https://gudhi.inria.fr/.
Beyond the theoretical, you have a big set of available tutorials on that topic here: https://github.com/GUDHI/TDA-tutorial

GitHub
A set of jupyter notebooks for the practice of TDA with the python Gudhi library together with popular machine learning and data sciences libraries. - GitHub - GUDHI/TDA-tutorial: A set of jupyter ...
However, that might be using a nuke to kill a bird kind of use for this library. I'm pretty sure that you can find something easier to implement to relies on similar ideas.
 sick wedge
hey guys, this is the silhouette score I got trying to calculate optimal number of K for KMeans clustering algorithm, is there any hope for me in clustering this data?

I'm new to clustering so idk if I should give up
shy nimbus
Hello, is exists ways how to stop sklearn fit method if it freeze PC. When I choose algorithm for my model, I test a many algorithms, and any of this classifiers make my PC freeze. How I can avoid this, or check complexity of classifier before use it?
 tight walrus
if p_value adf test = 0
does that mean the serie is stationary?
 wise pelican
Small question
I'm creating multiple plots with matplotlib simultaneously with multiprocessing
But matplotlib using Qt doesn't like being used in a multiprocessed way and keeps throwing this warning:
WARNING: QApplication was not created in the main() thread.
There are no actual issues with the program, so I want to just to ignore these warnings - how would I go about doing that?
I've tried this:
import warnings
warnings.filterwarnings("ignore", module = "matplotlib\..*" )
Could someone explain to me that one really large number?
_________________________________________________________________
Layer (type)                 Output Shape              Param #
=================================================================
conv2d (Conv2D)              (None, 298, 298, 64)      1792
_________________________________________________________________
max_pooling2d (MaxPooling2D) (None, 149, 149, 64)      0
_________________________________________________________________
activation (Activation)      (None, 149, 149, 64)      0
_________________________________________________________________
conv2d_1 (Conv2D)            (None, 147, 147, 32)      18464
_________________________________________________________________
max_pooling2d_1 (MaxPooling2 (None, 73, 73, 32)        0
_________________________________________________________________
activation_1 (Activation)    (None, 73, 73, 32)        0
_________________________________________________________________
flatten (Flatten)            (None, 170528)            0
_________________________________________________________________
dense (Dense)                (None, 64)                10913856
_________________________________________________________________
dense_1 (Dense)              (None, 1)                 65
=================================================================
Total params: 10,934,177
Trainable params: 10,934,177
Non-trainable params: 0
_________________________________________________________________```"dense (Dense) (None, 64) 10913856"
limber depot
Hi! I have 2 dataframes, I want to use 'Reference_Code' in df1 to join with 'Smyths_Code' from df2, and then transfer the matches from column 'asin' from df2 to df1. What should I use to achieve that?
serene scaffold
limber depot
Hi! I have 2 dataframes, I want to use 'Reference_Code' in df1 to join with 'Smy...
!docs pandas.DataFrame.merge
arctic wedgeBOT
DataFrame.merge(right, how='inner', on=None, left_on=None, right_on=None, left_index=False, right_index=False, sort=False, suffixes=('_x', '_y'), copy=True, indicator=False, validate=None)```
Merge DataFrame or named Series objects with a database-style join.
A named Series object is treated as a DataFrame with a single named column.
The join is done on columns or indexes. If joining columns on columns, the DataFrame indexes *will be ignored*. Otherwise if joining indexes on indexes or indexes on a column or columns, the index will be passed on. When performing a cross merge, no column specifications to merge on are allowed. jaunty pine
Can someone explain to me what reshaping data is? Why do we do that?
 velvet thorn
jaunty pine
Can someone explain to me what reshaping data is? Why do we do that?
velvet thorn
jaunty pine
Can someone explain to me what reshaping data is? Why do we do that?
are you familiar with features vs samples?
 shut trail
jaunty pine
Can someone explain to me what reshaping data is? Why do we do that?
shut trail
jaunty pine
Can someone explain to me what reshaping data is? Why do we do that?
do you just mean like wide and long tables ??
 nova cliff
anyone know why the fbprophet time series model doesnt work on python 3.9
but works on 3.8.11?
jaunty pine
velvet thorn
are you familiar with features vs samples?
no, im new to ML
shut trail
nova cliff
but works on 3.8.11?
isnt it up to 3.7

wait you were probably asking 'why'
nova cliff
just tried 3.8.11 it worked
Im just that OCD guy who likes to use everything thats updated
which might be a bad thing bc I should probably understand the discrepancy between 3.9 and 3.8.11
it just feels weird to bump the kernel down bc I want to use time series
shut trail
environments are your friend haha
nova cliff
and another weird thing
is prophet and fbprophet both run
so its like....which one do I do ppl say do one or the other like
got me in a tight squeeze im being way to analytical for no reason
nova cliff
Lol, Im trying to build up my portfolio rn
im getting rejected for every DS intern application bc I spent my time in a non open source friendly internship prior
so I have like nothing on github and no projects
only a house price prediction with ann and xgboost XD
also in final year of undergrad @shut trail
shut trail
k, well break those anxieties apart. start contributing because it makes you a part of thing. but the getting work side, not so huge. do a couple case studies or example projects, put up a portfolio, and get some work somewhere. your internship will make fine experience if you write it up well
work no stress
nova cliff
thanks for the insights bro!
yea i been mad stressed recently, im actually in marketing and chose to take the DS route so
shut trail
marketing is good
nova cliff
i need to stall so i actually am doing grad school for DS
applied to some schools etc
startup life is not for me
nova cliff
Got you ill take this there
shut trail
over pay? then get something random. marketing analysts are in lots of demand, remote jobs.. ya should be okay. stress is the real killer
odd meteor
shy nimbus
Hello, is exists ways how to stop sklearn fit method if it freeze PC. When I cho...
If your pc is freezing while training your model, it could be because:
-
The ram of your Pc is quite low for the task you're trying to use it to do
-
You're working with a very large dataset.
Solution
-
if you're working with a very large dataset, try to use a sample of the data for your training
-
if it's a pc ram problem, try upgrading the ram of your pc or you can use Google Colab, Kaggle Kernel, or Binder to train your model.
robust night
Hello ! Does anymore know how to code these counts to print from max to min number?

 prisma mist
robust night
prisma mist
robust night
maybe numpy? np.sort(array)[::-1]
mighty spoke
Hi anyone know why my function is not printing anything, `import pandas as pd
import matplotlib.pyplot as plt#imported pyplot to plot graphs
import datetime as dt#date time to read first column of csv file
import numpy as np
from datetime import datetime
df = pd.read_csv('FREY.csv')
df2 = pd.read_csv('SLI.csv')
pd.to_datetime(df["Date"]).dt.strftime("%d%m%Y")#reads the date time objects
pd.to_datetime(df2["Date"]).dt.strftime("%d%m%Y")
df['Date'] = pd.to_datetime(df['Date'])
df2['Date'] = pd.to_datetime(df2['Date'])
x1=(df['Date'] - dt.datetime(1970,1,1)).dt.total_seconds()/86400
x2=(df2['Date'] - dt.datetime(1970,1,1)).dt.total_seconds()/86400 def dcf(x1, x2):
x1_n = len(x1)
x2_n = len(x2)
x1_mean = np.mean(x1)
x2_mean = np.mean(x2)
x1_stdv = np.std(x1)
x2_stdv = np.std(x2)
dcf = np.zeros((x1_n, x2_n))
for i, x1 in enumerate(x1):
for j, x2 in enumerate(x2):
#x2_val=[t+x2[j]]
d = (x1 - x1_mean) * (x2 - x2_mean) / (x1_stdv*x2_stdv)
dcf[i, j] = d
return dcf
print(dcf)`
 boreal summit
I am trying to plot a Histogram from the PySpark Data that I am working on. From the book I am studying & all the online resource I've searched. The way to plot is through "histogram_data = df.select('column_name').rdd.flatMap(lambda x: x).histogram()" . Trying this in practice throws an error.
so I am wondering if the PySpark API has been updated or something. Thanks.
ALll the examples I searched online showed the same procedure. Yet, the code kept throwing an error.
 last abyss
Does someone know if there is a way to scikit-surprise with python 3.9?
serene scaffold
mighty spoke
Hi anyone know why my function is not printing anything, ...
Are you familiar with variable scoping? print(dcf) is just printing the function object itself. you did not call it.
inside the dcf function, you use the name dcf to refer to something else, but this only applies within the funciton.
 civic ivy
hey all i want to make a Self Learning Optical Auditory Machine which is gonna be a visual and auditory self learning artificial intelligence which will be connected some sort of robotics. i was wondering where i could start. Also i have adhd so im also how i would keeps my engaged with this.
lapis sequoia
Heyyyy peeps!! I want to save different .png for every index value, any idea how i Could do that?

I also another for loop that runs this whole process for every year's data.
I want to save this loop's word cloud for every year in separate folders. Is that too complicated to do? any suggestions?
lapis sequoia
 robust jungle
What should I use instead of train.py for efficientnet?
robust jungle
What should I use instead of train.py for efficientnet?
if you were looking to orgranise your code. If you meant in other means, do give more information
robust jungle
lapis sequoia
if you were looking to orgranise your code. If you meant in other means, do give...
Sorta new, just downloaded efficientnet to follow an outdated tutorial, trying to find out how to run it (already did the configs)
lapis sequoia
run the file that contains the loop for epoch!!
 pure wagon
Is there someone that's able to tell me what's wrong with my code?
 pale elbow
got error Attribute Error: 'SeriesGroupBy' object has no attribute 'ewm'
solving kaggle problem Google brain ventilator pressure prediction problem
Notebook url
https://www.kaggle.com/dmitryuarov/ventilator-pressure-eda-Istm-0-189/notebook?script Versionld=75835345& cellld=13
In cell 13 where df["'ewn_u_in_mean"] is assign It it to fix ewm error but can't find it's fix Even in stackoverflow
mighty spoke
serene scaffold
Are you familiar with variable scoping? `print(dcf)` is just printing the functi...
I see so how would i print the values of the dcf, i tried to append it to a list but this also doesn’t work?
serene scaffold
@mighty spoke have you changed the code from what you showed earlier?
 balmy junco
Does anybody know of any interesting problems in terms of gene sequencing?
preferably based on open source data lol
 urban knoll
Hi guys, I'm trying to create a CNN algorithm to classify images with dust and without dust. I am using this tutorial to create my own algorithm. and I'm having a hard time with this step: labels = ['Dusty', 'clear'] img_size = 224 def get_data(data_dir): data = [] for label in labels: path = os.path.join(data_dir, label) class_num = labels.index(label) for img in os.listdir(path): try: img_arr = cv2.imread(os.path.join(path, img))[...,::-1] #convert BGR to RGB format resized_arr = cv2.resize(img_arr, (img_size, img_size)) # Reshaping images to preferred size data.append([resized_arr, class_num]) except Exception as e: print(e) return np.array(data) train =get_data('\\home\\Users\\Philip\\Desktop\\miscellenous\\Fall 2021\\Camera-Lens-Smear-Detection-OpenCV-and-Python-master\\Sample1\\Training') val = get_data('\\home\\Users\\Philip\\Desktop\\miscellenous\\Fall 2021\\Camera-Lens-Smear-Detection-OpenCV-and-Python-master\\Sample1\\Test')
I get the error : ```\AppData\Local\Temp/ipykernel_17848/790153361.py in get_data(data_dir)
6 path = os.path.join(data_dir, label)
7 class_num = labels.index(label)
----> 8 for img in os.listdir(path):
9 try:
10 img_arr = cv2.imread(os.path.join(path, img))[...,::-1] #convert BGR to RGB format
FileNotFoundError: [WinError 3] The system cannot find the path specified: '\home\Users\Philip\Desktop\miscellenous\Fall 2021\Camera-Lens-Smear-Detection-OpenCV-and-Python-master\Sample1\Training\Dusty ' No clue how to fix this path error. Article does not really do well to explain in my opinion, perhaps just my lack of experience. Am I to have folder inTrainingcalledDusty? should my pictures have the word Dusty``` in them? I dont know, Here is the link to the tutorial, Just look at step 2: https://www.analyticsvidhya.com/blog/2020/10/create-image-classification-model-python-keras/#wait_approval
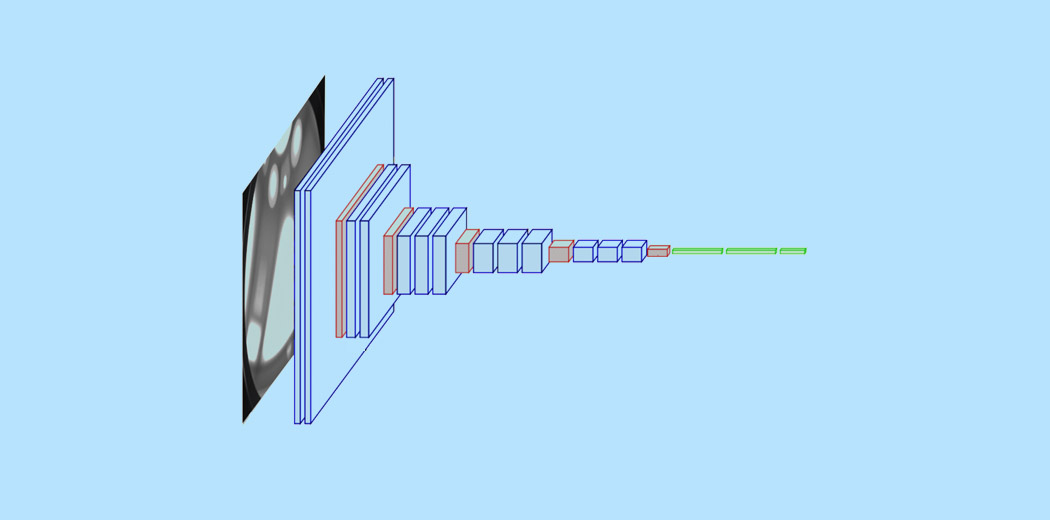
Image Classification means assigning an input image, one label from a fixed set of categories. Learn to Build an image classification model.
 void pagoda
I'm a beginner and am starting to learn, I'm having trouble indicating overfitting and underfitting, if anyone could give me some guidance I appreciate it!
 lapis sequoia
#Using the replace function, replace NaN in the contact attribute with unknown.
# continue working on this at home
# NEED TO UNDERSTAND WHY THIS PIECE OF CODE IS NOT WORKING
bank['contact'] = bank['contact'].replace(to_replace=['NaN'],value='unknown', inplace=True)
bank.head(5)

``` would somone be able to explain why my piece of code is not filtering my 'contact' category please i feel my code is correct the closest i have got is for all of them to `none` which is not what i am looking for? many thanks!
 foggy moon
how to understand if the data is stationary or not
I have a dataset of frequency Hourly. If i pass this dataset to adfuller test, the result is stationary. But if i average the result of the day, the result becomes non stationary
 bold timber
whether the type of target in classification shouldn't have boolean?
 clear glacier
er, I have this multiindex
MultiIndex([(                               'No',                     '-'),
            (    'Wilayah Kerja Statistik - BPS', 'Nama Desa / Kelurahan'),
            (    'Wilayah Kerja Statistik - BPS', 'Kode Desa / Kelurahan'),
            ('Wilayah Administrasi - Kemendagri', 'Nama Desa / Kelurahan'),
            ('Wilayah Administrasi - Kemendagri', 'Kode Desa / Kelurahan')],
           )
how can i easily ungroup this? reset_index doesnt seem to work :<
reset index just makes this worse 😭
MultiIndex([(                            'index',                      ''),
            (                               'No',                     '-'),
            (    'Wilayah Kerja Statistik - BPS', 'Nama Desa / Kelurahan'),
            (    'Wilayah Kerja Statistik - BPS', 'Kode Desa / Kelurahan'),
            ('Wilayah Administrasi - Kemendagri', 'Nama Desa / Kelurahan'),
            ('Wilayah Administrasi - Kemendagri', 'Kode Desa / Kelurahan')],
           )
Hello, soon I'll be participate in machine learning contest,and I have one question. When I fit my model, I split train and test data, but is I should train my model on full data before send my model? I think it may be cause overfit?
 serene oasis
Hello, I am trying to use ocr to read an Arabic text from different images but I can't find any resources related to that if anyone tried it before and has an idea I will appreciate it.
odd meteor
shy nimbus
Hello, soon I'll be participate in machine learning contest,and I have one quest...
You have to split your data before training your model.
- Split your data into train and validation set.
- train your model on X_train and y_train
- predict on X_test
velvet thorn
shy nimbus
Hello, soon I'll be participate in machine learning contest,and I have one quest...
if they have a holdout set, then yes, you should train on the full dataset.
and they probably will, it being a competition
 twilit forum
Anyone knows about any library for Segmentation models such as Unet or Segnet?
mighty spoke
serene scaffold
<@761588935616102422> have you changed the code from what you showed earlier?
Hi @serene scaffold I tried letting d be nonlocal and many other things but nothing seems to be working
serene scaffold
mighty spoke
Hi <@!253696366952316929> I tried letting d be nonlocal and many other things b...
I'm not at my desktop right now, but I can't comment without seeing the code.
mighty spoke
serene scaffold
I'm not at my desktop right now, but I can't comment without seeing the code.
Nws i'll try work on it more and get back to you
 simple ivy
hey y'all, im working on an object detection and am sort of confused. am i supposed to manually add a label-map.pbtxt file in my project (and if so, where?) or is that generated when generating a TF record?
wicked grove
hello
i am trying to load an image dataset whose labels are in a csv
i am using the following code but i think it is incorrect
can someone please guide me
serene scaffold
wicked grove
i am using the following code but i think it is incorrect
are you still looking for the code?
wicked grove
yupp
from os import walk
image=[]
for dirname,_,filenames in os.walk(r'D:\dataset'):
    for filename in filenames:
        if(filename==merged_labels['image']):
            img = cv2.imread(os.path.join(dirname, filename,merged_labels['level']))
            image.append(img)
For one thing, remember not to wrap entire if conditions in parentheses.
# oman
if(filename==merged_labels['image']):
    ...
# yemen
if filename == merged_labels['image']:
    ...
also, isn't the third element given by os.walk always a string, not a list of strings?
!docs os.walk
arctic wedgeBOT
os.walk(top, topdown=True, onerror=None, followlinks=False)```
Generate the file names in a directory tree by walking the tree either top-down or bottom-up. For each directory in the tree rooted at directory *top* (including *top* itself), it yields a 3-tuple `(dirpath, dirnames, filenames)`.no, you were right
wicked grove
serene scaffold
For one thing, remember not to wrap entire if conditions in parentheses.
```py
#...
okayy thank you! i will keep that in mind
serene scaffold
so is image not what you expected at the end?
also you have from os import walk but then you have os.walk. did you do import os somewhere else?
wicked grove
yupp, it throws an error and i think what i am doing is wrong
serene scaffold
wicked grove
yupp, it throws an error and i think what i am doing is wrong
if you get an error message, always show the whole error
wicked grove
serene scaffold
also you have `from os import walk` but then you have `os.walk`. did you do `imp...
yeah i imported it in the beginning
serene scaffold
the error message is almost always the most valuable of all possible information you could share
wicked grove
  Traceback (most recent call last)
<ipython-input-32-1b61408943dc> in <module>
      3 for dirname,_,filenames in os.walk(r'D:\dataset'):
      4     for filename in filenames:
----> 5         if(filename==merged_labels['image']):
      6             img = cv2.imread(os.path.join(dirname, filename,merged_labels['level']))
      7             image.append(img)

~\anaconda3\lib\site-packages\pandas\core\generic.py in __nonzero__(self)
   1440     @final
   1441     def __nonzero__(self):
-> 1442         raise ValueError(
   1443             f"The truth value of a {type(self).__name__} is ambiguous. "
   1444             "Use a.empty, a.bool(), a.item(), a.any() or a.all()."

ValueError: The truth value of a Series is ambiguous. Use a.empty, a.bool(), a.item(), a.any() or a.all().
yes, if you had shown this originally, we would have gone in an entirely different direction
the problem is that merged_labels is a series, so filename==merged_labels['image'] is also a series
and as stated, The truth value of a Series is ambiguous.
 serene scaffold
wicked grove
serene scaffold
wicked grove
please always share csv data by copying the actual csv text into the chat. You can get a sample with print(df.head().to_csv())
wicked grove
image    level
10_left    0
10_right    0
13_left    0
13_right    0
15_left    1
15_right    2
16_left    4
16_right    4
17_left    0
17_right    1
19_left    0
19_right    0
20_left    0
20_right    0
21_left    0
21_right    0
22_left    0
22_right    0
23_left    0
23_right    0
25_left    0
25_right    0
30_left    1
30_right    2
31_left    0
31_right    0
33_left    0
33_right    0
36_left    1
36_right    0
40_left    2
40_right    0
41_left    0
41_right    0
42_left    0
42_right    0
46_left    0
46_right    0
47_left    0
47_right    0
49_left    0
49_right    0
51_left    2
51_right    0
52_left    0
52_right    0
54_left    2
54_right    2
56_left    0
56_right    0
57_left    0
57_right    0
58_left    0
58_right    0
59_left    0
59_right    0
60_left    0
60_right    0
62_left    0
62_right    0
64_left    0
64_right    0
65_left    0
65_right    0
66_left    0
66_right    0
67_left    0
67_right    0
70_left    0
70_right    0
72_left    0
72_right    0
73_left    0
73_right    0
74_left    0
74_right    0
75_left    0
75_right    0
78_left    2
78_right    2
79_left    2
79_right    2
81_left    0
81_right    0
82_left    2
looks like this is tab separated?
wicked grove
it is in an excel file
serene scaffold
anyway, what is filename==merged_labels['image'] intended to do?
wicked grove
so these are my training labels
serene scaffold
because keep in mind, merged_labels['image'] is an entire series of strings. so what are you trying to say when a given file name "equals" the entire series?
wicked grove
 wicked grove
serene scaffold
because keep in mind, `merged_labels['image']` is an entire series of strings. s...
wicked grove
serene scaffold
because keep in mind, `merged_labels['image']` is an entire series of strings. s...
And this is my image dataset
I want to map the labels of that image to the filename
And i have removed some image names from merged_labels and i don't want to map the ones which aren't in the merged_labels
i am using an image dataset whose training labels have 5 classes(no dr,mild,severe and proliferate), and i converted this to binary . i also removed the mild class from the df. the problem is these mild images are in the image dataset
serene scaffold
wicked grove
And this is my image dataset
I want to map the labels of that image to the file...
what you want is a dataframe with the full path for each file in one column, and the part of the name found in your image/level dataframe in the other
and then you can merge on that name.
wicked grove
ohh but how will that reflect on the images' filenames? or can i do that after it is merged?
serene scaffold
wicked grove
ohh but how will that reflect on the images' filenames? or can i do that after i...
I don't know what you mean by "reflect on the images' filenames" What you'll end up with is something like this:
image         level          path
10_left       0              D:/path/to/10_left.png
10_right      0              D:/path/to/10_right.png
because you'll have two dataframes, one that only has (image, level), and another that only has (image, path), and then you merge them on image.
wicked grove
yeah exactly but i want make the image's filepath D:/path/to/10_left_0.png
serene scaffold
wicked grove
yeah exactly but i want make the image's filepath D:/path/to/10_left_0.png
so you want to move existing files?
wicked grove
yeah rename the existing files to match its respective labels
serene scaffold
wicked grove
yeah rename the existing files to match its respective labels
does every single path end in .png?
wicked grove
wicked grove
yeah rename the existing files to match its respective labels
because idk how i can train the model when the labels are in a csv
wicked grove
serene scaffold
does every single path end in `.png`?
.jpeg
every single path ends in .jpeg
serene scaffold
wicked grove
.jpeg
then you can do df['new_path'] = df['path'].str[:-5] + '_' + df['level'].astype(str) + '.jpeg'
that might actually be inefficient 
!docs shutil
arctic wedgeBOT
Source code: Lib/shutil.py
The shutil module offers a number of high-level operations on files and collections of files. In particular, functions are provided which support file copying and removal. For operations on individual files, see also the os module.
Warning
Even the higher-level file copying functions (shutil.copy(), shutil.copy2()) cannot copy all file metadata.
On POSIX platforms, this means that file owner and group are lost as well as ACLs. On Mac OS, the resource fork and other metadata are not used. This means that resources will be lost and file type and creator codes will not be correct. On Windows, file owners, ACLs and alternate data streams are not copied.
serene scaffold
you can use this to move files though.
wicked grove
serene scaffold
then you can do `df['new_path'] = df['path'].str[:-5] + '_' + df['level'].astype...
ohh alrightt!thank youu😄 and once i do that i can use os.walk and os.rename?
wicked grove
serene scaffold
so you want to move existing files?
I don't really want to move them ,i just want to rename them so that they can get mapped to their labels
serene scaffold
wicked grove
I don't really want to move them ,i just want to rename them so that they can ge...
why will changing their names help with that
wicked grove
Hmm for that particular image path i want to fetch its label from the csv for example while doing os.walk if get image14.jpeg, can check "image " "image14" in the df and then get the level
wicked grove
serene scaffold
why will changing their names help with that
I thought when the images are in a training folder and the labels are in a csv this is how it should be done but idk if i am correct
serene scaffold
wicked grove
I thought when the images are in a training folder and the labels are in a csv t...
the name of the file has no role in how the machine learning happens.
 torpid cape
Sorry to interupt, but does anyone have any Ai Dev Ideas?
wicked grove
serene scaffold
the name of the file has no role in how the machine learning happens.
But wont the name help me track whether the prediction is correct or not
serene scaffold
wicked grove
But wont the name help me track whether the prediction is correct or not
not really
wicked grove
Then what do you suggest i do if i have my labels in a csv and images in a training folder? The method you mentioned? To put it all in a df?
serene scaffold
wicked grove
Then what do you suggest i do if i have my labels in a csv and images in a train...
yes, you usually has one column that has the expected label.
wicked grove
serene scaffold
yes, you usually has one column that has the expected label.
Ohh alright!!
I also want to remove the mild images(label is 1) so i thought if i change the names i can do os.remove( 01.jpeg)
serene scaffold
wicked grove
Ohh alright!!
I also want to remove the mild images(label is 1) so i thought if...
remove them in what sense? delete them from your computer?
wicked grove
Yupp delete it from the training folder
serene scaffold
wicked grove
Yupp delete it from the training folder
do you have a copy somewhere, just in case?
wicked grove
Yeah i created a backup of the folder
serene scaffold
wicked grove
Yeah i created a backup of the folder
I usually use pathlib for this kind of thing instead of os
!docs pathlib
arctic wedgeBOT
New in version 3.4.
Source code: Lib/pathlib.py
This module offers classes representing filesystem paths with semantics appropriate for different operating systems. Path classes are divided between pure paths, which provide purely computational operations without I/O, and concrete paths, which inherit from pure paths but also provide I/O operations.
 If you’ve never used this module before or just aren’t sure which class is right for your task,
 Path is most likely what you need. It instantiates a concrete path for the platform the code is running on.
Pure paths are useful in some special cases; for example:
 woeful cape
Hello,
I have a question about porting TensorFlow models between Python and Java.
I currently have a model written in Python, and would like to make a GUI in Java. I know that there is a TensorFlow package in Java, however I have not found any sample code or description of how to load an h5 model anywhere.
Has anyone solved any such problem and could direct me if this is possible?
It is a binary image classifier.
Thanks
 iron basalt
woeful cape
Hello,
I have a question about porting TensorFlow models between Python and Ja...
iron basalt
woeful cape
Hello,
I have a question about porting TensorFlow models between Python and Ja...
I have never had this exact problem, but I would consider making the GUI in Python.
 ripe forge
there might be other formats for saving the model that make this easier too, explore things that let you make an api from your model as well
tensorflow itself had something, though i havent explored this much, via their protobuf format i think. or theres a couple names like bentoml. (but all uncharted territory for me)
 quiet vault
iron basalt
I have never had this exact problem, but I would consider making the GUI in Pyth...
quiet vault
iron basalt
I have never had this exact problem, but I would consider making the GUI in Pyth...
Making a GUI with Java is much better
 austere swift
woeful cape
Hello,
I have a question about porting TensorFlow models between Python and Ja...
austere swift
woeful cape
Hello,
I have a question about porting TensorFlow models between Python and Ja...
https://www.tensorflow.org/api_docs/java/org/tensorflow/SavedModelBundle here's the tensorflow java docs for model loading
TensorFlow
actually that's the old api, heres the link for the new one https://www.tensorflow.org/jvm/api_docs/java/org/tensorflow/proto/framework/SavedModel

TensorFlow
rough mountain
Adding the early stopping callback gives me: tensorflow/core/kernels/data/generator_dataset_op.cc:107] Error occurred when finalizing GeneratorDataset iterator: Failed precondition: Python interpreter state is not initialized. The process may be terminated. [[{{node PyFunc}}]] after about 4 epochs.
lapis sequoia
I am an AI
 solid urchin
not sure if this is the right channel and sorry for the repost, just hard to not have my posts immediately get bumped off screen in #python-discussion
what library/api/whatever would you all recommend for plotting data on a map? i want to:
- just be able to plot a list of coordinates as markers on an interactive map
- be able to plot a choropleth map
- be able to interact with a map to place a marker, and store the coordinates from where it was placed into a tuple or some variables or whatever
i also will probably need geocoding functionality
 spark dirge
fluf what have you tried? interactive is hard
solid urchin
tried the google maps library, but i couldn't find a way to display a map. just get coordinates and geocode and stuff
i'd be fine without #3 (interacting with/placing markers)
in #1 by interactive what i mean is like, having the ability to zoom and drag around
if that's not possible i suppose a static image could still be fine, just wouldn't be as nice
solid urchin
if anyone responds pls @ me
 main fox
solid urchin
if anyone responds pls @ me
main fox
solid urchin
if anyone responds pls @ me
Checkout mapbox
lapis sequoia
Hi, I just discovered Cleverbot (Conversational Agent) which was created using Deep Learning, however, I don't see how the bot can predict words using numbers and theorem. Any explanation?
 cloud widget
hi, I want to create a tts model for sinhala language, can someone guide me how to go with it
I used wavent on google colab to train some pre-recorded wav files on sinhala language
but I think I don't understand what I am really doing, please someone tell me how to achieve this task
lapis sequoia
then u can use library such as gtts to make one
lapis sequoia
cloud widget
i know, but it's not good enough to put on a virtual assistant
so are u trying to make a virtual assiatant ?
cloud widget
lapis sequoia
so are u trying to make a virtual assiatant ?
yes
cloud widget
but nothing about other languages other than english and even if there, they are uysing google cloud which they don't have a sinhala tts
the only sinhala tts available right now is the one in google translator
lapis sequoia
cannot help it then man
cloud widget
hmm
lapis sequoia
i dont know much about that either
cloud widget
ok thanks
mighty spoke
Hi @serene scaffold I managed to print the vales of the dcf function however I'm trying to now print the lag values and the corresponding dcf values in two columns would you know how to do that?
 stable kestrel
hey, does someone have a bit of experience in statistics and coding?
im fully stuck right now
serene scaffold
mighty spoke
Hi <@!253696366952316929> I managed to print the vales of the dcf function howev...
I can't comment without seeing the exact code as currently written.
serene scaffold
stable kestrel
hey, does someone have a bit of experience in statistics and coding?
Try asking a specific question. Then people can see if they know how to help.
stable kestrel
and understand a bt what a likelihood function is
serene scaffold
Please always post code as text
stable kestrel
buttt
serene scaffold
!code
arctic wedgeBOT
Here's how to format Python code on Discord:
```py
print('Hello world!')
```
These are backticks, not quotes. Check this out if you can't find the backtick key.
stable kestrel
serene scaffold
Please always post code as text
this in in jupyter as text ehh
serene scaffold
stable kestrel
this in in jupyter as text ehh
You can copy and paste the relevant parts out.
helping people with programming questions often involves replicating their code locally, and with screenshots, that would require typing all of it out by hand.
stable kestrel
its just a lot of text and not a lot of code
lemme try
yeah no
there is not really any code to write
or give
just a bunch of text edited in latex
 serene scaffold
so you're just being asked to implement this likelihood function, yes?
stable kestrel
i am yeah for Pr(𝑥⃗ ∣𝜇′,𝜎′)
so i first need to know if the function i have is correct
and maby then try to implement it
because i have no idea if im doing things correctly
serene scaffold
stable kestrel
i am yeah for Pr(𝑥⃗ ∣𝜇′,𝜎′)
can you show your current solution for Pr(𝑥⃗ ∣𝜇′,𝜎′)?
Remember to use code formatting
```py
code
```
serene scaffold
stable kestrel
the big function
so the latex part is the solution? you're not implementing that function in python?
stable kestrel
i want to , that is question 7 but i dont really know if question 6 is even correct so i can implement the right code
# samples are fixed, modify shape and location on the left side, so mu and sigma
#mu = 78.3
#sigma = 3
#samples is every sample

mu = mean_xx_c #(fill in mean of samples)
sigma = 3
samples = x_values


def likelihood(mu, sigma, samples):
    (1/)


pass```this is my question 7 right now
just almost non existent
serene scaffold
stable kestrel
i want to , that is question 7 but i dont really know if question 6 is even corr...
I can help you implement a given formula in python, but I can't help you confirm that the formula itself is correct.
stable kestrel
ahh okay hmm
i think i can implement it
not sure about the summation part
maby just use sum()
?
serene scaffold
stable kestrel
maby just use `sum()`
if you're working with (numpy) arrays, the array will have a sum method
also this: https://discord.gg/G7nB7UF9
for example, if x is a one-dimensional array, then the summation part of your likelihood formula is ((x - mu) ** 2).sum()
(x - mu) subtracts mu from every element of x, returning a new array.
((x - mu) ** 2) raises each element to the second power
stable kestrel
okay okay
thnxx ❤️
i implemented it as this
# samples are fixed, modify shape and location on the left side, so mu and sigma
#mu = 78.3
#sigma = 3
#samples is every sample

mu = mean_xx_c #(fill in mean of samples)
sigma = 3
samples = x_values


def likelihood(mu, sigma, samples):
    likelihood = ((1/2*np.pi*sigma**2)** len(samples)/2)* np.exp(-1/(2*sigma**2))* sum(samples-mu)**2


    return likelihood

likelihood(mu, sigma, samples)```can you space things out so it isn't so hard to read?
sum(samples-mu)**2 this means that the sum is taken, and then that one number is raised to two. is that what you want?
def likelihood(mu, sigma, samples):
    a = (1/2 * np.pi * sigma ** 2) ** len(samples) / 2
    b = np.exp(-1 / (2 * sigma ** 2)) * sum(samples - mu) ** 2
    return a * b
hmm
yeah it probably works
but the result is too large apparently
so that is annooying
serene scaffold
"too large"?
stable kestrel
yep
# samples are fixed, modify shape and location on the left side, so mu and sigma
#mu = 78.3
#sigma = 3
#samples is every sample

mu = mean_xx_c #(fill in mean of samples)
sigma = 3
samples = x_values


def likelihood(mu, sigma, samples):
    a = (1/2 * np.pi * sigma ** 2) ** len(samples) / 2
    b = np.exp(-1 / (2 * sigma ** 2)) * sum(samples - mu) ** 2
    return a * b

likelihood(mu, sigma, samples)```Hey, anyone has a clue why linear reg model is structured like this: y = - W[0] / W[1] * x + (0.5 - b) / W[1]
Full code, just in case:
input_dim = 2
output_dim = 1
W = tf.Variable(initial_value=tf.random.uniform(shape=(input_dim, output_dim)))
b = tf.Variable(initial_value=tf.zeros(shape=(output_dim,)))

def model(inputs):
    return tf.matmul(inputs, W) + b

def square_loss(targets, predictions):
    per_sample_losses = tf.square(targets - predictions)
    return tf.reduce_mean(per_sample_losses)

learning_rate = 0.1

def training_step(inputs, targets):
    with tf.GradientTape() as tape:
        predictions = model(inputs)
        loss = square_loss(predictions, targets)
    grad_loss_wrt_W, grad_loss_wrt_b = tape.gradient(loss, [W, b])
    W.assign_sub(grad_loss_wrt_W * learning_rate)
    b.assign_sub(grad_loss_wrt_b * learning_rate)
    return loss

for step in range(40):
    loss = training_step(inputs, targets)
    print(f"Loss at step {step}: {loss:.4f}")

x = np.linspace(-1, 4, 100)
y = - W[0] /  W[1] * x + (0.5 - b) / W[1]
 frozen pasture
Hey everyone , I have 2 input independent variables and i have to predict 3 output dependent variables . i have a dataset of 9000 rows . Which technique should i use to predict the data in multioutput regression ?
mighty spoke
serene scaffold
I can't comment without seeing the exact code as currently written.
Hi @serene scaffold here's my code: `
import pandas as pd#import pandas package to read data more easily
import matplotlib.pyplot as plt#imported pyplot to plot graphs
import datetime as dt#date time to read first column of csv file
import numpy as np
from datetime import datetime
df = pd.read_csv('FREY.csv')
df2 = pd.read_csv('SLI.csv')
pd.to_datetime(df["Date"]).dt.strftime("%d%m%Y")#reads the date time objects
pd.to_datetime(df2["Date"]).dt.strftime("%d%m%Y")
df['Date'] = pd.to_datetime(df['Date'])
df2['Date'] = pd.to_datetime(df2['Date'])
x1=(df['Date'] - dt.datetime(1970,1,1)).dt.total_seconds()/86400
x2=(df2['Date'] - dt.datetime(1970,1,1)).dt.total_seconds()/86400
t0=[]
for i in range(len(x1)):
for j in range(len(x2)):
t=x2[j]-x1[i]
if x2[j]==x2[0]:
x2[j]+=1
if x2[j]==len(x2):
x1[i]+=1
t0.append(t)
def dcf(x1, x2):
x_n = len(x1)
y_n = len(x2)
x_mean = np.mean(x1)
y_mean = np.mean(x2)
x_stdv = np.std(x1)
y_stdv = np.std(x2)
dcf = np.zeros((x_n, y_n))
for i, x_val in enumerate(x1):
for j, y_val in enumerate(x2):
d = (x_val - x_mean) * (y_val - y_mean) / (x_stdv*y_stdv)
dcf[i, j] = d
return dcf
y=np.array(dcf(x1,x2))
x=np.array(t0)
"""
plt.plot(x,y, ls='-', lw='1', color='red', marker='.', label=r"$x$")
plt.title('DCF vs Lag')
plt.xlabel('time lag')
plt.ylabel('DCF')
plt.show()
""" `
lapis sequoia
Hello peeps!! how do i create dict from two lists of list.???
list = [[1, 30, 5], [2, 64, 4]]
list2 =[ [2, 64, 4], [1, 30, 5]]
 calm thicket
what should the resulting dict look like
lapis sequoia
dict = {1:2,30:64, 5:4, 2:1,64:30, 4:5}
each element of list1 as key and each element of list2 as the value
possible?? i found it really hard to do it
calm thicket
it is certainly possible
lapis sequoia
could you please help me out on this?
calm thicket
dict(zip(itertools.chain.from_iterable(list1), itertools.chain.from_iterable(list2)))
you have to import itertools of course
lapis sequoia
 calm thicket
that's why you don't name things the same name as builtin things
lapis sequoia
any way to flatten a pandas dataframe into a list
serene scaffold
lapis sequoia
any way to flatten a pandas dataframe into a list
Is it all numbers?
Flattening a dataframe seems like a weird thing to want to do, since a list can't express relations like a dataframe does
But if it's all numbers, you can use to_numpy and reshape that.
austere swift
github copilot literally just wrote an entire rnn based encoder for me

(i wasn't gonna use an rnn but that's interesting though)
 lyric ermine
so i got a column in my df and i wanna drop all rows which are duplicates but keep all the NaN values, what is the best way to do so? anybody got some tip?
serene scaffold
!docs pandas.DataFrame.drop_duplicates
arctic wedgeBOT
DataFrame.drop_duplicates(subset=None, keep='first', inplace=False, ignore_index=False)```
Return DataFrame with duplicate rows removed.

Considering certain columns is optional. Indexes, including time indexes are ignored.df[(~df.duplicated()) | (df['col'].isnull())]
i think i found a solution
df[(~df['website'].duplicated()) | (df['website'].isnull())]
sorry was busy fixing it @serene scaffold @main fox
 sour abyss
anyone know good courses for learning data sci/ml?
 deft harbor
Is there anything specific that interests you?
 unkempt jay
I have a question to do with saving data in python
var=(x,y,pygame.image)
when i try to use pickle it says i cant save a pygame.surface so it there anyway to convert it to something that can be saved
sour abyss
deft harbor
Is there anything specific that interests you?
things like web scraping, data collecting, and tensorflow
 random nest
Kaggle.com/courses looks good
 small bison
does anyone know how to work with datetime in pandas dataframe? I'm trying to use this more giving error.

-> ValueError: unconverted data remains: e
shut trail
small bison
does anyone know how to work with datetime in pandas dataframe? I'm trying to us...
does it run without the .dt.month ?
shut trail
unkempt jay
I have a question to do with saving data in python
var=(x,y,pygame.image)
when...
ive used buffer objects to save matplotlib figures for later editing. would that work ?
small bison
shut trail
ive used buffer objects to save matplotlib figures for later editing. would that...
I didn't get it right. but with .dt.mont or without it, it's giving the same error
shut trail
small bison
I didn't get it right. but with .dt.mont or without it, it's giving the same err...
even without formatting ?
id try without formatting then using .month
gotta see the data to understand the problem
small bison
shut trail
gotta see the data to understand the problem
can i send you the csv file
arctic wedgeBOT
Hey @small bison!
Uh-oh! It looks like your message got zapped by our spam filter. We currently don't allow .csv attachments, so here are some tips to help you travel safely:
• If you attempted to send a message longer than 2000 characters, try shortening your message to fit within the character limit or use a pasting service (see below)
• If you tried to show someone your code, you can use codeblocks
(run !code-blocks in #bot-commands for more information) or use a pasting service like:
 next lance
What is the first step to make a object detection model
 fickle hill
hi anyone done any gtp-2 modeling ?
serene scaffold
@next lance you need a dataset
fickle hill
serene scaffold
<@810795950246854664> you need a dataset
I'm, gathering the dataset
serene scaffold
fickle hill
hi anyone done any gtp-2 modeling ?
Even if someone has, you'll get help faster if you put your real question out there
fickle hill
the question is the type of data
serene scaffold
fickle hill
I'm, gathering the dataset
I was talking to giant.
fickle hill
soz
lapis sequoia
!e
arctic wedgeBOT
 Command Help
!eval [code]
Can also use: e
*Run Python code and get the results.
This command supports multiple lines of code, including code wrapped inside a formatted code block. Code can be re-evaluated by editing the original message within 10 seconds and clicking the reaction that subsequently appears.
We've done our best to make this sandboxed, but do let us know if you manage to find an issue with it!*
lapis sequoia
!e
print("black" * 999)````@lapis sequoia :white_check_mark: Your eval job has completed with return code 0.
blackblackblackblackblackblackblackblackblackblackblackblackblackblackblackblackblackblackblackblackblackblackblackblackblackblackblackblackblackblackblackblackblackblackblackblackblackblackblackblackblackblackblackblackblackblackblackblackblackblackblackblackblackblackblackblackblackblackblackblackblackblackblackblackblackblackblackblackblackblackblackblackblackblackblackblackblackblackblackblackblackblackblackblackblackblackblackblackblackblackblackblackblackblackblackblackblackblackblackblackblackblackblackblackblackblackblackblackblackblackblackblackblackblackblackblackblackblackblackblackblackblackblackblackblackblackblackblackblackblackblackblackblackblackblackblackblackblackblackblackblackblackblackblackblackblackblackblackblackblackblackblackblackblackblackblackblackblackblackblackblackblackblackblackblackblackblackblackblackblackblackblackblackblackblackblackblackblackblackblackblackblackblackblackblackblackblackblackblackblackblackblackblackblackblackblackblackblackblackblack
... (truncated - too long)
Full output: https://paste.pythondiscord.com/sogejuhete.txt?noredirect
arctic wedgeBOT
@lapis sequoia :x: Your eval job has completed with return code 1.
001 | Traceback (most recent call last):
002 |   File "<string>", line 2, in <module>
003 | AttributeError: 'str' object has no attribute 'lenght'
 prisma jay
i have a big functions that process pandas dataframes. it run incredibly slow. Can i speed up the process by replacing pandas dataframes with pyspark dataframes? will it give significant impact to the performance?
 misty flint
if theres anyway you can improve the functions, thatd be ideal. if not, test using pyspark. in theory, it should be much faster but it can depend on the function itself
 wide meadow
Is L2 norm preferred over L1 norm for regularising the weights in neural networks?
 bold dove
Hi everyone.
I'm trying to build a module that for a given text, it returns a "tag" that defines what does the text talks about.
Not sure if this is data science, ML, or any other topic, I'm new but would like to learn...
If someone has done something similar, I'd appreciate if you tell me how to get started (docs/topics/etc).
My current approach is using regex to identify words related to the tag, but it looks to me that this isn't the most accurate way to do this task..
odd meteor
bold dove
Hi everyone.
I'm trying to build a module that for a given text, it returns a "t...
I'm currently working on something that's kinda related to this in Natural Language Understanding (I'm learning NLP).
This could be related to NER, more specifically; extraction of intent and entity from a message.
You might wanna check Rasa NLU model and other related model for entity extraction from a text.
bold dove
odd meteor
I'm currently working on something that's kinda related to this in Natural Langu...
sounds good. Looking at it. Thanks
 past plover
Hey, so I'm really interested in ML and wanted to run this basic NN and do some fidgeting around on what effect different hyper parameters have using the MISNT dataset but I just cant get to run the neural network, it was build for python 2.7 and I'm also using that as my interpreter in pycharm, but it still spits out an error I don't understand (basically have no experience whatsoever, other than the raw theory)
I think I got the wrong/no numpy version or sth
 empty flame
I am trying to do basic image processing. I have a 8k image when I try to open tha image using tkinter canvas I can only see a part of the image( image is adjusted to my 2k screen) Is there a way to see the full 8k image without resizing it. If I resize the image there is huge drop in quality. Is there any other way?
shut trail
Fitting an 8k down to two is resizing it... Are you just trying to look at another part of the image?
Trying to pan and zoom out I guess?
 green wasp
 hello hello! Can someone guide me in the right direction for making an OCR?
 hexed wind
Hello, I have few python scripts which contain some etl functions. I want to schedule them to run one by one in an ec2 once in a week. What's the best way to do it to have logs of all scripts ?
shut trail
what part of your question is about python data science and ai ?
sorry a little unclear maybe 🙂
you want to use python to schedule running python scripts. if so thats easy enough
hexed wind
sorry if I have posted in wrong channel, I want to schedule several scripts and get a log stored in one file
shut trail
ya, wrong channel for sure lol but ummm where are you stuck ? is the instance always running? are you using an api?
serene scaffold
shut trail
ya, wrong channel for sure lol but ummm where are you stuck ? is the instance al...
Please don't answer questions that don't relate to the topic of the channel.
Instead, please direct the question to the appropriate channel.
shut trail
which is?
serene scaffold
shut trail
which is?
I don't understand the question, so I can't say, I'm just going by your assessment that this is the "wrong channel for sure". They can also claim a channel per the instructions in #❓|how-to-get-help
shut trail
i like how organized this server is. breath of fresh air
 gritty obsidian
what do people think of anaconda over vs?
serene scaffold
shut trail
i like how organized this server is. breath of fresh air
I'm glad that you see this as a positive. Thanks!
serene scaffold
gritty obsidian
what do people think of anaconda over vs?
vs, like venv?
gritty obsidian
yea
serene scaffold
gritty obsidian
yea
I find venvs more straightforward, but anaconda supports non-python dependencies, or something
gritty obsidian
tensorflow recommend creating venv
serene scaffold
I would use venv unless you're in a situation where you're sure you need to use anaconda
gritty obsidian
can i do venv in vsc
serene scaffold
gritty obsidian
can i do venv in vsc
vsc is just the code editor. the venv is where the python executable is.
gritty obsidian
can you help me understand pls
so
its like a seperate python installation away from your main one
misty flint
wide meadow
Is L2 norm preferred over L1 norm for regularising the weights in neural network...
usually but i believe scikit-learn also has a 'mixed' option where you can adjust how much you want to apply of either L1 and L2
 tranquil folio
gritty obsidian
its like a seperate python installation away from your main one
tranquil folio
gritty obsidian
its like a seperate python installation away from your main one
Kinda yeah. Just run python -m venv venv in your project folder, then reopen the folder in VSCode and it should automatically detect venv as your interpreter. You can start using pip to install packages and it will use that venv folder instead of you main Python installation
gritty obsidian
ah
deft harbor
gritty obsidian
what do people think of anaconda over vs?
Deploying models to production based off conda and jupyter notebooks is a nightmare
We insist on pipenv or poetry at this point
serene scaffold
deft harbor
Deploying models to production based off conda and jupyter notebooks is a nightm...
imo, jupyter notebooks should always be treated as disposable.
deft harbor
There seems to be a gap between people new to DS or ML and the rest of the environment. It would be nice if they explored in a notebook, but then where still capable of coding up the rest.
Not everyone struggles with that, but a surprisingly large number of people do
serene scaffold
deft harbor
Not everyone struggles with that, but a surprisingly large number of people do
It seems that data science courses that don't assume prior programming experience start people out in Jupyter, and I feel like if you start there, you don't learn modularity. But then again, people who write in languages that are lower-level than Python say that Python natives don't learn certain fundamentals. Maybe I'm like them.
 heady tide
I beleive that maths is much more important than programming for DS and ML
programming is just a tool
iron basalt
heady tide
I beleive that maths is much more important than programming for DS and ML
It depends what you are doing in ML. If you are the one writing something like Pytorch, you will need to not only know low level programming, but the very hard class of programming that is parallel programming.
(And GPU programming ofc)
deft harbor
heady tide
programming is just a tool
ds is just a tool too. 😉
heady tide
but math is higher in the higherarchy
we use math as a tool to explain the world
we use python for DS and ML as a tool to explain math
 desert oar
i agree with squiggle, it depends a lot on the kind of work that you do
misty flint
omg speaking of gpus, i was retraining a model and it ran out of memory yesterday 
velvet thorn
heady tide
I beleive that maths is much more important than programming for DS and ML
and if you're a machine learning engineer?
there is no getting around the need for software engineering ability.
heady tide
Yeah but what I am saying is that maths is much more essential for DS and ML than coding
coding is a tool used to describe the maths
desert oar
but practically you don't need to know much math, certainly not any theory as such, in order to be "dangerous" with regression modeling and other entry-level machine learning
i think it's perfectly reasonable to approach math on a need-to-know basis
learn some techniques on an intuitive level, learn how to do it in code, then learn the math in order to deepen your undersatnding
that's generally the "learning loop" that i recommend for beginners: learn a technique (intuition + math at your current level of understanding), learn to use the relevant library, deepen/solidify understanding with underlying theory
as you get more advanced, you can take a more "math-first" approach, especially as your use cases diverge from what is readily available in libraries
so "more essential" at a beginner level? no, i disagree. in principle, yes, people have been doing data analysis and statistics long before the word "computer" even referred to a type of person, let alone to a type of machine
it's like learning music; you don't need to learn the full theory, just start learning to use your main tool/instrument and learn theory as you go
think of programming as equivalent to practicing technique and precision, versus learning about data analysis as equivalent to learning about interpretation and performance, versus learning calculus and linear algebra as equivalent to learning about music theory
you need all 3, but you need a balance of all 3 as you learn
 desert oar
yeah honestly it worked better than i thought it would 😆
main fox
I had fun with the math behind k-means clustering. The math itself was easy and the intuition was clear.
The math behind logistic and polynomial regression was more involved.
 dapper hatch
Good night community !. I have this code, I need to go through the list of each user, and then do some mathematical operations
cnn = mysql.connector.connect(
    host = 'localhost',
    user= 'root',
    passwd = '123456',
    database = ''
)

cur = cnn.cursor()
cur.execute('SELECT * FROM usuarios')
datos = cur.fetchall()

for row in datos:

    lista = row[:]
    print(lista)
logistic regression makes a lot more sense when you learn generalized linear models
polynomial regression is just linear regression 😉
desert oar
dapper hatch
Good night community !. I have this code, I need to go through the list of each ...
did you have a question about this code?
serene scaffold
@desert oar your analysis was excellent. I wish it was in one message so I could pin it.
dapper hatch
desert oar
did you have a question about this code?
Yes, how do I have to go through the list to see each user?
main fox
I'm comfortable with the intuition behind logistic regression now. Initially seeing the equation 1/(1+e^-(coeffs)) and knowing it resulted in values between 0 and 1 was impressive. Like it's pretty crafty 😄
And yes, you end up doing linear regression with non-linear relationships once you transform them. But interpreting the equation wasn't too straightforward with some transformations. Sometimes you'd trade accuracy for explainability in some transformations.
dapper hatch
the users change every hour and that is why I need to consult the database, to know when there is a new user
desert oar
serene scaffold
<@!389497659087650836> your analysis was excellent. I wish it was in one message...
maybe pin the first message? or i can copy and paste it into one messages
ty for the endorsement
desert oar
main fox
I'm comfortable with the intuition behind logistic regression now. Initially see...
i guess that's my point, once you know what a GLM is and how it works, it's no longer a crafty trick but a natural and intuitive model for binary data
desert oar
dapper hatch
the users change every hour and that is why I need to consult the database, to k...
so every hour you want to check the set of users in the database, and compare with the previous hour to see if any have been added? does the program keep running in that hour, or does the program run once every hour? in the 2nd case, you will have to save the list of users somewhere, maybe to a file on the computer.
also i am happy to help with this here, but in the future this might be a better question for #databases or even a help channel (see #❓|how-to-get-help)
dapper hatch
desert oar
so every hour you want to check the set of users in the database, and compare wi...
users table 10, after an hour users table 15, I have to save that data somewhere, and then perform various operations. For example: the user with id 4220, I need to know how many accounts he has, now I know the position, but I would have to handle it dynamically, since it changes. Is it better understood?
arctic wedgeBOT
4. Use English to the best of your ability. Be polite if someone speaks English imperfectly.
 median idol
Guys, could someone help me why seaborn throws me that error
ValueError: Could not interpret value `Open` for parameter `y
plt.show()```Here is my code

First I had problem with x-axis, but I fixed using .index , but right now I dont really know what to do
median idol
median idol
```sns.lineplot(x= df.index ,y='Open',date=df)
plt.show()```
And it is the same for every column if i try to put 'High' or 'Low into y, the same will occur :c
desert oar
dapper hatch
users table 10, after an hour users table 15, I have to save that data somewhere...
not entirely, sorry. maybe a more complete example might help
 raven jackal
im not sure why my code isnt working

i dont really understand the help it is given me. Any help please😅
desert oar
raven jackal
!code can you please post your code as text, not a screenshot? read carefully below 👇
arctic wedgeBOT
Here's how to format Python code on Discord:
```py
print('Hello world!')
```
These are backticks, not quotes. Check this out if you can't find the backtick key.
desert oar
!paste also include the complete error output. if the output is very long, use our "paste site". again, read carefully below for instructions:
arctic wedgeBOT
Pasting large amounts of code
If your code is too long to fit in a codeblock in discord, you can paste your code here:
https://paste.pythondiscord.com/
After pasting your code, save it by clicking the floppy disk icon in the top right, or by typing ctrl + S. After doing that, the URL should change. Copy the URL and post it here so others can see it.
raven jackal
from ij import IJ
def GetPixelValue(process, width, height):
GetPix = []
for x in range (0, width):
for y in range(0, width):
pixel = process.getPixel (x, y)
GetPix.append(pixel)
return GetPix
myimage = IJ.getImage()
processor = myimage.getProcessor()
w = processor = myimage.getWidth()
h = processor.getHeight()
ValueList = GetPixelValue (processor, w, h)
bins = [0] * 26
for pixel in ValuesList:
bin_index = int(pixel/10)
bins[bin_index] += 1
print(bins)
Traceback (most recent call last):
File "New_.py", line 14, in <module>
AttributeError: 'int' object has no attribute 'getHeight'
austere swift
What issues are you having?
lapis sequoia
I have two numpy arrays each in the shape of (5, 200)
the inputs and outpuits
and i want to train an RNN to predict the outputs from the inputs
when i watch vids on people making it, they change the shapes of the inputs and outputs
do you know why they do that?
austere swift
change the shape to what?
austere swift
It could just be because the model expects batches (this is the same with most models anyways)
the first axis is interpreted as the number of samples
raven jackal
is anyone here familiar with ImageJ?
lapis sequoia
data = final_array_final
target = different_arrays

# normalize data by dividing every value by 100
data /= 100
target /= 100

# Make training and testing data
x_train, x_test, y_train, y_test = train_test_split(data, target, test_size=0.2, random_state=4)

# RNN Model
model = Sequential()

# add LSTM layers
# Before adding multiple layers, return_sequences was False
model.add(LSTM((1), batch_input_shape=(None, 5, 1), return_sequences=True))
model.add(LSTM((1), return_sequences=False))

model.compile(loss='mean_absolute_error', optimizer='adam', metrics=['accuracy'])
print(model.summary())

history = model.fit(x_train, y_train, epochs=100, validation_data=(x_test, y_test))

# see predictions
results = model.predict(x_test)
plt.scatter(range(20), results[:20], c='r')
plt.scatter(range(20), y_test[:20], c='g')
plt.show()
can you please use the code block instructions i posted?
lapis sequoia
this is my code
austere swift
so if you have one sample, you'd reshape it to (1, 5, 200)
lapis sequoia
data and target are both in the shape of (5, 200)
im getting an error when I run that because of the shape
it's in
model.add(LSTM((1), batch_input_shape=(None, 5, 1), return_sequences=True))
model.add(LSTM((1), return_sequences=False))
how do I fix it
austere swift
lapis sequoia
im getting an error when I run that because of the shape
what error specifically
lapis sequoia
ValueError: Input 0 of layer sequential is incompatible with the layer: expected ndim=3, found ndim=2. Full shape received: (None, 200)
I thought None meant any shape
austere swift
also I don't think batch_input_shape is an argument for that, you're using tf.keras.layers.LSTM right?
austere swift
lapis sequoia
I thought None meant any shape
-1 means any shape (in terms of reshape functions)
lapis sequoia
the Sequential() im using is keras.engine.sequential
austere swift
lapis sequoia
the Sequential() im using is keras.engine.sequential
i mean the LSTM
lapis sequoia
 raven jackal
@desert oar im not sure how to do the end back ticks without pressing enter😅
lapis sequoia
when i do
model.add(LSTM((1), batch_input_shape=(5, 200), return_sequences=True))
model.add(LSTM((1), return_sequences=False))
I get the error
ValueError: Input 0 of layer lstm_2 is incompatible with the layer: expected ndim=3, found ndim=2. Full shape received: (None, 1)
the first line is the problem
desert oar
raven jackal
<@!389497659087650836> im not sure how to do the end back ticks without pressing...
what keyboard layout do you use?
you can press enter after you type the 3 ```
raven jackal
desert oar
alternatively you can press shift-enter to put a new line into your message without sending it
thanks for the code
raven jackal
is the link alright?
desert oar
yes
austere swift
lapis sequoia
when i do
```py
model.add(LSTM((1), batch_input_shape=(5, 200), return_sequence...
use (1, 5, 200) as your shape, and reshape the inputs accordingly
desert oar
it looks like you accidentally overwrite the processor variable
processor = myimage.getProcessor()
w = processor = myimage.getWidth()
h = processor.getHeight()
look at the 2nd line here @raven jackal
you replace processor with a number
and of course the number has no attribute getWidth(), which is what the error says
raven jackal
right the second line. I am not sure what you mean by replacing it with a number though
lapis sequoia
thanks
ok so when i run history = model.fit(x_train, y_train, epochs=100, validation_data=(x_test, y_test)) i get an error
ValueError: Input 0 of layer sequential_1 is incompatible with the layer: expected ndim=3, found ndim=2. Full shape received: (None, 200)
full code
data = final_array_final
target = different_arrays

np.reshape(data, (1, 5, 200))
np.reshape(target, (1, 5, 200))

# normalize data by dividing every value by 100
data /= 100
target /= 100

# Make training and testing data
x_train, x_test, y_train, y_test = train_test_split(data, target, test_size=0.2, random_state=4)

# RNN Model
model = Sequential()

# add LSTM layers
# Before adding multiple layers, return_sequences was False
model.add(LSTM((1), batch_input_shape=(1, 5, 200), return_sequences=True))
model.add(LSTM((1), return_sequences=False))

model.compile(loss='mean_absolute_error', optimizer='adam', metrics=['accuracy'])
print(model.summary())

history = model.fit(x_train, y_train, epochs=100, validation_data=(x_test, y_test))

# see predictions
results = model.predict(x_test)
plt.scatter(range(20), results[:20], c='r')
plt.scatter(range(20), y_test[:20], c='g')
plt.show()
should i remove the processor part of that line?
lapis sequoia
also i get an error when I try and run
results = model.predict(x_test)
ValueError: Input 0 of layer sequential_1 is incompatible with the layer: expected ndim=3, found ndim=2. Full shape received: (None, 200)
lapis sequoia
austere swift
as in, what do the different axes represent
the inputs are 200 numbers from -5 to 5. I normalized them so they are very small numbers
for the outputs, I basically generate a random number from 0-360 (for degrees). Then I add all the inputs together on top of that initial random number
whenever it goes above 360, it goes back to 0. Whenever it goes below 0, it goes back up to 360
austere swift
lapis sequoia
the inputs are 200 numbers from -5 to 5. I normalized them so they are very smal...
so theres 5 sets of these 200 numbers, and those correspond to timesteps correct?
lapis sequoia
yeah
austere swift
so you only have one sample?
lapis sequoia
yeah i have 1 sample of 5 time steps
wait there are 200 time steps
5 are the repeats
repeats = 5
timesteps = 200

random.seed(1)
different_arrays = None
final_array = None
final_array_final = None

for f in range(repeats):
    starting_value = random.randint(0, 360)
    final_array = np.array([])

    print("Starting value is " + str(starting_value))

    i = 0
    while i < timesteps:
        number = random.randint(-5, 5)
        final_array = np.append(final_array, number)
        i += 1

    values = np.array([starting_value])

    for x in final_array:
        if x + starting_value > 360:
            starting_value = 0
        elif x + starting_value < 0:
            starting_value = 360
        starting_value += x
        values = np.append(values, starting_value)

    values = values[:-1]

    if different_arrays is None:
        different_arrays = np.zeros([repeats, values.__len__()])

    if final_array_final is None:
        final_array_final = np.zeros([repeats, final_array.__len__()])

    # OUTPUTS
    different_arrays[f] = values
    # INPUTS
    final_array_final[f] = final_array
that's the code
austere swift
well the input should be in the shape (batch size, timesteps, features)
so you'd need to reshape that
lapis sequoia
i have it in (1, 5, 200)
austere swift
so if you have 200 timesteps then you should have it in (1, 200, 5)
lapis sequoia
how do i know how many timesteps i have
are timesteps the number of rows or columns
austere swift
do you know the basics of RNNs?
lapis sequoia
kinda
austere swift
so you know that they recursively loop on themselves, in timesteps
(hence the name, recurrent neural network)
austere swift
well you'd call the 5 the values, the samples is the number of total training samples you have (which is 1)
lapis sequoia
oh
austere swift
so your shape should be (1, 200, 5)
austere swift
yes
lapis sequoia
ill stick with 1 for now I'll add more later
so I changed the shape and still get the same error
ValueError: Input 0 of layer sequential_2 is incompatible with the layer: expected ndim=3, found ndim=2. Full shape received: (None, 200)
(1, 200, 5) is my shape
austere swift
what version of tf/keras do you have btw?
lapis sequoia
2.5.0 for tf
austere swift
what about keras
or are you using tf's integrated keras?
(if so that's good, keep it that way)
lapis sequoia
no im importing keras
also I restarted my progrma
and now when I make the training and testing data I get an error
ValueError: With n_samples=1, test_size=0.2 and train_size=None, the resulting train set will be empty. Adjust any of the aforementioned parameters.
data = final_array_final
target = different_arrays

data = np.reshape(data, (1, 200, 5))
target = np.reshape(target, (1, 200, 5))

# normalize data by dividing every value by 100
data /= 100
target /= 100

# Make training and testing data
x_train, x_test, y_train, y_test = train_test_split(data, target, test_size=0.2, random_state=4)
use tf.keras instead
your keras version is probably very old, because keras.engine.Sequential and keras.layers.recurrent dont even exist in the current version
lapis sequoia
the train_test_split is still giving error
austere swift
you have one sample, you can't expect to get a train and test set with 1 sample
lapis sequoia
oh
wait
i ran the loop 5 times
which meant 5 differnet columns
i wanna make that into a sample
(200, 5)
i'll change the shape
austere swift
then there are no timestamps
austere swift
okay so you want 5 samples, 200 timestamps, 1 value per timestamp
lapis sequoia
yeah
lapis sequoia
ok the train_test_split works now
but im stuck at the history one now
history = model.fit(x_train, y_train, epochs=100, validation_data=(x_test, y_test))
as well as predict
austere swift
did you change the lstm shape
lapis sequoia
data = final_array_final
target = different_arrays

data = np.reshape(data, (5, 200, 1))
target = np.reshape(target, (5, 200, 1))

# normalize data by dividing every value by 100
data /= 100
target /= 100

# Make training and testing data
# need more samples for train test split
x_train, x_test, y_train, y_test = train_test_split(data, target, test_size=0.2, random_state=4)

# RNN Model
model = tf.keras.Sequential()

# add LSTM layers
# Before adding multiple layers, return_sequences was False
model.add(tf.keras.layers.LSTM((1), batch_input_shape=(1, 5, 200), return_sequences=True))
model.add(tf.keras.layers.LSTM((1), return_sequences=False))

model.compile(loss='mean_absolute_error', optimizer='adam', metrics=['accuracy'])
print(model.summary())

history = model.fit(x_train, y_train, epochs=100, validation_data=(x_test, y_test))
results = model.predict(x_test)
oh
ok so i changed it
it went Epoch 1/100
then it gave error
Function call stack: train_function -> train_function -> train_function
then when i run model.predict, it gives error predict_function -> predict_function -> predict_function
 fresh kraken
hi i think data scientists do not make any impactful thing and just crunch the data to get some new trick to sell people , and on the other hand machine learning engineers are more genius they actually make something that is revolutionary , and that is why i do not like data science , please tell me is this thinking correct ?
desert oar
fresh kraken
hi i think data scientists do not make any impactful thing and just crunch the d...
no
either you're trolling or you don't really understand what either field does
fresh kraken
desert oar
no
i ain't trolling , i am schoked myself , that why do i think that , but from my general understanding of the surroundings of the field, i get a perspective that machine learning guys work on things like alpha go protein folding self driving cars, which are so much cooler than ,people who work as data scientists, just optimising and manipulating data to find better solution for the sales and marketting team
pleas tell me this is not truth and why it is not, i do not want to be that idiot hater kind of guy
 unique pulsar
:(( excuse me, I am struggling with label image process, can someone help me? Please
main fox
fresh kraken
i ain't trolling , i am schoked myself , that why do i think that , but from my ...
https://www.springboard.com/blog/ai-machine-learning/machine-learning-engineer-vs-data-scientist/
TLDR; a data scientist would help find which models are appropriate and an engineer would help scale and deploy

There’s some confusion surrounding the roles machine learning engineer vs. data scientist. However, if you parse things out, the distinctions become clear.
Also, it would be odd to have a data engineer without them performing data science, or without a data science team. They usually work together.
 rotund trellis
Hi, I have to code the GLCM for feature extraction in python, it is a school project using the description of formulas given in this document.
 rotund trellis
Hi, I have to code the GLCM for feature extraction in python, it is a school pro...
rotund trellis
rotund trellis
Hi, I have to code the GLCM for feature extraction in python, it is a school pro...
This is what i have done thus far but am still not able to get it right, any assistance would be appreciated, thanks.
 iron basalt
fresh kraken
i ain't trolling , i am schoked myself , that why do i think that , but from my ...
iron basalt
fresh kraken
i ain't trolling , i am schoked myself , that why do i think that , but from my ...
They are just job titles. People do amazing things, not titles.
*Titles also change over time. Back in the day people were employed as "Scientist".
fresh kraken
iron basalt
*Titles also change over time. Back in the day people were employed as "Scientis...
i see
 analog lantern
hello
 thin cargo

 warped helm
 woeful falcon
is nlp 'easy' ?
woeful falcon
is nlp 'easy' ?
depends what you mean by easy
what parts of NLP are you trying to learn?
woeful falcon
i was wondering if it's as easy as training a tiny model on a laptop,
with a small database of a non-english language : )
warped helm

Training Pipelines & Models
Train and update components on your own data and integrate custom models
go for it
 brazen spire
RuntimeError: Given input size: (192x2x2). Calculated output size: (192x0x0). Output size is too small
why do i have this error?
Can't post the whole code
Pastebin
Pastebin.com is the number one paste tool since 2002. Pastebin is a website where you can store text online for a set period of time.
weird it works on google colab but not localy on jupyter notebook..
 shut tapir
Hello guys!
Has anyone tried using HuggingFace transformers model without an internet connection by using pretrained models to be loaded from the disk?
desert oar
fresh kraken
i ain't trolling , i am schoked myself , that why do i think that , but from my ...
ok, that's kind of funny. your perception of machine learning is more glamorous than in real life. your perception of data science is uncharitable, but more accurate than most data scientists care to admit.
yes, there are some data science teams that are glorified business analytics units attached to a marketing department. that is a result of some complicated forces in the industry, related to a lack of good-quality data in general, the general unwillingness of business owners to spend money on "research", and the enormous amount of money still to be made on digital advertising. but there is plenty of constructive data science work and plenty of very smart people doing it.
consider that data science is not any one thing, but is more a type of knowledge worker, who uses tools from statistics and machine learning to answer business problems. the distinction between "data science" and "machine learning" tends to be blurry. it's better to think of "data science" as a broad category, encompassing the traditional fields of "applied statistics" and "applied machine learning". that said, the "science" part of the name is generally a misnomer.
note also that many (most) people who work on machine learning do not build self-driving cars, and a lot of machine learning happens in support of what you might call "business data science". for example, the insurance industry is investing in machine learning for natural language processing, in order to process decades of old claim documents and enormous quantities of unstructured data like accident reports. is that "machine learning" or "data science"? arguably it's both.
if you personally find it more interesting to work on self-driving cars than processing insurance claims, i don't blame you (note: i prefer insurance claims). but don't assume that many or even most machine learning researchers are doing "genius" or "revolutionary" work.
i also generally dislike marketing people and i try to avoid working with/for them.
brazen spire
Anyone ever got this problem while using cuda?
RuntimeError: CUDA out of memory. Tried to allocate 440.00 MiB (GPU 0; 8.00 GiB total capacity; 2.03 GiB already allocated; 4.17 GiB free; 2.24 GiB reserved in total by PyTorch) If reserved memory is >> allocated memory try setting max_split_size_mb to avoid fragmentation. See documentation for Memory Management and PYTORCH_CUDA_ALLOC_CONF
with pytorch
shy nimbus
Hello everyone, soon I will be participatung in a machine learning competition and my question is there somewhere something like a table of training algorithms for data. For example: use Decision Tree Classifier for balanced dataset multi class classification tasks? I need get the highest accuracy among all participants, I will be use GridSearchCV for tune hyperparametrs, but I want use the best learning algorithm
 rigid zodiac
Hi everyone, Quick question, can we use groupby and feed it to ML ?
like i'm trying to do df = data.groupby() and consider it as a predictors
fresh kraken
desert oar
ok, that's kind of funny. your perception of machine learning is more glamorous ...
the answer you gave cleared so many doubts and misconceptions that I would not have been able to clear without spending much more time and effort, I read the answer more than 2 times understanding the depth of what you are trying to say, and I realise how wrong I was towards data science and my general respect towards it is has been increased a lot now. I knew in my mind that i was wrong , but i really needed to talk to someone regarding this,Thank you very much, for taking your time and answering my question , it really means a lot
desert oar
good luck out there, stay away from the marketing department 😉
 devout sail
Did anyone have the pleasure of trying to set up a pytorch environment using poetry?
The issue is that I want both torch and torchvision, and I need their cuda versions, so I specified the URLs in pyproject.toml, but I get the following error:
Because torchvision (0.11.1+cu113) depends on torch (1.10.0)
   and project depends on torch (1.10.0+cu113), torchvision is forbidden.
  So, because project depends on torchvision (0.11.1+cu113), version solving failed.
So it can't tell that the +cu113 version is acceptable.
desert oar
devout sail
Did anyone have the pleasure of trying to set up a pytorch environment using poe...
how did you specify the torch dependency?
devout sail
with a url to download the wheel
desert oar
i didn't realize +foo was a valid suffix, but it is in fact valid according to pep 440. maybe this is a bug in poetry?
desert oar
devout sail
with a url to download the wheel
show the pyproject file?
is the wheel hosted somewhere special?
devout sail
Currently reading https://github.com/python-poetry/poetry/issues/2613, which doesn't bring me confidence 😅
torch = {url = "https://download.pytorch.org/whl/cu113/torch-1.10.0%2Bcu113-cp39-cp39-linux_x86_64.whl"}
torchvision = {url = "https://download.pytorch.org/whl/cu113/torchvision-0.11.1%2Bcu113-cp39-cp39-linux_x86_64.whl"}
It's able to resolve the versions just fine, but it seems it's unable to properly compare versions with labels
desert oar
hmmm
https://github.com/python-poetry/poetry/issues/2613#issuecomment-853227939 this is the exact issue
alas
use conda 😛
devout sail
Guess I will
Actually conda is not great for me because I want a docker image that's as small as I can (reasonably) make it. requirements.txt then? 
I might use poetry and then have a separate script just for these two dependencies
lapis sequoia
Hi yall! Can somebody point me to a simple python template for classifying pictures? It's just a very basic model that i need. I have a folder1 with a lot of 128x128 pixel pictures and a folder2 with the same pictures but they have been manipulated on pixel-level. I need to train a simple model to be able to classify if the picture has been manipulated or not.
is there maybe some public simple jupyter notebook or keras model that comes to your mind when reading my problem? I am not that deep into machine learning so if anybody could point me to some easy and quick to implement resource that would be great!
 wheat ice
interesting (i think) problem if someone wants to take a peek 👀 #help-pancakes 🥞
 formal lava
What guide is decent and is .net decent or should I setup smth else
rigid zodiac
Hi everyone , I have a few question:
- what is this type of dataframe
- how can I turn my normal data into that
 lapis sequoia
@rigid zodiac it's a list containing lists which contain lists ...
you can take your data and do something like this:
list1=[]
for data_value in dataset_row:
list1.append(data_value)```and then append the list1 together with more lists to a gigalist 🙂
rigid zodiac
lapis sequoia
<@!380930360407621646> it's a list containing lists which contain lists ...
Thank you, can i use it for ML and DL
 idle root
hey guys
how do i make the line continous? the dots and line are random from the normal distribution

and i want the line to be continous through the entire plot given 2 dots
 fierce patio
HI
in ML if i have R-squar close to 1 it s that mean that i have a problm in my model ?plz it s my first ML project
rigid zodiac
fierce patio
in ML if i have R-squar close to 1 it s that mean that i have a problm in my mo...
it really doesnt mean anything... for short, you will need to validation it with the data to determine which model will be better
R-squared determine the fit, sometime in stats if you have a near perfect fit (i.e. 99%) but when you check with validation data, it look like crap..... i.e. you just committed over fitting
brazen spire
Why does pytorch use only 2gb of my GPU?
 hearty briar
brazen spire
Why does pytorch use only 2gb of my GPU?
hearty briar
brazen spire
Why does pytorch use only 2gb of my GPU?
that's a hard question to answer without more information
fierce patio
rigid zodiac
it really doesnt mean anything... for short, you will need to validation it with...
then what s the solution for avoid the over fitting ,thanks u for ur help
rigid zodiac
fierce patio
then what s the solution for avoid the over fitting ,thanks u for ur help
When you split the data set into train test right? make an extra one for validation. This could be in the following ratio (0.8 - 0.1 - 0.1)
once you complete your ML or DL, run it one more time with the validation set
Question: Anyone know how to combine npy data file? I have like about 300k npy file and want to combine it into 1 big NPY
fierce patio
rigid zodiac
When you split the data set into train test right? make an extra one for validat...
thanks u
 ashen umbra
Hi guys how do I learn python fir data science?
rigid zodiac
ashen umbra
Hi guys how do I learn python fir data science?
coursera
ashen umbra
rigid zodiac
coursera
Oh any course recommendations?
rigid zodiac
Machine learning python or IBM machine learning
ashen umbra
Thanks!
austere swift
brazen spire
RuntimeError: CUDA out of memory. Tried to allocate 440.00 MiB (GPU 0; 8.00 GiB ...
this means your gpu ran out of memory, you can fix it by decreasing the amount of data you're putting on the gpu, such as lowering your batch size, lowering the size of your model, or lowering the size of your samples (i.e in image classification you can decrease the resolution)
the only other way to do it would be to get a new gpu with more memory
also check if it runs out of memory during the phase where it sends the model to gpu or when it sends the samples to gpu, that'll tell you whether to shrink your model or your data
rigid zodiac
 dawn sapphire
Where do I go to get help?
dawn sapphire
Where do I go to get help?
here just ask question.
brazen spire
austere swift
this means your gpu ran out of memory, you can fix it by decreasing the amount o...
fixed thanks
rigid zodiac
 brazen spire
but i can't get the program to recognise handwriting numbers
does the preprocessing affect that?
austere swift
you're doing mnist?
brazen spire
Yes
input_size = 150
preprocess_train = transforms.Compose([
transforms.Grayscale(num_output_channels=3),
transforms.Resize(input_size),
transforms.RandomResizedCrop(input_size),
transforms.RandomHorizontalFlip(),
transforms.ToTensor(),
transforms.Normalize(
mean=[0.485, 0.456, 0.406],
std=[0.229, 0.224, 0.225]
)])
preprocess_test = transforms.Compose([
transforms.Grayscale(num_output_channels=3),
transforms.Resize(input_size),
transforms.ToTensor(),
transforms.Normalize(
mean=[0.485, 0.456, 0.406],
std=[0.229, 0.224, 0.225]
)])
from torchvision import datasets
mnist_train = datasets.MNIST('./MNIST/', train=True, download=True,
transform=preprocess_train)
mnist_test = datasets.MNIST('./MNIST/', train=False, download=True,
transform=preprocess_test)
i'm using a google model
austere swift
mnist is only 64x64 btw
so you'd just be upscaling it and increasing your data size, it wont do anything to help it
what model are you using?
brazen spire
Alexnet
dawn sapphire
I am falling behind in class. Write a program that implements and tests an AVL tree delete(key) method. This method accepts a key to remove. If the key is in the tree, the method finds the node with the key, removes the node, re-balances the tree, and returns True. If the key is not in the tree, False is returned.
Similar to the Binary Search Tree implementation, the delete(key) method would need a remove(node) method to remove the node containing the key. This method would be similar in implementation to BST's remove(node) method except that it would also need to ensure the tree is balanced (similar to _put() method).
So, to support the re-balancing operation, implement update_balance_delete(node) method that would recursively update the balance factor of the parent node and call rebalance(node) method if needed.
Finally, make sure update_balance_delete(node) method is called from within remove(node) method during node removal operation. I just tneed to do this.
brazen spire
I thought AlexNet was expecting 256x256
austere swift
alexnet is convolutional, it wont matter what input size you give it
austere swift
and anyways, alexnet is very overcomplicated for mnist
you can train on mnist with a purely dense nn
dawn sapphire
It is a really long code and I need some voice help if possible
brazen spire
i'll try that.
rigid zodiac
dawn sapphire
It is a really long code and I need some voice help if possible
you gotta ask a specific question about your code... We here to help you to figure out not to do your homework lol
dawn sapphire
I know. I just need to do some one on one with questions
austere swift
you can go ahead and ask your questions here
dawn sapphire
I trying to figure out where and I implementing my update_balance_delete(node) for AVL tree

I have a update_balance coded in my AVL Tree Class. I am trying to makes sense for each item that they ask for? So don't a dick and say stupid crap when I am trying to figure stuff out rather look online for a answer.
hearty briar
dawn sapphire
I have a update_balance coded in my AVL Tree Class. I am trying to makes sense ...
???
desert oar
dawn sapphire
I have a update_balance coded in my AVL Tree Class. I am trying to makes sense ...
this belongs in #algos-and-data-structs. "data science" is applied statistics and machine learning
!code also please use code formatting and not screenshots when posting code. read carefully below 👇
arctic wedgeBOT
Here's how to format Python code on Discord:
```py
print('Hello world!')
```
These are backticks, not quotes. Check this out if you can't find the backtick key.
dawn sapphire
@desert oarthx
brazen spire
MNIST is onyl for numbers?
or it can recognise images as well
like fish or something else
there is only 10 classes in it, right? 0 to 9
desert oar
brazen spire
MNIST is onyl for numbers?
It's specifically a data set of hand written digits
0-9
quiet vault
brazen spire
like fish or something else
That would be a different dataset
median idol
Guys, could anyone please advise how to deal with this type of column, as final result I want to strip url links and get the location(last word) ik how to do this, but how do i leave another rows untouched?

Any tips and advices are appreciated
desert oar
median idol
Guys, could anyone please advise how to deal with this type of column, as final ...
That's easier than your other problem
In general you can easily modify individual columns while leaving the others untouched
That's part of the point of pandas
I recommend using a URL parsing library like yarl to extract the url parts
Write a function that accepts 1 string as input. If it contains :// then parse it like a url. Otherwise handle it like a full city name. Then you can use apply in pandas to apply the function to every element of that column
median idol
Oh, thanks 🙏
median idol
desert oar
That's easier than your other problem
Yeah, I just skipped those part with currencies and just wanted to finish this dataset with clearing this column
desert oar
median idol
Oh, thanks 🙏
!pypi yarl
arctic wedgeBOT

Yet another URL library
desert oar
!pypi hyperlink
arctic wedgeBOT
A featureful, immutable, and correct URL for Python.
median idol
@desert oar you mean def function something like that with the help of yarl? def clear_url(dataframe): for x in dataframe: if url.scheme == 'http': dataframe = dataframe.apply(lambda i: i.split("/")[-1]) else: pass
desert oar
median idol
<@!389497659087650836> you mean def function something like that with the help ...
def process_location(text):
    if '://' in text:
        url = yarl.URL(text)
        path_tail = url.path.split('/')[-1]
        return path_tail
    else:
        return text

df['location_clean'] = df['location'].apply(process_location)
process_location is a function of one element. .apply applies the function to every element individually
 wise cipher
When I use pandas to load an excel table, it takes the first entry as the colums of the DataFrame ... does anyone know how to fix it smartly? 🙂
 desert oar
wise cipher
When I use pandas to load an excel table, it takes the first entry as the colums...
desert oar
wise cipher
When I use pandas to load an excel table, it takes the first entry as the colums...
use the header=None option if you are using read_csv
arctic wedgeBOT
Fat chance.
No documentation found for the requested symbol.
arctic wedgeBOT
pandas.read_excel(io, sheet_name=0, header=0, names=None, index_col=None, usecols=None, squeeze=False, dtype=None, engine=None, converters=None, true_values=None, ...)```
Read an Excel file into a pandas DataFrame.

Supports xls, xlsx, xlsm, xlsb, odf, ods and odt file extensions read from a local filesystem or URL. Supports an option to read a single sheet or a list of sheets.Thank you so much, I didn't know that ❤️
median idol
desert oar
```python
def process_location(text):
if '://' in text:
url = yarl.U...
Oh, got you. Thank a lot 🙏
fresh kraken
Hi there, I have prepared a survey for students, on how different students are approaching their studies.
Any participation in the survey will be much appreciated.
You can dm me your answers. Kindly mention your current education level.
1.)) Do you feel more comfortable studying from
|A)computer books,
|B) video lectures,
|C) going hands-on, practical implementation
|D) Different ways for different things?
2.)) You often google your doubts, but what do you do if you do not find the answer on google do you
|A) ask teachers,
|B) seek community help,
|C) solve yourself,
|D) Contact your friends or what else you do?
3.)) On a scale of 0 - 10, How much are you worried about the job(money) in your field? (0 = not worried at all)
4.)) Do you
|A) get inspired by startup success stories and want to set up your startup
|B) you are not interested in business and would just focus on your expertise
|C) you have not currently thought about it and may think in future
|D) you would go with wherever life takes you.
I will provide a report after sufficient data collection.
Thank you very much for answering,
and sharing your perspective
misty flint
interesting

drop-in replacement library for NumPy, bringing distributed and accelerated computing on the NVIDIA platform to the Python community

lapis sequoia
holy crap
desert oar
misty flint
> drop-in replacement library for NumPy, bringing distributed and accelerated co...
everyone is trying to plant their flag and hopefully get a slice of that sweet machine learning cash
see also: all these alternative python implementations coming out of the woodwork (after years of stagnation and lack of interest) at major tech companies
i'm still baffled at how late to the game amd has been with all this, but now that things actually run on rocm there is a glimmer of hope
hope that one day i might be able to run linux, play dota, and do machine learning all on the same desktop machine
fresh kraken
Hey i have created this survey for students, would you like to share your opinions https://forms.gle/nHYVEikL9v7Rsn9M7

Google Docs
Hi there, This is a survey how different students are approaching their studies.
Any participation in the survey will be much appreciated.
 magic dune
misty flint
interesting
magic dune
misty flint
interesting
magic dune
misty flint
interesting
magic dune
misty flint
interesting
send link
 storm river
I have a scatter plot for price vs bhk. I want to add the mean price dots in it. Please give a solution.

X axis = BHK
Y axis = Price
 terse epoch
I have a script with pytrends matplotlib and pandas for trends everything works except in the image the name of countries in x axis doesn't show up properly any help? https://media.discordapp.net/attachments/884012495658967041/907904589469212702/unknown.png
 lapis sequoia
Hello Party People! Quick and easy question: Is more data always the answer when trying to give a model more accuracy?
I posted my problem to reddit: https://www.reddit.com/r/learnmachinelearning/comments/qqpp3c/binary_image_classification_for_detecting_face/

reddit
0 votes and 0 comments so far on Reddit
maybe someone of you has an idea what the best approach is to solve this and achieve more accuracy. I guess I need to generate more data but maybe someone of you has an idea
 teal mortar
lapis sequoia
maybe someone of you has an idea what the best approach is to solve this and ach...
teal mortar
lapis sequoia
maybe someone of you has an idea what the best approach is to solve this and ach...
Hi, have you tried using transfer learning, like use a pretrained model trained on ImageNet, get rid of the top layers and add your layers there, fine tune and maybe get a better result, try reading this: https://www.tensorflow.org/tutorials/images/transfer_learning
lapis sequoia
thanks! I will look into it 😄
teal mortar
lapis sequoia
thanks! I will look into it 😄
with pleasure, hope it helps
lapis sequoia
but just for the sake of understanding:
do i need a pretrained model that has been trained on the exact same labels that i need to train on?
or would it work to use a model that has been trained on faces and i train it on the original face vs. manipulated image labels?
formal lava
What guide is good for ml?
teal mortar
lapis sequoia
or would it work to use a model that has been trained on faces and i train it on...
find a model that was pretrained on human faces
teal mortar
lapis sequoia
but just for the sake of understanding:
tensorflow hub has lots of pretrained models that you can use https://tfhub.dev/s?module-type=image-augmentation,image-classification,image-classification-logits,image-classifier,image-feature-vector,image-generator,image-object-detection,image-others,image-pose-detection,image-segmentation,image-style-transfer,image-super-resolution,image-rnn-agent
teal mortar
formal lava
What guide is good for ml?
you can start with excellent course from Andrew Ng on Machine Learning https://www.coursera.org/learn/machine-learning

Coursera
Learn Machine Learning from Stanford University. Machine learning is the science of getting computers to act without being explicitly programmed. In the past decade, machine learning has given us self-driving cars, practical speech recognition, ...
or deep learning https://www.coursera.org/specializations/deep-learning?

Coursera
Learn Deep Learning from deeplearning.ai. If you want to break into Artificial intelligence (AI), this Specialization will help you. Deep Learning is one of the most highly sought after skills in tech. We will help you become good at Deep Learning.
also a good resource would be the book by Francois Chollet https://www.amazon.com/Learning-Python-Second-François-Chollet/dp/1617296864

Deep Learning with Python, Second Edition
teal mortar
lapis sequoia
or would it work to use a model that has been trained on faces and i train it on...

Face recognition is a computer vision task of identifying and verifying a person based on a photograph of their face. […]
 sudden egret
formal lava
What guide is good for ml?
sudden egret
formal lava
What guide is good for ml?
What do you mean by guide? A whole roadmap?
If so try checking out this video https://www.youtube.com/watch?v=pHiMN_gy9mk
This covers the whole range of tools and things you have to learn in order to be a machine learning engineer within a year or maybe more than that, it depends upon the effort you're putting in.
Goodluck!

Getting into machine learning is quite the adventure. And as any adventurer knows, sometimes it can be helpful to have a compass to figure out if you're heading in the right direction.
Although the title of this video says machine learning roadmap, you should treat it as a compass. Explore it, follow your curiosity, learn something and use what...
sudden egret
lapis sequoia
do i need a pretrained model that has been trained on the exact same labels that...
Well, you can cut out the classification head of the pretrained model and append your head. For instance, resnet is trained on imagenet dataset and its classification head has alot of labels but in reality you dont need any of them, you might need only cats or dogs.
So in this case, you append your classification head you have with the pretrained model and fine tune for more epochs, which helps the pretrained model to learn your features.
Check this guide @lapis sequoia https://www.tensorflow.org/tutorials/images/transfer_learning
misty flint
desert oar
see also: all these alternative python implementations coming out of the woodwor...
this is so true; just look at all the AI tech startups also coming out of the woodwork - all that venture capital money...
formal lava
Ty
formal lava
Do I havr to learn linear regression, KNN and SVM to be good at ML?
desert oar
formal lava
Do I havr to learn linear regression, KNN and SVM to be good at ML?
definitely yes to linear regression. the others are worth knowing about and part of a natural learning progression, even if they aren't commonly used in industry anymore
formal lava
desert oar
definitely yes to linear regression. the others are worth knowing about and part...
Ive watched a vid and it said that KNN is still used to this day, anyway maybe u can recomend where do I start?
desert oar
formal lava
Ive watched a vid and it said that KNN is still used to this day, anyway maybe u...
sure, it's still useful for some things. like i said, it's worth knowing about and part of a natural learning progression.
i don't know of any good general recommendations, check the pinned messages
if you have any specific interests or desires, maybe i can help with those
formal lava
desert oar
if you have any specific interests or desires, maybe i can help with those
Well my somewhat of a main goal is creating "bot" that could learn from the actions it does
desert oar
formal lava
Well my somewhat of a main goal is creating "bot" that could learn from the acti...
i see, then you might want to look into "reinforcement learning"
formal lava
desert oar
i see, then you might want to look into "reinforcement learning"
so i start with regression and go into reinforcment learning? and isnt q and reinforcment learning the same?
desert oar
formal lava
so i start with regression and go into reinforcment learning? and isnt q and rei...
that's a big jump, but you can try to start with some reinforcement learning material and see if it makes sense. you might have to go back and learn more things along the way. i believe q-learning is a specific algorithm for reinforcement learning. reinforcement learning itself is a general category of machine learning tasks.
formal lava
desert oar
that's a big jump, but you can try to start with some reinforcement learning mat...
okay, Ill do more research but should I start in .net (I hope I understand this correctly)?
desert oar
formal lava
okay, Ill do more research but should I start in .net (I hope I understand this ...
python is a lot more popular than .NET for machine learning, i recommend starting with python
unless you mean something else by ".net" other than the microsoft .NET language ecosystem (C#, F#)
formal lava
desert oar
unless you mean something else by ".net" other than the microsoft .NET language ...
Nop u understood it correctly. So now I go into yt, watch some guides and just start doing something (I use VSC)
serene scaffold
(I use VSC btw)
FTFY
desert oar
formal lava
Nop u understood it correctly. So now I go into yt, watch some guides and just s...
i recommend also reading a book or following an online course. individual videos and small guides will not provide the same depth of education
again, check our pinned messages
formal lava
desert oar
i recommend also reading a book or following an online course. individual videos...
okay thanks
formal lava
serene scaffold
> (I use VSC btw)
FTFY
whut?
serene scaffold
formal lava
whut?
it's a meme
formal lava
oh
formal lava
desert oar
i recommend also reading a book or following an online course. individual videos...
do I need to install a new ide or smth?
and how do u define small guide like 3 hours?
desert oar
there is nothing wrong with vs code
formal lava
ok
misty flint
vsc actually released a browser version
vscode.dev
ill probs still use my pycharm tho

formal lava
desert oar
i recommend also reading a book or following an online course. individual videos...
I want to die, is that common for beginners?
desert oar
formal lava
I want to die, is that common for beginners?
it probably happens to everyone once or twice
formal lava
desert oar
it probably happens to everyone once or twice
but does it happen when staring RL?
desert oar
if you have that feeling when first starting something, maybe you are taking on too much at once
ashen umbra
formal lava
I want to die, is that common for beginners?
I relate to this.. also a beginner but I guess having a learning partner can help u stay on track
formal lava
ashen umbra
I relate to this.. also a beginner but I guess having a learning partner can hel...
true, then u can talk about your progression
ashen umbra
Yep exactly. What are u currently working on. Always open to collab..
I am relearning python
formal lava
ashen umbra
Yep exactly. What are u currently working on. Always open to collab..
Im only learning all of the theory and "pseudo code" for RL and rn I want to die like no cap
ashen umbra
ashen umbra
I am relearning python
Taking some coursera courses..
formal lava
why would u do it?
ashen umbra
formal lava
Im only learning all of the theory and "pseudo code" for RL and rn I want to die...
What is RL..? Also ya I guess the best way of learning is by doing it. Esp when comes to coding
formal lava
ashen umbra
What is RL..? Also ya I guess the best way of learning is by doing it. Esp when ...
you know this is for data science and ai right? RL is reinforcement learning
ashen umbra
Ya I k. But trying to self learn smth new. Esp alone can get hard for anyone regardless which intersection of AI we are talking about
formal lava
u alive? xd
ashen umbra
I am multitasking lol
But I am sure there are plenty courses online that can provide u a good sense of direction
For RL
 brisk moth
anyone have a few xeons and v100s i can borrow lmao i have a dataset of 773565 jpgs i need to use
my macbook pro is crying
formal lava
anyone wanna try and work on a project and learn about RL at the same time?
rigid zodiac
Hi everyone, Have you every use multiple npy file to train the model? If you have can you please teach me
formal lava
who u talkin to btw?
desert oar
rigid zodiac
Hi everyone, Have you every use multiple npy file to train the model? If you hav...
i don't want to be rude here, but i think you have enough experience by now to be able to approach a problem like this without asking a "help me pls" type of question. you need to practice working through problems on your own and developing your own solutions, instead of just asking for help online.
rigid zodiac
desert oar
i don't want to be rude here, but i think you have enough experience by now to b...
I honestly dont know how to. Because traditionally we just use the cvs file. If I know how to I would not waste your time
desert oar
rigid zodiac
I honestly dont know how to. Because traditionally we just use the cvs file. If ...
but you don't put a csv file into a magic box and wait for results, right? you write some code to load the data into an array or dataframe, then you write more code to process the data, then you write more code that defines the model, etc. etc.
you already know how to do all of those things
so don't act like you don't know!
maybe your question is "how do i concatenate two numpy arrays" or maybe your question is "what are some established techniques for modeling >2-dimensional data"
but "how do i ml with 2 csv" is not an answerable question, and moreover you already know enough to get past that point and start formulating more specific questions
rigid zodiac
desert oar
but you don't put a csv file into a magic box and wait for results, right? you w...
For 1 big cvs file, yes i do know. In this case i have multiple small npy file in the folders. I have split it into train test val, i just dont know how to feed it into the ML DL
desert oar
ok, that's a more specific question. are you asking specifically about loading data into a framework like pytorch or keras?
how do you normally do it with 1 csv file?
(note it is "CSV" not "CVS")
("Comma Separated Values")
("CVS" is a huge drug store chain in the USA)
rigid zodiac
desert oar
ok, that's a more specific question. are you asking specifically about loading d...
Man what is up with you today, also i have no idea about pytorch. For csv file i just split it to train test val. But this time i use npy
 forest ledge
Hello everyone, I have a python code that when I run it, it opens the camera and detects a face, and outputs the age and the gender, I also have a flutter app, my question is that, how can I integrate these two together?
like, the app has a button with a camera picture on it, and when the user clicks on the camera button, the phone camera should open and the python code should start running to detect the face and outputs the age and gender.
analog lantern
Hello fellas!! I am working on a project that is sign language recognition using image processing and cnn and i'm stuck with some errors. If Any one can show up for help, DM me please .
formal lava
How do I start writting RL code? I've watched like 1 hour of theory but have no clue where to start?
terse epoch
terse epoch
I have a script with pytrends matplotlib and pandas for trends everything works ...
Can someone help me with this? I've sent this message for so long
teal mortar
terse epoch
Can someone help me with this? I've sent this message for so long
try plt.xticks(rotation=70) or 90, if I understood correctly what you want to do
hearty briar
rigid zodiac
Man what is up with you today, also i have no idea about pytorch. For csv file i...
I think what he's saying is that the way you do that is the same with npy as it would be with csv
it's a workflow it's not so much about the format the data is in now
because you are going to be arranging and sanitizing the data do go in the pipeline
terse epoch
teal mortar
try plt.xticks(rotation=70) or 90, if I understood correctly what you want to do
I don't want to rotate it just if there's a way to make the bar graph move up or show all country names
hearty briar
the rotation argument they said rotates the labels so they aren't 180 degrees vertically
not the whole chart
teal mortar
terse epoch
I don't want to rotate it just if there's a way to make the bar graph move up or...
hearty briar
if the labels are too long and rotation doesn't help
you might try switching to horizontal bar
which would provide more space for your labels
teal mortar
try plt.subplots_adjust(bottom=0.2) or bigger
rigid zodiac
hearty briar
I think what he's saying is that the way you do that is the same with npy as it ...
Thank you so much. But I have a doubt, since I never work with multiple files i dont know how to code it tbh
hearty briar
in my experience this isn't a code thing this is more a arranging data to work in your pipeline thing
terse epoch
Yeah one sec lemme try that
terse epoch
teal mortar
try plt.subplots_adjust(bottom=0.2) or bigger
Thanks that works
teal mortar
terse epoch
Thanks that works
you are welcome
 sick burrow
not sure if this is the place to ask.. but i've just installed modin using conda on a fresh ubuntu system and it gives me the ModuleNotFoundError: No module named 'modin' error when I try to import it..
there seems to be a total lack of information on how modin works with conda. the sum total is conda install -c conda-forge modin but that hasn't worked for me
 placid tendon
im usingthe code in https://pythonprogramming.net/reinforcement-learning-self-driving-autonomous-cars-carla-python/ to try out tensorflow on my amd gpu and i'm getting the error

Python Programming tutorials from beginner to advanced on a massive variety of topics. All video and text tutorials are free.
 charred umbra
I am trying to make an algorithm to track this time series data. What would be a good fit?
 main fox
charred umbra
I am trying to make an algorithm to track this time series data. What would be a...
main fox
charred umbra
I am trying to make an algorithm to track this time series data. What would be a...
Look into stats.model decomposition so that you may separate the trend and noise. After that, perhaps an ARIMA model.
 night gorge
what is the easiest method to produce a stacked bar graph. I don't want it to overlay, BUT on top of each other..
eg: first 20-19 then 30-39 on top of it
 main fox
night gorge
what is the easiest method to produce a stacked bar graph. I don't want it to ov...
main fox
night gorge
what is the easiest method to produce a stacked bar graph. I don't want it to ov...
https://www.python-graph-gallery.com/stacked-and-percent-stacked-barplot
Is this what you're looking to do?
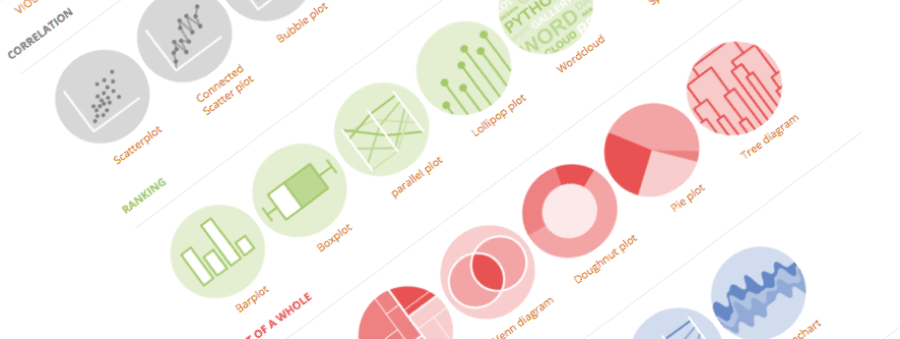
The Python Graph Gallery
How to plot a stacked and percent sctacked barplot using seaborn
night gorge
main fox
https://www.python-graph-gallery.com/stacked-and-percent-stacked-barplot
Is thi...
thanks
 somber prism
can someone help me compute backpropagation ```
def sigmoid(z, prime = False):
if prime:
return sigmoid(z) * (1 - sigmoid(z))
return 1 / (1 + np.exp(-z))
def relu(z):
return np.maximum(0, z)
class Network(BaseEstimator):
def init(learning_rate = 0.01, epoches = 30, activations = [], layers = []):
self.learning_rate = learning_rate
self.layers = layers
self.n_layers = len(layers) - 1
self.activations = activations
self.epoches = epoches
self.weights, self.biases = self.initialize_parameters()
self.cache = self.initialize_cache()
self.costs = []
def initialize_parameters(self):
    w = [
        np.random.randn(next_layer, current_layer) for current_layer, next_layer in zip(layers[:-1], layers[1:]) * self.learning_rate
    ]
    b = [
        np.zeros((next_layer, 1)) for next_layer in layers[1:]
    ]

    return w, b

def initialize_cache(self):
    c = {}
    for i in range(len(self.weights)):
        c[f'z{i + 1}']
        c[f'activation{i + 1}'] = None
        c[f'w{i + 1}']  = None
        c[f'b{i + 1}']  = None

        c[f'dw{i + 1}']  = None
        c[f'db{i + 1}']  = None

    return c

def activate(self, z, activation):
    if activation == 'sigmoid':
        return sigmoid(z)
    elif activation == 'relu':
        return relu(z)

def forward(self, x):
    a_prev = x
    for i, params in enumerate(zip(self.weights, self.biases)):
        w, b = params
        z = self.dot(w, a_prev) + b
        self.cache[f'z{i + 1}'] = z
        self.cache[f'activation{i + 1}'] = a_prev
        a_prev = activate(z, activation[i])

    self.cache[f'aL'] = a_prev
    return self.cache[f'aL']

def backward(self):
    pass
 pure gull
Hi, I am training a yolo model on pytorch and getting 15 GFLOPS of reported performance. Theoretical max for my GPU is reportedly over 2 TFLOPS - any idea what's with the massive performance difference? What's my bottleneck and how do I find out?
pure gull
pure gull
Hi, I am training a yolo model on pytorch and getting 15 GFLOPS of reported perf...
it's the smalles yolo model, does that influence reported performance?
 fleet prism
My algo works fine but these errors pop up in the terminal. Any idea how to resolve these? And will performance improve if resolved? In what way will it improve?
 pure gull
fleet prism
My algo works fine but these errors pop up in the terminal. Any idea how to reso...
pure gull
fleet prism
My algo works fine but these errors pop up in the terminal. Any idea how to reso...
probably your algo cannot access the GPU due to missing libraries. The performance difference depends - is your CPU fast/slow? Is your GPU fast/slow?
Do you have an nvidia GPU? Which you need for CUDA
(cufft = CUDA FFT, etc)
fleet prism
pure gull
probably your algo cannot access the GPU due to missing libraries. The performan...
I have the latest AMD. So only processing time gets affected and no change to overall output? I mean the image won't look different with these dependencies set right?
pure gull
CUDA only works for nvidia - AMD graphics cards are thus not usable with CUDA and there's nothing to do
pure gull
fleet prism
I have the latest AMD. So only processing time gets affected and no change to ov...
I don't know how to proceed but you can start your research here - you'll get some googleable terms at least https://medium.com/analytics-vidhya/install-tensorflow-2-for-amd-gpus-87e8d7aeb812

Medium
AMD has released ROCm, a Deep Learning driver to run Tensorflow-written scripts on AMD GPUs. However, many owners and I have encountered…
pure gull
fleet prism
I have the latest AMD. So only processing time gets affected and no change to ov...
if you're buying GPU specifically for deep learning, get an nvidia card - it's because of the software support I recommend this, hardware without software is irrelevant
fleet prism
pure gull
if you're buying GPU specifically for deep learning, get an nvidia card - it's b...
Tyvm
pure gull
fleet prism
Tyvm
Hope that link help you get your AMD card running though!
 tight glacier
Can someone help me interpret this confusion matrix

Q: What is the pair of classes that is most confusing for the 1 -nearest neighbour classifier trained in the previous sections?
My answer is the pair of classes that is most confusing is 4,9 we see here that these columns contain the most number of misclassifications
please can some let me know if my thinking is right?


 tidal bough
uncut barn
tidal bough
uncut barn
Are you using something like imshow?
uncut barn
Yh
tidal bough
tidal bough
Are you using something like `imshow`?
normNormalize, optional
The Normalize instance used to scale scalar data to the [0, 1] range before mapping to colors using cmap. By default, a linear scaling mapping the lowest value to 0 and the highest to 1 is used. This parameter is ignored for RGB(A) data.
so by default, it detects the lowest and highest values of the data, and rescales the brightness to [0,1] based on that.
uncut barn
tidal bough
> normNormalize, optional
>
> The Normalize instance used to scale scalar d...
is there code that turns the array into this plot (with those values)?
my array is a (256, 256)
tidal bough
What do you mean by an image?
like... do you to show it with matplotlib, or a file, or what?
uncut barn
yh Im wondering how they determined certain pixels 255 and the others 0
tidal bough
You're saying your data isn't this contrasting?
uncut barn
no what im trying to do is convert the values myself but i get this
 uncut barn
tidal bough
You're saying your data isn't this contrasting?
uncut barn
tidal bough
You're saying your data isn't this contrasting?
which isnt exactly the image that was shown before
hollow ember
Pastebin
Pastebin.com is the number one paste tool since 2002. Pastebin is a website where you can store text online for a set period of time.
tidal bough
Perhaps they used a threshold smaller than 1, then?
hollow ember
hollow ember
https://pastebin.com/jQWXU0iM
AttributeError: 'QuadMesh' object has no property 'char'
Im using Seaborn to plot heatmap of confusion matrix
uncut barn
tidal bough
Perhaps they used a threshold smaller than 1, then?
yh but i cant find the threshold of the cmap gray in matplotlib
tidal bough
You're applying the threshold yourself, here - arr[arr == 1] = 255, arr[arr < 1] = 0
uncut barn
yh but what does matplotlib do for cmap gray, thats what im trying to find out/need help with
hollow ember
hollow ember
`AttributeError: 'QuadMesh' object has no property 'char'`
@tidal bough help
tidal bough
uncut barn
yh but what does matplotlib do for cmap gray, thats what im trying to find out/n...
If you pass it an array of only zeros and 255s, it just, well, colors the zeros black and the whites white

 hollow ember
@serene scaffold AttributeError: 'QuadMesh' object has no property 'char'
Im using Seaborn to plot heatmap of confusion matrix
Pastebin
Pastebin.com is the number one paste tool since 2002. Pastebin is a website where you can store text online for a set period of time.
placid tendon
can anyone help me fix my carla simulator because my tutorial.py wont work due to world = client.get_world() not working
rotund trellis
How do i load the images contained in the subdirectories Normal and Pneumonia, into python to its respectful folder?

 hexed jasper
Hi i have question regarding to object detection, does image size matter in labeling image? like do i need to convert each image size to 300x300 for example before labeling it
 dusk iris
What would be the best way to approach finding the dominant color of an image which comes from the sliced video frame?
Been attempting to make this work for quite some time now but didnt really find a decent solution
I've found some modules (colorthief, dominantcolor, dominantcolorfast etc) which work well if i source video from disk, but when i attempt to push frames into them they just dont give good enough results
tight glacier
Is the unbiased estimate and the MLE of any statistic always the same?
 lone drum
Hello
I am working with 3 data frames
In which one data frame have date_time and strike_price column
I want to search that in other 2 data frames
I want to get rows from other 2 dataframes which matched with first dataframe
Ping me when replying
 normal violet
Has anyone here worked with ANN models? If so please ping me!
odd meteor
dusk iris
Been attempting to make this work for quite some time now but didnt really find ...
Idk if this would work since I know little about Computer Vision at the moment but give it a try.
import pandas as pd
import seaborn as sns
import matplotlib.pyplot as plt
import matplotlib.image as img
from scipy.cluster.vq import kmeans, vq
image = img.read('sea.jpg')
image.shape
r = []
g = []
b = []
for row in image:
    for pixel in row:
        temp_r, temp_g, temp_b = pixel
        r.append(temp_r)
        g.append(temp_g)
        b.append(temp_b)
pixel_df = pd.DataFrame({'red' : r, 'blue' : b, 'green' : g})
from sklearn.preprocessing import MinMaxScaler
scaler = MinMaxScaler()
pixel_df[['scaled_red', 'scaled_green', 'scaled_green']] = scaler.fit_transform(pixel_df[['red', 'green', 'blue']])

#Creating an elbow plot
distortions = []
num_clusters = range(1, 11)
for i in num_clusters:
    cluster_centers, distortion = kmeans(pixel_df[['scaled_red', 'scaled_blue', 'scaled_green']], i)
    distortions.append(distortion)
elbow_plot = pd.DataFrame({'num_clusters' : num_clusters, 'distortions' : distortions})
sns.lineplot(x='num_clusters', y='distortions', data=elbow_plot)
plt.xticks(num_clusters)
plt.show() #assume this revealed the elbow plot to be at 2

#Finding Dominant Colours

cluster_centers = kmeans(pixel_df[['scaled_red', 'scaled_blioe', 'scaled_green']], 2)
colors = []
r_std, b_std, g_std = pixel_df[['red', 'blue', 'green']].std()
for cluster_center in cluster_centers:
    scaled_r, scaled_g, scaled_b = cluster_center
    colors.append((scaled_r * r_std/255, scaled_b * b_std/255, scaled_g* g_std/255))

#Display Dominant Colour
print(colors)
plt.imshow([colors])
plt.show()
i think
df[df['strike_price'] == 3]
normal violet
#help-orange , please read
dusk iris
odd meteor
Idk if this would work since I know little about Computer Vision at the moment b...
Eh whats sns and plt in this case
odd meteor
dusk iris
Eh whats sns and plt in this case
They are alias of Seaborn and Matplotlib visualization libraries respectively. You'd have to 1st import them at the beginning of the code
import seaborn as sns import matplotlib.pyplot as plt
lone drum
rigid zodiac
i think
``` df[df['strike_price'] == 3]```
hii