#data-science-and-ml
1 messages · Page 329 of 1
 opaque stratus
 velvet thorn
huh
velvet thorn
huh
sir do u know anything about BERT or NLP techniques?
 sinful gale

This graph is of balance after paying loans. Many people do not have money left, as seen in the graph above. However, when I remove the skewness with log, I get this weird graph. Is this okay to go forward with?
 twin token
sinful gale
This graph is of balance after paying loans. Many people do not have money left,...
twin token
sinful gale
This graph is of balance after paying loans. Many people do not have money left,...
Only one way to know - try it our and inspect the results. However, I would consider handling the outliers around -5 in the log-transformed graph. Those don't look good. Furthermore, i would try more transformations than log and calculate the skewness for each transformed distribution and then go forward with the least skewed.
 short heart
Epoch 1/5
1/1 [==============================] - 1s 578ms/step - loss: 0.7666 - accuracy: 0.4000 - auc: 0.2619
Epoch 2/5
1/1 [==============================] - 0s 496ms/step - loss: 0.7063 - accuracy: 0.6000 - auc: 0.7381
Epoch 3/5
1/1 [==============================] - 0s 485ms/step - loss: 0.7040 - accuracy: 0.6000 - auc: 0.7143
Epoch 4/5
1/1 [==============================] - 1s 501ms/step - loss: 0.7146 - accuracy: 0.4000 - auc: 0.2857
Epoch 5/5
1/1 [==============================] - 0s 479ms/step - loss: 0.7113 - accuracy: 0.5000 - auc: 0.1190```
why is that accuracy can decrease with epochs and how can I control it grave breach
You can't but this isn't necessary a bad thing
It decreased because the moden encountered data that is a bit different from the normal
So it did a worse job
But, it also became more flexible
short heart
so its not a bad thing and i can just take best accuracy into account?
grave breach
Sorry, I said a wrong thing
You can imagine the optimizer "shifting" a point
And by thifting it can encounter peaks and holes
It probably shifted to a point that managed to make the accuracy decrease
But by continuing training (not too much, otherwise it will overfit) it will shift the point back to a point that will cause good accuracy
 arctic wedgeBOT
Hey @burnt pendant!
Uh-oh! It looks like your message got zapped by our spam filter. We currently don't allow .csv attachments, so here are some tips to help you travel safely:
• If you attempted to send a message longer than 2000 characters, try shortening your message to fit within the character limit or use a pasting service (see below)
• If you tried to show someone your code, you can use codeblocks
(run !code-blocks in #bot-commands for more information) or use a pasting service like:
 tender hearth
I'm trying to make a program that predicts successful shot attempts in a basketball game
Are these reasonable features?

If you can't see images:
Features
For each video frame, these will be the features that will be either inputted during training or outputted during inference:
- Location of basketball in frame (bounding box)
- Location of hoop in frame (bounding box)
- Whether the current frame is part of a shot attempt or not
- If current frame is a shot attempt, whether or not the shot attempt is successful
 timber skiff
A    B    C
0    0.0    0.0
1    1.0    1.0
2    2.0    NaN
3    3.0    NaN
4    NaN    NaN
@velvet thorn I was going for appending a column, like:
    A    B    C    D
    0    0.0    0.0    all are present
    1    1.0    1.0    all are present
    2    2.0    NaN    a and b are present
    3    3.0    NaN    a and b are present
    4    NaN    NaN    a is present
 serene scaffold
You want it to be a human-readable string?
timber skiff
yeah the output on jupyterlab is pretty to read but not to copy...
serene scaffold
You can start by making a new column that's just empty strings and then changing the content of the string using different boolean masks.
timber skiff
I never figured out how to make assignments from filters :(
serene scaffold
In [1]: df
Out[1]:
   A    B    C
0  0  0.0  0.0
1  1  1.0  1.0
2  2  2.0  NaN
3  3  3.0  NaN
4  4  NaN  NaN

In [2]: df['D'] = ''

In [3]: df
Out[3]:
   A    B    C D
0  0  0.0  0.0
1  1  1.0  1.0
2  2  2.0  NaN
3  3  3.0  NaN
4  4  NaN  NaN

In [4]: df.loc[~df.isna().any(axis=1), 'D'] = 'All are present'

In [5]: df
Out[5]:
   A    B    C                D
0  0  0.0  0.0  All are present
1  1  1.0  1.0  All are present
2  2  2.0  NaN
3  3  3.0  NaN
4  4  NaN  NaN
sweet! i was trying this, lol
df['D'] = ''
if df["A"]:
    df["D"] = "A is occupied"
That wouldn't work because you're using Python expressions that are independent of each other, so you can't access any Pandas magic
df["D"] = "A is occupied" would just get evaluated independently of whatever is in df["A"]
timber skiff
it works 😄
df.loc[~df["A"].isna(), 'D'] = "A"
df.loc[~df["B"].isna(), 'D'] = "A AND B"
df.loc[~df["C"].isna(), 'D'] = "ALL"
df
whenever new data comes in, there might be a problem -- right? (Not the data in the data, data from outside which is still skewed)
 somber prism
guys i finished andrew ng ml course in coursera and other beginner applied ml tutorials , and i also worked with some trending and popular datasets from kaggle like about 15 ig to practice. but rn idk what to do . can someone help me with this
idk what to learn rn and i dont think going to deep learning this soon is a good idea either
twin token
sinful gale
whenever new data comes in, there might be a problem -- right? (Not the data in ...
Yes and no. You have to handle it yes but it is not a problem per se - the same way sklearn handles it with their scalers. (A fit and a transformer method). But a quick question - what are you working on and what method? A lot of algorithms don't assume a normal/gaussian distribution of the independent variables.
 snow gorge
does anyone know any reasons a model might have a giant rmse with linreg (in the millions) but small rmse with decision tree regression (like 1-2)
twin token
somber prism
guys i finished andrew ng ml course in coursera and other beginner applied ml tu...
I would turn that question around. Don't look for exciting methods to apply on some arbitrary domain or problem. Choose an exciting problem or domain that you like and then see how you can solve it or make something nice (and then choose your method depending on that problem. Sort of like using a hammer for a nail and a screw driver for a screw). You learn much more this way. And no deep learning is not "too soon" or something. Just dig in.
somber prism
twin token
I would turn that question around. Don't look for exciting methods to apply on ...
but i want to do be thorough with basics of ml
twin token
snow gorge
does anyone know any reasons a model might have a giant rmse with linreg (in the...
Have you checked for linearity? Pretty strong assumption for linear regression, and not an assumption for tree based models
snow gorge
hmm
see the problem rn is the
X inputs are all
1024 length bit vectors
so im not sure how to plot it
or represent it
its a dataset of 40000 X inputs
twin token
somber prism
but i want to do be thorough with basics of ml
In many ways it is the same beast. But only you know what is right for you :-)
somber prism
i see
 late shell
Hello, I was reading about the problem of zero initialization in NN and I came across this paragraph on medium :
Zero initialization serves no purpose. The neural net does not perform symmetry-breaking.If we set all the weights to be zero, then all the the neurons of all the layers performs the same calculation, giving the same output and there by making the whole deep net useless. If the weights are zero, complexity of the whole deep net would be the same as that of a single neuron and the predictions would be nothing better than random.
Can someone help me understand it better. I don't get it how will all the neurons perform the same calculation because all the neurons would be initialized with different/random biases. So they'd be calculating different functions, right, since :
z = (W.T).X + b
And even if I'm wrong, and the neurons are really calculating the same function as the above paragraph says, what's wrong with giving the same output? Like what specifically would go wrong? would back propagation not work because of some gradient problem or like what?
snow gorge
twin token
Have you checked for linearity? Pretty strong assumption for linear regression,...
do you have any suggestions of how i could check the data to linearity?
and any other models that dont assume linearity?
twin token
snow gorge
1024 length bit vectors
I am not sure what you mean. For each variable you have to find out if they are of type 1) binary, 2) categorical, 3) continuous. If they are 1 or 2 it doesn't matter. For continuous variables including the dependent variable (your y variable ) you can check linearity
snow gorge
so think of the data as
sinful gale
twin token
Yes and no. You have to handle it yes but it is not a problem per se - the same ...
So basically its a dataset about Loans and who failed to pay it. It has a bunch of features (~10) and all of them are int or float. Many are skewed (some have skew as much as 5 or 11). I want to use classification algorithms like XG or DTR etc to classify payed or not. It is my first project without guidance and hence the confusion. You can find the dataset here: https://www.kaggle.com/itssuru/loan-data
Hope this clears my intention.

classify and predict whether or not the borrower paid back their loan in full.
snow gorge
[,0,0,0,0,0,00,0,0,0,,01,1,1,1,1,1,,0,0,1,1,1,]
twin token
snow gorge
and any other models that dont assume linearity?
Many methods do not assume linearity
twin token
So you got one variable of length 1024 (that is 1024 rows)?
snow gorge
hmm
how should i say this
i have 40000 rows
of 1024 columns of binary values

for example
but i dont see a very mathematical way of representing this to see linearity
twin token
snow gorge
of 1024 columns of binary values
Then they are binary and linearity is not an issue. How about your Y? That one is continuous. Have you checked that for linearity?
snow gorge
how do i check a y for linearity?
twin token
snow gorge
but i dont see a very mathematical way of representing this to see linearity
Or the distribution. Could be both
Lin reg assume normal distribution. Tree based models don't
snow gorge
i actually have the same issue for 2 different datasets im running models on
the both have the same 1024 binary x values
but looking at the y's for both
i dont see a way to represent it in a way i can look for a pattern
maybe with a 1024 dimension graph
but is that even feasible
twin token
snow gorge
how do i check a y for linearity?
If all X are binary it is irrelevant. But you should check the distribution of Y if using lin reg
snow gorge
i see
so i should just
plot all the y
and see if there's a pattern?
so im assuming with y values like this

what should i plot as the x?
twin token
sinful gale
So basically its a dataset about Loans and who failed to pay it. It has a bunch ...
Many algorithms don't assume normal distribution - xgboost being one of them. :-)
snow gorge
am i just looking for clusters?
sinful gale
@twin token ping for help, hope you get the time to see my message
twin token
snow gorge
what should i plot as the x?
Nothing. You plot it as a histogram
snow gorge
alright
sinful gale
twin token
Many algorithms don't assume normal distribution - xgboost being one of them. :-...
But shouldn't the data be preped for all the algos?
twin token
sinful gale
<@274248376063885314> ping for help, hope you get the time to see my message
I just answered you 😀
sinful gale
twin token
I just answered you 😀
Yea, sorry
twin token
It depends on the algorithm you use. They all have different assumptions so be aware of that every time you apply a new algorithm. Xgboost and tree bases model are very generous in that sense. They don't have many assumptions. Still- be aware of outliers and maybe scaling of thr variables. Even though it is not an assumption of many algorithms it might help anyway
snow gorge

not normal im guessing
looks to have 2 modes
so i guess i cant linreg it due to the distribution?
twin token
snow gorge
so i guess i cant linreg it due to the distribution?
You can, you just have to transform it. I would calculate the skewness for the original distribution and the transformed distribution and try the one with the best skewness score
sinful gale
twin token
It depends on the algorithm you use. They all have different assumptions so be a...
The dataset box plot of many features have A LOTof outliers so maybe I should use ensemble approaches?
 lapis sequoia
How to bypass cloudflare level 2 captcha
twin token
snow gorge
im really new to these models tbh
Not for the process entirely, but for calculating skewness and tranform data yes. Google it, it should be fairly straight forward. But if Lin reg performs poor, use another method .
snow gorge
i see

there's actually a ton of tasks
and they all have different distributions 
probably should just
move on
from linreg huh

@twin token would you consider this normal?
it seems like it works with the model
but looking at it im surprised it considers itself normal
oh wait if i use less bins it seems very normal
well thank you ^^
twin token
snow gorge
<@!274248376063885314> would you consider this normal?
Nope- It seems left skewed. However if you absolutely find Lin reg necessary it can be automated (finding a suitable transformation)
 twin token
snow gorge
oh wait if i use less bins it seems very normal
twin token
snow gorge
oh wait if i use less bins it seems very normal
No problem :-)
snow gorge
the linreg rmse seems quite
i guess
reasonable
even without transofrmation
at least
when compared to the
9000000 rmse
that i was seeing with the other dataset
snow gorge
snow gorge
that looked like this
do you think im doing something wrong?
after all an rmse of 9000000+ is
high at least id say
twin token
snow gorge
do you think im doing something wrong?
No :-) data in the real world is never like text book examples. It might look even worse when transforming it and sometimes one must accept a bit of skewness. If the output looks fine it is most important.
twin token
Well the high rmse is high. Way too high
snow gorge
such small input values
snow gorge
twin token
Well the high rmse is high. Way too high
it's high, but that doesnt mean i coded it incorrectly right?
it could just be the model doesnt fit properly?
to such a degree?
twin token
It could be both actually. Might be some bug in the code might be the model itself
 vivid mantle
Hi buddies! Sup!! I want to start with ML cuz nowadays everyone's doin all sorts of crazy stuff with neural networks and that looks so fascinating , but I'm not quite sure whether neural networks would turn out to be a good start or do I need to learn any other form of ML before getting into neural networks. Some advice would be highly useful .🙂
twin token
snow gorge
could you take a look at a stackoverflow i posted?
Link?
 unborn glacier
vivid mantle
Hi buddies! Sup!! I want to start with ML cuz nowadays everyone's doin all sorts...
unborn glacier
vivid mantle
Hi buddies! Sup!! I want to start with ML cuz nowadays everyone's doin all sorts...
There are a lot of ways to start, and the order isn't really that important, assuming you at least have a basic knowledge of python. You can take existing examples and try them out and use them on new datasets, you can use pre-trained models or train them yourself, you can follow tutorials for how to implement models yourself with keras or pytorch, you can also try building a neural network from scratch with numpy.
I would say the skills to learn to really understand and design your own neural networks would by linear algebra, basic derivatives & mathematical functions, the numpy library, and either the tensorflow/keras libraries or the pytorch library. You'll also want a visualization tool you can use like matplotlib, and a way to gather and prepare data like pandas (if you work with tables & excel or csv data).
I learned neural networks before more general ML and stats techniques, and probably the only disadvantage was that often the simpler methods (not neural networks) are much more effective for small problems than advanced ML so there was a bit of, if all you have is a hammer everything looks like a nail. But the plus side was that neural networks are super cool and it made the simpler stuff a bit easier in comparison.
There are some great books (I recommend this: https://www.amazon.com/Hands-Machine-Learning-Scikit-Learn-TensorFlow/dp/1492032646) and some excellent online courses both free and paid, I really enjoyed this for NLP: https://www.udemy.com/course/deep-learning-advanced-nlp/ and the author has a ton of courses. They are pretty $$$, but I was able to get them for free through work (sometimes schools offer things like that as well). That being said, there a ton of free resources out there as well, and you definitely don't need to spend any money.
 slow vigil
Hey does anyone know if I should deactivate conda (base) before activating the conda environment I want to install packages to? I'm reading about how conda environments will 'stack' and apparently that's bad
unborn glacier
slow vigil
Hey does anyone know if I should deactivate conda (base) before activating the c...
"By default, conda activate will deactivate the current environment before activating the new environment and reactivate it when deactivating the new environment. Sometimes you may want to leave the current environment PATH entries in place so that you can continue to easily access command-line programs from the first environment. This is most commonly encountered when common command-line utilities are installed in the base environment. To retain the current environment in the PATH, you can activate the new environment using:"
You should be good
slow vigil
Damn that was quick. Thank you
 charred umbra
snow gorge
charred umbra
snow gorge
try taking a bootstrap of your datapoints and see the distribution of that

 pine wolf
looks like you're using a scipy sparse matrix instead of a np.ndarray
 raw temple
Hi everyone, I need some help with how I'm constructing my sentiment analysis. I want to analyse tweets for the past year and I've collected roughly 5k tweets per month in 2020 which totals to roughly 60k. Is it better to combine the whole dataset which is roughly around 60k tweets and run a bert sentiment analysis on it or to run the model on 5k tweets of each month?
serene scaffold
raw temple
Hi everyone, I need some help with how I'm constructing my sentiment analysis. I...
you would want to have separate training and testing data but I'm not sure what's so special about each month.
raw temple
I want to compare if there's an increase in negative tweets regarding covid per month
serene scaffold
considering that tweets come with a sentiment analysis score, what is the point of bert in all this?
wouldn't you have wanted to make sure that you were taking representative samples of tweets and then see what happens to the average scores month per month?
raw temple
Well I want to compare different types of sentiment analysers and then do the whole average scores thing
serene scaffold
ahh
sounds interesting. however I can't think of any reason to treat tweets from different months differently during training or evaluation, just for analysis at the end.
raw temple
Okay i see, thanks for your input, I wasn't sure if there'd be a difference
 light imp
Hello, I have a question of SQLite, How do I create a field that is the results of 2 other fields. I need to create a new column that is [field2]/[field3] and the name is "average"
serene scaffold
light imp
Hello, I have a question of SQLite, How do I create a field that is the results ...
you might try asking in #databases if you don't get an answer here.
light imp
thanks
tender hearth
tender hearth
If you can't see images:
### Features
For each video frame, these will be the f...
buump
 slate hollow
so i'm training a model with multiple inputs here: https://paste.pythondiscord.com/bowijocexi.makefile
the thing is, when i train it with this line of code: py model.fit((user_inp_data, news_inp_data), rating_df["rating"].to_numpy()), it gives me this error: py ValueError: Data cardinality is ambiguous: x sizes: 2 y sizes: 5033875 Make sure all arrays contain the same number of samples.any help?
all the sources i checked trained the models with multiple inputs like so, so i don't know what's wrong with my particular code
wait nvm it's giving a different error now
ValueError: Failed to find data adapter that can handle input: (<class 'tuple'> containing values of types {'(<class \'list\'> containing values of types {"<class \'int\'>"})'}), <class 'numpy.ndarray'>
i mean
ok for some reason
converting the lists to numpy arrays worked
could someone explain why?
vivid mantle
unborn glacier
There are a lot of ways to start, and the order isn't really that important, ass...
Wow! Seems like I've to deal through whole lotta Math. Anyways, thanks for help
 icy sable
Hey, Im new to Jupyter Notebook and I'm using it in Visual Studio Code (if that changes anything). When trying to import some modules from a file on my desktop, it throws a "No Module named ..." error, and I'm not sure why. Here is my code: ```py
import os
import sys
import sys
sys.path.append('my/path/to/module/folder')
from tensorflow.keras.models import load_model
from imutils.contours import sort_contours
from matplotlib import pyplot as plt
The Error:

 ripe forge
You need to install it
icy sable
i have tensorflow 2.2 installed, and it throws this error for the other modules like imutils too
 ripe forge
This means you're probably not running code in the environment where your packages got installed.
So you need to install them for the environment you're working on
icy sable
how do i do that
ripe forge
Well first things first, are you familiar with virtual environments? Vscode can let you choose your environments that are running the code
So if you know which environment you installed packages in, activate that
icy sable
like powershell and cmd?
I'm not sure if the modules are installed on a venv, i just have them on my desktop
ripe forge
Desktop? Wait, how did you install your packages
icy sable
someone online made them in a zip file, i extracted the zip file to my desktop and its worked before
tensorflow i pip installed
on cmd i think
but "imutils" comes from my desktop
and both of them throw the same error
ripe forge
So yeah, that means your pip install installs somewhere else most likely. What os are you on.
icy sable
Windows
ripe forge
OK. Hmm. Windows doesn't have multiple python installs though.
Okay, forget it. From your jupyter notebook view write !pip install tensorflow
In a cell and run
icy sable
alright i did that

it says its already installed, but still cant find the tensorflow module
ripe forge
Can you show the screenshot with the message from pip install
 icy sable
alright dont worry about it bro thanks for trying anyways
 robust lodge
doess data science intertwine with business and so how
 edgy kelp
Is there have any discord group can discuss how CV model working? like discussion room
late shell
Hello, I was watching one of Andrew Ng's videos on neural network basics and he was explaining what different units in different layers do when, for example, given an image as input data. He explains that for the NN in the above picture, the 1st layer might calculate edges, the 2nd layer might calculate parts of faces such as eyes, nose etc. and then the next layer sums it up into a whole face/picture and the final neuron outputs whether the person in the image is male/female. The general idea he proposes is that the complexity of the function increases as the data propagates through the layer. But he doesn't provide/cite any evidence or proofs or even intuition/reasoning as to why it is so. I just want to know atleast a little bit about how did he come to this conclusion? On what basis is he saying the first layer learns the edges, then 2rd layer constitutes those edges and learns parts of faces, and the 3rd layer constitutes those parts to learn a whole face.???
 tender hearth
late shell
Hello, I was watching one of Andrew Ng's videos on neural network basics and he ...
tender hearth
late shell
Hello, I was watching one of Andrew Ng's videos on neural network basics and he ...
He is not claiming that the net is doing these things. He is simply proposing a possible method that the net may be using in order to analyze images. He is building off of the useful fact that each layer simply performs a transformation on the data that is inputted into it. With this, it makes sense that if the first layer is learning edges, that the second layer may be learning shapes from those edges, and the third layer may he learning faces from those shapes
But, for all we know, it's using a different method entirely
late shell
oh, does that mean that we can never be sure as to what the functions of neurons in each layer represents? It's just a black box?
unborn glacier
It's true that neural networks often function like a black box, but you can visualize the activation of each layer, and see that certain layers do in fact deal with things like edge detection: https://www.mathworks.com/help/deeplearning/ug/visualize-activations-of-a-convolutional-neural-network.html
This example shows how to feed an image to a convolutional neural network and display the activations of different layers of the network.
ripe forge
late shell
oh, does that mean that we can never be sure as to what the functions of neurons...
you can set up the black box first, and then peep into it to see what's actually going on. intuitively, you can think of layers as like building blocks. naturally things on the deeper layers have been constructed by "combining" simpler building blocks, and are thus going to tend towards higher complexity.
So there is definitely a case for intuition with why deeper layers would learn more complex patterns: they're simply combining more things together in more complex ways
as for this statement "the 1st layer might calculate edges, the 2nd layer might calculate parts of faces such as eyes, nose etc. and then the next layer sums it up into a whole face/picture and the final neuron outputs whether the person in the image is male/female" there's emperical evidence for it, if you don't wish to agree to the intuitive explanation.
sites like https://poloclub.github.io/cnn-explainer/ may also interest you
grave breach
unborn glacier
It's true that neural networks often function like a black box, but you can visu...
MATLAB is evil
 waxen veldt
Question about EDA
This is the heart disease data set.
- 0 = no disease
- 1 = disease
Observations
- people aged around 60 years old appear most in this dataset
- people aged around 60 years old have the highest chance of heart disease (orange violin plot since that seems to be the mode)
Question
I see that the sample size for people aged 60 is also the greatest. So given that sample size is high, isn't it obvious that people around that age will be the mode in the violinplots?
Sorry if my question is confusing. I'm basically trying to understand how to make the correct conclusions from the dataset while considering margin of errors from sample size.

If my wording is wrong anywhere, please correct me haha.
 inner elk
hey, I want do a project regarding machine learning, the project will be done over a year and should take a minimum of 250 hours to complete, the project will also be done by two people. does anyone have an idea for an interesting project?
late shell
ripe forge
sites like <https://poloclub.github.io/cnn-explainer/> may also interest you
Wow, this is amazing, although I don't understand it yet, as I'm still on the basics of NN. . I'll bookmark this for future use. Thanks.
late shell
ripe forge
you can set up the black box first, and then peep into it to see what's actually...
can you explain wdym by "peep into it". How would I peep into a NN when it's training?
ripe forge
late shell
can you explain wdym by "peep into it". How would I peep into a NN when it's tra...
not when it's training, or well, that's not as useful. but sites like that url are essentially "peeping" into what the model sees
late shell
ripe forge
not when it's training, or well, that's not as useful. but sites like that url a...
oh yeah.
ripe forge
essentially, once you have the model trained, it's learnt some weights. you can turn those weights into human friendly representations. There are also other techniques that let you see what a model is thinking: they fall under machine learning interpretability .
late shell
Cool, thanks a lot @ripe forge , @tender hearth & @unborn glacier
unborn glacier
inner elk
hey, I want do a project regarding machine learning, the project will be done ov...
Object detection for the blind. It's been done before, but as image detection gets better, so too can the implementation. If machine learning only needs to be part of it, you could spend a lot of time on the hardware and feedback implementation parts
inner elk
unborn glacier
Object detection for the blind. It's been done before, but as image detection ge...
thank you for the idea, in the end I decided to do a program that completes the code for the user but I might also do this one in the future because it covers a lot of different topics
grave breach
inner elk
hey, I want do a project regarding machine learning, the project will be done ov...
open source webcam-based eye tracking
to allow paralized people to interact with the world even without having to buy a device
and anyone in the community to contribute and add their software the support for paralized people
(currently for good eye tracking, you have to buy a device called tobii)
 lapis anvil
grave breach
(currently for good eye tracking, you have to buy a device called tobii)
lapis anvil
grave breach
(currently for good eye tracking, you have to buy a device called tobii)
didnt facebook hold a AI/DS competition just for good eye tracking on a device?
grave breach
don't know
but, it could be great if something like also existed on webcam
but opensource
charred umbra
inner elk
hey, I want do a project regarding machine learning, the project will be done ov...
use machine-learning + deep-learning to better track/predict bee migrations
 solemn nest

Super interesting
I plotted 1000 digits of n-1/n, and then from 0-9 to black-white
This is surrounding 1e+20 I believe
 sudden lake
Hi, it might be a stupid question but why do all plots vary from each other? Does pandas.qcut function divide data in other way than np.linspace and pandas.cut does?

Also sorry for the picture being so stretched but i thought it would be a better idea to put all the code on one pic
slow vigil
Does anyone know the best/fastest way to convert json data to a parquet file? I'm trying with pyarrow now and I'm getting an error of 'dict' object has no attribute'schema', so before I dive into solving this I want to make sure I'm using the fastest method to begin with
 fiery minnow
<@&831776746206265384>  He sent those in all channels
 dim olive
We are getting them, ty
 random solar
when training a model with holidays on fbprophet what is the point of the (observed) holiday?
 velvet thorn
random solar
when training a model with holidays on fbprophet what is the point of the (obser...
velvet thorn
random solar
when training a model with holidays on fbprophet what is the point of the (obser...
are you asking what “observed” means in this context
or why distinguish between observed or nominal?
random solar
velvet thorn
or why distinguish between observed or nominal?
could u answer both?
velvet thorn
random solar
could u answer both?
okay like in my country
if you have a public holiday on a Sunday
the following Monday will be a day off from work
so Sunday is the nominal holiday
and Monday is the observed holiday
as for why
well, you want to distinguish the two when training your model, right
they mean different things
random solar
ohhh ic
random solar
velvet thorn
they mean different things
thankss
 drifting rivet
help
 royal crest
same
drifting rivet
how do you input image to be classified
royal crest
depends on what kind of data you're working with and what your aim is
drifting rivet
how do you know if it is supervised or unsupervised
royal crest
is your data labelled
drifting rivet
it seems like its just image
royal crest
do you know what labelled data means in the context of ML?
drifting rivet
i think im not
royal crest
i don't know where to start then
do you know the fundamentals of ML/DL?
and the general procedure that's involved?
royal crest
Would you like me to link you some more Youtube videos?
drifting rivet

In this video we walk through the process of training a convolutional neural net to classify images of rock, paper, & scissors. We do this using the Tensorflow & Keras libraries. This is a follow-up to the first video I posted on neural networks.
Introduction to Neural Nets: https://youtu.be/aBIGJeHRZLQ
Link to my code (github): https://github...
my problem is he got his data from tensorflow dataset builder
and mine is from my computer folder
royal crest
then you just set the path to the folder that contains relevant data
royal crest
You can upload local files to Google Colab
It shows in one of Google Colab's example notebooks
called External data: Local files, drive, sheets and cloud storage
 chilly geyser
royal crest
do you know what labelled data means in the context of ML?
chilly geyser
royal crest
do you know what labelled data means in the context of ML?
Labelled just means labelled.
Usually means someone took their time to look at the data and add some metadata
For example is this image an image of water?
An image of the sea? What time is it taken in?

If you ask a computer and it automatically knows, then congrats you're at an era of human civilization where AI has already done a massive amounts of learning
But back in the 'good old days' of, just about now, you need someone to manually add the tags 'is a picture of water' of some kind
Then with this good data you feed into your machine systems
What happens is that if you feed trash data you just get trash
Anyway a lot of data is already labelled because Google went out and did crowdsourcing for it, but I'm not sure what the data licensing is like and/or if people like you and me can get this augmented data (on top of the original data which probably has unknown licensing)
Anyway my image above is https://www.flickr.com/photos/image-catalog/21923613804 declared to be PD - do whatever you want with it
drifting rivet
maybe im just gonna learn some stuff first
 azure cairn
i am doing my first image classification, labelling image at the moment. i have to watch out repetitive strain injury, mouse click getting hard.
lapis sequoia
can someone pl explain longest path in dag
 limpid snow
Can I ask some question?
royal crest
don't ask to ask just ask
limpid snow
Can we train unlabeled data by using GAN?
The generator is neural network to classified data, and discriminator using for check that labeled is correct or not
 hard hound
Hey does anyone know how to form a team on kaggle?
sinful gale
How do I interpret this heatmap? I am new to understanding multicollinearity

 eager imp
i need some pointers for keras. i'm trying to generate training/test data with augmentation, but i can't make it work due to input shape issues
are there examples for model.fit with plain python generators or Sequence?
 mortal dove
I'm applying for an honours degree next year. I'll be applying for both Data Science and Mathematical Statistics(finishing my bachelors in Data Science this year) if I get accepted for both, I'm unsure on which would be the better one to do for the future.
Covered in the Data Science Honours is:
Computer Information Technology Project
Introduction to Research
Business Intelligence
Data Warehousing
one of: Big Data OR Statistical Programming
Possibility to take another computer science focused module from an extensive list.
Covered in Mathematical Statistics Honours is:
Statistical Modelling and Literature Study
Multivariate Analysis
Bayes Analysis
Modelling Extremal Events
Stochastic Processes
Multivariate Methods
one of Big Data or Spatial Statistics
Is either of these in general a lot better than the other, and what would impact in future work/jobs be in taking one vs the other?
eager imp
maybe that's more suited for #career-advice ..?
mortal dove
Might be, yea. Thanks
 atomic tide
chilly geyser
Labelled just means labelled.
Usually means someone took their time to look at ...
atomic tide
chilly geyser
Labelled just means labelled.
Usually means someone took their time to look at ...
You know at some ML companies, they will actually have days where all the staff just label data instead of what they would normally be doing. If you click the 'use my data to improve the product' on e.g. your email account, actual employees of the company may be reading your emails for labelling purposes.
chilly geyser
Well better data means better predictability
 slim moss
The plot_examples module is not working in utils library,
I want to print multiple augmented images in a notebook, is there some other way?
 lapis sequoia
so guys, ive saw a video where a guy presents an arch but it doesnt say a model
basically is for image classification. Currently, u solve this by showing the neural net many imgs of the same object in different positions
but this "new" net can guess the tridimensionality of the object itself
just as like humans do
we do need 30 images of a dog to learn it is a dog
do u know whats the model name?
capsnet is the arch
 inland zephyr
hello does anyone use keras_tuner in here? I wonder if we can plot the hyperband tuning
 paper ember
chilly geyser
Well better data means better predictability
paper ember
chilly geyser
Well better data means better predictability
I love this quote - not MORE data, but better data
 grave frost
lapis sequoia
capsnet is the arch
grave frost
lapis sequoia
capsnet is the arch
aren't capsnets dead?
 desert bear
Hey, I'm doing a project that predicts new values. I'm using LSTM architecture.
Aren't the loss values too little, It seems like they should be greater.
Orange values are the predicted ones

Here are the loss values that I'm getting:

 naive skiff
So i make a ML system for rockpaperscissors
Can anyone help me why this is not working?
This is the callback function to stop the training at 97% accuracy to prevent overfitting
class MyCallback(tf.keras.callbacks.Callback):
  def on_epoch_end(self, epoch, logs={}):
    if(logs.get('accuracy') > 0.97):
      print('\nAccuracy exceed 97% limit, training terminated ⏹️ ')
      self.model.stop_training = True

callbacks = MyCallback()
and this is
history = model.fit(
    train_generator,
    steps_per_epoch=41,
    epochs=20,
    validation_data=validation_generator,
    validation_steps=27,
    verbose=2,
     callbacks=[callbacks]
)
Everytime i run this it gives me an error like
TypeError: set_model() missing 1 required positional argument: 'model'
its probably overfitting
naive skiff
naive skiff
So i make a ML system for rockpaperscissors
Can anyone help me why this is not w...
This callbacks=[MyCallback] sent an error TypeError: set_model() missing 1 required positional argument: 'model'
grave frost
naive skiff
This ```callbacks=[MyCallback]``` sent an error ```TypeError: set_model() missin...
post the full traceback
naive skiff
I think i fix it, but not sure, and it's running. Thankyou for your response
late shell
Hello, I want to code up a simple NN from scratch but I'm running into dimension problems with gradient descent. The problem couldn't be easily explained here so I created a notion page for it : https://powerful-porcupine-ee6.notion.site/Back-Prop-Doubt-d7fb7ca1e7784afb9a426143b14cc605
please let me know where I'm going wrong. I've been struggling with this since yesterday 😦

Notion
A new tool that blends your everyday work apps into one. It's the all-in-one workspace for you and your team
desert bear
grave frost
its probably overfitting
What should I do then?
grave frost
desert bear
What should I do then?
test on the validation set - if its not there then split it
naive skiff
grave frost
post the full traceback
Well i guess it didn't work
Epoch 1/20
---------------------------------------------------------------------------
InvalidArgumentError                      Traceback (most recent call last)
<ipython-input-13-ae34e4ffbb88> in <module>()
      6     validation_steps=27,
      7     verbose=2,
----> 8      callbacks=[callbacks]
      9 )

6 frames
/usr/local/lib/python3.7/dist-packages/tensorflow/python/keras/engine/training.py in fit(self, x, y, batch_size, epochs, verbose, callbacks, validation_split, validation_data, shuffle, class_weight, sample_weight, initial_epoch, steps_per_epoch, validation_steps, validation_batch_size, validation_freq, max_queue_size, workers, use_multiprocessing)
   1181                 _r=1):
   1182               callbacks.on_train_batch_begin(step)
-> 1183               tmp_logs = self.train_function(iterator)
   1184               if data_handler.should_sync:
   1185                 context.async_wait()

/usr/local/lib/python3.7/dist-packages/tensorflow/python/eager/def_function.py in __call__(self, *args, **kwds)
    887
    888       with OptionalXlaContext(self._jit_compile):
--> 889         result = self._call(*args, **kwds)
    890
    891       new_tracing_count = self.experimental_get_tracing_count()

/usr/local/lib/python3.7/dist-packages/tensorflow/python/eager/def_function.py in _call(self, *args, **kwds)
    948         # Lifting succeeded, so variables are initialized and we can run the
    949         # stateless function.
--> 950         return self._stateless_fn(*args, **kwds)
    951     else:
    952       _, _, _, filtered_flat_args = \

/usr/local/lib/python3.7/dist-packages/tensorflow/python/eager/function.py in __call__(self, *args, **kwargs)
   3022        filtered_flat_args) = self._maybe_define_function(args, kwargs)
   3023     return graph_function._call_flat(
-> 3024         filtered_flat_args, captured_inputs=graph_function.captured_inputs)  # pylint: disable=protected-access
   3025
   3026   @property

/usr/local/lib/python3.7/dist-packages/tensorflow/python/eager/function.py in _call_flat(self, args, captured_inputs, cancellation_manager)
   1959       # No tape is watching; skip to running the function.
   1960       return self._build_call_outputs(self._inference_function.call(
-> 1961           ctx, args, cancellation_manager=cancellation_manager))
   1962     forward_backward = self._select_forward_and_backward_functions(
   1963         args,

/usr/local/lib/python3.7/dist-packages/tensorflow/python/eager/function.py in call(self, ctx, args, cancellation_manager)
    594               inputs=args,
    595               attrs=attrs,
--> 596               ctx=ctx)
    597         else:
    598           outputs = execute.execute_with_cancellation(

/usr/local/lib/python3.7/dist-packages/tensorflow/python/eager/execute.py in quick_execute(op_name, num_outputs, inputs, attrs, ctx, name)
     58     ctx.ensure_initialized()
     59     tensors = pywrap_tfe.TFE_Py_Execute(ctx._handle, device_name, op_name,
---> 60                                         inputs, attrs, num_outputs)
     61   except core._NotOkStatusException as e:
     62     if name is not None:

InvalidArgumentError:  input depth must be evenly divisible by filter depth: 3 vs 2
     [[node sequential/conv2d/Relu (defined at <ipython-input-13-ae34e4ffbb88>:8) ]] [Op:__inference_train_function_880]

Function call stack:
train_function
this is the full traceback u've asked
inland zephyr
i want to ask about parameter tuning. Let said using Hyperband or BOHB, if we repeat the process with random set of data, is the parameter result will be same or it will be randomly shown depend on the dataset? I affraid when using keras-tuner and using Hyperband it gives me different result with different set of data (with previous weight are removed) when calling get_best_hyperparameters()[0] and with get_best_hyperparameters(trial=1)[0] since i only want to take the parameters instead the weighted model.
consider if someone in here experienced using keras_tuner
 magic dune
@arctic wedge code
arctic wedgeBOT
Here's how to format Python code on Discord:
```py
print('Hello world!')
```
These are backticks, not quotes. Check this out if you can't find the backtick key.
slow vigil
Does anyone know how I correct an AttributeError: 'dict' object has no attribute 'schema' for this code:
import pyspark, json, pandas
import pyarrow.parquet as pq

with open('15min_1day_sample.txt')as f:
    table = json.load(f)
print(json.dumps(table, indent=2))

pq.write_table(table, 'result.parquet')
Loss is good for telling you if the model is getting better as training proceeds. The actual value of the loss is pretty meaningless in my understanding. If that's all your data you don't have nearly enough for the model to make reasonable predictions. You'd want thousands to hundreds of thousands of data points, and you should also have reason to believe that there is a pattern to the underlying data. For example an lstm on stock price data will be next to useless because stocks are by nature nearly unpredictable from past data alone.
slow vigil
For the code snippet above I'm just trying to read in JSON data from a .txt file and output a parquet file
desert bear
unborn glacier
Loss is good for telling you if the model is getting better as training proceeds...
yea, I'm doing some stocks predictions 😄
I'm having tons of data from 9 years
I know that stock prediction sucks with lstm, and generally it is not easy to write a good enough algorithm for that. But some of them came good enough on validation set
the part that I try to predict the future sucks and I'm figuring out why
magic dune
I am trying to optimize my k means cluster code to wrk with more than two clusters can someone help me?
 slim zealot
Hello, I was doing a programming scientific project, I'm looking for someone
desert bear
unborn glacier
Loss is good for telling you if the model is getting better as training proceeds...
and everytime I run this prediction script I get little bit different results
magic dune
my code:
https://pastebin.com/B84qGuME
How can I amke my code wrk with more than one centriod it is for k means cluster
Pastebin
Pastebin.com is the number one paste tool since 2002. Pastebin is a website where you can store text online for a set period of time.
 unique furnace
i'm trying to train GPT-2 on custom text using this guide: https://medium.com/ai-innovation/beginners-guide-to-retrain-gpt-2-117m-to-generate-custom-text-content-8bb5363d8b7f
i've installed CUDA 11.4 and cuDNN 8.2 and tensorflow seems to be picking up those libraries correctly as you can see in my log below. however, i keep getting OOM errors despite my graphics card having 6 GB of RAM. what should I do?
https://tpaste.us/bVyX
naive skiff
Can anyone help me? how to fix this error?
history = model.fit(
    train_generator,
    steps_per_epoch=41,
    epochs=20,
    validation_data=validation_generator,
    validation_steps=27,
    verbose=2,
     callbacks=[callbacks]
)
Epoch 1/20
---------------------------------------------------------------------------
InvalidArgumentError                      Traceback (most recent call last)
<ipython-input-15-ae34e4ffbb88> in <module>()
      6     validation_steps=27,
      7     verbose=2,
----> 8      callbacks=[callbacks]
      9 )

6 frames
/usr/local/lib/python3.7/dist-packages/tensorflow/python/eager/execute.py in quick_execute(op_name, num_outputs, inputs, attrs, ctx, name)
     58     ctx.ensure_initialized()
     59     tensors = pywrap_tfe.TFE_Py_Execute(ctx._handle, device_name, op_name,
---> 60                                         inputs, attrs, num_outputs)
     61   except core._NotOkStatusException as e:
     62     if name is not None:

InvalidArgumentError:  input depth must be evenly divisible by filter depth: 3 vs 4
     [[node sequential_1/conv2d_3/Relu (defined at <ipython-input-15-ae34e4ffbb88>:8) ]] [Op:__inference_train_function_1809]

Function call stack:
train_function
guys i made one model that detect whether the specified url is a phishing or a legitimate site , when i tried that in jupyter notebook , i can get the result pretty quick but when i pass the url from frontend to backend then get the output from the trained model its taking some time
serene scaffold
@somber prism what do you mean by frontend or backend?
somber prism
from html input to python backend
somber prism
vps ?
ok nvm that when i get the input from the user ( html - frontend ) and send it to the backend via api then use that user specified url as input to the pre trained model, i am getting the output but its taking too long to show the result
i checked the logs and theres nothing wrong in the api , its only the model taking some time to get the output which didnt happen when i did it in jupyter notebook
grave breach
@somber prism ok, but where's your backend?
have you got a vps?
or are you running it in locale
grave breach
heroku doen't have GPUs
so all the linear algebra is happening in the CPU
so it's slower
you can buy instances from google cloud, azure, linode, wolfram, ecc. if you want a cloud for machine learning models
they're not too expensive, I suggest this to you
@somber prism by the way, I think your software isn't working correctly
somber prism
ohh
somber prism
grave breach
<@!393393798350372876> by the way, I think your software isn't working correctly
wym
grave breach
I tried pasting vаlvesoftware.com (with https, I leaved it here to not trigger the link) with the russian "a", and there was a redirect
(that's a phishing link)
redirect links can trick it
somber prism
yeh its only 97% accurate
somber prism
thx
@grave breach i used this dataset - https://www.kaggle.com/shashwatwork/web-page-phishing-detection-dataset

Detect Phishing in Web Pages
grave breach
wait, I think that's no longer ML related, I'll dm you with the broblem
somber prism
oh ok
 half swallow
How can I make a translator that can translate custom numbers into english letters? For example if L = 13 and O = 9 then if I were to put LOL into the translator it would translate it to 13913.
I didn't know in what field this would fit into ^
grave breach
half swallow
I didn't know in what field this would fit into ^
you don't need machine learning for that
just make a dictionary that associate letters to number, and then use a replace
 cedar sky
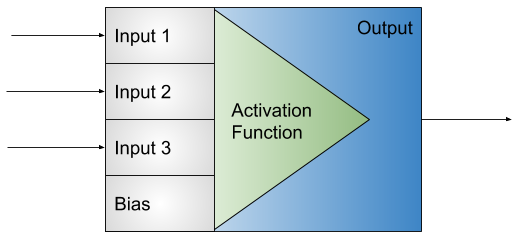
https://medium.com/@hariaakash646/witchcraft-of-deep-learning-activation-functions-4f6ed323ad78
Guys I have written this medium article... Just read through it and give me your feedback...
Medium
One of the most important part of any DL model is the activation of each of its layer. An ANN with 10 hidden layers without any activation…
short heart
Tf not showing validation accuracy
model.fit(x_train,y_train,verbose=1,batch_size=8,epochs=5,validation_data=(x_val, y_val))```
19/1250 [..............................] - ETA: 6:05 - loss: 0.7251 - accuracy: 0.7039 - auc: 0.7578```
lapis sequoia
Hi, can u recommend me some websites like exercism.io only that to learn python as a tool for data science/data visualization? I would like to gain skills in libraries like numpy, pandas etc.
lapis sequoia
short heart
Tf not showing validation accuracy
```
model.fit(x_train,y_train,verbose=1,batch...
maybe cuz it has to train before validating?
short heart
lapis sequoia
maybe cuz it has to train before validating?
pretty sure you can view val score during training in tf
theres parameter validation data for a reason after all
lapis sequoia
pretty sure u cant
lapis sequoia
short heart
theres parameter validation data for a reason after all
yes, to validate data after training
short heart
lapis sequoia
pretty sure u cant
yeah it is possible and should look somewhat like this, according to official tf tutorial
782/782 [==============================] - 3s 3ms/step - loss: 0.5769 - sparse_categorical_accuracy: 0.8386 - val_loss: 0.1833 - val_sparse_categorical_accuracy: 0.9464```then go look and stop asking
short heart
wow dude thats my question, cause it doesnt show me the metrics
ripe forge
I think it shows them at the end of each epoch
Wait for one epoch to finish and see what you get.
short heart
ripe forge
I think it shows them at the end of each epoch
alright ill write here like 30 minutes later..
and thanks
ripe forge
Yep np!
lapis sequoia
thats what i said. it validates after train
short heart
after train and after epochs makes a difference, i probably misunderstood you
 plush leaf
Hi, I have a problem with my example of KNN Prediction. I cannot increase the test accuracy to define k_neightbor value. Can you get in contact with me if you have any idea about it? Here is my project
arctic wedgeBOT
Hey @plush leaf!
It looks like you tried to attach file type(s) that we do not allow (.rar). We currently allow the following file types: .gif, .jpg, .jpeg, .mov, .mp4, .mpg, .png, .mp3, .wav, .ogg, .webm, .webp, .flac, .m4a.
Feel free to ask in #community-meta if you think this is a mistake.
 lilac geyser
We use fit_transform for train data and only transform for test data and we pass the data to model for fitting and predicting.
My question is
What should we want to do, if we want to predict for the new values?
Should we transform the data using transform method and then pass the data to model? Or can we pass the values directly to the model?
grave breach
lapis sequoia
maybe cuz it has to train before validating?
not everytime
grave breach
it's often useful to see how a model scores aganist the not trained one
you often see it in papers
short heart
ripe forge
Wait for one epoch to finish and see what you get.
it didnt show me anything
thats all i had
1250/1250 [==============================] - 463s 340ms/step - loss: 0.4938 - accuracy: 0.7533 - auc: 0.8128
Epoch 2/5
1250/1250 [==============================] - 451s 360ms/step - loss: 0.4326 - accuracy: 0.7959 - auc: 0.8636
Epoch 3/5
1250/1250 [==============================] - 449s 360ms/step - loss: 0.3654 - accuracy: 0.8403 - auc: 0.9061
Epoch 4/5
1250/1250 [==============================] - 432s 346ms/step - loss: 0.2674 - accuracy: 0.8949 - auc: 0.9497
Epoch 5/5
1250/1250 [==============================] - 373s 299ms/step - loss: 0.1919 - accuracy: 0.9252 - auc: 0.9740```Hm that's odd
lapis sequoia
it is not odd
 stiff knoll
Heya I'm Rohith, undergrad CS student I've decided to learn ML and datascience but idk where to start, anyone pls help me with the roadmaps or courses or something which will make me an expert in the field
lapis sequoia
show the compile
 grand breach
Which is better yolov5 or tensorflow for object detection (dl)?
serene scaffold
stiff knoll
Heya I'm Rohith, undergrad CS student I've decided to learn ML and datascience b...
does your program have any data science/ml classes you can take?
serene scaffold
stiff knoll
No..
can you take linear algebra and statistics?
grave breach
grand breach
Which is better yolov5 or tensorflow for object detection (dl)?
yolov5 is an algorithm for object detection, tensorflow is a library in wich you can implement yolo
grave breach
short heart
thats all i had
```
1250/1250 [==============================] - 463s 340ms/ste...
in compile did you specify to check the accuracy?
there should be a parameter called metrics
(a list)
 dawn crown
i read that neural networks image detection can be manipulated with adding noise to the image, can't we like remove those noises with opencv's cv2.dilate() and cv2.erode()? if we just take the iteration to be 1 then i think like their would be not so much damage
short heart
grave breach
in compile did you specify to check the accuracy?
yes i did
it wouldnt show me accuracy and auc on train otherwise
doesnt matter anyway ill just do it manually
grave breach
Ok
 desert oar
dawn crown
i read that neural networks image detection can be manipulated with adding noise...
desert oar
dawn crown
i read that neural networks image detection can be manipulated with adding noise...
if you're talking about "adversarial examples", i think the answer is "it depends" - but consider that an image detector might already use some kind of denoising in the training/prediction pipeline
https://medium.com/@yuezhixiong915/adversarial-examples-and-feature-denoising-d60e8ab38e8a
https://deepai.org/publication/detect-and-defense-against-adversarial-examples-in-deep-learning-using-natural-scene-statistics-and-adaptive-denoising

Medium
Take the face recognition as an example. The legitimate input stands for the adversarial example generated by adversarial attack. As we…

DeepAI
07/12/21 - Despite the enormous performance of deepneural networks (DNNs), recent
studies have shown theirvulnerability to adversarial exampl...
unborn glacier
dawn crown
i read that neural networks image detection can be manipulated with adding noise...
Yes, but as long as the person trying to mess with the NN knows the noise reduction technique, they can attempt to circumvent it. Tricking NNs is related to GANs in which one NN tries to design input to mess with the other NN (either to make better simulated data, or to trick the other NN). The best approach is to introduce your own GAN into the training of the detection/classification NN to inoculate it against the technique
lapis sequoia
Is there a way to run the cell being edited in Jupyter notebook without having it switch back to command mode? 
dawn crown
desert oar
if you're talking about "adversarial examples", i think the answer is "it depend...
many image recognition dont use like a denoiser, because of possible image destruction like for eg discord
grand breach
grave breach
yolov5 is an algorithm for object detection, tensorflow is a library in wich you...
Yeah, my bad i'm sorry :p
Which algorithm should be chosen when the annotation is in csv?
like yolov5 needs them to be in txt files for every image file
ripe forge
Why don't you just convert annotations to whatever format you need
grand breach
Yes i know, i'm going to write a script for that, just asked if there's any algorithm that works directly with csv
ripe forge
An algorithm doesn't care, but I do understand what you're trying to ask
grand breach
There are too many files ~900 images
ripe forge
I don't think you should worry about it, use whatever implementation you want to use, and just write code to do the conversation as you need. Like I'm willing to bet you don't need to create all these files even
Because ultimately all code will do is read those annotations and put it in memory somewhere for use.
So you could take the csv and directly load it in the correct structure as needed
grand breach
I'm thinking how will i make my conversion script to assign the correct class index to each image...
grand breach
ripe forge
So you could take the csv and directly load it in the correct structure as neede...
Hmm, i will see into it
grave frost
dawn crown
many image recognition dont use like a denoiser, because of possible image destr...
discord's image recognizer's are open sourced?
waxen veldt
i heard that pointplot, barplot, and countplots are not really that useful
what are the most important plots i should make when doing EDA?
I would think that count plots are important since they give info about the frequency of data and you can make judgements from that. What would be a good alternative?
dawn crown
grave frost
discord's image recognizer's are open sourced?
no but if you send a image(some specific img) and add noise to it discord image recogniser detects it as nsfw and dels it
waxen veldt
damn I just realized you can get more information from df.value_counts() than sns.countplot()
grave breach
grand breach
Yeah, my bad i'm sorry :p
Which algorithm should be chosen when the annotation ...
you have to write the algorithm
so you can make it work with any format you need
grave frost
dawn crown
no but if you send a image(some specific img) and add noise to it discord image ...
? why would it do that?
desert oar
grave frost
? why would it do that?
maybe because they assume if you're adding noise to an image that you are trying to bypass their nsfw filter
grave frost
desert oar
maybe because they assume if you're adding noise to an image that you are trying...
how do you even detect it? and why is adding noise a problem?
desert oar
wouldn't know, maybe there's some heuristic for it
the problem would be someone bypassing the nsfw content filters, not the noise itself
raw temple
Hi everyone, I have a question regarding tweet classification. If I want to classify the toxicity of tweets, how would I go about doing so? I saw a lot of articles and papers online that use some sort of nlp model to classify a dataset that already has labels. What do I do if my dataset does not have labels? Would i have to manually label them first?
desert oar
yeah, at some point you will have to figure out what exactly a "toxic" tweet is. either by manually classifying tweets, or by using some kind of unsupervised model and hoping that "toxic" tweets get grouped together
or, maybe there are existing NLP models that can detect "toxic" text, which you can apply or adapt to this task
 valid fulcrum
like to comment ratio
if there's way more comments than likes it's probably not so good
raw temple
So I've seen some models online that perform some classification with labelled dataset and I read that in order to classify my own dataset I should build a classifier using labelled dataset and then apply it to my own dataset. So can I do so with those models I see online? Like take the code they've written and just use my own dataset? 😅 is it so simple like that?
grave frost
desert oar
the problem would be someone bypassing the nsfw content filters, not the noise i...
dunno why some noise would bypass nsfw filters 🤔
adversarial attacks require the model checkpoint to be available
grave frost
raw temple
So I've seen some models online that perform some classification with labelled d...
probably not that simple - but close enough yeah
 silver sun
Does anyone know how to use the Altair data visualization library for big csv files?
raw temple
Okay, at least I have a direction now
short heart
Ok so accuracy on train seems to be slowly going up, but validation stays the same on 0.5, the problem is I use effnetb7, so how do I control overfit in this situation? Should I just lower the effnet version to something like b4 and watch it, or what else can I do
late shell
late shell
Hello, I want to code up a simple NN from scratch but I'm running into dimension...
hello, can someone please look at this, I've been struggling for 2 days now :( .
 iron basalt
late shell
hello, can someone please look at this, I've been struggling for 2 days now :( .
iron basalt
late shell
hello, can someone please look at this, I've been struggling for 2 days now :( .

Most of us last saw calculus in school, but derivatives are a critical part of machine learning, particularly deep neural networks, which are trained by optimizing a loss function. This article is an attempt to explain all the matrix calculus you need in order to understand the training of deep neural networks. We assume no math knowledge beyond...
desert oar
grave frost
dunno why some noise would bypass nsfw filters 🤔
Idk, it was just a guess, you know better than i do!
 primal shuttle
@raw temple I think you can also incorporate some semi-supervised learning techniques, including active learning etc. I would look into being able to write labelling functions and thus create a pool of rules on what constitutes toxicity in your dataset. Have a look at tools such as snorkel which have such pipelines worked out for you. These labelling functions can abstract into pre-trained models as well. Hope that helps!
If you were to use these techniques be aware that there needs to be a normed approach to such labelling - either done by domain experts or at least not-a-one-person approach in order to standardise the labelling conventions for the labelling functions to be created
raw temple
@primal shuttle hello, thanks for this information. It will be helpful! I'll have a look into these techniques and see if I can work with them. Thanks!
unborn glacier
raw temple
Hi everyone, I have a question regarding tweet classification. If I want to clas...
Kaggle did a competition on something similar using toxic Wikipedia comments. There are a ton of example models that you can try out that are open source and solve a very similar problem that might work for tweets out of the box. Here are the examples: https://www.kaggle.com/c/jigsaw-toxic-comment-classification-challenge/code
Make sure to check the license before using them

Identify and classify toxic online comments
raw temple
@unborn glacier thanks for this link! It will be very helpful. I'll certainly have a look at those as well
grand breach
grave breach
so you can make it work with any format you need
okay i'm writing a function that reads the csv & creates a dictionary that stores the required values from each row in yolov5's annotation format.
the dict stores the filename, imagesize, bboxes like this:
{'bboxes': [{class1},{class2}],
 'filename': '',
 'imagesize': ''}
the csv is as follows:
   class  x-axis  y-axis  width  height           name  image_  image_
                                                        width   height
0   ball     308     382     26      16     U5_3_9.png   680    720
1    bat     351     202     57      26     U5_3_9.png   680    720
2   ball     235     370     27      24    U4_7_27.png   680    720
3    bat     314     337     56      85    U4_7_27.png   680    720
4   ball     238     373     24      22    U4_7_27.png   680    720
5    bat     310     336     59      86    U4_7_27.png   680    720
because there are two or more filenames in each row, how do i make the bounding box values append to only single filename ?
 pseudo turret
grand breach
pseudo turret
grand breach
like for example in the case for 0 and 1st rows instead of creating a new dictionary for each row, append the values x-axis, y-axis, width & height to the same 'filename' : US_3_9.png so the dictionary would look something like this...
{'bboxes' : [{'class' : 'ball', 'x': 308, 'y': 382, 'w':26, 'h':16},
             {'class' : 'bat', 'x': 323, 'y': 388, 'w':43, 'h':12}],
 'filename': 'US_3_9.png',
 'img_size': (680, 720)}
and idea? how i could include a conditional statement that checks filename and appends ?
grand breach
Is it possible to compare filenames at each iteration and if they match append them to the bboxes key ?
grave breach
grand breach
okay i'm writing a function that reads the csv & creates a dictionary that store...
dude, you don't have to lose your time wrapping your mind about this, when you create your implementation of yolo you just make it work with the data you have
so you lose less time and gain more from this
still, if this is the first time that you code a yolo implementation I suggest you to start with YOLO v3 since it's heavily used, so it will be less hard
chilly geyser
raw temple
Hi everyone, I have a question regarding tweet classification. If I want to clas...
If you want some kind of full-blown 'unsupervised' learning you will still need to say a tweet is of type "A" or type "B" - and it may not even be differentiated into 'toxic' vs 'non-toxic' (e.g. they could be classified into 'about cats' vs 'not about cats')
grave frost
raw temple
Hi everyone, I have a question regarding tweet classification. If I want to clas...
just simply use some pre-trained model so you won't have to do the training on your dataset - and just use it
raw temple
@grave frost so if I use a pretrained model, I can use that with my own dataset?
grave frost
raw temple
<@738058085083381760> so if I use a pretrained model, I can use that with my ow...
why do you want to use your own dataset though?
 undone flare
what's the difference between np arrays and tf tensors. Is it just that tensors can be run on gpu/tpu so much faster for computational task?
grave frost
raw temple
Because its specific to my project that u am doing
read up on "fine-tuning" models - you can try fine-tuning it on Roberta with Google Colab which gives free GPUs
raw temple
@grave frost yes, I have tried reading into it, its a lot to take in but hopefully I am making some progress 🤣 thanks for the info
grave frost
undone flare
what's the difference between np arrays and tf tensors. Is it just that tensors ...
programmatically, not much except they are framework specific. Mathematically? yes
undone flare
alright, thanks
grave frost
cool, no worries
tender hearth
undone flare
what's the difference between np arrays and tf tensors. Is it just that tensors ...
er, as far as I know, numpy arrays cannot be hardware accelerated
grave frost
undone flare
alright, thanks
if you want a better view, I recommend you check out 3B1B's vids on those mathematical concepts
undone flare
also if I don't have a supported gpu would cpu cut for it?
grave frost
tender hearth
er, as far as I know, numpy arrays cannot be hardware accelerated
but scikit-learn uses them - and it can distrubute workloads too 🤔
grave frost
undone flare
also if I don't have a supported gpu would cpu cut for it?
for what?
grave frost
tender hearth
er, as far as I know, numpy arrays cannot be hardware accelerated
hm, it seems that to use numpy on CUDA, there is another CuPy lib. so you might be correct
undone flare
grave frost
for what?
like gpu intensive stuff?
grave frost
undone flare
like gpu intensive stuff?
like what exactly are you doing?
undone flare
I am learning right now, but say like food image classification
tender hearth
you can train on a CPU, sure, but even something like a free Colab instance with GPU acceleration will be faster
grave frost
undone flare
I am learning right now, but say like food image classification
yes, you need GPU
tender hearth
if you want reasonable training times, use a GPU
undone flare
hmm
tender hearth
Google Colab's free
undone flare
yea using that right now
grave frost
it doesn't have unlimited use, but its adequate for your tasks
undone flare
by unlimited use do you mean disk size and ram?
grave frost
no, the hours you can use GPU in a month
grave frost
so don't waste it - most things can be done on CPU which is unlimited
undone flare
yea
undone flare
grave frost
no, the hours you can use GPU in a month
is it like heroku (quota for every month)
or just a trial type of thing
grave frost
undone flare
is it like heroku (quota for every month)
there isn't any visible quota, but its not unlimited
undone flare
alright
grave frost
you might be able to use it forever, you might not
depends on the demand at the time
undone flare
looks like the time period to use gpu again increases significantly and usage time reduces
grave frost
I haven't had any problems ever, so I dunno
it just downgrades me on heavy use
V100 if fresh --> P100 most times
waxen veldt
Seaborn
why ever use FacetGrid when you have CatPlot?
 flat hollow
Pandas question: I have a dataframe with a bunch of rows. For each row I need to find the number of nonzero values, sum all values in that row and use these two numbers in an equation. Is there a vectorized solution for this? I don't want to use .apply() because it's slower and because I want to learn how to write vectorized solutions for working with dataframes. (pls ping when answering)
serene scaffold
@flat hollow you can take the sum along the desired axis of the dataframe
flat hollow
I've managed to find a nice resource and I vectorized it using
resids_AIC["AIC"] = 2*k + resids_AIC["nonzero"]*np.log(resids_AIC["sum"])
``` but thanks for the reply 🙂(df != 0).sum(...), etc.
flat hollow
resids_AIC = pd.DataFrame((resids.sum(axis = 1),(resids != 0).sum(axis=1))).T
``` yeah 
slow vigil
I'm trying to write one key from a JSON file to a parquet file. Does anyone know how to do that? I'm currently getting an error
pyarrow.lib.'ChunkedArray' object has no attribute 'schema'
 worldly ruin
So I have a bunch of student data and I need to split 1 column of format "Last, First [Middle]", where middle is optional, into 3 columns First Middle Last.
I originally tried doing a simple split with the intent to remove the comma from the last name column, but since the middle name is optional, the split wasn't cooperating because it sometimes returned 2 names, sometimes 3 and it didn't like the varying lengths
Is there a quick way to split that column in pandas?
unborn glacier
pseudocode, but: column_text.append(",") where count(",")==2
Just add the extra comma so that middle name is "" when there is none
worldly ruin
so essentially it would change:
smith, john james
doe, jane
``` into
smith, john, james
doe, jane, ""
Not literally "" but just an empty string
that I could then split on ", " into 3 columns
short heart
accuracy on train keeps increasing but val stays around 0.5, i tried everything for overfit control but it either ruins train acc or just does nothing. Could it be that i simply might ve taken kind of data for val that hasnt been explored yet?
 tidal bronze
yooo what would be a good graph to show the effect of aggregating data (pandas groupby)?
serene scaffold
tidal bronze
yooo what would be a good graph to show the effect of aggregating data (pandas g...
I answered this person's question in another channel, just so everyone knows.
 icy pine
DM me if you're into AI development and machine learning!
serene scaffold
icy pine
DM me if you're into AI development and machine learning!
why?
icy pine
serene scaffold
why?
I'm putting together some people who love AI and I was thinking we all could make something together...?
serene scaffold
icy pine
I'm putting together some people who love AI and I was thinking we all could mak...
sounds good. why don't you say in this channel what you want to make?
icy pine
Ok.
Hello, fellow coders.
I'm putting together a team of python users to make a downloadable AI assistant (kind of like Siri, Cortana or Alexa) that you can download on your computer. All in python.
I think this isn't a one-man project so I need some team members. Please contact me if you have experience regarding this area (I'm new to this but I'm a fast learner) or if you have any questions. I'm very new to this but It's a project I definitely want to undertake because it seems overall like a fun project, especially since I'm only a teen.
What I'm expecting or hoping for the final result to be (I will update it, fix it, and add more features as we go too) I'm trying to make it able to tell weather, time, math calculations, mini-games, looking on the web, youtube music, and recent news, all using voice commands and speaking in voice that should sound somewhat natural. I'm also trying to make some sort of machine learning so the AI can learn more about you and slightly change its questions and statements to fit your personality.
If you think this is impossible or I'm having high hopes and I am a complete idiot, please feel free to tell me, since I'm open to judgement and improvement.
You can DM me at DarkMist#0074.
Note: I'm not offering payment of any kind or anything. I am just hoping that this will be a fun experience to everyone and a wonderful project. I will make like a poster of everyone in the team with their names and contribution and everything to kind of honor them and thank them for their help. This is a TEAM, by the way, not a company or a giant corporation, so I will probably accept a max of 15 members or so.
Thank you for reading. It should have taken a ton of time unless you are Mr Howard Berg. Let me know if you have questions!
DarkMist
serene scaffold
icy pine
Hello, fellow coders.
I'm putting together a team of python users to make a do...
have you made a github repository yet?
icy pine
Yes
One of my team members made one

GitHub
Contribute to AnAIDev/Virtual-Assistant development by creating an account on GitHub.
we only have space for one more though
fiery minnow
<@&831776746206265384>
icy pine
Uh oh am I getting banned
flat hollow
I want to plot the following dataframe as 3 boxplots on the same subplot.

if I try box_data.plot(kind = "box", ax = axs[i,j]) I get the following plot, any ideas how I can fix it?
 serene scaffold
icy pine
Uh oh am I getting banned
serene scaffold
icy pine
Uh oh am I getting banned
No.
 atomic solstice
What are some good Data Science and AI videos/articles?
vivid mantle
atomic solstice
What are some good Data Science and AI videos/articles?
maybe check the pins ?
desert oar
flat hollow
if I try `box_data.plot(kind = "box", ax = axs[i,j])` I get the following plot, ...
Try using matplotlib directly?
Looks like it's using rows instead of columns
Maybe you need to adjust the ax argument
 quiet vault
Is anyone here familiar with keras?
unborn glacier
quiet vault
Is anyone here familiar with keras?
Yes, I think a lot of people here have at least used it, whats up?
quiet vault
So
well
this is kinda complicated
I have a uni variate dataset with data on whether airplane passengers will go up or down daily. The dataset has 3 possible numbers. 1 (for going up), 0 (staying the same, unlikely but could happen) and -1 (going down). I am trying to find a way to have a model find a pattern and try to predict the next day
Do you have any possible way to do something like this? I know it's a rare problem and dataset
I began by taking the "sampling" approach which is taking a number of past days (user's choice) and putting the datapoints for those days in an array (x axis) and then taking the day after those days and putting it in another array (y axis).
unborn glacier
Like a time series model?
unborn glacier
The first question to ask, is given the last, lets say 10 days, do you have any reason to believe that a machine learning algo could accurately predict the next day
Other than just guessing the average of the last 10 days
quiet vault
no
unborn glacier
Then it probably won't have much luck haha
unborn glacier
Yeah, the format of the data is fine, you could have it make predictions
I have code that pretty much describes what you're doing that I can share if you like
quiet vault
yes please
unborn glacier
Okay, give me a few minutes
quiet vault
Alright
unborn glacier
from keras.models import Sequential
from keras.layers import LSTM
from keras.layers import Dense
import numpy as np
import time


#Convert a continuous array into training samples of len(n_steps)
def split_sequence(sequence, n_steps):
    X, y = list(), list()
    for i in range(len(sequence)):
        # find the end of this pattern
        end_ix = i + n_steps
        # check if we are beyond the sequence
        if end_ix > len(sequence)-1:
            break
        # gather input and output parts of the pattern
        seq_x, seq_y = sequence[i:end_ix], sequence[end_ix]
        X.append(seq_x)
        y.append(seq_y)
    return np.array(X), np.array(y)


x = np.array(list(range(1,1000)))
pre_input_sequence = list(np.sin(x/10))
#some messy code to convert 1D array [1,2,3] to 2D array [[1],[2],[3]]
input_sequence = []
for item in pre_input_sequence:
    input_sequence.append([item])

input_sequence = np.array(input_sequence)

n_steps = 10

#Train an lstm
print("Training...")
start_time = time.time()
# number of time steps
#continue training from old model?
resume=False
n_epochs = 100
# split into samples
X, y = split_sequence(input_sequence, n_steps)
# reshape from [samples, timesteps] into [samples, timesteps, features]
n_features = len(input_sequence[0])
X = X.reshape((X.shape[0], X.shape[1], n_features))
# define model
if not resume:
    model = Sequential()
    model.add(LSTM(50, activation='relu', input_shape=(n_steps, n_features)))
    model.add(Dense(n_features))
    model.compile(optimizer='adam', loss='mse')
# fit model
model.fit(X, y, epochs=n_epochs, verbose=0)
print("Done!  Took "+str(int(time.time() - start_time))+" seconds")

print(model.predict(np.array([[0],[0],[0],[0],[0],[0],[0],[0],[0],[0]]).reshape((1, n_steps, n_features))))
@quiet vault That takes an n-d array of length n_steps as input and trains an lstm
I'm just having it train based off a sine wave right now
quiet vault
Thanks
unborn glacier
You can force the output using an activation function
You might also want to make it 3D for -1 , 0 , 1
Sometimes that has better performance
(one-hot encoding)
quiet vault
Will do, thanks so much
unborn glacier
👍
If you do want a fully accurate time series prediction, you'll want to make different ones for different time scales
Like a per-month one, a per week one, one that considers holidays
Like travel is up on weekends and on holidays, so if a holiday falls on a weekend it will be extra busy
Obviously that takes a lot more consideration than just a NN, but it will also usually work better unless you have billions of data points or something
quiet vault
Yeah that sounds a bit complicated to take into account. For now, this is just a fun project to learn about ML.
unborn glacier
Btw this is the project that I used the lstm for, if you wanted to take a look:
https://github.com/a-brick-wall/chord_generator_lstm/blob/main/chord_lstm.ipynb

GitHub
Generate chord progressions with an LSTM trained on thousands of songs - chord_generator_lstm/chord_lstm.ipynb at main · a-brick-wall/chord_generator_lstm
quiet vault
The ultimate model would be taking into account everything that you said, plus looking into google and searching for news that affects travel. Such as: "USA bans traveling to these countries to go covid" and making a prediction. It gives me headaches imagining how to make such a thing though haha
quiet vault
unborn glacier
Btw this is the project that I used the lstm for, if you wanted to take a look:
...
Yeah I'll give that a read.
unborn glacier
quiet vault
The ultimate model would be taking into account everything that you said, plus l...
Then tie it to the airline stocks and get rich!
slate hollow
so i'm thinking of making an ai that generates text messages
but the problem with that is most text messages are very short (20, 30 chars)
and i don't think that would be enough for an ai to like learn patterns
so how would i go about solving this problem?
somber prism
guys i have one doubt, what if you try to fit a model (lot of models) and even after cross validating you get the training and testing score in the range 40% - 45%. does that mean the dataset isnt good or data points are feature engg wrongly ?
asking for a friend
flat hollow
desert oar
Try using matplotlib directly?
omfg I was working on the code at 1am my time and I used the full dataset for plotting instead of the curated one 😄 😄 cheers for help though 🙂
sinful gale
Can anyone help me interpret this graph? What does the density mean?

 tough frigate
could any recommend the best resources to learn Seaborn?
besides its documentation
somber prism
nvm i just realized thats a time series problem, i thought it was a normal data set and tried to predict with linear regg, lasso and ridge
somber prism
sinful gale
Can anyone help me interpret this graph? What does the density mean?
it means that the annual income are normally distributed and closer to the mean , also judging from that graph there's no any outliers which is good for the model
sinful gale
somber prism
it means that the annual income are normally distributed and closer to the mean ...
Does higher the density mean higher the chances of it being 1 instead of 0?
somber prism
sinful gale
Does higher the density mean higher the chances of it being 1 instead of 0?
what chances of being 1 instead of 0?
somber prism
you mean the output variable ?
sinful gale
somber prism
you mean the output variable ?
yes, the hue
sinful gale
somber prism
you need to check the vid about standard deviation
Which vid? I know what standard deviation is but I dont know what density is
somber prism
sinful gale
Which vid? I know what standard deviation is but I dont know what density is

In this seaborn distplot tutorial video, I first explain the seaborn distplot intepretation: it is a single distribution plot that combines a histogram, a kdeplot, and a rugplot. I then demo how to make a distplot using Python seaborn by walking through the coding basics as well as some advanced styling options. I end with several seaborn Pyth...
sinful gale
somber prism
https://youtu.be/fJoR3QsfXa0
Thanks, I will check it out
somber prism
np
somber prism
sinful gale
Thanks, I will check it out

An introduction to density curves for visualizing distributions. A brief review of frequency histograms and relative frequency histograms as well.
View more lessons or practice this subject at http://www.khanacademy.org/math/ap-statistics/density-curves-normal-distribution-ap/density-curves/v/density-curves?utm_source=youtube&utm_medium=desc&ut...
undone flare
This is the actual graph

This is the prediction graph

why is the second one too dense?
inland zephyr
hello i want to ask about tensorflow model. I define my model as function with def definition and call it on loop for since i have own testing method by using different combination of set of data. The example just like
!python
def Model():
   ...
    return model
for k in range (100):
    x_train,y_train,x_val,y_val: DataMaker()
    model = Model()
    history = model.fit(x=x_train....)
I wonder if in new iteration, is it a same model trained on previous loop are used or a fresh untrained model?
 primal tulip
undone flare
This is the prediction graph
primal tulip
undone flare
This is the prediction graph
Are you sure you're not plotting both the actual graph and the prediction graph on the same chart?
 bleak grail
 uncut barn
is there a difference when you put random.seed(0) within a function or outside (before) the function?
undone flare
primal tulip
Are you sure you're not plotting both the actual graph and the prediction graph ...
no, it's not plotting both the graphs
unborn glacier
uncut barn
is there a difference when you put random.seed(0) within a function or outside (...
Doesn't seem to affect it, but remember that if you put it outside the function and call the function twice, you will get 2 different numbers
uncut barn
unborn glacier
Doesn't seem to affect it, but remember that if you put it outside the function ...
hmm why?
as its set to the same seed
somber prism
guys i trying to find the best features using mutual info regression from sklearn.feature_selection by following this tutorial from https://www.kaggle.com/ryanholbrook/mutual-information, but when i tried that same code here i am getting this cannot convert the string to float error
 unborn glacier
The seed just gives the starting place for random, each time you call random it will give a new number unless you reset the seed each time
undone flare
somber prism
guys i trying to find the best features using mutual info regression from sklear...
can you show some more code? like what is X and y
and how the data looks like
somber prism
ok
somber prism
undone flare
can you show some more code? like what is X and y
i checked the dtype of target variable and its object

i tried to convert it by using y.astype(np.float64)
but still getting that cannot convert the obj to float error
undone flare
then there is something which can't be converted to float
like "Hello" obviously can't be converted to float
somber prism
oh ok got it , i fount out that some of the rows had '?' in it for the target var
thanks for the help @undone flare
 inland crypt
I am working with large data (9 million rows) that is highly positively skewed. Out of a range of 0 to 1000, most of the values are between 0 and 10. Please provide any recommendations to identify and remove outliers as this is not a Gaussian distribution.
So far I have used the Z score and Inter Quartile Range to determine outliers.
desert oar
inland crypt
I am working with large data (9 million rows) that is highly positively skewed. ...
https://stats.stackexchange.com/q/129274/36229
https://stats.stackexchange.com/a/129297/36229
maybe some ideas here

Cross Validated
Under a classical definition of an outlier as a data point outide the 1.5* IQR from the upper or lower quartile, there is an assumption of a non-skewed distribution. For skewed distributions (Expon...
Z score and IQR are both questionable for a highly skewed distribution
 wicked wing
hi all. machine learning basics question here. let's say I have a "black box" function, that takes some input data, and a few parameters, and generates some output data. I can determine the "quality" of the output data. Can I use machine learning to automatically determine what are "good" parameters for that specific input?
at the moment, I am manually changing the parameters and checking the data quality. I can find parameters that give good output data through trial-and-error, but I was wondering whether I could automate it.
desert oar
what is "good"? as in, produces an output that's close to the actual output?
are the parameters the same for all inputs?
wicked wing
there are statistical tests I can apply to the output data to determine its quality
desert oar
do you need this to be a generalized thing for all inputs, or are you OK with running some kind of specific search process for each new set of inputs to find the exact parameters for that set of inputs?
chilly geyser
This sounds like some genetic algo idea
wicked wing
I'm okay with a search process for each input dataset
 junior matrix
i am trying the titanic data set and was trying to find a way to fill the missing ages..
Mean = X_train['Age'].mean()
def fillage(df):
    for x in df.isnull()['Age']:
        if 'Master' in df['Name']:
            df.Age.fillna(random.randint(1,18))
        else:
            df.Age.fillna(Mean)
but when i pass the data set it does not fill the values
whats wrong
wicked wing
we have lots of computing power at our disposal - the main aim is to reduce the number of man-hours required to find good parameters for each new input dataset
desert oar
wicked wing
I'm okay with a search process for each input dataset
then you have several options depending on the runtime requirements and the shape/size of the parameter space:
- random search or grid search
- bayesian optimization
- evolutionary algo
- something based on auto-ml https://autokeras.com/
Documentation for AutoKeras.
it depends on what assumptions you can and can't make
e.g. i've worked on tasks like this where the sensible thing to do was fit a new time series model for every set of inputs
so i wrote up an automated routine that checked for cointegration, autocorrelation, etc. and fit a time series model based on that. nowadays there are existing libraries for it, e.g. https://otexts.com/fpp2/arima-r.html
 wicked wing
A grid search is what I've implemented mostly-manually in the past
For example: "ok, if I fix these 5 parameters, and only vary one other parameter 10 times, I'll get 10 different outputs and I can pick the best one"
I have acceptable ranges for each parameter, but there are 6 input parameters in total, so that's quite a large space to look in
too large to do manually, anyway
a genetic algorithm sounds good to me
desert oar
https://en.wikipedia.org/wiki/Bayesian_optimization
https://www.borealisai.com/en/blog/tutorial-8-bayesian-optimization/
Bayesian optimization is a sequential design strategy for global optimization of black-box functions that does not assume any functional forms. It is usually employed to optimize expensive-to-evaluate functions.
bayesian optimization is a lot like a "smart" grid search, that intelligently interpolates between grid points
wicked wing
ah, awesome, that sounds really powerful
desert oar
some interesting discussion here in one very specific use case https://github.com/EpistasisLab/tpot/issues/707#issuecomment-397350950

GitHub
Hi, I opened the issue as I am working on the research issues in machine learning to get the optimal set of parameters in a classifier along with optimal selection of features etc. Genetic Programm...
i believe DEAP is the "standard" evolutionary algo library in python https://pypi.org/project/deap/ but it might require a lot of tuning
 wicked wing
awesome, it works with multiprocessing
desert oar
for bayes opt, i've used http://hyperopt.github.io/hyperopt/ but i've only used it specifically for hyperparameters in a traditional machine learning setting
Documentation for Hyperopt, Distributed Asynchronous Hyper-parameter Optimization
there are a lot of other bayes opt libraries in python that i have not used, e.g. https://github.com/fmfn/BayesianOptimization
GitHub
A Python implementation of global optimization with gaussian processes. - GitHub - fmfn/BayesianOptimization: A Python implementation of global optimization with gaussian processes.
wicked wing
so I guess you can kick off a population of random parameters in parallel, then characterise all the outputs, then go "hmmm, parameters around here are doing well, but over there they do very badly"
"my next search will be around this specific good area"
then it finds good parameters that way?
desert oar
desert oar
wicked wing
"my next search will be around this specific good area"
something like that
wicked wing
fantastic
I suppose, if we "zoom out", we basically have a function that maps 6 input parameters to one output number, which is the "quality" I want to maximize
and all we're doing is finding the point in parameter space that maximizes the quality
"change these 6 dials until that meter goes up"
desert oar
yeah that is pretty much black-box optimization in a nutshell
wicked wing
ah, fantastic! I was sure there would be a proper term for it
desert oar
for which your options are: bayes opt (basically grid search with smart interpolation), evolutionary algo (one of several "breeding" techniques to generate new parameters to try), or auto-ml (try various parametric/functional models until one fits well)
wicked wing
cool - I'm glad it's in theory a solvable problem, before I write this project proposal!
desert oar
dumping some other links i found that might be interesting (and are interesting for me to peruse later)
https://sahinidis.coe.gatech.edu/bbo
https://www.lix.polytechnique.fr/~dambrosio/blackbox_material/Cassioli_1.pdf
https://timvieira.github.io/blog/post/2018/03/16/black-box-optimization/
https://www.gerad.ca/Sebastien.Le.Digabel/talks/2014_LANL_50mins.pdf
https://bbochallenge.com/
https://stats.stackexchange.com/q/241089/36229
Blackbox Competition, powered by Valohai
wicked wing
to give you some idea - the function is single-threaded, and takes around 10 minutes to complete
we have access to a high-performance computing cluster with 500 threads per user allowance
so I suppose in our case it's a "cheap" function
desert oar
it's "expensive" in that each iteration is expensive, even if you can parallelize iterations
which again is perfect for black box optimization
wicked wing
aah I see
desert oar
there is a lot of research into this area specifically for finding hyperparameters for ML models, but it has plenty of other uses, like this case you're describing
wicked wing
yeah, when I was searching "parameter optimization", it all came back with hyperparameter stuff
an advantage is that we have upper and lower bounds for most of these parameters
somber prism
does anyone know about mutual_info_regg and mutual_info_clf ?
wicked wing
anyway, I have much to read, thank you @desert oar for your help, I'm very grateful
somber prism
correct me if i am wrong , is the mutual_info_regg is used when the target var is continuous values and mutual_info_clf is used for classifications or discrete values
anyone ?
 rapid raft
Anyone else getting read timeout error while installing pytorch
I have tried increasing the timeout of pip but didn't work
desert oar
somber prism
correct me if i am wrong , is the mutual_info_regg is used when the target var i...
yes
somber prism
thx
desert oar
wicked wing
an advantage is that we have upper and lower bounds for most of these parameters
there might be specific techniques for when you know bounds on the parameters. @ me if you figure it out, i'm very curious
undone flare
rapid raft
Anyone else getting read timeout error while installing pytorch
how are you installing it?
silver sun
Does anyone know a quick Machine Learning model I can use for an inverse correlation?
rapid raft
pip install torch
undone flare
rapid raft
pip install torch
https://pytorch.org/get-started/locally/#start-locally you might need something more than that ¯_(ツ)_/¯
like for me it would be
 rapid raft
undone flare
https://pytorch.org/get-started/locally/#start-locally you might need something ...
rapid raft
undone flare
https://pytorch.org/get-started/locally/#start-locally you might need something ...
i know the prequisites
the problem is in downloading
it stops at like 30mb when it is downloading
and gives me the exception
 grave frost
oof
 uncut orbit
I need to install pytesseract in colab but i keep on getting this error:
TesseractNotFoundError: tesseract is not installed or it's not in your PATH. See README file for more information.
grave breach
uncut orbit
I need to install pytesseract in colab but i keep on getting this error:
Tessera...
tesseract is a software, you first have to install it
it should work like any other linux distro
just use the same commands you would use on your pc
uncut orbit
oh that explains why the error was different than other errors: ''module not found''
slate hollow
so rn by bar graphs are like this

how do i specify it so that
the green part is on top
 warm swallow
I have a fairly large dataset of texts scraped from social media (~2M). Many texts contain some very harsh language. I would like a way to filter them out. Google search gives me a lot of hits but they are all for labelled datasets. I also see one implementation of toxic-bert, I believe was fine-tuned on toxic-comment-classification challenge. Would leveraging that fine-tuned model on my texts be a good idea?
serene scaffold
warm swallow
I have a fairly large dataset of texts scraped from social media (~2M). Many tex...
what is considered toxic, for your purposes? BERT might be overkill if there's a simple heuristic.
our mod bot, @arctic wedge, can catch a lot of unwanted content using regular expressions.
warm swallow
serene scaffold
what is considered toxic, for your purposes? BERT might be overkill if there's a...
swearing, profanity, vulgarity. also some harsh words used for other ethnicities etc. We noticed some many different harsh slangs used as well. For starting out, regular expressions I believe can definitely filter out some common toxic words.
serene scaffold
also, what are you trying to do that you don't want harsh language in the data?
I'm not saying that wanting to filter out harsh language is necessarily wrong, though since I don't know what your goal is, it might be that keeping the unpleasant comments that are in your data is giving you a more representative sample of what's out there.
warm swallow
So by social media I meant a "public forum" our client collects data from. They would like to filter toxic data from clean data just to measure how much toxicity is used. So given a dataset of 7-days with ~2M texts, what % of those texts are toxic?
serene scaffold
So you're not filtering it per se, you just want to see how much toxicity is out there. I suppose these terms might not be formally defined in the context of data science (or maybe they are), but I thought your goal was to eliminate certain observations from your data entirely.
warm swallow
Yeah sorry I may have worded it wrong
serene scaffold
That's okay. Language is inherently ambiguous 😄
warm swallow
ikr!
serene scaffold
So tell me about this toxic bert model. Do you have a link for it?
warm swallow
yeah hold on
serene scaffold
I've used BioBERT to great effect for biomedical named entity recognition.
warm swallow

GitHub
Trained models & code to predict toxic comments on all 3 Jigsaw Toxic Comment Challenges. Built using ⚡ Pytorch Lightning and 🤗 Transformers. - GitHub - unitaryai/detoxify: Trained models &...
yeah i have heard good things about BioBERT! I think one of the curai papers used it on huge corpus of coronavirus texts to identify medical related terms etc. They had some good results.
serene scaffold
I haven't done any covid-related work, unfortunately
I'm a bit tired at the moment but I'm trying to infer how this can be used to classify toxic or non-toxic texts
warm swallow
honestly I was just looking around and stumbled on this repo. I personally have to look in detail as well. But my very simple idea was to leverage one of their trained models on my data.
serene scaffold
warm swallow
honestly I was just looking around and stumbled on this repo. I personally have ...
see if you can come up with a more cohesive plan. Measuring the percent share of toxicity in a given corpus is a pretty intriguing concept, but it sounds like you haven't thought it all the way through.
is the goal to measure how much misinformation is being disseminated about covid?
warm swallow
serene scaffold
see if you can come up with a more cohesive plan. Measuring the percent share of...
I agree. Just starting out and exploring ideas. Hopefully we can find some good resources.
and no. i mentioned covid just regarding BioBERT.
Unfortunately, I cannot share what the texts are about because of NDA
 sacred cosmos
I'm trying to make a rain prediction model using already existing data but get errors left and right. Pls help me in #help-mango
 halcyon vale
Random Forest Model just averages the predictions of a number of trees and therefore it can never predict values outside the range of the training data. Random Forests are not able to extrapolate outside the types of data i.e out of domain data. Here prediction is simply the prediction that the Random Forest makes. Here bias is the prediction based on taking the mean of the dependent variable. Similarly contributions tells us the total change in prediction due to each of the independent variables. On my Journey of Machine Learning and Deep Learning, I have read and implemented from the book Deep Learning for Coders with Fastai and PyTorch. Here, I have read about Tree Interpreter, Redundant Features, Waterfall Charts or Plots, Random Forest, Prediction, Bias and Contributions, The Extrapolation Problem, Unsqueeze Method, Out of Domain Data and few more topics related to the same from here. I have presented the implementation of Tree Interpreter, Waterfall Plots, Extrapolation Problem using Fastai and PyTorch here in the snapshot. I hope you will gain some insights and work on the same. I hope you will also spend some time learning the topics from the Book mentioned below. Excited about the days ahead !!
Book:
Deep Learning for Coders with Fastai and PyTorch
Tabular Modeling
https://www.linkedin.com/posts/thinam-tamang-3b12831a2_300daysofdata-66daysofdata-machinelearning-activity-6826753785235312640-PuST

🏆 Day 229 of #300DaysOfData!
📋🖋 Notes :
🔰 Random Forest Model just averages the predictions of a number of trees and therefore it can never predict...
lapis sequoia
WoW thanks :)
 lone drum
How to iterate over column in dataframe
undone flare
lone drum
How to iterate over column in dataframe
what do you mean by that, like all the column names?
lone drum
undone flare
what do you mean by that, like all the column names?
I have columns but it does not have names
arctic wedgeBOT
property DataFrame.iloc```
Purely integer-location based indexing for selection by position.

`.iloc[]` is primarily integer position based (from `0` to `length-1` of the axis), but may also be used with a boolean array.

Allowed inputs are...
Similar names: pandas.pandas.DataFrame.iloc
undone flare
this works
A = tf.constant([1., 2, 3, 4, 5])
tf.math.reduce_std(A)
```but this doesn't
```py
A = tf.constant([1, 2, 3, 4, 5])
tf.math.reduce_std(A)
2497     means = reduce_mean(input_tensor, axis=axis, keepdims=True)
2498     if means.dtype.is_integer:
-> 2499       raise TypeError("Input must be either real or complex")
2500     diff = input_tensor - means
2501     if diff.dtype.is_complex:
int's are real too :|
primal tulip
You're copying the same code.
undone flare
first one is dtype float32 and second one is dtype int32
primal tulip
Are you handling errors yourself? You might want to check your catching logic
That's pretty weird still
undone flare
no it's the tf.math.reduce_std()
just wanted to know why it doesn't take in dtype of int
well that's weird tfp.stats.variance() accepts data type of int
primal tulip
warm swallow
I agree. Just starting out and exploring ideas. Hopefully we can find some good ...
https://www.kaggle.com/c/jigsaw-unintended-bias-in-toxicity-classification Your chat with Stelercus reminds me of this challenge and the one from the year before.

Detect toxicity across a diverse range of conversations
grave breach
warm swallow
I have a fairly large dataset of texts scraped from social media (~2M). Many tex...
just use spacy
serene scaffold
@grave breach which spacy functionality are you proposing that they use?
 upbeat lion
Anyone experienced with Machine Learning Models. I have a doubt with Multiclass Classification. It would be beneficial if anyone can guide us. DM me for more details related to query .
serene scaffold
upbeat lion
Anyone experienced with Machine Learning Models. I have a doubt with Multiclass ...
Why don't you just put your question here? It's easier to help when all of us can see your question.
upbeat lion
serene scaffold
Why don't you just put your question here? It's easier to help when all of us ca...
Can you join to Code/ Help 0??
I will share my screen and provide you more information there !!!
 fervent cloud
@serene scaffold can you join yeah
lapis sequoia
hello

 upbeat lion
upbeat lion
upbeat lion
This is our sample submission
serene scaffold
df['BROWSE_NODE_ID'].value_counts()
upbeat lion
 somber prism
can someone explain why do we need to split the date feature into 3 separate features like day, month, year?? is it for simplicity purpose so the model can train faster or for some other reason ?
 winged stratus
because, a computer cannot understand a date, you need to give the numbers separately
somber prism
winged stratus
because, a computer cannot understand a date, you need to give the numbers separ...
but i can label encode it right ?
winged stratus
hmm, i'm not sure
velvet thorn
somber prism
can someone explain why do we need to split the date feature into 3 separate fea...
not necessarily
it depends.
winged stratus
as with anything, try both of them and see if they affect performance
velvet thorn
winged stratus
because, a computer cannot understand a date, you need to give the numbers separ...
not necessarily true
somber prism
velvet thorn
not necessarily
just assume date is also playing as an important feature for some particular dataset
winged stratus
velvet thorn
not necessarily true
what are the common methods to pass dates into models? i admit i dont know much about date encoding, so please do enlighten me
velvet thorn
winged stratus
what are the common methods to pass dates into models? i admit i dont know much ...
okay one super good example
never mind, let me start again
“date” is one temporal concept
but in some sense, it’s relative
winged stratus
that makes sense...
velvet thorn
okay hold up let me type on computer
winged stratus
yeah...
velvet thorn
sorry
I got distracted
anyways
imagine, say
you're doing a very simple weather forecast
just temperature.
and a basic LSTM
nothing complex
assuming each data point is one day's temperature
you don't even need to explicitly encode the date
the position of each timestep implicitly encodes that
and in fact
for lots of timeseries data
such implicit encoding is sufficient
however
there is also the common case
of date being a feature
in and of itself
and often there is no apparent order/grouping
when that happens
there are ways
you could, of course, hand it off to a purpose-built neural network
the equivalent of like encoders for words/documents
the simplest way is to split your date into year/month/day
but it's hard to encode the idea of temporal similarity
for example
31/12/2020 and 1/1/2021 are next to each other
and far away from 1/1/2020
can your model understand that?
so it really depends.
and you're also suggesting
that January to Feburary
is a much smaller distance than December to January
is that correct?
winged stratus
that makes sense if you're using models with some mechanism of attention, but how do you encode dates for models which aren't RNNs/LSTMs/Transformers ?
velvet thorn
winged stratus
that makes sense if you're using models with some mechanism of attention, but ho...
what do you mean by "attention"?
I would say, by definition
only transformers have attention
winged stratus
i mean, RNNs and transformers can remember stuff, thats what i meant (poor choice of words)
velvet thorn
winged stratus
i mean, RNNs and transformers can remember stuff, thats what i meant (poor choic...
hm
are we talking about state
?
winged stratus
ye
winged stratus
other models can't process the "order" of the data right
velvet thorn
so yeah you could split, as @somber prism suggested
velvet thorn
winged stratus
other models can't process the "order" of the data right
not in the general case
there's something called
cyclical feature encoding
you can Google that
winged stratus
so, how do you encode dates for these models?
velvet thorn
that can be helpful
winged stratus
velvet thorn
cyclical feature encoding
i'll look into this 😅
velvet thorn
another possibility is relative encoding
e.g.
number of days
since event X
or before event X
say, for example
you're predicting ticket sales
for a yearly event
that kind of encoding could be useful
somber prism
velvet thorn
that kind of encoding could be useful
relative encoding ?
winged stratus
somber prism
relative encoding ?
days after an event eg. days before/after christmas
grave frost
winged stratus
that makes sense if you're using models with some mechanism of attention, but ho...
what?
do you mean concatenating positional encodings?
winged stratus
grave frost
what?
attention isn't the right word, but RNNs and LSTMs can "remember" because the output depends on past inputs, which is what i meant
grave frost
winged stratus
attention isn't the right word, but RNNs and LSTMs can "remember" because the ou...
yes they can
winged stratus
which is what i said...
grave frost
they maintain temporal coherency with positional encodings - that has nothing to do with attention
winged stratus
again, attention was a poor choice of a word
velvet thorn
grave frost
they don't remember per se
how would you describe the internal state then
somber prism
velvet thorn
is a much smaller distance than December to January
so i can drop the date col if i am using models like linear regg, logg regg and other basic ml models
grave frost
velvet thorn
how would you describe the internal state then
the hidden vector in RNNs? that's still not remembering per se - because if that were the case they would maintain long term temporal information - which they don't
velvet thorn
somber prism
so i can drop the date col if i am using models like linear regg, logg regg and ...
how did you get that
grave frost
though the new blenderbot paper has some advances 🤔 better read up on it
velvet thorn
grave frost
the hidden vector in RNNs? that's still not remembering per se - because if that...
I don't really see how "remember" implies that
grave frost
velvet thorn
I don't really see how "remember" implies that
as in its not how we as humans remember
a hidden vector seems to be a poor substitution for memory
velvet thorn
somber prism
.
I have literally no idea what you're saying, sorry
grave frost
whereas we can retain and process information from much more nuanced language as well as remember context well
velvet thorn
grave frost
whereas we can retain and process information from much more nuanced language as...
fair enough
somber prism
hmm ok leave it, so your conclusion is it depends on the data
 scarlet mesa
Has anyone had luck extracting SVG images from PDFs? I have been using PYMUPDF but only able to grab the flat images. I have a test PDF if that is helpful.
 granite karma
Is there a way to draw and save burndown charts in python?
serene scaffold
granite karma
Is there a way to draw and save burndown charts in python?
matplotlib maybe? what is a burndown chart?
granite karma
serene scaffold
matplotlib maybe? what is a burndown chart?
Atlassian
The go-to-guide for burndown charts in Jira Software. Learn how to monitor epics and sprints with burndown charts.
granite karma
serene scaffold
matplotlib maybe? what is a burndown chart?

A burn down chart is a graphical representation of work left to do versus time. The outstanding work (or backlog) is often on the vertical axis, with time along the horizontal. Burn down charts are a run chart of outstanding work. It is useful for predicting when all of the work will be completed. It is often used in agile software development ...
somber prism
guys if there are missing values for a int ot float type of features , we'll either use mean or median depending on the dataset but what if the feature is an object ?? do we have to use mode ( most occurring values ) or drop ?
lapis sequoia
Hello everyone can i find a help here?
undone flare
somber prism
guys if there are missing values for a int ot float type of features , we'll eit...
is your dataset large?
undone flare
lapis sequoia
Hello everyone can i find a help here?
Check out #❓|how-to-get-help or use any of the topic help channels if the question fit into one
somber prism
undone flare
is your dataset large?
No I am not working with any dataset Rn , I was just curious
grave breach
somber prism
guys if there are missing values for a int ot float type of features , we'll eit...
you can use technique to reconstruct the missing values
undone flare
somber prism
No I am not working with any dataset Rn , I was just curious
If the data is fairly large I would just drop them (well not in some cases) but otherwise have to use some technique
serene scaffold
lapis sequoia
Hello everyone can i find a help here?
Yes, you can get data science help here.
desert oar
somber prism
guys if there are missing values for a int ot float type of features , we'll eit...
you're thinking of this backwards. what actually is the data? use techniques that make sense for the data, not for whatever dtype the column happens to have
what is the data and what do you actually need/want to know about it?
if you're just trying to summarize a categorical feature, maybe you want a frequency table
somber prism
oohhh
 old grove
Lets Say i want to Test A person Has A Disease or Not .i.e
Null Hyp: A Person Has A Disease
Alt Hyp: A person Has No disease
So For This case What Type of test can be used. Lets Say disease Colum is Categorical as yes/No or 1/0 and only single Colum Disease is our lookout
Any Idea What type of Statistical test can be used ?
 sudden canyon
wouldn't the null hypothesis be no disease? 🤔
eager imp
is it possible to use multiple channels as input to a 1D cnn in keras?
i have 1D data, but multiple channels, so using a Conv2D doesn't sound like it'd fit
i could concatenate the channels to make a single big array, but that doesn't feel right
 tidal bough
eager imp
is it possible to use multiple channels as input to a 1D cnn in keras?
tidal bough
eager imp
is it possible to use multiple channels as input to a 1D cnn in keras?
Conv1D with input_shape of (input_len,channel_count) seems like it should work
eager imp
hm.. let's see
 polar dock
Hi hi,
Are there design patterns or recipes y'all find yourself coming back to regularly while doing data science?
I'm converting some thousand line SAS scripts into python. Often times the modules end up looking like:
def main():
    df = run_query_for_data()
    df = perform_first_transformation(df)
    df = perform_second_transformation(df)
    df = perform_third_transformation(df)

    return df
I feel this approach ends up being too tightly coupled. I've had SAS scripts that are doing dozens of transformations on the data. This results in having the main function be nothing but a list of functions that gets acted on in order.
I was wondering if there was any design pattern I could research to help simplify that
unborn glacier
Stick them all in a transformations() function?
eager imp
sticking them all in one function doesn't sound reasonable, i'd rather use TDD and call them as a pipeline
then have tests for each function to make sure everything works
 exotic maple
old grove
Lets Say i want to Test A person Has A Disease or Not .i.e
Null Hyp: A Person H...
exotic maple
old grove
Lets Say i want to Test A person Has A Disease or Not .i.e
Null Hyp: A Person H...
I mean, if I understand this correctly you dont need a statistical tests. Statistical test or hypothesis tests are normally done for aggregates.
What you normally with classification like that is process a confusion matrix and evaluate your TP/FP/TN/FN rates and other KPIs as needed
there are other things like binary cross entropy, but again, it's all for aggregates
serene scaffold
polar dock
I'm converting some thousand line SAS scripts into python. Often times the modul...
The only problem I see with this is that you're returning a dataframe from the main function. Usually one doesn't use main functions in this way.
def some_func():
    df = query()
    for func in [first, second, third]:
        df = func(df)
    return df
You could also write it like this, as functions are objects.
old grove
exotic maple
I mean, if I understand this correctly you dont need a statistical tests. Statis...
yes statistical test... as its of to answer yes and no questions, So what test can be used ?
chilly geyser
sudden canyon
wouldn't the null hypothesis be no disease? 🤔
Null hypothesis can be whatever experiment setter wants it to be... but yes, odd choice
chilly geyser
exotic maple
I mean, if I understand this correctly you dont need a statistical tests. Statis...
It's certainly possible to create a decision boundary based on data
short heart
is
for i in range(5):
    print(f'epoch{i}')
    model.fit(train_dataset,epochs=1,validation_data=valid_dataset)
    model.save(f'/kaggle/working/model{i}.h5')```
the same as
model.fit(train_dataset,epochs=5,validation_data=valid_dataset)```
 rancid widget
so I was trying to plot a learning curve for random forest classifier . The code ran but the graph is empty. Can anyone tell me why would this be happening

It appears like this
serene scaffold
rancid widget
would probably need to see what x_train and y_train are and where they were defined
Question about how to add graphics and move them around a matplotlib plot, if anyone knows: #help-cupcake message
lapis sequoia
Where do I learn data science?