#data-science-and-ml
1 messages · Page 305 of 1
 rotund dagger


im also not sure how continuesly prompt for a book. i think i would have something to do with creating a main and having it loop the enitre program until exit is typed, but when i try to use def main(): it gives me an EOF parsing error. not sure if that is becuase i am using jupyter notebook. this assignment is due tonight at midnight, and i have been trying to solve it for a few days. if anyone could possibly assist with one on one time i would much appreciate it.
 glad mulch
most of the eof parsing errors ive had are just missing a bracket
do u have your main code?
rotund dagger
glad mulch
most of the eof parsing errors ive had are just missing a bracket
the images is the gist of the main code
rotund dagger
its kind of a 3 part question/error lol
glad mulch
well most wont go 1 on 1
but ya never know
just ask your specific questions and maybe someone can help
rotund dagger
i figured it was a long shot.
question 1: how do i get my program to loop until the user types 'exit' as an input.
question2: how do i get my model to display which author (as a string) it thinks wrote the input book.
glad mulch
question 1: use a while loop
rotund dagger
while true:
run program
if input == exit
dont run program
glad mulch
yeah
or
while input != exit:
run program
question 2 depends on what your model returns
rotund dagger
so pseudo the program is this:
read in 12 .txt files
store each .txt file as its own string
store each string in a list
booklist = [book1 , book 2, book3, ect]

count vectorize booklist
tfdif booklist
then :
as user to input a .txt file name
read in .txt and store it as a string
predict author using:
multinomial naive bays
svm
algorithm3
algorthim4
glad mulch
well what im trying to say is what does your model return currently?
if i chose bays prediction
what does that currently output

 robust charm
Does anyone know an easier way to let me use my GPU for training? Too many steps 😫
 sour mango
yea that does work as well thanks
 stiff barn
robust charm
Does anyone know an easier way to let me use my GPU for training? Too many steps...
stiff barn
robust charm
Does anyone know an easier way to let me use my GPU for training? Too many steps...
AMD or Nvidia?
robust charm
stiff barn
AMD or Nvidia?
Nvidia
stiff barn
robust charm
Nvidia
You could install Linux and use the Nvidia docker containers. Should be plenty if guides and generally easier overall.
robust charm
stiff barn
You could install Linux and use the Nvidia docker containers. Should be plenty i...
That sounds like a hustle as well. Im not good with that type of stuff.
I've forgotten how many stuff i've downloaded now
stiff barn
robust charm
That sounds like a hustle as well. Im not good with that type of stuff.
Try google colab then or a cloud based solution. Google cloud gives out free credits to start. Those will have everything already setup
robust charm
stiff barn
Try google colab then or a cloud based solution. Google cloud gives out free cre...
😂 all ready done that. It kept crashing so I switched to pycharm
but now its really slow so I need to use the GPU
 grave frost
robust charm
😂 all ready done that. It kept crashing so I switched to pycharm
grave frost
robust charm
😂 all ready done that. It kept crashing so I switched to pycharm
its literally one line to install CUDA, TF and Keras lolol
install anaconda (just like clicking an .exe)
go to command prompt and type conda install -c anaconda tensorflow-gpu
and that's it
 dapper halo
Just a general question. For regression problems, is it important to have all features scaled within the same range? And if they are not scaled to the same range what would this mean for how the network interprets it later downstream?
And following that. Is it more ideal to have a "flatter" scaled curve? I imagine this would allow the network to differentiate between values more easily. So just off of shape, would the red curve be more ideal than the blue?

 exotic maple
dapper halo
Just a general question. For regression problems, is it important to have all fe...
exotic maple
dapper halo
Just a general question. For regression problems, is it important to have all fe...
Its important in the sense that most ML algos work better in ranges from 0 to 1, or so.
I normally do this (even when it has nothing to do eith ML)
Find descripte stats
"Observe data distribution"
Find outliers
Manage outliers
Then "normalize" data
Regression (ridge, lasso, etc) should really work fine even without scaling as long as the data is lineal.
But some preprocessing is needed to clean it up
dapper halo
exotic maple
Regression (ridge, lasso, etc) should really work fine even without scaling as l...
I more meant after the scaling happens. Depending on the initial range (of nonscaled) the domain of the scaled data will be different. Is there any reason to try to align all of the scaled data to exist with the same bounds? So for the above plot...if you take off the chunk at 0 (which is false data I have injected into the set) there is a clear difference between the N_CII (top panel) which ranges from ~.3 : 1 and ZnII (bottom) continuous over entire range.
I dunno if I can get away with not scaling the data.
exotic maple
dapper halo
I more meant after the scaling happens. Depending on the initial range (of nonsc...
I think that's somehwat difficult to answer without seeing the data and its context lol
also it depénds.
is the data bounded in reality? or are you trying to bound it for convenience? its not the same.
 lapis sequoia
i know it is pre trained, but ive seen you give a picture to it and the label, and following picture of that label will be predicted correctly
dapper halo
They are definitely bounded in reality. Looking at metals in intergalactic/galactic absorbers. So elements like Silicon should definitely be more prevalent and have a wider range than say Zinc or Iron. @exotic maple
 velvet thorn
exotic maple
Regression (ridge, lasso, etc) should really work fine even without scaling as l...
velvet thorn
exotic maple
Regression (ridge, lasso, etc) should really work fine even without scaling as l...
why do you say that?
grave frost
lapis sequoia
i know it is pre trained, but ive seen you give a picture to it and the label, a...
yes, so you want to make something like that? it will take 2-3 years with a cluster of 50 GPUs and about a million $ in development
velvet thorn
specifically this
Regression (ridge, lasso, etc) should really work fine even without scaling as long as the data is lineal.
exotic maple
velvet thorn
why do you say that?
I havent documented myself about other regression methods, but "standard" lineal regressions shouldnt have a problem with multiple variables and different values as long as they are lineal and not highly correlated no? in the form -> y = a + bx + bz + bp.... etc
velvet thorn
exotic maple
I havent documented myself about other regression methods, but "standard" lineal...
any method that uses some form of distance metric is going to depend on the scale of the variables
so non-regularised regression will be fine
but e.g. ridge will not
stiff barn
grave frost
install anaconda (just like clicking an .exe)
As far as I know anaconda uses some pretty old cuda versions which may not support newer GPUs. I had to go through more hoops to get cuda 11.2 for my 3090 this time. If you have a 10 series or older Conda should work fine
exotic maple
velvet thorn
but e.g. ridge will not
now that you mention that, i think Lasso WOULD have a problem
velvet thorn
exotic maple
now that you mention that, i think Lasso WOULD have a problem
yes, because it uses a distance metric
exotic maple
too low coefficients would render it null
velvet thorn
the L1 norm
exotic maple
yeah
velvet thorn
exotic maple
too low coefficients would render it null
what do you mean by that
grave frost
stiff barn
As far as I know anaconda uses some pretty old cuda versions which may not suppo...
doesn't make any point upgrading packages for a GPU that only like 10 people in the world posess
exotic maple
velvet thorn
what do you mean by that
Lasso has a threshold below which it sets coefficients to 0 no?
velvet thorn
exotic maple
Lasso has a threshold below which it sets coefficients to 0 no?
no...
that's not how it works...
exotic maple
ok let me check because im sure it does
stiff barn
grave frost
doesn't make any point upgrading packages for a GPU that only like 10 people in ...
2000 series as well. Cuda 9.2 is pretty old
velvet thorn
exotic maple
ok let me check because im sure it does
it can perform feature selection
grave frost
stiff barn
2000 series as well. Cuda 9.2 is pretty old
its not...CUDA 9.2
velvet thorn
by zeroing out some coefficients
grave frost
its def 10
velvet thorn
it's not like "if this would be below 0.01 it'll get clipped to 0"
that's fundamentally not correct
stiff barn
grave frost
its def 10
Unless their docs are wrong https://docs.anaconda.com/anaconda/user-guide/tasks/gpu-packages/
exotic maple
velvet thorn
it's not like "if this would be below 0.01 it'll get clipped to 0"
I stand corrected.
I expressed myself incorrectly
 grave frost
Well, that is certainly interesting. I personally got 10.2 for my 1050ti
lemme dig some more
grave frost
@stiff barn here, TF 2.4 with CUDA 11 https://towardsdatascience.com/install-tensorflow-with-cuda-cudnn-and-gpu-support-in-4-easy-steps-954f176daac3 🤷 🤷
are the docs old or smthing?
stiff barn
grave frost
<@!247847269267800074> here, TF 2.4 with CUDA 11 https://towardsdatascience.com/...
Yeah probably. It could be a newish update or something.
@robust charm take a look at that above
dapper halo
Also, whenever I use minmax, the val_loss is always offset by a fairly stable constant relative to loss. Any ideas why that may be?
stiff barn
That should help you if you have a newer GPU and that’s your problem
exotic maple
velvet thorn
and do you know *why*?
Unfortunately i dont remember. I know the differences in their cost function (L2 and L1), but why, i dont know
dapper halo
I keep reading L1 and L2 as lagrange points
velvet thorn
exotic maple
Unfortunately i dont remember. I know the differences in their cost function (L2...
it would be a good thing to find out 😉
exotic maple

im seeiing that explanation
which relates it to the derivative
I found the explanation here very good @velvet thorn https://stats.stackexchange.com/questions/176599/why-will-ridge-regression-not-shrink-some-coefficients-to-zero-like-lasso

Cross Validated
When explaining LASSO regression, the diagram of a diamond and circle is often used. It is said that because the shape of the constraint in LASSO is a diamond, the least squares solution obtained m...
last post
I can't explain it better than the math of the bottom answer :p
exotic maple
velvet thorn
it would be a good thing to find out 😉
thanks for the correction 🙂 I understand it a lot more now! I think I have some intuition about it now.
Lasso would definitely need some normalization lol
exotic maple
dapper halo
I keep reading L1 and L2 as lagrange points
another space enthusiast? lol
Yeah I still get confused occasionally with those haha
exotic maple
dapper halo
They are definitely bounded in reality. Looking at metals in intergalactic/galac...
https://towardsdatascience.com/regularization-in-machine-learning-76441ddcf99a This articles answer your question in detail, and also gave me light about what @velvet thorn mentioned.
althought i still prefer the math of the stats exchange post
easier to "see"
 inland sky
How to install pytorch and cuda without a GPU on a mac?
dapper halo
exotic maple
another space enthusiast? lol
Its my job currently, so not much I can do about it on that end haha. But also not denying it haha. I appreciate the article though!!
lapis sequoia
how to create a conscious AI?
 lean ledge
Step 1, steal the mind stone
 stark sapphire
lean ledge
Step 1, steal the mind stone
stark sapphire
lean ledge
Step 1, steal the mind stone

 iron basalt
Step 2, ???
 sacred solstice
lapis sequoia
how to create a conscious AI?
sacred solstice
lapis sequoia
how to create a conscious AI?
Create a code to make the AI learn what it sees.
You should give it tons of data to learn from. (From the most basic to the most complex, like whether a person is sitting or standing to finding what he/she would be thinking)
More data more better AI
 soft salmon
(neural networks)
i have this basic basic code, with multiple inputs and multiple outputs. It doesn't use any libraries.
The net error loss even after 100k iterations is still barely decreasing. I don't know why
https://github.com/ZerothVector/BasicLearning/blob/main/nn2-with-issue.py
The problem is net loss decreases very slowly even after 100k iterations.
I tried decreasing the learning rate to 0.00001. doesn't seem to do much of a change.
I don't know why this happens?

GitHub
Contribute to ZerothVector/BasicLearning development by creating an account on GitHub.
 short bronze
can anyone help me wrap my head around einsums?
np.einsum('ik,kj->kij', np.exp(A), B)
What does this do exactly in "normal" np functions?
i don't understand what K being repeated actually does
 pine wolf
short bronze
can anyone help me wrap my head around einsums?
`np.einsum('ik,kj->kij', np.exp(...
pine wolf
short bronze
can anyone help me wrap my head around einsums?
`np.einsum('ik,kj->kij', np.exp(...
in this case, the corresponding row/column in the input arrays are going to be dotted
short bronze
i thought they are only dotted if they do not appear on the right of the ->
like im trying to figure out "how" i would do this without einsum
i saw examples of for loops online but that usually didn't include 2 -> 3 variable einsums
 fleet cliff
Anybody have experience with petastorm?
If I want to use sharding with petastorm. Is it correctly understood that I need to create a reader(call make_reader() or make_batch_reader()) for each shard I want?
pine wolf
short bronze
i saw examples of for loops online but that usually didn't include 2 -> 3 variab...
you're right this is a weird one, you can see how the extra dimensions are formed here though, hopefully:
In [21]: a
Out[21]:
array([[ 0,  1,  2,  3],
       [ 4,  5,  6,  7],
       [ 8,  9, 10, 11],
       [12, 13, 14, 15]])

In [22]: np.einsum('ik,kj->kij', a, a)
Out[22]:
array([[[  0,   0,   0,   0],
        [  0,   4,   8,  12],
        [  0,   8,  16,  24],
        [  0,  12,  24,  36]],

       [[  4,   5,   6,   7],
        [ 20,  25,  30,  35],
        [ 36,  45,  54,  63],
        [ 52,  65,  78,  91]],

       [[ 16,  18,  20,  22],
        [ 48,  54,  60,  66],
        [ 80,  90, 100, 110],
        [112, 126, 140, 154]],

       [[ 36,  39,  42,  45],
        [ 84,  91,  98, 105],
        [132, 143, 154, 165],
        [180, 195, 210, 225]]])

In [23]: a[0], a[:, 0]
Out[23]: (array([0, 1, 2, 3]), array([ 0,  4,  8, 12]))

In [24]: a[1], a[:, 1]
Out[24]: (array([4, 5, 6, 7]), array([ 1,  5,  9, 13]))

In [25]: a[2], a[:, 2]
Out[25]: (array([ 8,  9, 10, 11]), array([ 2,  6, 10, 14]))
yes it's weird because without k it would just be matrix multiplication right?
pine wolf
yeah
short bronze
do you know what this would look like in terms of regular (non einsum) functions?
it's easier for me to reason about
why do you output In [23]: a[0], a[:, 0]
like i don't really understand where each element in the resulting matrix comes from
pine wolf
(array([0, 1, 2, 3]), array([ 0, 4, 8, 12])) if you multiply each element of the first array with the entire 2nd array, and concat you'd get the first level
short bronze
ohhh
pine wolf
In [27]: 0 * col0
Out[27]: array([0, 0, 0, 0])

In [28]: 1 * col0
Out[28]: array([ 0,  4,  8, 12])

In [29]: 2 * col0
Out[29]: array([ 0,  8, 16, 24])

In [30]: 3 * col0
Out[30]: array([ 0, 12, 24, 36])
and those are the columns of the first level
similar for the other levels, with the arrays i printed
short bronze
so each element in the first matrix multiplies an entire column in the second?
hmmm
short bronze
ahh i see
wait is this even possible with regular np?
from what i see matmul don't work
pine wolf
i can do it with a bunch of concats
i don't know a clean way to do it, there may be one
short bronze
this is really weird i see someone use this
pine wolf
i've only used einsums to do internal dot products
so this is a weird use, but a neat one
short bronze
np.sum(np.einsum('ik,kj->kij', a, a), axis=0)
is there like an intuitive meaning to this?
pine wolf
probably, but i don't know it
short bronze
darn ok
pine wolf
a while back i stumbled on a long post about einsums, maybe i can find it
short bronze
thanks that'd be every useful
pine wolf
i'm not sure this was it, but it looks well-done in any case https://rockt.github.io/2018/04/30/einsum
oh, this was it https://rajatvd.github.io/Factor-Graphs/
The factor graph is a beautiful tool for visualizating complex matrix operations and understanding tensor networks, as well as proving seemingly complicated properties through simple visual proofs.
this is a nice way to try to visualize everything

 lunar bane
Hey! Is there anyone who has done Andrew Ng's ML course or Google ML Crash Course? If yes, I wanna know that what approach does both of these course uses, Top-Down or Bottom-Up.
 rough otter
quick question what are the cases in which removing outliers will benefit the model?
 uncut kindle
@rough otter some models are sensitive to outliers. For instance, regression, gaussian and naive bayes. You could say the presence of outliers poison the model
For tree based models outliers are not an issue
rough otter
ah okay tysm
 modern vine
Hello there!
How can I compare the similarity between two words using nltk?
Example: "Pregao Eletronico" and "Pregão Eletrônico"
uncut kindle
Levinshtein distance would do
Altho you might want to clean the strings first. Eg. Remove space
modern vine
Levinsthtein is this method?
nltk.edit_distance()
Ok, thanks :)!
grave frost
modern vine
How can I compare the similarity between two words using nltk?
vectorize then euclidean
exotic maple
grave frost
vectorize then euclidean
How would you get Euclidean distance of words? 🤔
Isnt Jaccard a preferable metric for NLP?
grave frost
exotic maple
How would you get Euclidean distance of words? 🤔
Isnt Jaccard a preferable met...
ED of vectors, not words
exotic maple
grave frost
ED of vectors, not words
Yeah I know. I just cant mentalize it. Every word is a dimension in CountVect and its value its Count, no?
Do you mean distance as sqrt(w12 + w22)?
grave frost

In mathematics, the Euclidean distance between two points in Euclidean space is the length of a line segment between the two points.
It can be calculated from the Cartesian coordinates of the points using the Pythagorean theorem, therefore occasionally being called the Pythagorean distance. These names come from the ancient Greek mathematicians ...
 ancient frost
modern vine
Example: "Pregao Eletronico" and "Pregão Eletrônico"
ancient frost
modern vine
Example: "Pregao Eletronico" and "Pregão Eletrônico"
check out the fuzzywuzzy library
https://github.com/seatgeek/fuzzywuzzy

GitHub
Fuzzy String Matching in Python. Contribute to seatgeek/fuzzywuzzy development by creating an account on GitHub.
modern vine
ancient frost
check out the fuzzywuzzy library
https://github.com/seatgeek/fuzzywuzzy
This is perfect, thanks
ancient frost
modern vine
This is perfect, thanks
No problem 🙂
 inland isle
what are the best resources to learn to ML algos?
 surreal girder
YouTube?
ancient frost
inland isle
what are the best resources to learn to ML algos?
Depends where you are starting from. I quite like https://www.youtube.com/channel/UCZHmQk67mSJgfCCTn7xBfew videos

YouTube
I make videos about machine learning research papers, programming, and issues of the AI community, and the broader impact of AI in society.
Twitter: https://twitter.com/ykilcher
Discord: https://discord.gg/4H8xxDF
BitChute: https://www.bitchute.com/channel/yannic-kilcher
Parler: https://parler.com/profile/YannicKilcher
LinkedIn: https://www.lin...
If just starting out I would recommend spending time on stats/probability first and ease into different models from there
This is probably the most canon book for AI, also http://aima.cs.berkeley.edu/
grave frost
ancient frost
Depends where you are starting from. I quite like https://www.youtube.com/channe...
WTF is this?
memes with ML????
ancient frost
Yeah, some of it is just for fun, but most of it is education. Most of his channel is just going over recent papers
grave frost

#memes #science #ai
Antonio and I critique the creme de la creme of Deep Learning memes.
Music:
Sunshower - LATASHÁ
Papov - Yung Logos
Sunny Days - Anno Domini Beats
Trinity - Jeremy Blake
More memes:
facebook.com/convolutionalmemes
Links:
YouTube: https://www.youtube.com/c/yannickilcher
Twitter: https://twitter.com/ykilcher
Discord: https:/...
ngl the second one got me tho
 willow quarry
hello
 vital basin
What would be a fun simple python AI to get started with?
 bronze skiff
inland isle
what are the best resources to learn to ML algos?
bronze skiff
inland isle
what are the best resources to learn to ML algos?
pick up a copy of bishop's "pattern matching and machine learning" and read it straight through, doing the exercises and following references
 heavy tundra
You can't really merge object detection models right?
Like if I have one model that can detect dogs and on that detects cats, you can't just put them together and detect both without retraining
It needs to train on images with both dogs and cats in them at the same time
ancient frost
You can use knowledge distillation, but that does involve retraining yes.
I'm trying to think of a type of model where there would be a clear way to do this and coming up blank- if you had an ensemble model like random forests you can just merge your forests somehow but that doesn't feel like true to the problem. It's probably possible for some models but I've never seen it done. Would make a paper I'd read
grave frost
hmmm...theoretically, if the architectures are same, then wouldn't a simple metric to merge weights work decently enough?
ancient frost
The most obvious problem with that (assuming this is a NN) is just that the output head is going to be binary for either, so you need to split that into two heads. Plus you're just mashing all the representations coming out of each layer together- which would most likely confuse layers downstream
It might not be a bad place to start transfer learning from
grave frost
ancient frost
It might not be a bad place to start transfer learning from
from which base model?
heavy tundra
I was trying to train a model with a large amount of classes with yolov5. I wanted to train it for the classes in groups of 5, and save the weights along the way
But when I added new sets of classes it would forget the old ones
grave frost
ancient frost
The most obvious problem with that (assuming this is a NN) is just that the out...
you would have to re-learn the optimizer 🤷
heavy tundra
Because I imagine it needs to see examples of the old classes compared to the new ones
grave frost
no, Yolo5 was pre-trained on that specific domain that encompasses both your target classes, which is not the case with your model that is limited to one particular domain
ancient frost
You probably want to train on all of the classes you care about together. If you train on just a few of them the model has no incentive to not disrupt the accuracy of the other ones when training on your subset of 5
This is one of the reasons why people usually randomize their dataset ordering before batching- having many batches of just one class can cause some problems
heavy tundra
yeah I was doing 5 at a time because my resources are limited
ancient frost
When you say 5 at a time, is that like 5 per session of training, or 5 per batch?
heavy tundra
5 classes in the training dataset, so it could learn what those 5 look like before moving onto more
opposed to doing all classes at the same time
ancient frost
Are you loading the whole dataset into memory altogether? Larger models are usually trained such that only the current batch, and maybe a few batches in advance are loaded from disk and into memory at a time, then released after use. This way you can train on as much data as you can fit on your hard drive, so long as you can fit just a batch (and associated overhead) into volatile memory.
If you are using tf/keras for image classifcation this is usually the goto
https://www.tensorflow.org/api_docs/python/tf/keras/preprocessing/image/ImageDataGenerator
TensorFlow
Generate batches of tensor image data with real-time data augmentation.
But you can also write custom generators for tf/keras
I'm not as familiar with pytorch but I'm sure there's something equivalent
heavy tundra
yeah the problem was the size of the dataset because I wanted to make sure there was enough data for the number of classes
so I tried splitting the classes up for training
but next time I'll try using all the classes and smaller datasets for each training session
exotic maple
grave frost
https://en.wikipedia.org/wiki/Euclidean_distance
I know what Euclidean distance is lol. What mean is, can this work for word Vecotrs? pretty much all values ar e 0 in their columsn except their own counts
so you will end up with sqrt ( count12 + count22)
 frail flower
import requests
import pandas as pd
import numpy as np

raob_stations = requests.get("http://www.raob.com/assets/downloads/raob.stn.txt").text.splitlines()

new_stations = []
for station in raob_stations[10:]:
    new_stations.append([i.strip() for i in station.split(",")])
new_stations_header = ["WMO", "ICAO", "NAME", "LOC", "ELEVATION", "LAT", "HEMI_LAT", "LON", "HEMI_LON"]

df = pd.DataFrame(new_stations, columns=new_stations_header)
df.replace("----", np.nan, inplace=True)
Is what I have so far, the problem is that all of the LAT/LON values are positive, and I want the ones either South of the Equator or West of the Prime Meridian to be negative instead, so I don't need the N/S/E/W columns. Is there an easy way to do that?
The dataframe is fairly large, it is the set of all upper-air balloon stations on Earth.
output of df.head(n=10)

 wicked mantle
Is it be enough 100 labeled data and 25 for testing to classify object? This object actually have two states, i want to predict this states
wicked mantle
nah, i want to build my dataset and train model to it with CNN
willow quarry
i would recomend making nice spiders
wicked mantle
what is spiders?
wicked mantle
yeah
willow quarry
spiders are good for stealing data from HTML
frail flower
you could just use bs4 for that, no?
willow quarry
the is just load with some http some are able to navigate the entire site searching for data
bs4 never heard of
wicked mantle
parsing python lib
wicked mantle
willow quarry
the is just load with some http some are able to navigate the entire site search...
sooo, spider will search data alone? without any help?
willow quarry
if wel made year
sites like trivago uses sider in other hotel sites
very common pratice to build datalakes
willow quarry
frail flower
you could just use bs4 for that, no?
man i found bs4 is for beautiful soup that alone is ok but not enough for self navigation and all spiders use bs4 also
grave frost
exotic maple
I know what Euclidean distance is lol. What mean is, can this work for word Veco...
Why wouldn't it work then? euclidean distance will work regardless of sparsity
if a vector exists, it would still have a distance with other vectors, regardless of the magnitude
exotic maple
grave frost
Why wouldn't it work then? euclidean distance will work regardless of sparsity
I know you "can" but as a similarity measure i think its odd
what's it's advantage over lets say, Jaccard distance?
grave frost
you can use cosine similarity then 🤷
exotic maple
because with Jaccard to say "Awesome" and "awesomer" are "similar"
grave frost
I dunno about jaccard distance, but it seems to measure the similarity of elements in a set
exotic maple
If we go straight to vectors, yeah it doesnt
but i mean Words BEFORE converting to countvectorizer
grave frost
thats only for its statistical similarity rather than context based similarity
see, a word may be spelled similar (like vodka and voda) but it means different things in different contexts
first is wine, second is water. but with Jaccard, you would get a high coefficient
exotic maple
vector doesnt hold any context similarity meaning either (as far as I know=
the vector is literally just the count of the word in the corpus
grave frost
exotic maple
vector doesnt hold any context similarity meaning either (as far as I know=
yeah, you are right. not full context, rather it focuses more on meaning. however, model embeddings do preserve context
exotic maple
I'd have to read about model embeddings, but i'll trust your word there :p
grave frost

Medium
Dives into BERT word embeddings with step by step implementation details using PyTorch
just read the intro, rest is coding shit
velvet thorn
exotic maple
I know what Euclidean distance is lol. What mean is, can this work for word Veco...
it depends
on the process of vectorisation
bag of words counts is the simplest
preserving little semantic meaning
grave frost
velvet thorn
bag of words counts is the simplest
ancient ⚰️
 shut slate
Hey guys, quick question
how do you get it to show every year on the x axis instead of 5?
 exotic maple
shut slate
exotic maple
shut slate
lucky. I've been fighting with MPL for a while now lmao
and i just got that done on my side

!code
 arctic wedgeBOT
Here's how to format Python code on Discord:
```py
print('Hello world!')
```
These are backticks, not quotes. Check this out if you can't find the backtick key.
exotic maple
ax = plt.gca()
ax.set_xticks("lowerbound", "upperbound", "step"));
Ok thanks man. I will have dinner and try it out
exotic maple
velvet thorn
https://matplotlib.org/3.1.1/gallery/ticks_and_spines/tick-locators.html
that's... amazing. I love you

infinitely more beautiful omg. thanks @velvet thorn you know it all lol
this is the other part I want to do but holy crap MPL documentation aint the best guide...
velvet thorn
yw 👋
exotic maple
I'll probably spend all night trying to get the multicolor working lol
 upbeat basalt
i want to use cpu parallelisation to compare the costs of individual arrays and overwrite an array with the best ive seen so far. i dont really know what to do to synchronise:
from copy import copy
@njit(parallel=True)
def cpu_simulation(base_array):
  best_cost = sum(base_array)
  best_array = copy(base_array)
  for thread_ in prange(somelen):
    # do some mutation to basearray
    base_array[2] = random_number
    if sum(base_array) < best_cost:
       best_array = base_array
  return best_array
 kind lava
HELP
anyone here good with openCV / face recognition and stuff
 serene scaffold
kind lava
HELP
anyone here good with openCV / face recognition and stuff
serene scaffold
kind lava
HELP
anyone here good with openCV / face recognition and stuff
Go ahead and ask your question. I don't know about those technologies, but maybe someone else does.
dapper halo
So idk much about what well preprocessed data shapes SHOULD look like....I guess minmax is supposed to just kinda uniformly distribute the data between 0-1. I am injecting in a negative constant to train it for missing user input. My prof is apparently a big fan of minmax so it keeps coming back to using it......but this to me just looks like (especially with the injected no data mask) it is not going to produce good results.....am I wrong in thinking this? Data just seems too compressed.
Raw data more resemble slightly skewed gaussians
 lapis sequoia
Does anyone know how to grid an image and check which grid has the most white pixels with OpenCV-Python and Numpy

 tender hawk
Hello everyone! I made my very first Plotly.express program today (yay me). And I thought I would ask. Which library would you recommend for plotting 3d points in space from a csv. Imagine tracking satellite in the solar system. (IE: I want to visualize small objects in a solar system)
tender hawk
please feel free to "reply", DM, or ping me so i can see this in the morning! Thank you all for all the awesome help you've been thus far in my quest to learn python
serene scaffold
tender hawk
Hello everyone! I made my very first Plotly.express program today (yay me). An...
matplotlib is probably the most popular data visualization library.
though let me ask my astronomer friend
tender hawk
serene scaffold
though let me ask my astronomer friend
Thank you so much!
serene scaffold
tender hawk
Thank you so much!
he's working on his dissertation so it may be a while before he responds 😛
tender hawk
I know a few people doing that lol
My question may be way less complicated then what I tired explaining.
serene scaffold
matplotlib lets you plot points in 3D space. But there might be a way that better supports planets and stuff idk
tender hawk
I just want to create a 3d rendering of a "custom" solar system and be able to plot random coordinates that represent other items
and the system is based of x,y,z coordinates

This is what i managed to get in plotly
serene scaffold
in matplotlib, I think you have to provide points in 3D as a three-dimensional array
huh, that looks cool tbh
tender hawk
thanks 😛
I wish i could figure out how to do "real time" rendering
but i think i'll have to switch languages for that
serene scaffold
btw, my friend hasn't replied yet but he did tell me once that there's a library called astropy https://www.astropy.org/
Astropy. A Community Python Library for Astronomy.
I have no idea what it does
or if it's even remotely useful for what you want to do
tender hawk
i don't think its useful, but its wicked cool!
 late shell
hello, I'm a newbie to ML world and was recently studying about Decision Tree Regression. And if you actually understand the algorithm, you might know that the algo, for each node of the tree, iterates through all the values of all the features trying to find the split that decreases the SSR the most. At each iteration the algo considers only 2 points at a time, takes their average, makes the split at that average, and then makes predictions using that split and calculates the SSR. And then selects the split which decreases the SSR the most. I was wondering, does the number of observations considered at the time of a split (i.e. 2 right now) affect the model in any way. I believe its a trade-off between speed/time taken by model to train and accuracy of the model. So I wrote a notebook for testing it out whether this trade-off is significant enough to be considered. But I'm having 2 issues rn and I can't seem to proceed further. Would anyone mind looking at my notebook and help me out?
 kindred radish
Just using a simple OLS ML algorithm, one of the features is an order of magnitude larger than the other features. Would standardising the data allow for the model to train more easily?
serene scaffold
@tender hawk my friend said that astropy has some tools for making 2d plots, and in his opinion a combination of 2d plots is better than a 3d plot. Not sure why he feels that way--I'm not an astronomer
also the plotting tools in astropy are just a wrapper around matplotlib 😛
grave frost
kindred radish
Just using a simple OLS ML algorithm, one of the features is an order of magnitu...
as a rule of thumb, standardizing data works (and increases accuracy) in most cases
kindred radish
i thought so, I just wanted to make sure i wasn't talking out of my arse in my report! Thank you :)
 abstract zealot
kindred radish
i thought so, I just wanted to make sure i wasn't talking out of my arse in my r...
abstract zealot
kindred radish
i thought so, I just wanted to make sure i wasn't talking out of my arse in my r...
For OLS in simple linear regression, feature standardisation (0 mean and unit variance) does not affect your results. It does however drastically increase the interpretability of your data. I am unsure if it would decrease running times of your model however. (Note that if you utilise an algorithm that uses regularisation then feature standardising does affect your results)
grave frost
Sigproc guys, any recommendations to a SOTA note segmentation python lib? the one I found is like 3 years old
kindred radish
abstract zealot
For OLS in simple linear regression, feature standardisation (0 mean and unit va...
so it wouldn't create a more "accurate" model if you standardised it?
grave frost
kindred radish
so it wouldn't create a more "accurate" model if you standardised it?
it depends on your algorithm/model
for NN, you can't use without it
for NB, no need
and so on
 exotic robin
anyone knowledgeable on how to use Spacy and is willing to give a few moments of time?
 hollow sentinel
just ask the question
no need to preface it other than saying it's Spacy related
kindred radish
grave frost
for NN, you can't use without it
Sorry, NN and NB?
The model I'm using is basic af it's just an ordinary least squares regression model
 abstract shore
Hi I have a large astrophysics dataset (with missing values). I've been told to use an autoencoder and then use the autoencoder to carry out anomaly detection. I have five astrophysics features and I was wondering how I should get started with this.
exotic robin
how would i go about using the phrase matcher feature on a list of about 150,000 termed
terms
was also told to “serialize” and not sure what that is
grave frost
kindred radish
Sorry, NN and NB?
The model I'm using is basic af it's just an ordinary least s...
Neural Network and Naive Bayes
kindred radish
Oh! That makes sense then!
 merry wadi
What’s the best way to format results in a dataframe for a report?
 sharp hound
Anyone know how to shorten the output of a HuggingFace summarization using T5?
I'm a huge noob to this and can't figure out what the max_length parameter actually does
because it sure doesn't shorten the output
 split eagle
NLP question involving scispaCy and sklearn: I am working with medical text. I used one of the specialized scispaCy libraries (en_core_sci_sm) to recognize biomedical entities within the corpus. I am now trying to create a term-document matrix in which each column is an entity. I've used CountVectorizer without success--either the entities are split into individual words (e.g., "malignant melanoma" become "malignant" and "melanoma") or not recognized as words at all. I learned this when I tried 1) inputting multi-word entities unchanged and 2) inputting multi-word tokens with the words separated by underscores (e.g. "malignant_melanoma" and "diabetes_mellitus"), which were split into single words, or 3) by squishing the words in an entity together by removing the space (e.g. "malignantmelanoma") which CountVectorizer did not process because the words were unrecognizable. What advice do you have? Is there a way to modify CountVectorizer so that it can use the scispaCy library or preserve multiword entities? Is there another package you would recommend. Thanks.
split eagle
split eagle
**NLP question involving scispaCy and sklearn:** I am working with medical text....
I've adjusted the ngram variable in countvectorizer from (1,1) to (1,3) so that it can take it trigrams. This looks promising. If anyone has a better idea let me know.
 little compass
Hey there!
I made a video where I try to explain and implement the article "Growing neural cellular automata". It is a niche topic, however, I find it fascinating. My TLDR for those who are not familiar with this topic: Trying to learn simple rules using DL that give rise to complex structures. Hope some of you could find it interesting and helpful.
My video: https://youtu.be/21ACbWoF2Oo

In this video, I implement the Growing Neural Cellular Automata article. It is a biologically inspired deep learning pipeline that generates update rules that are applied to a grid of pixels. It uses heavily the convolution operation together with multiple other techniques - alive masking and stochastic update.
Implementation from the video: ht...
 normal sequoia
what do compute engineers o?
grave frost
normal sequoia
what do compute engineers o?
that's too broad of a question, nor is it related to AI. better luck #career-advice
 main fox
So I concatenated 2 dataframes, and have them both use a Date column as index. One of the dataframes is now displaying a timestamp after the date. How can I edit this columm to just display the date?
bronze skiff
little compass
Hey there!
I made a video where I try to explain and implement the article "Gro...
most things that people self-post here is hot trash
this is super cool however, thank you!
reminds me of "neural gas" models (part of this theme of self-organizing nets)
 visual umbra
whenever people ask about math for ai they say it's important for understanding how it works
is understanding how it works important for creating the machinelearning/ai?
main fox
visual umbra
whenever people ask about math for ai they say it's important for understanding ...
How are you gonna tell your model what you want, when you don't understand what math is relevant to solving your problem of interest?
Also, if your model gave you data, how are you going to interpret it?
visual umbra
main fox
How are you gonna tell your model what you want, when you don't understand what ...
oh arlight got it
 primal tulip
main fox
So I concatenated 2 dataframes, and have them both use a Date column as index. O...
primal tulip
main fox
So I concatenated 2 dataframes, and have them both use a Date column as index. O...
You can turn them into a pandas date object and call the method .dt.date I believe, just to call the date.
Yeah, just found the stack's post I read before.
@main fox
https://stackoverflow.com/questions/16176996/keep-only-date-part-when-using-pandas-to-datetime
main fox
primal tulip
You can turn them into a pandas date object and call the method .dt.date I belie...
Thanks
I managed to figure out what the problem was.
When using yfinance to get stock data and save it into a dataframe, by default it makes the Date column the index of that dataframe. Also, since it uses a groupby operation when creating the dataframe, the index becomes inaccessible. So I had to reset the index before doing the concatenation, and after concatenating I could do pd.to_datetime().dt.date
And set that column back as index
primal tulip
If you're grouping then you should read for Pietro Battiston's answer in the same post and use the
df['dates'].dt.floor('d')
main fox
I'll see if I can clean up my code doing it that way. Thank you for your reply
velvet thorn
bronze skiff
most things that people self-post here is hot trash
ouch
 azure cedar
troubleshooting my df problem before asking anything further thanks unpingable
merry wadi
Anyone have experience with Dash? I keep receiving this error when trying to start it up OSError: [Errno 49] Can't assign requested address
 reef perch
Hello, is there a way to value_counts() for column values that I already have made bins for? eg I have a bin for values < 3 and the total count. I want to create a stacked bar chart
 tranquil tendon
is any1 here familiar with probability and statistics
little compass
bronze skiff
most things that people self-post here is hot trash
Wow, I appreciate that!! I find the topic fascinating:)
 short inlet
 thick jolt
tranquil tendon
is any1 here familiar with probability and statistics
thick jolt
tranquil tendon
is any1 here familiar with probability and statistics
hi!! i'm in let's try!
 gaunt cloud
Can I ask neural network stuff here?
 tidal bough
yeah, machine learning is in the description among other things
gaunt cloud
Oh I didn’t see the description

I’m getting a number really small but I should be getting a 0,1
 velvet rover
Hello! I am looking for smaller datasets where I can perform some pre-processing, carry out exploratory analysis,
build and evaluate machine learning models. Any help is appreciated.
serene scaffold
velvet rover
Hello! I am looking for smaller datasets where I can perform some pre-processing...
Kaggle has datasets: https://www.kaggle.com/datasets
Download Open Datasets on 1000s of Projects + Share Projects on One Platform. Explore Popular Topics Like Government, Sports, Medicine, Fintech, Food, More. Flexible Data Ingestion.
lapis sequoia
gaunt cloud
you're probably predicting probability instead of predicting label.
A really small number denotes that the probability of it being class 1 is really small so its actually label 0
To convert prob to label you can do labels = (prob < 0.5).astype(np.int)
 candid sable
guys, what went wrong? I haven't touched R studio in a day and now when I try to run my script I get an encoding error
  attempt to use zero-length variable name```
Can't really find anything right now and my assignment is due in 1 hourare you using rmarkdown? the error should be pop up pretty much where the error exists
where does the error pop up
candid sable
no specific line
source('~/.active-rstudio-document', encoding = 'UTF-8', echo=TRUE)
bronze skiff
have you tried stack overflow?

Stack Overflow
When i generate a new rmarkdown file (or open existing rmarkdown-files) and try to run a rmarkdown chunk, i get this error: "Error: attempt to use zero-length variable name".
I have Win10 and did a...
 tacit fox
does anyone know how to import a keras trained ml model into opencv dnn?
primal tulip
gaunt cloud
https://paste.pythondiscord.com/uperolixaf.typescript
For some reason the web won't load. In the case the answer Yugen provided is not the solution I think you should still try to explain what your code should do and what's the expected output and the process you're trying to achieve, what have you tried to fix and whatnot. That'll help others reach the issue faster.
gaunt cloud
primal tulip
For some reason the web won't load. In the case the answer Yugen provided is not...
I'm trying to predict whether the review is good or bad(1/0) and the expected output should be either 1 or 0 but right now when I try to print the predicted value it gives me a really small number :/
 mystic lake
!paste
arctic wedgeBOT
Pasting large amounts of code
If your code is too long to fit in a codeblock in discord, you can paste your code here:
https://paste.pydis.com/
After pasting your code, save it by clicking the floppy disk icon in the top right, or by typing ctrl + S. After doing that, the URL should change. Copy the URL and post it here so others can see it.
 runic scroll
hi
im installing pytorch
with cuda 11.1
which is already installed in the system
so will it install again?
 ripe forge
No, as long as it's in the same environment and the version matches requirement. (you do use environments, right?... No? Well you should 😅)
runic scroll
thx
azure cedar
Is there any way to stop Pandas from exploding a dict of dicts into a MultiIndex table?
it's taking one of my nested dicts and assigning it to the index which misrepresents the data
 mental bay
 velvet thorn
azure cedar
Is there any way to stop Pandas from exploding a dict of dicts into a MultiIndex...
velvet thorn
azure cedar
Is there any way to stop Pandas from exploding a dict of dicts into a MultiIndex...
what do you expect the result to be
rough otter
when creating models is it a standard to always normalize the distribution of all the variables, and if not, in which cases would you normalize the distribution?
azure cedar
velvet thorn
what do you expect the result to be
the solution was to use orient='index' instead of columns
lapis sequoia
Hi guys. If i have a pre trained model, can i keep training it without losing all the knowledge achieved? like, it classifies classes, but soemtimes it fails
can i keep training making sure what he has learnt it remains?
velvet thorn
lapis sequoia
Hi guys. If i have a pre trained model, can i keep training it without losing al...
what model?
tranquil tendon
thick jolt
hi!! i'm in let's try!
So i need to perform simulations for a given probability question and compare the simulated result with the theoretical one
 velvet thorn
tranquil tendon
velvet thorn
tranquil tendon
do you know what type 1 and type 2 errors are
tranquil tendon
yea

 lapis sequoia
Hi, i am workind on sentiment anlaysis of financial news/reports/tweets . Iam building my embedding model so i was following few tutorials on Tensorflow. So I was preparing my data for word2vec where i was sampling postiive and negative skip-grams samples. But when i was fitting it to my dataset I didn t understand :
- when building sampling table , am i building it from whole dataset? because its based on zipfs law and when i have one word sentence i didn t see the point of doing probabilistic of frequent words on that type of sentences. Following tutorial they have static size of sampling table and also vocabulary
- which leads me to another question . Is vocabulary builded on one sentence( thats how i ve done it , how i ve understand it from tutorial, but now i not sure) or make vocabulary from whole dataset(thats where some logic hit me 😄 why would i want vocabulary for each sentence)?
I was following few steps from this tutorial https://www.tensorflow.org/tutorials/text/word2vec i would be very grateful i am a bit stuck and confused because it look like they were doin it on large texts , big corpus i have just one sentence for each row
primal tulip
 pulsar karma
Uh, would anyone know what the process/name of using the syntax "for i in Var:"
pulsar karma
Uh, would anyone know what the process/name of using the syntax "for i in Var:"
You mean a for loop?
https://en.wikipedia.org/wiki/For_loop
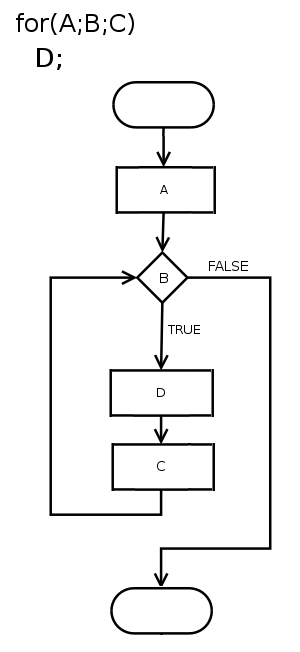
In computer science, a for-loop (or simply for loop) is a control flow statement for specifying iteration, which allows code to be executed repeatedly. Various keywords are used to specify this statement: descendants of ALGOL use "for", while descendants of Fortran use "do". There are other possibilities, for example COBOL which uses "PERFORM V...
pulsar karma
I don't really know lol. I just want to know the name of using the "for" and "in" syntax. For example:
for i in var:
print(i)
primal tulip
That's a for loop. You call it with that structure
for [iterator] in [iterables]:
[do something]
pulsar karma
oh, thank you so much!!
primal tulip
[iterables] would be a something that has a bunch of elements grouped in a sequence.
say for example, a python list of integers
int_list = [1,3,7,10]
[iterator] is an item on that list. You declare the variable name in the same for loop meaning that you don't have to declare it outside it, but you must use it at the [do something] part.
For example, if I want to add +2 to each element on that list and print the result, you could do something like
for n in [1,3,7,10]:
print(str(n + 2))
pulsar karma
oh wow, thanks. This helps alot. I'm going to write this down lol.
primal tulip
And welcome to programing @pulsar karma Things might get complicated from time to time, but keep going, keep revisiting what you're learning and most importantly get your hands dirty. Experiment with everything you're learning until it breaks (then you learn on how to look for the solution at stackoverflow) lol
pulsar karma
primal tulip
And welcome to programing <@!639688286675140618> Things might get complicated f...
xD
thanks, I'll do my best
:)
 random gorge
So, I'm currently learning ML for a project at my workplace, and I'm watching tutorials, reading docs and stuff. But there is a thing I don't quite understand as far as implementation goes.
Say, for example, I want to make an AI that classifies an investor as either bullish or bearish, based on his sells and buys during a period of time of two years.
So you'd have something like, 200 rows, across this guy's investing history, each with 12 columns (whether it was a buy or sell, the opening price of the stock on the day he bought/sold it, the closing price, the price he sold/bought it for, etc)
I don't exactly know how to express this in a way that isn't completely wrong or very confusing, but.
Can you actually have this? Where you'd pass many arrays of data as input to get a singular output at the end?
Or is there some sort of requirement that I flatten the data into a singular array that is then passed to the model to classify?
 shy geode
yes
1 sec

Tired of searching for your Uber?
Trying to get a better idea of who’s stealing your car park?
Just want an awesome Computer Vision project to try out using Python?
Well, ANPR might just be the perfect thing for your to try out! In this video we’ll go through a full blown walkthrough of performing Automatic Number Plate Recognition (ANPR) usi...
see the vid above, its very ez to understand
@median dove heres a full code
 slate anchor
will u plwese tell me about python pandas
primal tulip
slate anchor
will u plwese tell me about python pandas
It's a library to wrangle data. Based on numpy. What exactly do you want to know?
 charred umbra
Bruh right now I'm trying to build my own deep learning framework and it sucks
 desert oar
charred umbra
Bruh right now I'm trying to build my own deep learning framework and it sucks
desert oar
charred umbra
Bruh right now I'm trying to build my own deep learning framework and it sucks
maybe build it on top of something like jax?
something that will do autodiff and gpu stuff for you
 strong raven
Hi everyone
I scraped data from a forum about new cars and offers people get for them from dealerships. So the entries are like:"i got offered xx k for an xx brand xx model car from xx dealership." but because of this being a forum not all of them are in an order like this and not all of them contains information i want(most of them are trash). I want to see cars, their prices and the dealerships name on a table using the data i have. My question is which library or what kind of approach would be the best for this purpose?
grave frost
charred umbra
Bruh right now I'm trying to build my own deep learning framework and it sucks
the attempt itself is very admirable
charred umbra
Currently, I have built dense layer, activation functions, network to concatenate the layers, and confusion matrix
Forward and backpropagation are working perfectly, I just have to figure out how to properly calculate loss, and combine them into a single training function
Next, I'm looking to make convolution & pooling, then maybe an automatic bootstrap function; after that, I'll have to somehow make an optimization function
 languid steeple
Hi there, i have been using python in vscode for a while and now i am interested in using it for data science. Can someone please kindly explain what anaconda is and if it is necessary for me to install it since ive already been using python? Or do i just need jupyter notebook?
thick jolt
languid steeple
Hi there, i have been using python in vscode for a while and now i am interested...
Anaconda Is a toolbox for data science. It contains Jupiter. You can decide if you Want to install anaconda or just Jupiter on your computer
 dawn stone
#data-science-and-ml I am new to Python and data science. I am currently working on a project with linear regression modeling. My question is: should I perform my log transformations before or after I split the data into train/test? If so, how do I do that since the split has occurred? Also, since I will be encoding categorical data prior to the split, do I need to perform .groupby on certain column after the split?
languid steeple
thick jolt
Anaconda Is a toolbox for data science. It contains Jupiter. You can decide if y...
Oh i see. When i downloaded the python extension in VS code, it says that it comes with jupyter as well so that we dont have to download it
then would that mean that it is not necessary for me to install anaconda?
If i do, would there be some overlap or conflicts with my performance?
thick jolt
I don't Remember exactly but I think that you Need to install anaconda First. Than from there you can install Just Jupiter
thick jolt
languid steeple
If i do, would there be some overlap or conflicts with my performance?
I don't think that could be a problem
thick jolt
You're welcome
 tacit palm
Hello 🙂
I was wondering if you guys when doing text pre-processing
remove words (including those with smaller length) then perform stemming
or Stem first then remove words ( such as those with smaller length)
lapis sequoia
tacit palm
Hello 🙂
depends on what you are doing but basically you need to remove stopwords
grave frost
stop words first, stem later
 ivory dew
hello, i need help! for a bagging classifier would accuracy of 0.99 on training data be considered overfitting? accuracy on test data is 0.89
(still learning)
lapis sequoia
tacit palm
Hello 🙂
but if you are doing some project where context is important i do not recommend removing words with smaller length they might be important when you ll be working on dependency parsing/embedding/whatever you ll use after that because they might be a part of a phrase. Also the part with a stemming. if you are doing lemmatization ( i used library to do that) the word could be one of the stopwords so thats why you need to remove stopwords first and then doing lemmatization/stemming
ivory dew
(i am still learning lol)
tacit palm
lapis sequoia
but if you are doing some project where context is important i do not recommend ...
thank you for your advice i will probably have a look into the smaller length words in the contextual for analysis
azure cedar
does anyone know why pd.concat would suddenly drop one of your rows
i'm concatting a list of single line dataframes
and the list is 1 longer than the output DF
languid steeple
thick jolt
You're welcome
Hey there, im using the anaconda interpreter in vscode now! But i am a bit confused, do i still need to make a venv for my projects?
If anyone else can answer this too please feel free
Usually for non data science projects i make create a venv so that i can pip install modules
i'm not sure how to move forward once i've selected the anaconda interpreter
 earnest jolt
hello guys I'm making a psychologist chatbot and need dataset for it. All I found is data from couselchat.com and a large dataset from crisistextline.org which is unreachable for me because of their requirements. Can anyone find a dataset with conversations between psychologist and client or give a working way to get the one from crisistextline.org?
lapis sequoia
velvet thorn
what model?
inception or anyone
exotic maple
dawn stone
<#366673247892275221> I am new to Python and data science. I am currently workin...
NVM let me re-write this
Depending on what you intend or how to transform your data, you should do encoding or MOST transforms based ONLY on training data. Basically, (for something like OneHotEncoder or StandardScaler) you want to fit them to your training data.
Then, you transform your training data with the fit transformers (For example your numerical variables are all set in a range between -1 & 1, categorical variables through sparse columns, etc)
Later your train your model / ensemble with your transformed training set.
Finally, you transform your test set data and then perform your evaluation metrics.
At least those are the steps I've followed so far.
lapis sequoia
Hello Guys, I am having an issue while running a Dataflow Pipeline. I am declaring my options: parser.add_argument(
"--origin_path", help='origin_path. ex: gs://PROJECT/reception with our without "gs://"', default="gs://my-bucket", dest="origin_path", )
doing the same for blob name.
Then i want to :
p
| "Read file" >> beam.io.ReadFromText(f"{args.origin_path}/{args.blob_name}")```
but my dataflow is not overwinding that value and is always reading the file that I used to "compile" my template.
I can see the args values in the Dataflow monitoring and they are correct, so the dataflow is getting the info but not using it to read the file.
Any idea why? and or how to solve this?
Thank you!!! molten hamlet
I need help with NMF decomposition algorithm
how do you actually intialize H and W matrices? random? or from data_x and y ?
 twin mantle
Anyone with experience in PyTesseract?
kind lava
Hey, im trying to get face recognition to work, but am getting really low fps for some reason.
how do i show code its to large
too*
serene scaffold
kind lava
how do i show code its to large
!paste
arctic wedgeBOT
Pasting large amounts of code
If your code is too long to fit in a codeblock in discord, you can paste your code here:
https://paste.pydis.com/
After pasting your code, save it by clicking the floppy disk icon in the top right, or by typing ctrl + S. After doing that, the URL should change. Copy the URL and post it here so others can see it.
kind lava
when i run it its good fps until it detects a face
then it gets really bad
i also have a pretty powerful pc so im not sure whats happening
 astral path
anyone here used OpenAI Gym with custom environments before?
i'm trying to create a simple basketball simulation
 wide raven
hello
anyone have any good videos on backpropagation
i am soooooooooooooooooooooooooo confused on the equations happening
I am able to find derivatives using f(x, y, z) easily on my own. But when it comes to the chain rule, and translating it to code eveyrthing just starts to not make sense lol
 grave lily
velvet thorn
wide raven
I am able to find derivatives using f(x, y, z) easily on my own. But when it com...
grave lily
velvet thorn
wide raven
I am able to find derivatives using f(x, y, z) easily on my own. But when it com...
not really a video person but
feel free to ask specific questions if you have any
 astral pewter
wide raven
anyone have any good videos on backpropagation
astral pewter
wide raven
anyone have any good videos on backpropagation
Check out 3Blue1Brown's video
 ivory lake
hey, can someone help me figure out why my legend is only showing up with one label?

 thorn pollen
anyone knows whats the answer to this ?

if anyone could do this please dm me thanks!
velvet thorn
thorn pollen
anyone knows whats the answer to this ?
...that defo looks like homework
!rule 4
arctic wedgeBOT
4. This is an English-speaking server, so please speak English to the best of your ability.
arctic wedgeBOT
5. Do not provide or request help on projects that may break laws, breach terms of services, be considered malicious or inappropriate. Do not help with ongoing exams. Do not provide or request solutions for graded assignments, although general guidance is okay.
candid sable
y must have at least 2 data points```
the ml_data variable in question is a 400x2000 matrix, unsure how to proceed - anyone able to provide guidance? glass remnant
i am currently working on a project that calculates the similarity between certain keywords.
I am using custom data to calculate this, but not quite sure how to store the data (the data I pull from various news websites, contains title + body). This is the first time me working on bigger data, any suggestions?
Like do I separate the articles to sentences or use it as a whole?
tidal bough
@errant portal That looks really nice! You might want to correct that drop at the sides of the latitude though.
It's because the KDE calculation doesn't wrap around - it doesn't know that the data for -179 should also be counted as the data for 181.
I think you can fix that by manually wrapping your data around - as in:
- Extend your data to, say, a whole 720 degrees by duplicating the halves. That is, append to the end of the data the first half of the data, and to the beginning the second half. Something like
data_wrapped = np.concatenate([data[n//2:],data,data[:n//2]]). - Estimate the KDE for that
- Crop the KDE to the original part.
- Make sure to compare it to the one you've been getting before - hopefully, it should only majorly differ on the ends.
 errant portal
tidal bough
It's because the KDE calculation doesn't wrap around - it doesn't know that the ...
errant portal
tidal bough
It's because the KDE calculation doesn't wrap around - it doesn't know that the ...
Genius! I had considered that the KDE would be a little weird on the edges, that's an excellent fix, thank you again.
candid sable
candid sable
```Error in createDataPartition(ml_data$label, p = 0.7, list = FALSE) :
y mus...
anyone? I'm literally at my wit's end I don't get how it doesnt see data points
 dawn wing
candid sable
anyone? I'm literally at my wit's end I don't get how it doesnt see data points
dawn wing
candid sable
anyone? I'm literally at my wit's end I don't get how it doesnt see data points
maybe you can show more of your code, instead of only the error?
 carmine iron
Does anyone understand why I am getting
RuntimeWarning: invalid value encountered in double_scalars
r = np.array([-1.01994684 ,-0.59759477 ,-0.37829003])
x = np.product(1 + r) ** (1 / len(r)) - 1```negative number to a fractional power
errant portal
Yeah I think it's giving you a very very low near 0 value and it can't do math with it
It's essentially dividing by zero in the np.product
carmine iron
@tidal bough negative numbers can be raised to a fractional power
in this instance it is raising to (1/3)
so the cubed root
@errant portal thanks I believe so as well
tidal bough
carmine iron
<@!266216750876459008> negative numbers can be raised to a fractional power
mathematically, only to rational powers, and using floats, it's hard to quantify that
np.cbrt(np.product(1 + r)) works. Hmm, how'd you do that in the general case...
tidal bough
errant portal
It's essentially dividing by zero in the np.product
np.product(1 + r) is just -0.00499028733552394 here
nothing too low
errant portal
Oh neat, I'm not a math guy I shouldn't comment haha just speculation
tidal bough
np.cbrt(-0.00499028733552394) gives -0.17088680007841156, but
(-0.00499028733552394)**(1/3) gives a complex number when using Python floats, and an error when using numpy floats
errant portal
is this, the same operation?
 tidal bough
nah
errant portal
Ah then I fundamentally misunderstand, haha deal with bt, not me B )
tidal bough
first you take the product of the elements + 1, then you cuberoot it, then subtract 1
nth root of the product of n numbers is the geometric average
not sure what the subtractions/additions are about
carmine iron
@tidal bough thanks,I see whats happening. Is there a good way to prevent nan
didnt seem like rounding before the calc worked
carmine iron
len(r) will always be 3
tidal bough
oh, then just use np.cbrt
@carmine iron Actually, one simple solution is to remove the sign and reassign it later. So you can use a wrapper like:
def nth_root(num,n:int):
    if num<0:
        if n%2==0:
            raise ValueError("Even power root of a negative number")
        return -((-num)**(1/n))
    return num**(1/n)
and similarly for arrays
carmine iron
@tidal bough thanks, your solution is great
tidal bough
wait, I totally forgot about even roots
carmine iron
np.cbrt is probablly all i need
tidal bough
fixed
carmine iron
prior to this
r =np.array([np.product(1+x) -1 forx in np.split(r,len(r)/12)])
where r is a 6 X 6 matrix of floats
errant portal
tidal bough
I *think* you can fix that by manually wrapping your data around - as in:
1) Ext...
Playing with this a bit, I believe I'd need the "halves" that get appended to be increased by 180+ and decreased by 180, is there a way to just do that simple math to all the values in the array?
So that the furthest value is like -360 and 360
tidal bough
is there a way to just do that simple math to all the values in the array?
if it's a numpy array, as simple as doing that operation on the array
 shut valve
Hello Im having a very hard time just trying to load a keras model i trained in colab to my pycharm. i have tried saving the model as the folder a .h5 and a .hdf5
model = tf.keras.models.load_model('img_model.hdf5')
errant portal
tidal bough
make sure to only change the latitude column, though
Yeah I've got it seperated, so longitude gets the 360 and latitude is only the 180* still
kindred radish
I've got a few NaN values inside my regression model's training data. Unfortunately, I only have 20 elements (a pitiful amount I know), so removing them will mean getting rid of a decent chunk of my training data. Getting more data is impossible, would I be justified in replacing these NaN data with the mean?
errant portal
I think it depends on what you want to do with the data, I'm reading varying sources on the usefulness of Mean Imputation
There seems to be some other more useful options here: https://scikit-learn.org/stable/modules/impute.html
kindred radish
Aren't those detailing the method in replacing the NaNs, not what to replace them with?
Missing values can be imputed with a provided constant value, or using the statistics (mean, median or most frequent) of each column in which the missing values are located.
Ah i suppose for multivariate feature imputation it's a bit different
errant portal
That's the one I was looking at, there seems to be some debate if Mean Imputation is good maths - mostly that it'll throw off trends and underestimate standard error
kindred radish
Surely it depends on how many NaNs you have?
So, for example, I will have like 1 or 2 rows that have NaNs in them, with only 3 features
Deleting the row would destroy a sad chunk of my data
But i feel that i could be justified in just plopping the mean in and assuming it won't change how the model trains too drastically
errant portal
Yeah! I bet it would, I think pandas.DataFrame.fillna has a limit in it for that reason?
Also pandas.DataFrame.dropna has the thresh(old) argument
kindred radish
errant portal
Yeah! I bet it would, I think ``pandas.DataFrame.fillna`` has a ``limit`` in it ...
wait you think it would drastically change how the model trains?
errant portal
Oop, no I mean it would depend on the amount of non-values
kindred radish
ah right right
errant portal
Maybe worth a shot? Haha if the alternative is not training the model
kindred radish
There's probably some critical number, a threshold like you said, where the trade-off is not worth it
Well the model isn't training at all tbh, the data is garbage
Just my entire final year project at stake 🙂
errant portal
Yeah that's way beyond me, I'm sure there's a way to quantify it though, there normally is
kindred radish
I could probably do an experiment to find that out, where you increase the number of NaN data for some nicely correlated data and watch how it destroys the accuracy
errant portal
I think for machine learning though, it would come down to what the NaN values mean? And if a mean would be an appropriate substitute
Sort of a meta thing to the scenario
Like if it represented a failed experiment, a mean might not be appropriate but, a 0 might? Or something
kindred radish
Oh that's a good shout, i should ask where these NaN values have come from actually
thank you !
errant portal
Yeah! It's not my area of expertise but science is science haha, good luck
errant portal
I wonder why my KDE is so low on this graph?

Right hand that is
Compared to the actual data it's running on
 lapis sequoia
Hey there,
I wanted to ask what's the good algorithm for finding a meaning of a sentence for specific topic and see how much related it is in machine learning? I'm kind of new to this and trying to see what are the commonly used algorithms that is used for understanding a sentence and see how much related the sentence is to the topic that I choose.
I appreciate any help
shut valve
so the thing with ml is it makes its own mapping algorithm you can look into tf-idf term frequency–inverse document frequency for a less ml approach. what kinda documents are you working with?
does anyone know how to save and load models with keras that use experimental layers like image augmentation i cant load my model
 uncut orbit
lapis sequoia
Hey there,
I wanted to ask what's the good algorithm for finding a meaning of a ...
uncut orbit
lapis sequoia
Hey there,
I wanted to ask what's the good algorithm for finding a meaning of a ...
you can use nlp, but models im not really sure
grave frost
lapis sequoia
Hey there,
I wanted to ask what's the good algorithm for finding a meaning of a ...
seq2seq
kindred radish
So I wanted to prove to my supervisor how important large data sets are for ML, to do so I created this plot using make_regression() from sklearn.datasets with a noise value of 15:

This is what i would have expected to happen to the value of "score" as the number of data points increase:

But what I actually see is:

This fluctuation between 0 and 1. Why is this? I'm using my own algorithm, but it should be doing exactly the same sklearn's linearregression algorithm. Is this typical behavior? Why does this happen?
 short heart
I want to start a project with self recognizing AI. Where do I even start? Is there any research on this?
lapis sequoia
hey, so I made a line graph, why is it always straight? i want it to like kinda look like this:

it currently looks like this:

code:
    @commands.command()
    async def line(self, ctx, numbers: commands.Greedy[float]):
        fig = plt.figure()
        plt.plot(numbers, numbers, marker='o')
        buf = io.BytesIO()
        plt.grid(True)
        plt.savefig(buf)
        buf.seek(0)
        await ctx.send(file=discord.File(buf, 'thing.png'))
...because all your points happen to lie on the same line? 
And that in turn is hardly surprised, considering:
plt.plot(numbers, numbers, marker='o')
...you are plotting numbers against itself.
tidal bough
...plot what you want to plot, rather than this? Not sure what else I can say.
lapis sequoia
ok
kindred radish
Just so it doesn't get lost: #data-science-and-ml message
kindred radish
Yeah this is really stumping me, I'm sure my model is coded correctly...
grave frost
why does extra data in linear regression gurantee a large accuracy increase?
if you training sample is representative of the real-world test data, then more data wouldn't do much to help that
the only time you need more data is when you model is struggling to identify the relationship correctly.
if you want to prove, try using Neural Nets. then the resultant curve would be somewhat like that
kindred radish
hmmm i think it's because the data I have currently doesn't have enough for the model to properly learn a correlation. So I was trying to show that if it had more data it would eventually learn

I guess that explains the very first sharp jump from a negative score to a positive one then?

So perhaps this would be a better graph to show my supervisor, since the number of data points I have rn is around 30 (and the correlation won't be as good as with this dummy data, the noise level would be higher)
grave frost
kindred radish
this much data is absolutely fine - you can even randomly drop out points and it would still result in a decent fir
*fit
kindred radish
that data is dummy data i created to try and demonstrate this. The actual amount of values I have to work with from real data in total is 30
Which means my training data is tiny
wide raven
velvet thorn
not really a video person but
thank you! mind if i dm you? Or would you want me to ask here?
grave frost
kindred radish
Which means my training data is tiny
nope, not too bad
would work with 30 as long as the relationship is indeed linear
grave frost
astral path
anyone here used OpenAI Gym with custom environments before?
that's just another name for 'hell'
kindred radish
grave frost
nope, not too bad
From what I can see, it doesn't seem to work for my data despite the relationship being linear
grave frost
plot?
kindred radish
gimme a sec

So the line is different colours right? The blue is the testing data and the yellow is the training data
grave frost
how.....is that a linear relationship?
kindred radish
From the physics, the x axis is literally defined from the y axis
this is experimental data
so it should be a linear relationship
grave frost
if you were considering the first 2 points, then it would be fine. but seeing the rest - it def does not seem like that
grave frost
kindred radish
From the physics, the x axis is literally defined from the y axis
what formula?
kindred radish
It's just that the tensile strength is defined from the failure point
ie. the x is defined from the y
grave frost
nope. how is that linear?
kindred radish
this is experimental data, there's lots that can go wrong in an experiment
grave frost
alright, but from physics point of view - how is that linear?
kindred radish
Because in the theory it is like saying that:
Failure = some constant X strength
which is a linear relationship
kindred radish
I don't have a formula, it's more like a definition. I'll show you with a sketch one sec

So we have this material, it breaks at the top right of the curve. The failure extension is what i've called the "failure" in the graph before
The strength is defined as the value of stress, \sigma_0, that this failure occurs at
(i understand the x axis is strain and not length, the sketch showcases lots of physics at once, i'm just highlighting this part)
grave frost
very good. and tell me, is the breaking point always directly proportional to the stress applied? is there, say some other factor also?
kindred radish
There are nuances to the material that will change the amount of stress that it takes to break a material
So these nuances will vary between materials
In the case of the data i've got, it's all for one material
however one of those nuances could be the way in which the material is cut. Which is why I suspect that the data doesn't look as linear as it should, hence the "noise"
If i had a shit tonne of data though, that would probably end up smoothing out some of the noise
grave frost
are you aware of young's modulus?
grave frost
well, let me put this another way. does the material of the object remain same throughout the experiment? (along with the temperature)
kindred radish
yes
grave frost
well, any other factors? length, thickness? are they all constant?
kindred radish
uhhh temperature might not, no. Since some work will be done on the material. It shouldn't be a significant temp change
all are as constant as can be made
like to the point where I can assume theyre constant
grave frost
perfect. then can you tell me why for the same object you have different points of fracture?
kindred radish
kindred radish
however one of those nuances could be the way in which the material is cut. Whic...
it's this bit basically
the different samples have been cut from different parts of the base material
grave frost
kindred radish
however one of those nuances could be the way in which the material is cut. Whic...
as long as the required constants are not changed, it shouldn't matter
kindred radish
eh it's not like quite like that, this material is a film. So the edges of the film may have slightly different (weaker) properties to the centre of the film
grave frost
let me explain via analogy - if you have a wire and keep applying consecutive force, (1N, 5N, 10N ....) would the wire break everytime at the same force value?
(assuming the appropriate constants are respected)
kindred radish
about the same, you'd be limited by the precision of your equipment. But it would also depend on the composition of the wire as well
grave frost
well, then can you tell me why your y-axis is jumping aroung so much?
at a specific strength application, it should always break at that point - right?
kindred radish
could easily be due to the precision of the equipment
This graph doesn't have error bars, because the data i've been given hasn't got them
grave frost
I would rather think there is something fundamentally wrong with the experiment
kindred radish
having done plenty of experiments like this, plenty of shit goes wrong with experimental data hahaha
the frustrating thing is i wasn't the one who conducted the experiment, so i simply don't know
grave frost
you can try a Neural Network that might be able to map the noise too (the relation might be spurious tho, so watch out)
kindred radish
unfortunately i simply don't have the time hahaha it's a shame
Thank you for your help though, honestly you've helped me put things into words so that will all go into my report !!
 fiery cipher
Hello am making an algoritme for intrusion detection , I've been assigned to do it with K-means , am looking for an open source algorithme for k-means that I can modify (since this is my first time doing smth in machine learning ) am using the K NSL data,
And I would love to know if I can find the detailed k-means of the sklearn library anywhere
 inner estuary
Guys, i Just started my studies about data science, and i have a doubt If I should use the integranted jupyter notebook in vscode or should i use powerBI to provide the data visualization? Which of those frameworks will provide more tools and market possibilities for me? I want to be a data analist
bronze skiff
cough analist
if you're just talking visualization, learn tableau or something to make dashboards, that's better for a data analyst path
kind lava
Hey, I am trying to do face recognition with python using the face_recognition library from github.

GitHub
The world's simplest facial recognition api for Python and the command line - ageitgey/face_recognition
.
.
My problem is that the code works fine when not detecting a face, but when it does the fps drops to around 2.
 untold ingot
i think it's pretty normal to drop fps's, ptyhon is not really efficient to do this kind of stuff in real time
maybe try to use recognition every few frames
 sage locust
inner estuary
Guys, i Just started my studies about data science, and i have a doubt If I shou...
sage locust
inner estuary
Guys, i Just started my studies about data science, and i have a doubt If I shou...
When presenting your progress to other people in the data team it's okay to show them in the notebook, as you can interact with it live if it's necessary. However when creating a product that's goint to be used by "non-techy" people it is better to use Tableau, PowerBI or similar.
untold ingot
and you can also run it in colab so you'll be sure that's not issue with your pc
kind lava
@untold ingot im pretty sure the script already only does 2 frames per sec and my pc is pretty powerful so im sure its not the issue
untold ingot
but droping to 2 frames is really unusual
untold ingot
i could help more if you'd post your code in notebook
that's why i told you about colab
you could share it with others
untold ingot
colab works like venv
kind lava
Ok, ill try that if its better for you

ok ive made a new notebook
just paste the code now?
kind lava
in the code?
inner estuary
sage locust
When presenting your progress to other people in the data team it's okay to show...
Nice, and about the methods tô get the data, os easier getting data from a database within vscode working with jupyter or os easier with powerBI? Becausa i want to work since fetching the data untill show the data which im gonna work with after being reorganized and filtered
kind lava
nvm i got it
sage locust
inner estuary
Nice, and about the methods tô get the data, os easier getting data from a datab...
Ultimately it comes down to what you like the most. As for me I like python to read data and do the preprocessing, cleaning, all that stuff. You can then save the data in a convenient format -csv, xlsx or whatever- and use the cleaned data directly into your visualizations.
You can do all that in any BI tool, no problem, but I just find it to be more complicated.
untold ingot
inner estuary
Nice, and about the methods tô get the data, os easier getting data from a datab...
for me notebook is ultimate tool to showing your data to someone else
inner estuary
Big lets say i Will apply tô a job in a bank, and my competitors Also use the jupyter tô show the storytelling graphics. If I have the knowledge in BI, It Will be a great factor to Help me get the job or wont make almost any diference?
And thanks anyway for Help, i'm little Lost about what frameworks use to study
 sharp pollen
Would anyone have any recommendations for beginner/intermediate level data science projects? I would like to work on something outside of my classes that will further my knowledge of using python and allow me to get better.
sage locust
inner estuary
Big lets say i Will apply tô a job in a bank, and my competitors Also use the ju...
It depends on what the specific position is searching for. Do not overthink on frameworks or technologies, pick one and stick with it until you are confident. Try and build your portfolio.
jupyter, numpy, pandas and matplotlib are really good and will take you further than one might think.
untold ingot
sharp pollen
Would anyone have any recommendations for beginner/intermediate level data scien...
really fun projects to do is any work with geographical data
you can use for it geopandas/folium
for example you can get covid data and try to visualise it with folium
 main grail
Hello! I'm learning pytorch, not because of preference, just because I had to start from something. But I was wondering is there performance differences from two similar trained models in Tensorflow and pytorch? Perhaps someone could point me in the direction of an article or something, thx!
iron basalt
main grail
Hello! I'm learning pytorch, not because of preference, just because I had to st...
AFAIK there is no obvious answer to this, both end up calling the same (or similar) cuda code. Giving a fair comparison is near impossible as it would have to be done across many CPUs, GPUs, GPU driver versions, Pytorch versions, and Tensorflow versions. If there was an obvious difference in performance people would probably all be using one and not the other.
main grail
Thx, that was very clarifying. No obvious answer is an answer. Hehe. I read somewhere that pytorch was mostly for researchers because it had no good production deployment options, but I guess it's not the case anymore. I think they are used almost in the same proportion today.
iron basalt
main grail
Thx, that was very clarifying. No obvious answer is an answer. Hehe. I read some...
How easy it is to distribute the stuff is another thing separate from performance. Currently distributing software is harder and harder as operating systems and hardware gets more overly complex (for no real good reason IMO). But I can't imagine pytorch being significantly more difficult to use in production than tensorflow.
main grail
So, given the hardware, cuda version, etc., are fixed, the same for both frameworks, there is no obvious winner?
iron basalt
Yeah, though you will find as is typical, long essays on the internet about why their "side" is better.
main grail
iron basalt
How easy it is to distribute the stuff is another thing separate from performanc...
This was an article from 2017 I read, as I'm new to those frameworks I was thinking that if there was an obvious winner I would not waste time on the other.
bronze skiff
tbf... it isn't hard to switch if you end up dissatisfied, or a particular model isn't written in your framework of choice
iron basalt
This is also true ^
bronze skiff
just pick one and learn it
iron basalt
Both pytorch and tensorflow also just have tons of people using / working on it, so if something is not there, it probably will be there soon.
 dusk heart
hii anyone use virtual box?
anyone have any idea plz share how to connect net in virtual box
 bronze skiff
afaik, the only real difference is if you care about probabilistic programming (which you should)
main grail
bronze skiff
tbf... it isn't hard to switch if you end up dissatisfied, or a particular model...
I got that feeling.
bronze skiff
at which point they have wildly different design points
iron basalt
(may want to use a probabilistic programming language though, but idk if there any good ones yet TBH)
main grail
bronze skiff
afaik, the only real difference is if you care about probabilistic programming (...
Didn't reach that stage yet...
bronze skiff
iron basalt
(may want to use a probabilistic programming language though, but idk if there a...
only reason to use a standalone PPL is if you want to do infinite nonparametric models (dirichlet processes), afaik
and even so, a lot of research supports building DSLs for this (kiselov-chen, finally tagless, etc)
iron basalt
Idk, it's not just capabilities, but also how nice it's to work with it (the entire point of a programming language). But yeah, DSLs work fine too.
bronze skiff
shrug i've worked with anglican before and i've wanted to blow my brains out
iron basalt
I have not really found a good PPL yet.
bronze skiff
main grail
TF or torch?
i'm a pytorch guy, but that's mostly because of work preferences
bronze skiff
iron basalt
I have not really found a good PPL yet.
i suspect none exists yet
iron basalt
main grail
But you have a preference??
I prefer pytorch. Purely preference, would not be bothered if asked to use TF.
main grail
Thx for the time!
 whole charm
On Reddit, I believe there is a lot of hate for TF, and much more preference for pytorch, one of the main reason is "pytorch syntax is more pythonist", what are your thought and can you share it with me?
 austere swift
a lot of that stuff is with the comparison between tf 1 and pytorch
tf 2 is better, but I still prefer pytorch
i just find the syntax easier to use imo
theres also keras, which is easier than both
 hard hound
Well I can use keras better with tf so I like it more
grave frost
My preference is for TF - but that's mostly because a lot of stuff is already implemented and makes any project much easier with no headaches.
Even then, I have used PyTorch frameworks like fairseq and there aren't a whole lot of concepts that can't be transferred when debugging them.
if someone has an extremely in-depth understanding of the models they use, then its better for them to use Pytorch all the time
hard hound
@pulsar karma hey could you state the question in another cell
pulsar karma
cell?
hard hound
like chat cell
pulsar karma
?
hard hound
just state the question clearly now
pulsar karma
oh kk
So uh, is there a difference between the 2 identical codes?
like
i get an error on one the first identical one
but the second code, is fine.
so, i want to know if there is a difference and what I'm missing
hard hound
hey could you tell the error type
pulsar karma
uh wdym. Sorry, I'm a beginner lmao
hard hound
are you executing this in jupyter-lab?
pulsar karma
no
pulsar karma
I'm executing this line of code in dataquest's terminal. Its like a learning thing for data science
hard hound
The place where they show the output should display the error
pulsar karma
oh, yeah I'll grab it.
OK, it says there is an error and dthat error says that the N in Nums is an invalid syntax...
:|
hard hound
Hey try to think about it and try modifying the code and rerunning it (its the best way to learn)
pulsar karma
oh, ok thank you so much!
hard hound
I have experienced that ml workflow consist a big chunk of debugging
pulsar karma
oh wow. I'll look into that.
hard hound
and you forgot to close parenthesis in the line before
for i in data:
Var = float(i[1:]
Num = Num + Var
average = Num / 7123
for i in data:
Var = float(i[1:])
Num = Num + Var
average = Num / 7123
pulsar karma
ah yes, thanks for that.
hard hound
welcome
 young dock
Suppose I collect data from a population of 1000 gymgoers and determine how many of them take steroids. I then put all of them on some treatment protocol (maybe inform them on the harms of steroids), and after a month I collect data again on how many of them take steroids. I'm confused which hypothesis test I would use here.
It doesn't seem like it would be a large sample z test for 1 sample proportion, because I have two proportions and I want to compare them.
It also doesn't seem like it would be a large sample z test for a difference in proportions, because they aren't independent.
So what hypothesis test do I use?
This might be more stats than DS but I figured I would ask just in case
charred umbra
Aight so guys can one of you explain to me how update gradients in NNs work?
It would be great help
 crude fable
charred umbra
Aight so guys can one of you explain to me how update gradients in NNs work?
crude fable
charred umbra
Aight so guys can one of you explain to me how update gradients in NNs work?
you are implementing like the autograd mechanism in torch?
charred umbra
No as in I am building a deep learning framework for a regular feed forward NN from scratch in python
crude fable
well, then just figure out the math and write a backward function?
charred umbra
Yeah thing is, I dont really know the actual math behind it
Because the highest level of math education I have is 3/4 of high school trigonometry
crude fable
I think there're plenty of tutorials online, maybe just google it lol
charred umbra
Yeah, this type of stuff is sorta a pain when your math knowledge is limited
Good thing I still have like 2 years of HS to learn math left
 clear holly
ive been trying to find a way of turning "[[6,-5,-7,4,-4],[-9,3,-6,5,2],[-10,4,7,-6,3],[-8,9,-3,3,-7]]" into a np.array or even just a list
but every time i try to google it it shows me [['1','2','3'],...] to an array of ints
which is not what im looking for, so idk if anyone can help with this
exotic maple
young dock
Suppose I collect data from a population of 1000 gymgoers and determine how many...
Have you even defined a hypothesis there? Because I dont see it.
For example, you can do a hypothesis test for proportions. (% of people who use steroids vs your hypothesis)
crude fable
clear holly
ive been trying to find a way of turning `"[[6,-5,-7,4,-4],[-9,3,-6,5,2],[-10,4,...
just np.array([[6,-5,-7,4,-4],[-9,3,-6,5,2],[-10,4,7,-6,3],[-8,9,-3,3,-7]]) ?
clear holly
crude fable
just np.array([[6,-5,-7,4,-4],[-9,3,-6,5,2],[-10,4,7,-6,3],[-8,9,-3,3,-7]]) ?
the real string is very very long that comes from a file and it changes too fast to manually copy and paste into code
crude fable
I see
you can use eval
suppose getting the string in a variable str
eval(str) returns a list
clear holly
oh nice
grave frost
charred umbra
Yeah thing is, I dont really know the actual math behind it
hmm...then I suppose you haven't implemented backpropogation too?
clear holly
it works perfectly @crude fable ! thanks
crude fable
np~
grave frost
this seems to be a good referring point if you want to have a an idea on a toy problem https://machinelearningmastery.com/implement-backpropagation-algorithm-scratch-python/
(he also implements backprop too if you haven't done so)
velvet thorn
clear holly
it works perfectly <@!831854786496167967> ! thanks
use ast.literal_eval
eval is unsafe and should only be used if you really know what you’re doing IMO
tidal bough
For this task, one could even just use json.loads
crude fable
indeed, eval may lead to injection attacks
 jolly folio
Is this the right channel to ask pandas related questions?
trying to manipulate some sample data to better learn
tidal bough
It is
jolly folio
ok, bear with me, lol. Im trying to figure out how I can do some calculations over a data frame with groupby, but using my own function. So using apply(). Im working with stock market data just because its easy to play with, to try and learn. I have sample data that has multiple symbols, and then normal items like trade_date, close, volume. Using pandas i can easily do something like calculate a moving average via:
quote_data['sma'] = quote_data.groupby("sym")["close"].rolling(window=5, center=False).mean().droplevel(0)
But if I want to do a calculation like RSI, I tried this:
def calc_rsi(df):
    rsi_arr=np.array(df)
    RSI = talib.RSI(rsi_arr, timeperiod=14)
    #print(RSI)
    #print(type(RSI))
return(RSI)```And I see that it prints valid data, and the type is a numpy array. But the column doesn't get added back to the data frame.
Im not sure how to do that, any ideas?
tidal bough
jolly folio
Im not sure how to do that, any ideas?
I believe that .apply, despite what the name implies, isn't in fact inplace.
(I suffered from that too 😅 )
you need to assign the result back
jolly folio
ok, because I am grouping by symbol, how would I go about assigning it back in place so it knows which rows are associated with the proper symbols?
appreciate the help
tidal bough
uhh, no idea 😅
groupby always confused me
jolly folio
ok
tidal bough
I'd consider how you want the result to look like
jolly folio
Yeah, i have this:
sym  trade_date           close     sma
AAPL 2021-04-15 14:42:00  134.790  134.676375
AAPL 2021-04-15 14:43:00  134.600  134.685875
AAPL 2021-04-15 14:44:00 134.570 134.697250 ```And i want this:
AAPL 2021-04-15 14:42:00  134.790  134.676375    45
AAPL 2021-04-15 14:43:00  134.600  134.685875    45
AAPL 2021-04-15 14:44:00 134.570 134.697250 44```if my memory serves me right you shouldnt be using apply with a groupby
but instead
use .agg()
and pass your custom function instead of an in-built function
so for example
groupby("COLUMN").agg("FUNCTION)
exotic maple
I'm 99% sure you can
jolly folio
hmm, ValueError: Must produce aggregated value
exotic maple
that's probably a problem in your funciton, because the documnetation says it is supported

if it can be used with .apply, i can be used with .agg
it
jolly folio
yeah understood. ok
exotic maple
 bronze viper
Hi, given a set of coordinates (such as x and y coordinates) and a value at those coordinates, is there a way to get pairwise differences between the value at each coordinate and its "adjacent" coordinates? Ideally it would return a list of coordinates between each pair of coordinates and the difference. I understand "adjacent" is poorly-defined, I was hoping that would be part of the algorithm. I understand if this doesn't already exist, but if it did I am not sure how to go about finding it.
I am aware of "diff", but that is the difference between samples in an array, while I am trying to use continuous coordinates.
 vale crown
bronze viper
Hi, given a set of coordinates (such as x and y coordinates) and a value at thos...
vale crown
bronze viper
Hi, given a set of coordinates (such as x and y coordinates) and a value at thos...
Not sure to understand, do you want something like that ?
[0,0] - [1,1] = [-1,-1]
I know it doesn't work, but just an example to understand
tidal bough
I've taken a try at solving the second task of this:
https://xkcd.com/135
My results are:

is the plot of distance-ran-before-getting-eaten by angle
and this is an animation of one of the two optimal solutions:
by running at 54 degrees to the wounded raptor, you can make it almost 21.5 meters away before getting eaten by two raptors!
Isn't data beautiful?
Here's it at half realtime speed, it shows the velocities involved better:
bronze viper
vale crown
Not sure to understand, do you want something like that ?
```python
[0,0] - [1,1...
So say I have a sequence of x,y coordinates, e.g.
[[0.28711064, 0.40451254],
   [0.96784655, 0.0861019 ],
   [0.68484285, 0.65096231],
   [0.36623231, 0.63256963],
   [0.91743885, 0.48476299],
   [0.1396792 , 0.47512985],
   [0.86345159, 0.83123037],
   [0.60607383, 0.95506412],
   [0.62010063, 0.05366763],
   [0.68581617, 0.45793593]]
and values for those coordinates:
[0.84841442, 0.38087733, 0.98125056, 0.68496461, 0.63671769,
0.43368263, 0.8256275 , 0.83164562, 0.70654633, 0.52013433]
Say the algorithm says the first two points are "adjacent to" each other, it would give the coordinate directly between those two points, [0.8263446, 0.0861019], and the difference between the value at those two coordinates, -0.46753709.
Basically, it is the extension of "np.diff" to irregular arrangement of points.
dapper halo
Anyone know why dataframe.max() would be ignoring my max values??

So it shows the max value for NII as 18.8.....the histogram clearly shows otherwise...and I can find actual samples where the value has been set to 99. But the .max() as well as the actual training does not reflect that I've added this mask
vale crown
bronze viper
So say I have a sequence of x,y coordinates, e.g.
[[0.28711064, 0.40451254...
How did you get [0.8263446, 0.0861019] in it would give the coordinate directly between those two points, [0.8263446, 0.0861019]
tidal bough
bronze viper
So say I have a sequence of x,y coordinates, e.g.
[[0.28711064, 0.40451254...
Are you asking how to implement it at all, or how to implement it efficiently?
dapper halo
Yeah this makes zero sense to me. How can a dataframe take on two separate values?
 tidal bough
dapper halo
Yeah this makes zero sense to me. How can a dataframe take on two separate value...
tidal bough
dapper halo
Yeah this makes zero sense to me. How can a dataframe take on two separate value...
huh. Were those cells executed right after each other?
or maybe the dataframe was changed from one cell to the other
dapper halo
yup...
from the top cell where I enter the mask from my defined function "feature_mask"
then I printed the second cell and immediately the third cell
 brave goblet
hi i want to share with you my data science project template . note: a dockerfile and docker-compose will be added
any advices!!?
 dapper halo
tidal bough
huh. Were those cells executed right after each other?
dapper halo
tidal bough
huh. Were those cells executed right after each other?
idk somehow it had to do with the first line where I pop out the y_data.
Still think its super weird that the dataframe takes on two separate values for the same index...
 light fjord
Hello. I have a problem if anyone can help me please?
I am trying to run pytorch in a Jetson Nano with Cuda, (first time trying GPU, CUDA, etc...)but when I try to run my code, I get allways :
"AssertionError: Torch not compiled with CUDA enabled"
Also when I do:
"torch.cuda.is_available()"
I allways get FALSE.
Any help or orientation would be very apreciated.
Thanks in advance
tidal bough
light fjord
Hello. I have a problem if anyone can help me please?
I am trying to run pytorch...
As the message implies, it means you're using a build without CUDA. How did you install pytorch?
light fjord
Hello @tidal bough first I did it with pip3... then I downloaded the wheel torch-1.8.0-cp36-cp36m-linux_aarch64.whl ...But get the same answer
 raw glade
Hello everyone,
I'm new to spark and python. I'm trying to use this lambda function:
contributions = JoinRDD.flatMap(lambda x, y, z : (x, y/z))
However, I keep getting this error: TypeError: <lambda>() missing 2 required positional arguments: 'y' and 'z'.
Any ideas on how to fix?
tidal bough
light fjord
Hello <@!266216750876459008> first I did it with pip3... then I downloaded the w...
You're supposed to follow the instructions here (after selecting what version you want using the buttons):
https://pytorch.org/get-started/locally/

An open source deep learning platform that provides a seamless path from research prototyping to production deployment.
it uses +cu<something> at the end of the version to specify a cuda-enabled one
light fjord
tidal bough
You're supposed to follow the instructions here (after selecting what version yo...
For my requirements is:
pip3 install torch torchvision torchaudio
So it should be:
pip3 install torch+cu102 torchvision+cu102 torchaudio+cu102 ?? Right
My Cuda installed is 10.2
tidal bough
Not quite I think, copy the one there
light fjord
tidal bough
Not quite I think, copy the one there
Hi, no, I got the same answer...still
torch.cuda.is_available()
False
tidal bough
light fjord
Hi, no, I got the same answer...still
torch.cuda.is_available()
False
Hmm, do you have CUDA itself installed?
light fjord
tidal bough
Hmm, do you have CUDA itself installed?
Yes...its in /usr/local...and I tryed some examples that come with it, and run well
bronze viper
vale crown
How did you get [0.8263446, 0.0861019] in `it would give the coordinate directly...
Sorry, I did the second and third point, not the first and second.
bronze viper
tidal bough
Are you asking how to implement it at all, or how to implement it efficiently?
I was hoping there was some established way to do it, or even what the operation would be called. If there isn't I can probably come up with my own solution.
tidal bough
I don't think so, no. But it seems to me you can do it efficiently by adding together two copies of your array, the second one shifted by 1 position, and dividing by two.
or just writing the naive algorithm that iterates over the array and speeding it up with numba. Not sure what'd be faster - probably the numpy solution.
young dock
exotic maple
Have you even defined a hypothesis there? Because I dont see it.
For example, y...
No, you can't do a z test for difference in proportions. The samples have to be independent for that, and they aren't independent in the scenario.
As for my hypothesis, I'm sorry I didn't specify it. Here it is:
Null: The lecture on steroid harms has no effect on the proportion of steroid users.
Alt: The lecture on steroid harms has an effect on the proportion of steroid users.
exotic maple
I didnt mean he could actually do that one, but that it was a possibility.
That said, whag you mention is correct
young dock
I think the McNemar would be appropriate after a bit of looking into it
works for matched samples
exotic maple
young dock
No, you can't do a z test for difference in proportions. The samples have to be...
Does anything like paired z sample for priportion exists? Because thats definitely a z test for proportions.
But it also reminds me of a paired t test
 balmy junco
I'm having trouble with setting up a convolutional neural net in pytorch. Could I have some advice please?
RuntimeError: Given groups=1, weight of size [24, 28, 5, 5], expected input[2, 3, 224, 224] to have 28 channels, but got 3 channels instead
I am mostly just going through various values for in_features and out_features, right now as well as stride and padding
But I am pretty lost
I can understand it better later, but right now I just want to get it to work
jolly folio
@tidal bough and @exotic maple setting a series index ended up fixing my issue earlier
def calc_rsi(series):
    rsi_arr=np.array(series)
    RSI = talib.RSI(rsi_arr, timeperiod=14)
    rsi_series=pd.Series(RSI,series.index)
return(rsi_series)```somewhere, you configured your model to accept 28 channels (or incorrectly shaped your data) while you are feeding it 3 channels (R,G,B)
balmy junco
Can I show you what I have?
class ConvolutionalNeuralNet(nn.Module):
    def __init__(self):
        super(ConvolutionalNeuralNet, self).__init__()
        self.conv1 = nn.Conv2d(in_channels=3, out_channels=24, kernel_size=(5,5), stride=1)#, padding=1)#, stride=2)
        self.conv2 = nn.Conv2d(in_channels=12, out_channels=8, kernel_size=5, stride=1, padding=1)

        self.pool = nn.MaxPool2d(kernel_size=2, stride=2)

        self.fc1 = nn.Linear(in_features=3*224*224, out_features=50)
        self.fc2 = nn.Linear(in_features=50, out_features=9)
        self.fc3 = nn.Linear(in_features=9, out_features=67)

    def forward(self, x):
        x = self.pool(F.relu(self.conv1(x)))
        x = self.pool(F.relu(self.conv2(x)))
        x = x.view(-1, 3*224*224)
        x = self.fc1(x)
        x = nn.ReLU(self.fc2(x))
        x = self.fc3(x)
        return x
this is why named tensors should be the standard in ml...
balmy junco
any thoughts?
bronze skiff
there's a lot of confusion on proper sizing of kernels/inputs going on
i suggest you read this paper: https://arxiv.org/pdf/1603.07285.pdf on sizing convolutional layers and pooling
probably print out a copy and keep it with you at all times when writing CNNs... it's probably one of the most annoying things people deal with
velvet thorn
digression: this repeated x = pattern is actually disgusting IMO
dapper halo
Is there a way to put like a pdb stopping command inside of a model if you wanna check around during the training process?
balmy junco
bronze skiff
probably print out a copy and keep it with you at all times when writing CNNs......
I'll definitely look into it, thanks. But I am in a rush to get this to work now. Is it possible you could offer some advice?
I also have an issue with my feedforward nn haha
It runs, but the accuracy is insanely low
And so is the loss, counterintuitively
So I think I am doing something really wrong
velvet thorn
dapper halo
Is there a way to put like a pdb stopping command inside of a model if you wanna...
what do you want to check?
velvet thorn
balmy junco
I'll definitely look into it, thanks. But I am in a rush to get this to work now...
why are yuo in a rush?
dapper halo
velvet thorn
what do you want to check?
More just a general question for if I did wanna look around or anything. But specifically atm trying to figure out how to index specific layers for a custom loss function.
 tawdry iris
Hi, I'm stuck and confused.
I'm supposed to calculate the median and the mean of a column. That column has NaN values. After googleing, it says that the output would be NaN if we calculate it as is, but I had result with actual number.
After searching again, I found the way: df.dropna(subset=['my_column_name']. But, it seems to be deleting the whole row. It's not a problem if I don't need to calculate the other columns, but I have to.
The other thing is that, with and without df.dropna(), the result of my median and mean is the same. What is actually happening? I don't understand.
Problem solved using pokemon.dropna(inplace=True). Thanks.
 mossy oracle
Good free course for learning data science in python
 quartz stream
I have data as follows
Date,3AVG,3STD,5AVG,5STD
2020-01-01,0.0001516753626573417,4.312318533850928e-05,0.0001238381056464277,5.1544752917263285e-05
2020-01-02,8.940538989716313e-05,1.6553091501380443e-05,7.256192446220667e-05,3.0730320385990164e-05
2020-01-03,9.843248982279976e-05,2.6553840606630725e-05,0.00010043714893981816,5.002368550421968e-05
2020-01-04,7.060501876468252e-05,2.788075943272748e-05,6.0957247260375876e-05,2.9456213115351173e-05
2020-01-05,8.333993577657061e-05,1.2844978651636427e-05,7.349029838223941e-05,1.6037215969701733e-05
2020-01-06,0.0001618258473980758,3.314910335308243e-05,0.00011460499285021796,4.8313801065293874e-05
Does anyone have any idea what all charts can be created, that will help me in exploring the data
velvet thorn
tawdry iris
Hi, I'm stuck and confused.
I'm supposed to calculate the median and the mean o...
almost all pandas methods return copies
tawdry iris
I see thanks
tacit fox
does anyone know how to use/set up 'experiments' on azure ml?
rn i'm just using notebooks and using it as a virtual machine but i'd rather use the full potential of azure
 ruby ermine
Does anyone know why creating a BeautifulSoup object using lxml is so slow? It takes 0.012 seconds with lxml parser but only 0.001 seconds using xml parser (just to put it in perspective - I know it's not a real comparison). Creating a Selector object using Parsel (library used in Scrapy) takes only 0.002 seconds even though Parsel is also using lxml.
grave frost
velvet thorn
digression: this repeated `x = ` pattern is actually disgusting IMO
debugging
grave frost
bronze skiff
this is why named tensors should be the standard in ml...
ooh, I didn't even know that existed. will dig if that's present in TF!
 empty patio
I am trying to render a R 3d plot on google colab is it even possible on commandline
 misty thicket
hello anyone here good with data manipulation and is free?
please
I need instant help
 grizzled oar
Hello, is there any book reference for forecasting with linear regression using Python (or just linear regression is ok)? I've searched on Google but I've found nothing, or if I found, the explanation was too few. Thanks in advance!
grave frost
Haha, I just found a guy on Stack Overflow saying he has long experience in Deep Learning. The framework? tesseract 🤣
bronze skiff
misty thicket
I need instant help
oof
misty thicket
bronze skiff
oof
please
short heart
Can somebody help me with this error?
  File "D:/!Code/папкипитона/!!!Project stock_market/RL.py", line 3, in <module>

    from stable_baselines.common.vec_env import DummyVecEnv
  File "D:\!Misc\C++\lib\site-packages\stable_baselines\__init__.py", line 7, in <module>

    from stable_baselines.deepq import DQN
  File "D:\!Misc\C++\lib\site-packages\stable_baselines\deepq\__init__.py", line 1, in <module>

    from stable_baselines.deepq.policies import MlpPolicy, CnnPolicy, LnMlpPolicy, LnCnnPolicy

  File "D:\!Misc\C++\lib\site-packages\stable_baselines\deepq\policies.py", line 2, in <module>

    import tensorflow.contrib.layers as tf_layers
ModuleNotFoundError: No module named 'tensorflow.contrib'```ModuleNotFoundError: No module named 'tensorflow.contrib'
 ruby magnet
Anyone know how I can plot multiple dataframes on the same graph?
grave frost
short heart
Can somebody help me with this error?
```py
File "D:/!Code/папкипитона/!!!Pro...
you are following a tutorial in TF1, while you are using TF2
short heart
so what do i do
do i have to change python version tf version and reinstall all libraries
grave frost
Make a new env for TF1.x
 fiery dune
Hi, I have AI subject next year and Im already frigthened, can you give me little guides?
short heart
grave frost
Make a new env for TF1.x
wdym new env
grave frost
use anaconda or pyenv to make a new env, and install OR use a different machine/colab
 open juniper
I want to resize this dataframe to (16672, ) for doing a matrix multiplication.
I am kinda new to this. Can someone help me on how to upscale this kind of data?

 slate hollow
i'm running tensorflow 2.4.1 with gpu support (on kubuntu 20.04)
but here's the thing
when i run it in intellij it gives this error message: https://paste.pythondiscord.com/ziqukuyuma.apache
but when i run it in the terminal it goes just fine:
https://paste.pythondiscord.com/vozaqehofu.apache
does anyone know why this is happening?
austere swift
in intellij is it in some sort of virtual environment
 jolly ginkgo

Explore and run machine learning code with Kaggle Notebooks | Using data from Brain MRI Images for Brain Tumor Detection
its my best project
how?
grave frost
jolly ginkgo
its my best project
is it just me, or do every kaggle kernels have the same sort of code structure, coding style, and formatting?
jolly ginkgo
grave frost
is it just me, or do every kaggle kernels have the same sort of code structure, ...
every
because there are 4 or 5 libraries. the logic is the same in all of them
slate hollow
austere swift
in intellij is it in some sort of virtual environment
no, it's the system interpreter
lapis sequoia
is matplotlib short for math or matrix