#data-science-and-ml
1 messages · Page 304 of 1
 willow quarry
there the problem was kernel
and now i get this error
Unable to build Dense` layer with non-floating point dtype <dtype: 'int32'>
now i se i cant du it cause i am using GPU version of TensorFlow
 velvet thorn
@pale oasis combine_first
 compact warren
Hello, do you know any web page, book, etc. Where ML, EDA, and data science rest / exercises in general are put and they have a response (feedback). Something like this: * they give you a dataset, answer the following questions: ...... * The final one gives the correct answers to compare. I say it because I am learning and I do not have as a guide if what I do is right or not
 desert void
So , is it true autoML will replace data scientist or will help data scientist's make their work easy?
 autumn basin
Doesn’t seem likely to me. The overall parameter space is too large for any algorithm to thoroughly search.. effective ML is still more of an art than a science
 tropic junco
i want to make an ai in python can u help @hasty grail
 hasty grail
Please give more details about it, otherwise no one will be able to provide you good suggestions
tropic junco
ok
i want to make an ai or software that can control my pc on its own just somewhat like jarvis
tropic junco
hasty grail
what exactly do you want to do with it?
like browse open apps play music know the time
chat with it
etc
hasty grail
I don't think the current state of technology is capable of doing such generalized AI
tropic junco
but there are some basic functions which it can perform can u help me with that
theere is an software which can do that but i am not sure if it is safe so not using it
hasty grail
what do you consider "basic functions"?
tropic junco
like time open youtube search on wikipedia
hasty grail
and how would you tell the AI to do them?
tropic junco
tropic junco
theere is an software which can do that but i am not sure if it is safe so not u...
this is the site i am talking abt https://www.mega-voice-command.com/
Market Place for all Mega-Voice-Command Products. Get Best Deals fo MVC Plugins, Scripts, Add-Ons, Profiles, Rainmeter Skins and Lots More.
tropic junco
hasty grail
and how would you tell the AI to do them?
pyttsx3
speech recognition
see this
tropic junco
tropic junco
theere is an software which can do that but i am not sure if it is safe so not u...
Market Place for all Mega-Voice-Command Products. Get Best Deals fo MVC Plugins, Scripts, Add-Ons, Profiles, Rainmeter Skins and Lots More.
hasty grail
Hmm I haven't done speech recognition, perhaps someone else who has would have a better understanding
 native lark
tropic junco
pyttsx3
native lark
tropic junco
pyttsx3
pyttsx3 is a text-to-speech library, that can read out text with a synthetic voice. For speech recognition you could take a look at the suggested packages here: https://realpython.com/python-speech-recognition/
 topaz epoch
Hi
 lean ledge
desert void
So , is it true autoML will replace data scientist or will help data scientist's...
lean ledge
desert void
So , is it true autoML will replace data scientist or will help data scientist's...
Little of column A, little of column B
Companies that don't already have data scientists and don't have large data scientist requirements will use AutoML instead. Data scientists that are hired will use it, either as a quick solution or as a good baseline to try to beat.
 uncut kindle
ready-made solutions is great for producing a quick poc. but the trade-offs are customization and whatnot
lean ledge
It's a bit like cloud. Now not everyone has to make and maintain their own servers, so no more server hardware people needed. And those with more intense requirements have more powerful toolsets to play with
uncut kindle
so far GUI tools still can't replace programming. I'd say it's the same with AutoML
or RapidMiner
just because it works doesn't mean it's what you need
lean ledge
uncut kindle
ready-made solutions is great for producing a quick poc. but the trade-offs are ...
AutoML is not a "ready made solution" like some GUI, it's automated data science. Vastly different. Many AutoML solutions come out with highly customisable things and you can choice whatever options as you're setting it up
uncut kindle
and actual modeling often involves feature engineering, which means you need to come up with it on your own. you just can't feed the data as-is to the model and wait for the results
lean ledge
AutoML is designed to do feature engineering automatically
Often that's the main part of autoML
At my AutoML group in Microsoft, feature engineering part of the codebase was vastly larger than the actual autoML algorithms
Like much much
Most of the work was working on feature engineering and adding more kinds of available inputs/customisations
Or at least that's the impression I got. The codebase was massive, I don't know it well enough
uncut kindle
oh that's neat. altho from my experience these frameworks often involve background magick, in which if you're not aware of you might have the wrong assumptions about the expected output
but I agree that it'll make DS easier
but will it replace DS? I'd say no, since at the end of day you still need someone who's able to interpret the results
lean ledge
Interpretating results isn't magic and can be done by a non data scientist technical person just fine
Will it replace all data scientists? Ofc not, only siths deal in absolutes
Will it get rid of a lot of demand of larger and smaller companies alike who have a lot of data and don't feel like paying dozens of 150k an year individuals they don't know how to hire? Yes
uncut kindle
No. you still need someone to do deep-dive to find flaws in the model
lean ledge
Flaws such as?
uncut kindle
if the model performs bad for a certain type of input, someone needs to find out why it's so
for instance, an impute pipeline I've worked on produces high error if it's from a region where there's not a lot of training data
as for feature engineering, it's not always from the source data. sometimes you also find other data sources and add it to the original dataset as "features"
lean ledge
uncut kindle
for instance, an impute pipeline I've worked on produces high error if it's from...
Ha, I actually found and got someone else to fix bugs related to this. Should work fine in autoML now.
uncut kindle
it's junk in junk out at the end of day
if the input data is bad, no amount of fancy model can improve the results
lean ledge
Either:
- it's enough that a mature AutoML product will take care of it (as just shown)
- or its non trivial enough that you need to hire a proper data scientist
The latter case is a lot rarer than the former
lean ledge
uncut kindle
if the input data is bad, no amount of fancy model can improve the results
Sure but you don't need a data scientist to figure out the data in is bad. A comprehensive search over possible models and good feature engineering for 95% of use cases already defeats so many data scientists
uncut kindle
data cleaning is also a major part of modeling work 🙂
a good data cleaning logic can improve the model performance
not true. for instance if you get spatial-related data with region labeling, unless you go explore the data yourself you may not even find out that the region tagging they give you could be "nearby" instead of "actual" region
lean ledge
Do you know who is good at making data cleaning pipelines? A hundred data scientists at Microsoft or Google whose job has been to do just that for the last 5 years with terabytes of client data to get analytics from and large clients with premium cloud subscriptions to interact with
uncut kindle
for instance, suburbs might have the same region label as CBD
which works in business sense, but not in spatial computational sense
so you need to obtain the original geometry and tag the region yourself
lean ledge
uncut kindle
not true. for instance if you get spatial-related data with region labeling, unl...
Oh definitely, but most data scientist are not dealing with fancy types of data all the time. Most of them have large amounts of tabular categorical or numerical data, or vision, or text, doing either prediction or regression or vision tasks
uncut kindle
a person who has domain knowledge in real-estate will always be better at cleaning real-estate data compared to retail data scientist 🙂
lean ledge
I think you keep forgetting you don't need to do everything to replace data scientists. If you replace 90% of their workloads, you'll hire 1 data scientist instead of 10.
That one data scientist can focus on all your fancy data sets which require human insight to clean or collaboration with domain knowledge experts to feature engineer
Sure
 spark nimbus
Does anyone here have experience using manim (the library made by 3b1b) for visualizing their data?
lean ledge
But the other 9 data scientists that spent 90% of their workload on classical tasks can easily be automated out
lean ledge
spark nimbus
Does anyone here have experience using manim (the library made by 3b1b) for visu...
It's ridiculously hard to use lmao
spark nimbus
ah
spark nimbus
nontrivial?
lean ledge
"this was not meant to be a publically shared production animation library"
spark nimbus
I mean isn't that why the community port exists?
lean ledge
It's clearly a very personal project that's poorly documented and not very modular etc
Yeah
uncut kindle
oh you're talking about DS pin factory. as long as you're aware of the tradeoffs for this flow I guess it's ok
lean ledge
DS pin factory?
uncut kindle
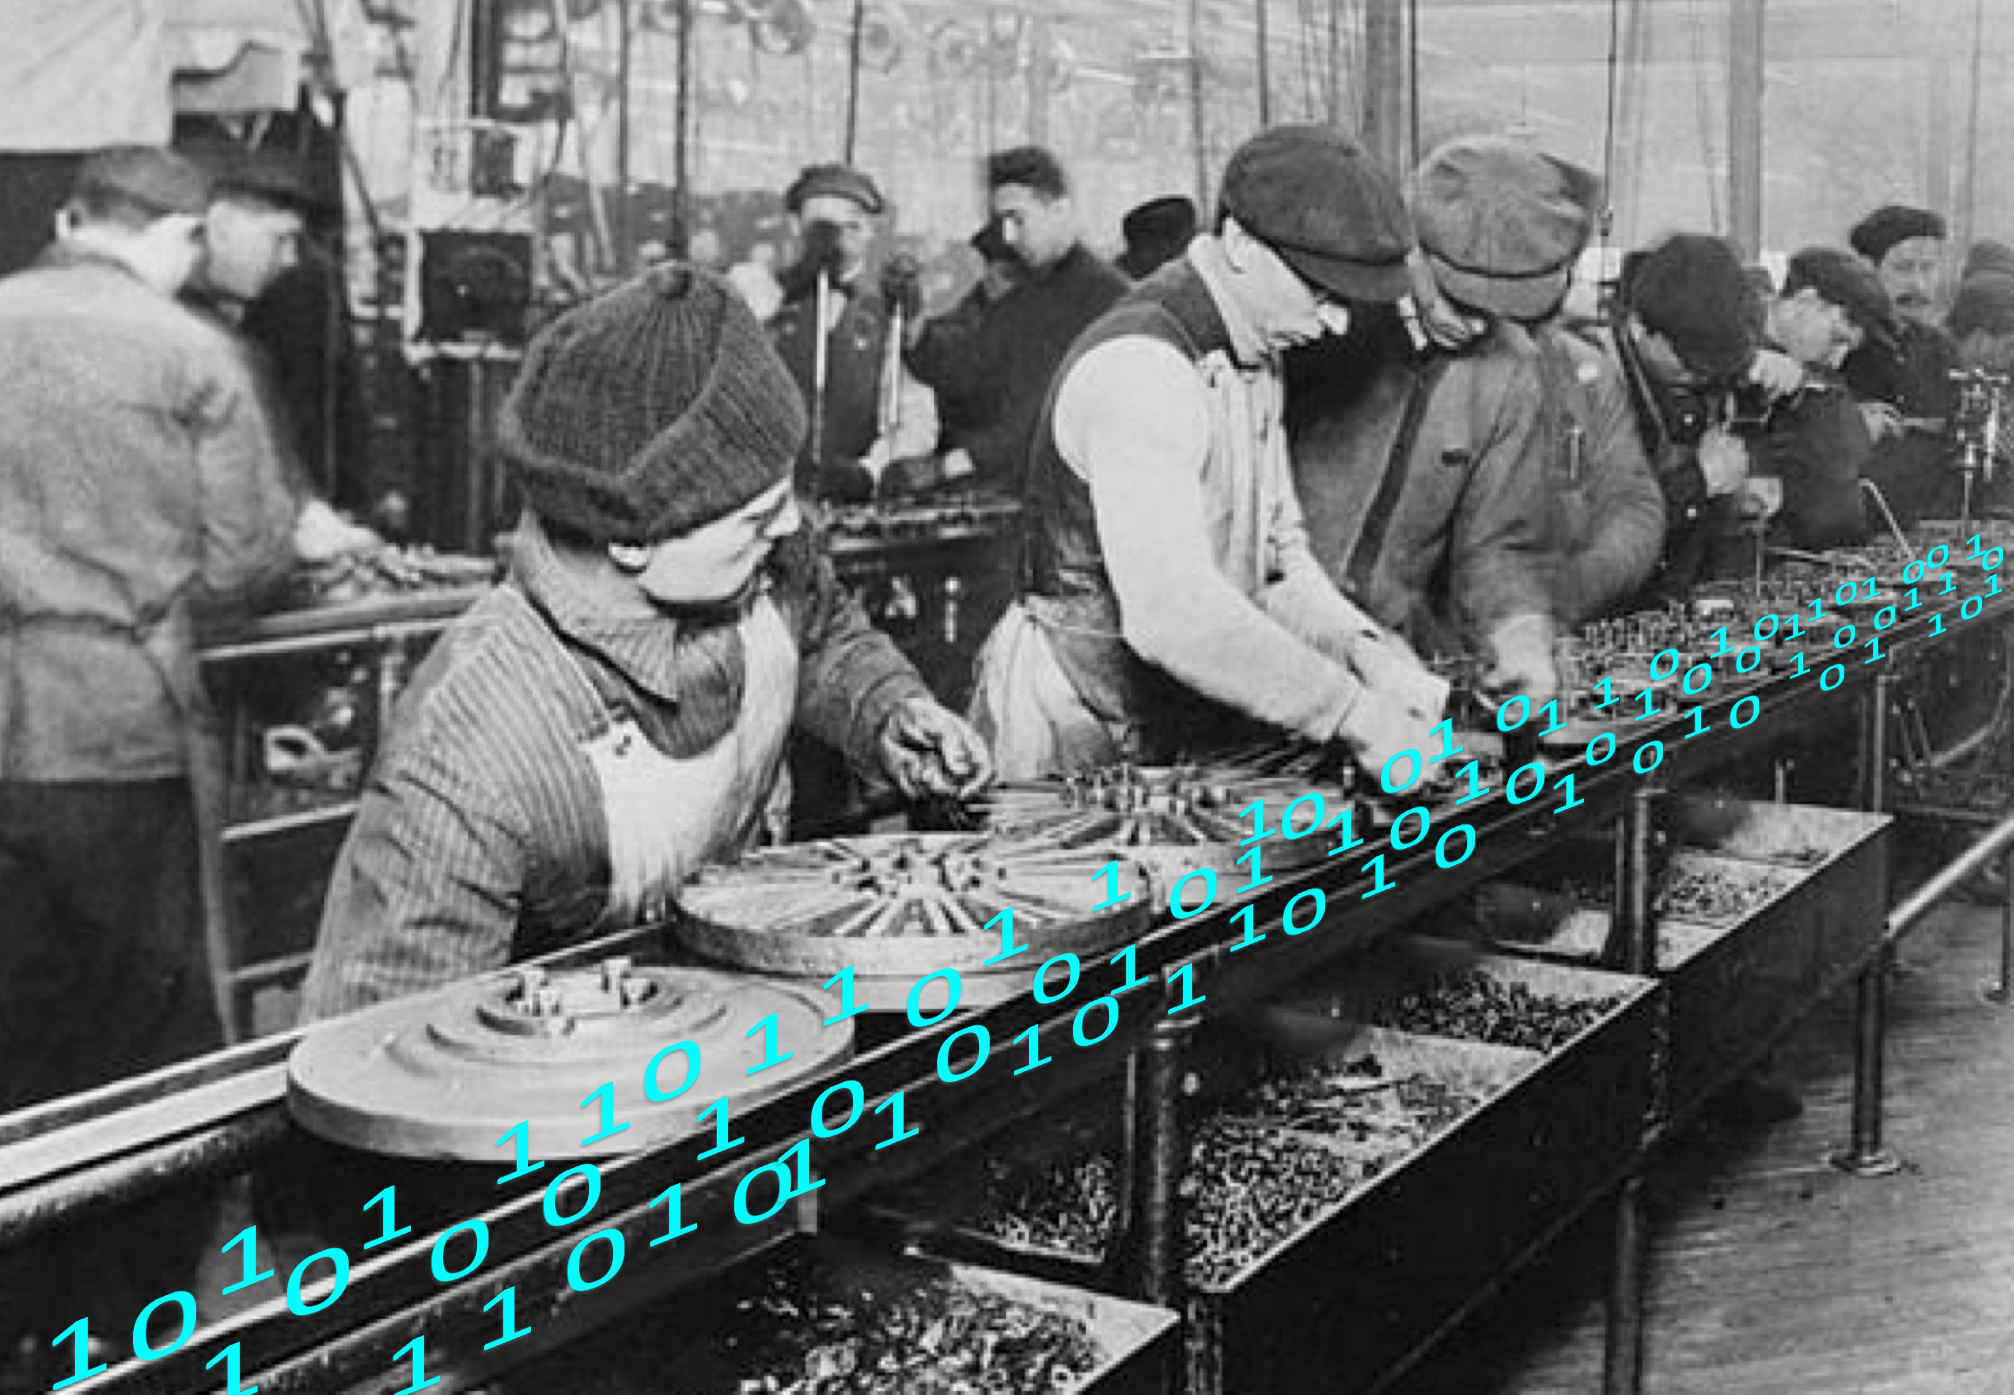
This post discusses the benefits of full-stack data science generalists over narrow functional specialists. The later will help you execute and bring process...
lean ledge
Not really?
I mean, autoML can clean data, model it, come up with a good reusable implementation, AND provide all the stats and metrics you need. If you're under the assumption that most data scientists do unique work that's different every time and can't be done properly without human insight, you're in the wrong here.
uncut kindle

Manning Publications
Most machine learning systems that are deployed in the world today learn from human feedback. However, most machine learning courses focus almost exclusively on the algorithms, not the human-computer interaction part of the systems. This can leave a big knowledge gap for data scientists working in real-world machine learning, where data scientis...
lean ledge
Heavy use of autoML is already happening. I don't think I'm actually supposed to tell you names but there's some very big companies that you have heard of and/or interact with day to day using Azure AutoML heavily enough that they've probably not hired more data scientists to an extent
uncut kindle
AutoML aims to make ML more approachable. it doesn't aim for the best output. but at the end of day you still need to know when the results is BS and biased
lean ledge
I can't convince you about the impacts of AutoML if you don't want to be convinced. ¯\_(ツ)_/¯
uncut kindle
reddit
6 votes and 30 comments so far on Reddit
like I said. I'm prob not worth the title of machine learning engineer 🙂
lean ledge
I mean, I've worked with a couple dozen top data scientists who vehemently disagree with the top comment of that post. It also makes it sound like the person hasn't actually used a practical AutoML tool or is making up complaints. AutoML tools do wayy more than just model, you can freely choose which features to put in and which to not it doesn't take a data scientist to untick race as a feature. Etc
lean ledge
Go upload date on Azure AutoML and you'll be able to choose and select what kinds of features to put in and how to impute them (or leave it on auto). It'll come up with metrics or you can choose your own. You can deploy it straight into Azure straight after or download it locally. You can go to the model explanation tab where it tells you feature importance etc
 lapis sequoia
it looks like this so fat
far*

how do i draw the lines to the end of the graph
?
uncut kindle
@lapis sequoia you need to add rows for each missing value on x axis
uncut kindle
Don't ask to ask. Ask away (help forums etiquette 101)
 idle root
anyone here even used face recognition library ?
theres the .compare_faces and i want to know how accurate that function is
anyone got a clue?
 grave frost
@uncut kindle there is also some research into automated data cleaning using hierarchial seq2seq methods - its cutting edge for sure, but I agree with Raggy's points, AutoML wouldn't necessarily automate Data scientists, but it sure would decrease their demand
I mean, MLjar - which is a pretty young lib can do more EDA than me - it's totally nuts
it can also construct golden features and also maximize interpretable models
All good for the CEO's slides
I don't see why one data scientists can accomplish certain ML related tasks. the only problem would be deployment. I don't have enough expereince to comment about deployment but making a REST api doesn't seem that hard - I expect it would simplify more with multiple use cases as time goes on
uncut kindle
model deployment is not only about REST api 🙂
real-time inference and performance optimization is also a specialization in its own right
grave frost
course, as I said I don't have enough experience in deployment to comment much about it - but apart from that, would you agree with other points?
uncut kindle
I agree that it would reduce some of the DS workloads, but it wouldn't replace DS.
just because someone can crank out a model doesn't mean it's usable. you need to know how to interpret it. real world data is very messy (unless you're talking about kaggle datasets). most time is spent on data exploration and deep-dive, not producing the model
even if you're a machine learning engineer (dealing with optimization and deployment) you still need to know at least basic stats
grave frost
I just said there is some cutting-edge research in data cleaning ^^^
agreed about the data exploration, but then MLJar - commericially available new hobbyist tool does advanced EDA more than I have ever done - and certainly more than kaggle notebooks
how can't you say that it would improve? the most skills are basic data entry ones where I guy just has to create a DF from data to pass it on to AutoML
then a small team of DS can handle the rest
uncut kindle
EDA doesn't mean seeing a pairwise correlation and that's it. you need domain knowledge to tell what's within borders of "normal" and "extreme"
 balmy crown
I want to get my hands dirty with data cleaning and visualization. Can anyone suggest me few beginner/intermediate level datasets for the same?
uncut kindle
@balmy crown I wouldn't recommend you to use datasets from kaggles or one of those open data. if you can, try scraping property portals. a lot of variance there. also some variety in terms of attributes too. For instance, a certain attribute in one region will have different distribution than another region
you can download search results from redfin website (it's in csv). you could go from there
maybe for a start you could try visualizing sale price in different region
balmy crown
uncut kindle
<@!594883565800521728> I wouldn't recommend you to use datasets from kaggles or ...
thanks! this helps! 🙂
uncut kindle
reason being kaggle datasets doesn't reflect how messy real-world data is. it's not uncommon to spend weeks on trying to understand the given dataset and find out underlying assumptions and expectations
for instance, in North America (that I know of), bathroom is stored as double / float, because a toilet only counts as .5. toilet+bath would be 1
in some parts, toilet only would still be counted as 1
or sometimes the trend changes and ppl say "hey then it was .5 but now ppl think .5 is complete. so from now on .5 is now 1"
cue data backfill and informing stakeholders that "hey we're moving on please update your downstream logic"
balmy crown
uncut kindle
or sometimes the trend changes and ppl say "hey then it was .5 but now ppl think...
So you have to manually change all those 0.5s to 1s?
grave frost
uncut kindle
EDA doesn't mean seeing a pairwise correlation and that's it. you need domain k...
you are missing the whole point - it's not about automating a data scientists, it's about performing several aspects of him that may lead to a reduction of data scientists required by companies (resulting in a decrease in job rates)
uncut kindle
wouldn't say manually. maybe create an adhoc script to backfill. or update downstream logics to set 0.5 as 1 for records produced before the update date
@grave frost 80% DS work is spent on data wrangling 😉 I think most DS are safe
grave frost
uncut kindle
<@!738058085083381760> 80% DS work is spent on data wrangling 😉 I think most DS...
alright, if you don't want to be convinced, fine by me
uncut kindle
context?
 shut slate
so in a data series I have this:
OT 4191
UK 1849
OTHER 1383
GI 1379
TR 1133
...
WAKIE 1
RAHN 1
TAARNBY 1
KUOTO 1
EMMA 1
Name: Bike_Make, Length: 721, dtype: int64
I want everything <10 to be classified as 'other'
uncut kindle
in which column? Bike_Make?
uncut kindle
what are you trying to do?
wouldn't make sense to add categorical value in integer column
shut slate
You see the bike Makes that have only one make
I want to lump them in together, AND SHOW THEM ALL AS "OTHER"
uncut kindle
is this an assignment?
shut slate
Well kind of. I am just playing around it on my own time. There is no assignment
uncut kindle
oh ok. it's kinda obvious since you don't seem to think like a person working with data wrangling on a daily basis.
I'm saying maybe you need to come up with data cleaning logic first
shut slate
well yeah just learning
uncut kindle
hint: create temp column, sum and drop where col value is x
it's the same logic if you do it by hand too
if you can't do it by hand, you can't code the solution
 uncut kindle
then you need to use the results from value_counts to pre-process the original data 🙂
say, split the df into two groups, one where bike make is > x and the other is less than x
shut slate
Like I want the value counts 1 to 10 lets say to be 'other'
like binning or something
uncut kindle
binning doesn't work for categorical values
uncut kindle
so for starter: split the df into two:
- where bike make is > 10
- bike make < 10
- would essentially be your "other"
the rest you can work it out 😄
shut slate
ok thanks
 frozen blade
Hi I am working on similarity app for a search engine it is like a recommendation system but based on the product characteristics and not on the user history
It is an eCommerce search engine that work on multiple categories example high tech and each one is containing sub categories
I though on a clustering model based on features and after that a classification problem related to the crawl to classify the new item based on the clusters
I am debutant in ML thanks for the help
 midnight locust
hey I am from India, what do you guys think Data Science is the best option to choose or Networking?
uncut kindle
If you're good at what you do, even if you're an analyst without knowledge of cloud or big data, ppl would still hire you
shut slate
Man wtf I still cant figure it out 😦
uncut kindle
Ex: veteran analysts proficient in R are not forced to write in python. Instead they have another employee to convert the R to python production code
@shut slate what you got so far?
shut slate
I just learned about pd.cut for some reason but that does not work with strings. But hey extra knoweledge and I tried it out
lol
uncut kindle
Simple filter would do :)
 uncut kindle
Note: you need to use output from value counts
shut slate
ye how lol
uncut kindle
Idk, do you need to know which bike make has count less than ten?
Look into pandas series filtering
 desert oar
midnight locust
hey I am from India, what do you guys think Data Science is the best option to c...
desert oar
midnight locust
hey I am from India, what do you guys think Data Science is the best option to c...
data science needs math and stats, you really imo do still need a school degree in order to be "good", unless you are especially adept at learning math from a book or online course.
networking you can learn from books and smaller certificate-type programs + job experience.
but data science pays more, at least in the US
i have no idea what the job market in india or greater south asia is like
i know there are a lot of indian firms e.g. in chennai that do consulting for us and european firms
 stuck shuttle
I'm making a temperature conversion calculator, but I don't know what to do so that all the code can be more concise
 grave frost
midnight locust
hey I am from India, what do you guys think Data Science is the best option to c...
grave frost
midnight locust
hey I am from India, what do you guys think Data Science is the best option to c...
In India, the status of networking is not so good - better choose data science but only if you like it. no point in doing something you dont like
 nimble igloo
stuck shuttle
I'm making a temperature conversion calculator, but I don't know what to do so t...
nimble igloo
stuck shuttle
I'm making a temperature conversion calculator, but I don't know what to do so t...
You probably only need to know how to convert from one unit to the rest and from the rest to that unit. Then you convert from one unit into the default unit, and then to the chosen unit.
E.g choose Ce as base.
Then to go Fa->Ra, just go Fa->Ce->Ra?
Not sure if this is what you want tho, and you will pick up a bit more uncertainty if the conversions aren't exact.
stuck shuttle
nimble igloo
You probably only need to know how to convert from one unit to the rest and from...
that uncertainty made me doubt
nimble igloo
stuck shuttle
that uncertainty made me doubt
Up to you, it would definitely cut the code down.
stuck shuttle
midnight locust
hey I am from India, what do you guys think Data Science is the best option to c...
I always wonder, why when I look for tutorials on youtube> it appears that most of the people are Indian
stuck shuttle
nimble igloo
Up to you, it would definitely cut the code down.
ok, thaks
nimble igloo
stuck shuttle
ok, thaks
Kelvin would probably be the best base temperature
stuck shuttle
nimble igloo
Kelvin would probably be the best base temperature
Of course, but for a data scientist it should be all
nimble igloo
stuck shuttle
Of course, but for a data scientist it should be all
I'm meaning for the base temperature to convert through
stuck shuttle
nimble igloo
I'm meaning for the base temperature to convert through
I think you want to prioritize, I'm sorry
 wild dome
I just discovered Twint and it's amazing, but the code conventions are a pain in the eyes :/
it just doesn't have any consistency
and that's my rant lol
lapis sequoia
Hii...I have just learnt basic Python...can anyone suggest any ai projects related to python just to begin in ai and python??
 robust charm
Hi guys. Im having trouble building a CNN model, I was wondering If anyone here had any experience with this and could give me a little help.
 uncut orbit
robust charm
Hi guys. Im having trouble building a CNN model, I was wondering If anyone here ...
uncut orbit
robust charm
Hi guys. Im having trouble building a CNN model, I was wondering If anyone here ...
what type of cnn?
uncut orbit
and how are you building it
robust charm
im trying to make model that identifies pages in a book.
uncut orbit
using?
willow quarry
ok gpu??
uncut orbit
gpu doesn't matter
willow quarry
ok colab is not gpu
uncut orbit
no it can run, but thats not the point
robust charm
I think i have an issue with the model layout

 willow quarry
what is the error you get??
robust charm
input dim error
willow quarry
check if the gray scale can be resised
robust charm
 robust charm
this is wrong but even when I change it to the correct input size it still comes up with the same error
robust charm
willow quarry
32 on a gray scale???
32 filters on a grayscale? is that bad?
robust charm
the input shape is (305,456)
willow quarry
there is your problem probably
robust charm
sorry
willow quarry
the shape should be
robust charm
(305,456,1)
robust charm
no

I want to make a binary classification model
So here I make 2 lists of pictures
pages of books and a list full of random images from the cifar dataset
either page or not page
willow quarry
can you check your entire list dimension??
robust charm
The picture is me resizing, grayscaling and putting them in a list
willow quarry
in the resize tri puting
(305,456,1)
just to force the 1 in the end to apear
if you print you image np.array it will be completely diferent
if worked let me know
willow quarry
its weard that
willow quarry
robust charm
this shows a weard form
a gray scale showld look like (n images , width , height , 1
and you have (none , n images , width , height ,32 )
wy you use [imagearray,1]
wy the ,1
robust charm
im using that to attach the target name
1 for page, 0 for non page
later Ill split them up
willow quarry
that shpouldnt be done with pandas????
like np array is cool and all but i dont think they are great for categorisation
try making pandas and then make them tensors
i would take a simple datasset ready like cats_dogs and recreate the data
books_no_books
robust charm
I think im getting onto something
gonna try train the model without changing the size or colour
willow quarry
check the sizes of the array2 before
just to compare with the one you are trying to shrink
robust charm
WARNING:tensorflow:Model was constructed with shape (None, 910, 610, 3) for input KerasTensor(type_spec=TensorSpec(shape=(None, 910, 610, 3), dtype=tf.float32, name='conv2d_input'), name='conv2d_input', description="created by layer 'conv2d_input'"), but it was called on an input with incompatible shape (None, 906, 610, 3).
I switched to pycharm but im still getting this error
the issue is with the input
willow quarry
you need to feed a tensor
try
tf.compat.v2.Variable( img )
and be shure your image is int32
usualy images are uint8 by default
 zenith agate
do you guys know how to use eager execution instead of model.predict?
im trying to run a model from model zoo and inference is rather slow, it was advertised as 40ms predictions but im getting 2-3 fps
i read that model(...) is faster than model.predict(...) but the code is throwing this error
Traceback (most recent call last):
  File "C:...../main.py", line 144, in <module>
    prediction_dict = model(input_tensor, shapes)
  File "C:\ProgramData\Anaconda3\lib\site-packages\tensorflow\python\keras\engine\base_layer.py", line 1012, in __call__
    outputs = call_fn(inputs, *args, **kwargs)
TypeError: call() takes 2 positional arguments but 3 were given
TF 2.0 Uses eager execution by default
you would have to optimize your pipelines to see where the bottleneck lies - people use all sorts of tools for that.
if you want to go through the simple route and just want inference time rather than accuracy, you can consider quantizing the model weights
Audio processing newbie - why don't we have more pre-trained models for audio spectrograms? Quick search only yields MagentaCNN. Do these weakly supervised models not generalize enough to new audio spectrograms?
zenith agate
grave frost
if you want to go through the simple route and just want inference time rather t...
ill look into this, thanks
zenith agate
grave frost
if you want to go through the simple route and just want inference time rather t...
i found the tf docs for quantization, however I am unable to set my input size for the model even after running model.predict... heres my code and the error
```ValueError: Model <object_detection.meta_architectures.ssd_meta_arch.SSDMetaArch object at 0x000001A884067A48> cannot be saved because the input shapes have not been set. Usually, input shapes are automatically determined from calling .fit() or .predict(). To manually set the shapes, call model.build(input_shape).
Load pipeline config and build a detection model
configs = config_util.get_configs_from_pipeline_file(pipeline_config)
model_config = configs['model']
model = model_builder.build(
model_config=model_config, is_training=False)
Restore checkpoint
ckpt = tf.compat.v2.train.Checkpoint(model=model)
ckpt.restore(os.path.join(model_dir, 'ckpt-0')).expect_partial()
sizeimage = load_image_into_numpy_array("people.jpg")
input_tensor = tf.convert_to_tensor(sizeimage, dtype=tf.float32)
input_tensor = input_tensor[tf.newaxis, ...]
image, shapes = model.preprocess(input_tensor)
model.predict(image, shapes)
converter = tf.lite.TFLiteConverter.from_keras_model(model)
converter.optimizations = [tf.lite.Optimize.DEFAULT]
converter.target_spec.supported_types = [tf.float16]
tflite_quant_model = converter.convert()
 iron basalt
If you want to make a multiplayer ML game for twitch then just go for it, some already have, they are pretty fun. @opaque stratus
willow quarry
year but i have to overstep some stones first
as i said i am doing my enviroment
i have made all
the input and output specs
the agent
actor
time spec
all is going ok
iron basalt
I would make it with Unity or Panda3D.
willow quarry
now the last fing is use the trajectories to train the agent
 south coyote
do you run any simulation of the game for your training? @willow quarry
willow quarry
it is ready
my retroarch and screean read to transfor in points
and with a simple [15 ] array you can make button inputs
i just disabled the pause cus
i dont want an ai pausing to not lose position
so
wen i train my trajectory
i got this error
iron basalt
Are you using an existing game? You have to make your own game to avoid copyright.
Atari loves to sue for example.
willow quarry
TypeError: apply_gradients() got an unexpected keyword argument 'global_step'
willow quarry
iron basalt
Are you using an existing game? You have to make your own game to avoid copyrigh...
i can stream a ps1 game if i want can't i???
iron basalt
No you can't.
iron basalt
Yes, but only because the companies allow them / don't care. If they wanted to they could shutdown twitch legally.
iron basalt
But let's say someone is trying to promote their ML by winning at your game. Companies will take notice and have in the past.
Yeah, it's just thin ice.
willow quarry
lets try
if it doesnt i came here and make a croud game makers for ai
here
that bis an example @south coyote
the script reads the screen detects game start have some hardcoded combos to start and select characters
if something goes wrong he even restarts the emulator
south coyote
its way above my paygrade at this point🙃
willow quarry
actualy there is no big deal here and the code is not even polished yet
once i presented the base project on mi formation i will restart from ground
at least a bether pather comparator is needed
@iron basalt any ideas what is it ??
TypeError: apply_gradients() got an unexpected keyword argument 'global_step'
iron basalt
How could I possibly know what that error is? I don't have your code. Nor am I your debugger.
Obviously though, global_step is the wrong argument as it says.
willow quarry
its cus tensor gives back some messed mensages
ii will post a litle here
the error
    183         # We're either in eager mode or in tf.function mode (no in-between); so
    184         # autodep-like behavior is already expected of fn.
--> 185         return fn(*fn_args, **fn_kwargs)
    186       if not resource_variables_enabled():
    187         raise RuntimeError(MISSING_RESOURCE_VARIABLES_ERROR)

~\AppData\Local\Programs\Python\Python38\lib\site-packages\tf_agents\agents\reinforce\reinforce_agent.py in _train(self, experience, weights)
    286                                           self.train_step_counter)
    287
--> 288     self._optimizer.apply_gradients(
    289         grads_and_vars, global_step=self.train_step_counter)
    290

TypeError: apply_gradients() got an unexpected keyword argument 'global_step' ```train_loss = tf_agent.train(experience)
the error is in this line
experience = tf_agents.trajectories.trajectory.Trajectory(
action= tf.compat.v2.Variable([tf.compat.v2.Variable(policy_step.action),tf.compat.v2.Variable(policy_step.action),tf.compat.v2.Variable(policy_step.action)]),
reward = tf.compat.v2.Variable([[tf.compat.v2.Variable(time_step2.reward),tf.compat.v2.Variable(time_step2.reward),tf.compat.v2.Variable(time_step2.reward)]]),
step_type = tf.compat.v2.Variable([[tf.compat.v2.Variable(tf_agents.trajectories.time_step.StepType.FIRST),tf.compat.v2.Variable(tf_agents.trajectories.time_step.StepType.MID),tf.compat.v2.Variable(tf_agents.trajectories.time_step.StepType.LAST)]]),
observation = tf.compat.v2.Variable([[tf.compat.v2.Variable(observe),tf.compat.v2.Variable(observe),tf.compat.v2.Variable(observe)]]),
policy_info = tf_agent.policy.info_spec,
next_step_type = tf.compat.v2.Variable([[tf.compat.v2.Variable(tf_agents.trajectories.time_step.StepType.MID),tf.compat.v2.Variable(tf_agents.trajectories.time_step.StepType.LAST),tf.compat.v2.Variable(tf_agents.trajectories.time_step.StepType.LAST)]]),
discount= tf.compat.v2.Variable([[tf.dtypes.cast(1, tf.float32),tf.dtypes.cast(1, tf.float32),tf.dtypes.cast(1, tf.float32)]]),

)```the experience but after 2 days i think the error is not here
tf_agent = tf_agents.agents.ReinforceAgent(
    time_step_spec = time_step_spec,
    action_spec = tf_agents.specs.tensor_spec.from_spec(Tensod_spec),
    actor_network=actor_net,
    optimizer=optimizer,
    normalize_returns=True,
    train_step_counter=train_step_counter
)```i belive the error is in this train_step_counter
but i dont know wat to place here
tried fixed numbers to no god nor int nor float
velvet thorn
iron basalt
Yes, but only because the companies allow them / don't care. If they wanted to t...
on what basis
iron basalt
velvet thorn
on what basis
The license for most games let's you only use them the want they want you to use the game. So it would break EULA (no license to stream the game, same with what happened recently with music in games on twitch).
It's legal gray area.
velvet thorn
iron basalt
The license for most games let's you only use them the want they want you to use...
so I don't work in law any more
and of course it varies between jurisdictions
but I would tend to believe
that in general there are common law/statutory exceptions to the ambit of copyright
there certainly are where I'm from
willow quarry
make new country were any product you paid for you can stream
and live reciving money of big servers streaming stuf
iron basalt
There is "free-use", and it's slowly getting expanded in the US, but right now you are at the mercy of the big companies here.
velvet thorn
and I'm fairly sure that at best it's unsettled whether streaming a game, in particular, constitutes copyright infringement
do you mean fair use?
iron basalt
yes
velvet thorn
no
I'm not talking about fair use
fair use is a doctrine that basically says "this act would normally be copyright infringement, but for public policy reasons, it is not"
I am questioning whether streaming is an act that constitutes copyright infringement at all
willow quarry
the thing is streaming people watching are not playing it
but now there wa a chanel that alowed peoplhe to play pokemon for 6 mins on twotch
twitch so its even more complicated now
iron basalt
I think it does, just no action has been taken by the companies, but of course it then depends on the outcome of whatever the courts decide then. Right now it's like a cease-fire.
velvet thorn
iron basalt
I think it does, just no action has been taken by the companies, but of course i...
source?
iron basalt
It's my opinion.
velvet thorn
so, just curious; are you an IP lawyer or otherwise legally trained?
iron basalt
But I don't know of anything that says it's not, so it's a big maybe.
iron basalt
No, and I would like to learn otherwise if you know anything, please dm me.
velvet thorn
I'm not an IP lawyer either, and it's been a while since law school/working in a law firm, and of course the US scene could be different
iron basalt
I'm just suggesting to make their own game since can't go wrong there.
velvet thorn
I'm just sceptical that copyright would be that restrictive in the US (regarding being able to shut down Twitch legally)
velvet thorn
iron basalt
I'm just suggesting to make their own game since can't go wrong there.
honestly
in some ways that could be more problematic
patent trolls 🤔
but either way I don't think anyone will mind, it's a big world, and a small project
iron basalt
That is true, it just feels like the attention is on copyright now for Twitch specifically.
grave frost
you could do almost anything and I doubt a company would care.
willow quarry
@velvet thorn so year i think @iron basalt is right but the enterprises doesnt want to fight against free divulgation
grave frost
unless you are some big streamer, in which case theyd probably sponsor you
willow quarry
and nor want players upset
grave frost
They just don't care about what you are doing
nobody does tbh - only if you would become famous (very)
velvet thorn
iron basalt
The license for most games let's you only use them the want they want you to use...
it does depend on the EULA
but also you can't compare music to games because they're different media
in the case of music it's clear that it's a public performance, which is normally part of copyright
grave frost
Audio processing newbie - why don't we have more pre-trained models for audio spectrograms? Quick search only yields MagentaCNN. Do these weakly supervised models not generalize enough to new audio spectrograms?
velvet thorn
on the other hand, games are usually considered written media (source code), and the nature of public performance is a lot mroe grey
velvet thorn
grave frost
Audio processing newbie - why don't we have more pre-trained models for audio sp...
my guess is
lack of interest
computer vision is currently hot
like even within CV
you see very little (relatively) stuff relating to animals
(I had occasion to work on such a project once)
velvet thorn
willow quarry
<@!171929073063297024> so year i think <@!119925597395877889> is right but the ...
what is divulgation
grave frost
hmm...so that's why spotify recommendations suck
velvet thorn
grave frost
hmm...so that's why spotify recommendations suck
I don't think they use feature-based models?
grave frost
velvet thorn
I don't think they use feature-based models?
I think they do
velvet thorn
really?
grave frost
it presents me the same ones irrespective of the time atleast
velvet thorn
how do you know
grave frost
most prob hybrid
velvet thorn
grave frost
it presents me the same ones irrespective of the time atleast
I don't understand the relevance of this
grave frost
my bet
iron basalt
velvet thorn
in the case of music it's clear that it's a public performance, which is normall...
Interesting, thanks.
grave frost
velvet thorn
I don't understand the relevance of this
I meant more towards user's habits/behavioral approach
velvet thorn
like I would say a sufficiently powerful feature-based model would be the future but I have no idea how to get there
grave frost
whatever technical term there is for that
velvet thorn
okay
I mean like
I imagine
Spotify's approach is largely or purely collaborative filtering-based
grave frost
take FMA, get mel spectrograms, pre-train some CNN, profit
velvet thorn
i.e. two identical tracks with different user activity patterns would yield different recommendations
grave frost
hybrid - both
willow quarry
velvet thorn
what is divulgation
more people will know about
velvet thorn
willow quarry
more people will know about
what language is that
velvet thorn
grave frost
hybrid - both
yeah, so I would say at best largely collaborative filtering
but
I wouldn't be surprised if you were right
or at least
grave frost
you would still need a lot of behavioral info on some user to cluster them accurately, but Google and FB might have enough
velvet thorn
research is being done?
willow quarry
velvet thorn
what language is that
the wrong one for sure
grave frost
velvet thorn
research is being done?
thas what I am asking
I couldn't find much from googling
velvet thorn
I would think
something like a
Siamese network-based approach
could work quite well for a proof of concept?
actually
I'm p sure
there should be some sort of approach
grave frost
actually, its quite a good reasearch topic tbh
grave frost
dunno if there is - I just say spectros, mel-spectros to be the most popular feature representation
You could train another network to optimize/learn vectors with tandem another to produce effecient ones?
velvet thorn
I mean
just apply the same principles
as we do already in NLP, for example?
shrugs
okay interesting topic but work time
grave frost
I said the same thing to my supervisors - but I don't think they got me fully
would be good for experimentation
and if not - then arxiv is always open for more dumb pubs by idiots like me
 rotund dagger
im working on my first nlp. basically i read in 12 book .txt files(4 books each from 3 diffrent authors). then will pass in a 13th book that is written by one of the authors, but which is unkown. and try to predict which of the 3 authors wrote it. the trouble i am having is figuring out how to read in the 12 books in an efficient way. it seems wrong to read in each book and store it in its own variable. then i thought about storing each book in a list for each author. but im not sure if there is a better way to do this for nlp. is anyone available?
grave frost
just extract the top 512 tokens from each doc, and fine-tune BERT to predict the author with the corresponding labels
rotund dagger
i will have to look up BERT.
thank you for getting back to me on that i will see if i can leverage your information.
 naive sleet
question, can dense MLP be pruned? I used l1_unstructured and it gave out a larger model
lean ledge
naive sleet
question, can dense MLP be pruned? I used l1_unstructured and it gave out a larg...
yes, it can be pruned. uh giving out a larger model shouldn't be possible
how are you measuring larger?
naive sleet
lean ledge
yes, it can be pruned. uh giving out a larger model shouldn't be possible
oh I just saved the state_dict and compare filesize
willow quarry
some more hours and i am still stuck on wy the hell RL.train needs global step
naive sleet
import models.tailornet_model as tnm
import torch
import torch.nn.utils.prune as prune

r = tnm.get_best_runner()
model = r.ss2g_runner.model
torch.save(model.state_dict(),'before.torch')

pruned = []
for name, module in model.net.named_modules():
    if (isinstance(module, torch.nn.Linear)):
        print('Pruning module...')
        module = prune.l1_unstructured(module,'weight',amount=0.3)
    pruned.append(module)
model.net = torch.nn.Sequential(*pruned)
torch.save(model.state_dict(),'after.torch')
before = 12MB; after = 24MB
 hard canopy
Prunes tensor corresponding to parameter called name in module by removing the specified amount of (currently unpruned) units with the lowest L1-norm. Modifies module in place (and also return the modified module) by: 1) adding a named buffer called name+'_mask' corresponding to the binary mask applied to the parameter name by the pruning method. 2) replacing the parameter name by its pruned version, while the original (unpruned) parameter is stored in a new parameter named name+'_orig'.
the original (unpruned) parameter is stored in a new parameter named name+'_orig'.
skimming the doc, i think you just need to delete the weight_orig key
maybe weight_mask too
naive sleet
hard canopy
> Prunes tensor corresponding to parameter called name in module by removing the...
ah thank you!
 ruby magnet
Hey everyone, question. What does this error mean? I am trying to find an f1 score for a dataset and I am not sure why im getting this:
Target is multiclass but average='binary'. Please choose another average setting, one of [None, 'micro', 'macro', 'weighted'].
This is my code so far:
`import pandas as pd
import matplotlib.pyplot as plt
import seaborn as sns
from sklearn.model_selection import train_test_split
from sklearn.linear_model import LogisticRegression
from sklearn.metrics import f1_score
df0=pd.read_excel("C:/Users/ymaxn/Documents/Python Data Mining/assignment8.xlsx")
import seaborn as sns
df=df0.drop("University name",axis=1)
x=df.drop("Grad.Rate",axis=1)
y=df["Grad.Rate"]
#train
x_train,x_test,y_train,y_test=train_test_split(x,y,test_size=0.3,random_state=42)
lm=LogisticRegression(solver="liblinear")
lm.fit(x_train,y_train)
y_pred=lm.predict(x_test)
#f1_score
f1_score(y_test,y_pred,average='micro')
`
 arctic wedgeBOT
Here's how to format Python code on Discord:
```py
print('Hello world!')
```
These are backticks, not quotes. Check this out if you can't find the backtick key.
velvet thorn
ruby magnet
Hey everyone, question. What does this error mean? I am trying to find an f1 sco...
that don't look right
are you sure the error is coming from those lines
 hollow sentinel
ah yes good 'ol sklearn
 lusty iron
ruby magnet
This is my code so far:
`import pandas as pd
import matplotlib.pyplot as plt
imp...
lusty iron
ruby magnet
This is my code so far:
`import pandas as pd
import matplotlib.pyplot as plt
imp...
post the output of this
import numpy as np
np.unique(y.values)
naive sleet
hard canopy
> Prunes tensor corresponding to parameter called name in module by removing the...
Comparing pruned t-shirt_female
l1_unstructured('weight',0.3)

Before:
Load time: 0.7036072339979
Total size: 1892.7453804016113MB

After:
Load time: 0.007862821999879088
Total size: 1.9554157257080078MB
This is the output of
np.unique(y.values)
Out[59]: array([ 10, 15, 18, 21, 22, 24, 26, 27, 29, 30, 31, 32, 33, 34, 35, 36, 37, 38, 39, 40, 41, 42, 43, 44, 45, 46, 47, 48, 49, 50, 51, 52, 53, 54, 55, 56, 57, 58, 59, 60, 61, 62, 63, 64, 65, 66, 67, 68, 69, 70, 71, 72, 73, 74, 75, 76, 77, 78, 79, 80, 81, 82, 83, 84, 85, 86, 87, 88, 89, 90, 91, 92, 93, 94, 95, 96, 97, 98, 99, 100, 118], dtype=int64)
naive sleet
Wow the result is astounding
lusty iron
sorry for the sillyness, just wanted to check that you had a multiclass problem
ruby magnet
lol no its cool, im still very new to this. I might be approaching the problem the wrong way in the first place.
ruby magnet
y_pred.shape Out[60]: (234,)
lusty iron
lets also get the unique as well
oh, I am being silly
LogisticRegression is only for binay classification
nvm
ruby magnet
Am i using the wrong model?
lusty iron
well, I am looking at the LogisticRegression docs, looks like it takes care of multi class for you
I rarely use lr, hardly look at it
maybe experiment with different averaging strategies with f1
what is odd is that micro should work
lusty iron
:/
lapis sequoia
Hello
ruby magnet
LOL sorry
lusty iron
all good
ruby magnet
is it cool if i explain my whole problem? Then yall can let me know if im heading in the right direction?
lusty iron
well, I can try.
ruby magnet
🙂
i have a dataset with a large number of columns and I need to use KMeans to find the clusters and interpret them. I was initially thinking of using PCA, but not sure if I should just be finding the clusters between 2 variables and analyzing them.
i can plug what the dataset looks like if that helps
lusty iron
this is for a class project right?
ruby magnet
ye, i just need to know which direction to head lol, not going to ask for answers to the code
is that allowed here?
lusty iron
so I would not use PCA be4 clustering......
I recall there are ways of evaluating clustering
I would look at different clustering algo, find one with the hyper-parameter that will have the least average in-cluster euclidean distance distant
scikit learn has a whole family of Clustering metrics, I have not read alot into that topic
but it sounds like your teacher wants you to compare the input data with the cluster by eye, to see if there is a human interpretable pattern
ruby magnet
okay thanks! i will look into it.
Yeah that is what he wants. I am just not sure how many comparisons i have to make. The way it was showed to use was comparing 2 different variables, but rn he provided 17 variables, so I am not sure how many cluster charts i need to look at
 cloud ledge
Hey all - long time no see. Have an interesting question. I need to use Tensorflow on a Docker Image to dynamically run some AI things I built for testing, but Tensorflow is 830MB on my Images.
Is there a way to reduce the size of the pip install?
I've used this for other packages like Pystan to cut the size in half:
  && export CXXFLAGS="$CXXFLAGS -Os -g0 -Wl,--strip-all -I/usr/include:/usr/local/include -L/usr/lib:/usr/local/lib"```
```# Install the Requirements
RUN pip install --no-cache-dir --global-option=build_ext tensorflow==2.3.1```

But I get the following error:
```#12 1.383 /usr/local/lib/python3.8/site-packages/pip/_internal/commands/install.py:230: UserWarning: Disabling all use of wheels due to the use of --build-option / --global-option / --install-option.
#12 1.383   cmdoptions.check_install_build_global(options)
#12 1.679 ERROR: Could not find a version that satisfies the requirement tensorflow==2.3.1
#12 1.679 ERROR: No matching distribution found for tensorflow==2.3.1```

Of course, running pip install tensorflow==2.3.1 works fine...is it wrong to call eval() before dynamic quantization (pyTorch)?
ss2g_model.net.eval()
ss2g_model.net = torch.quantization.quantize_dynamic(
ss2g_model.net, {torch.nn.Linear}, dtype=torch.qint8)
 willow quarry
if anyone has the time

Stack Overflow
After days Trying to mount one RL agent and finaly sucesful created some experience and then i try to train it and i get this error. tried all i could diferent experience change step params i am ju...
i belive it may be a problem inside tensorflow
willow quarry
 dapper halo
isnt los decai a good thing???
dapper halo
willow quarry
isnt los decai a good thing???
As far as I know haha. Im just not familiar with what all the shapes might suggest. Obviously trying to minimize loss just didnt know if it decaying almost instantaneously signified any kind of issue.
willow quarry
it may be that you have to many neurons for a simple task so it optmises quickly but uses ton of space
dapper halo
Yeah thats where my mind went. Although regardless of one layer, two layers, and all the variations in nodes i've thrown at it the shapes are fairly similar just a different steady state value
is what it is I guess🤷♂️
willow quarry
what is the task ??
naive sleet
naive sleet
```
Comparing pruned t-shirt_female
l1_unstructured('weight',0.3)
Before:
Load ...
mfw it removes everything cuz weight_mask is 1 for everything💩
dapper halo
regression
willow quarry
actualy
i think the problem is that your loss starts REALY high
the everage start loss is 0.50 for tasks of yes or no
if you cut the start of the graph it might make more sense
 stiff barn
If anyone is looking for a good intro into the math around ML, I've been enjoying this so far. https://www.essentialmathfordatascience.com/. If you've studied calc, algebra, and stats before it's pretty easy to get going with it.
Essential Math for Data Science
Build your data science and machine learning skills by learning the math behind.
uncut kindle
this book is also great
 lusty iron
well, I have been reading Mathematics for Machine Learning https://mml-book.github.io/. I am 4 chapers in(a few months a chapter). The Book is ok, just makes me realize how arbitrary a lot of mathematics is. When you realize that dot product is just a way of transposing some of the properties of multiplication of scalars to matrices.
Mathematics for Machine Learning
Companion webpage to the book “Mathematics for Machine Learning”. Copyright 2020 by Marc Peter Deisenroth, A. Aldo Faisal, and Cheng Soon Ong. Published by Cambridge University Press.
lean ledge
willow quarry
the everage start loss is 0.50 for tasks of yes or no
That's accuracy not loss. There's no average start loss value, it depends entirely on how you formulate the problem
willow quarry
so for everyone out here trying to do RL
with tensorflow
just use dnqagent
tf_agents.agents.DqnAgent
it is not perfect but is way easyer and les bugy also erros are useful
lean ledge
If only RL was as simple as using a dqn agent
grave frost
Just a weird thing I have noticed - theoretically, why does decomposing a 300-Dim word vector down to 299 with PCA lead to overfitting, when with the 300-D the model was just about underfittting?
grave frost
lusty iron
well, I have been reading Mathematics for Machine Learning https://mml-book.gith...
how arbitrary a lot of mathematics is. When you realize that dot product is just a way of transposing some of the properties of multiplication of scalars to matrices
That...is the only way you can multiply vectors. And machine learning doesn't comprise of just dot products for matrices - there is waay more in there. I also don't see how the mathematics in ML is arbitrary - ML is mathematics and logic. There isn't anything magical about it
desert oar
grave frost
> how arbitrary a lot of mathematics is. When you realize that dot product is ju...
Yeah this is not a good characterization of algebra imo
But I appreciate the "wow that's cool!" intent behind it
Abstract math and algebra can be mind-blowing and very "unifying" across concepts
If you have the chance to learn about groups and rings it can be very enlightening
Same with basic topology
uncut kindle
hello calculus for simulated annealing. where your goal is to find the lowest point for loss function reduction
willow quarry
lean ledge
If only RL was as simple as using a dqn agent
just a friendly tip of a guy that has spent a week creating an environment and lost 3days with a bronken agent
lean ledge
grave frost
> how arbitrary a lot of mathematics is. When you realize that dot product is ju...
It's not the only way you can multiply vectors. Tensor products and hadamard products are a thing, plus cross products and wedge products
lean ledge
lusty iron
well, I have been reading Mathematics for Machine Learning https://mml-book.gith...
"Dot product" goes a lot deeper than just transposing. It's worth taking a proper maths course in linear algebra, none of this "maths for ML" crap
grave frost
willow quarry
just a friendly tip of a guy that has spent a week creating an environment and l...
DQN works with simple environments only tho - like atari games
willow quarry
for the others we got bether agents the problem is i am facing a bug i belive even posted os the git
i was actuali using RL agent
he had an awesome output
grave frost
what agent were you using previously?
 analog cave
hi I'm working with 2 graphs, which involve feature engineering, where acceleration is measured where graph 1 represents raw data, however graph 2 represents extracted features.. but i don't understand the difference between both plots? from my understanding, extracted features are the most important data points, but what makes those specific data points important? could someone please explain this, thank you.
 bitter parrot
Hello #data-science-and-ml , I am relatively new to ML and I have a pet project I'd like to try some ML techniques on. My goal is to create an object that continuously searches an area for targets, and succeeds when a target is found. The algorithm fails if it leaves the area, or if it doesn't find a target within a given time limit. A bit of research indicates Reinforcement Learning might be a good route, and possibly some sort of genetic evolution to figure out what the best 'strategy' for finding targets in the area is.
I want to start simple / small at first, and slowly add features that allows my model to optimize its search. For example, in the beginning I may only allow course changes, however once I have that working I may extend it to allow speed changes as well
 empty patio
https://colab.research.google.com/drive/160fDTM_k13WJyKCGap9N7KrrG_fpE3Er?usp=sharing What am I doing wrong here ? Why are my plot3d() render black ?

 arctic crown
is anyone here good with nlp?
 uncut barn
is this 2 or 3 hidden layers?
 uncut kindle
@arctic crown depends. NLP is implemented differently in each language. what are you having trouble with?
arctic crown
uncut kindle
<@!828826828847710249> depends. NLP is implemented differently in each language....
i want to implement english
uncut kindle
nltk should get you covered for most cases. what's the issue?
arctic crown
i just dont know how to add it in my program
uncut kindle
what is your program trying to do? what's the goal?
arctic crown
personal assistant
its like google mini, alexa
or jarvis
but it doesent have any ml
or nn
just a bunch of elif
@uncut kindle
uncut kindle
maybe look into chatbot api

Google Cloud
Easily add likelife conversational AI to your websites, applications, messaging platforms, and contact center with intuitive, advanced virtual agents.
uncut kindle
please be more specific re: which part you need to add NLP
do you mean "parsing human input"?
arctic crown
yes
uncut kindle
you need speech recognition and syntax parsing. both are not easy to accomplish. if you're talking about sth like Siri, Alexa or Google Now, I'm afraid it'll be very hard to make one from scratch
or maybe try to find an API that does voice recognition for you. but you'll have to say the exact same sentence and use that if/else condition
arctic crown
hmm
i have

that
i want it so it knows when i am asking it to read the note
and when to write the note
uncut kindle
this is logic problem (in addition to NLP)
so maybe get your code working without speech input first. once that works replace text with voice input

 uncut kindle
somehow you'll need to teach computer to learn that:
- find new movies
- find something interesting
mean the same thing: recommend movies
and this involves linguistics
arctic crown
mhmm
uncut kindle
even for voice recognition alone, you'll need to have a lot of voice samples to train the model to recognize the speech. even so to these days most voice recognition doesn't work well with regional accents
this doesn't even involve syntax parsing
so if you want to go ahead with your project, maybe start from finding a service that'll transcribe voice to text
arctic crown
speech reco?
uncut kindle
essentially
arctic crown
i use that
uncut kindle
great! so what's the issue again?
arctic crown
pharising
uncut kindle
so you want your script to, say, recognize "I'm working" and "I'm busy" as "do not disturb"?
arctic crown
lol not that smart
uncut kindle
Natural Language Processing - Syntactic Analysis - Syntactic analysis or parsing or syntax analysis is the third phase of NLP. The purpose of this phase is to draw exact meaning, or you can say dictionary meanin
arctic crown
do you know how to?
uncut kindle
any reason you want to do it youself?
arctic crown
its paid
"i have school tomorrow" or "i need to pick up the groceries" as "reminder"
uncut kindle
if you can't cram at least linguistics, especially semantics and syntax then please save yourself time and use api
it takes years for people to be proficient in linguistics enough that they can come up with algos to parse natural human syntax
uncut kindle
For all those people who find it more convenient to bother you with their question rather than to Google it for themselves.

 simple linden
Hey
so guys i have a quick question
what is the best way to transform a pdf made of tables ( imported as images ) into an excel file
uncut kindle
if the said pdf contains images inside (ie: a scan) then you're out of luck 😦
simple linden
i thougt i could use OCR to make it an editable text
the images are basically screenshots of data tables including numbers and id's
uncut kindle
ocr yes. but tough if you also want to parse table structure
even pdf straight from ms word can't get merged column headers parsed
simple linden
got it ! thank you man
 grave frost
@arctic crown what are you trying to do?
arctic crown
add nlp
grave frost
arctic crown
none
wdym?
arctic crown
i havent added it yet
grave frost
if you are trying to do NLP and don't know how, I recommend you do a course on Udemy
it has great basics for NLP and transfer learning
grave frost
even if I did, the project is yours lol
arctic crown
can you help me with it please
grave frost
what is the task you are doing?
 atomic gull
Sad to say, I got some homework questions related to data mining which I can not figure out on my own. So what suitable evaluation method for this problem?
are 20 attributes and one label class. The number of instances is 1000000. The values
of class are raining and not raining.
I wrote Naive Bayes, but apparently that is wrong
A friend said random forest or decision tree would be better. But I'm not sure on it
 toxic sluice
How do I append a 1D array to a 2D numpy array column wise? Say I have two arrays with shapes (1000, 3) and (1000, ) - I want to produce an array of shape (1000, 4).
For example given:
np.array([[1, 2, 3],
          [5, 6, 7]])
and
np.array([4, 8])
I want to produce
np.array([[1, 2, 3, 4],
          [5, 6, 7, 8]])
@atomic gull I think it means "accuracy measurement" https://www.pluralsight.com/guides/evaluating-a-data-mining-model
Pluralsight Guides
atomic gull
no no, not the implementation
but how to choose what model to use
Naive bayes, decesion tree, KNN, etc etc
uncut kindle
do you happen to know the correct answer?
uncut kindle
there are multiple ways to approach this. you can use a few different models with different caveats
but generally if you say evaluation I'll be thinking of error measurement. some problems it's better to use median standard error, some mean squared error. etc.
atomic gull
hmm not in that sense
uncut kindle
was a reason provided why NB is wrong?
atomic gull
no reason provided, but my peers said that NB runs slow on a lot of attributes
therefore another model would be better suited
uncut kindle
it's one of the simplest algo. it's very fast. unlike tree-based models where it takes much longer
uncut kindle
hmmm this?
 atomic gull
hmm no

the answer is supposed to be different models
regressional, or classification
decision tree or neural network or NB etc etc
uncut kindle
lemme give you an example. if it's prediction problem (eg. predict a value from input x, y, z), I could use regression or random forest regressor. if the data distribution is normal, I'd go with regression since it's simpler. but if the data is skewed I'll go with random forest, since it doesn't take penalty for skewed data
so if you ask me, it's poor questions to begin with
NB is considered to be classification algo. Trees can be both regression or classification
maybe zoom out a bit 😉
 sudden delta
my problem is i have 24-bit color data (let's say a numpy uint8 array of [R, G, B] elements) and want to reduce it to 8-bit color data (uint8 array of RRRGGGBB), there's no clear way to do this with numpy without running a Python function over each element which is slow. any ideas besides mixing in some native speedups?
 pine wolf
there's probably a way to do this with stride tricks, but it will take me some trial and error to figure it out
but something like this:
In [20]: import numpy as np
    ...: from numpy.lib.stride_tricks import as_strided
    ...: rgb = np.array([0, 127, 255], dtype=np.uint8)
    ...: as_strided(rgb, shape=(8, ), strides=(np.dtype(np.uint0).itemsize, ))
Out[20]: array([ 0, 67, 32, 66, 32, 65, 61, 64], dtype=uint8)
no idea if this is correct
but that's the idea
 fickle sinew
is there a reason you need to do this with numpy ?
PIL is the right tool for that job, especially if you are concerned about performance
iron basalt
Something like:
>>> import numpy as np
>>> rgb = np.array([[55, 143, 255], [0, 0, 100]], dtype=np.uint8)
>>> rgb
array([[ 55, 143, 255],
       [  0,   0, 100]], dtype=uint8)
>>> r = rgb[:, 0]
>>> r
array([55,  0], dtype=uint8)
>>> g = rgb[:, 1]
>>> g
array([143,   0], dtype=uint8)
>>> b = rgb[:, 2]
>>> b
array([255, 100], dtype=uint8)
>>> res = np.concatenate((r, g, b))
>>> res
array([ 55,   0, 143,   0, 255, 100], dtype=uint8)
>>>
sure, if PIL can handle a 1d stream of colors for a point cloud
iron basalt
Is that what was meant?
sudden delta
def downsample_rgb_24_8(c):
    """Downsample 24-bit RGB to 8-bit truecolor RGB.

    Output is RRRGGGBB
    """
    r = int(c[0] / 32)
    g = int(c[1] / 32)
    b = int(c[2] / 64)
    return b | (g << 2) | (r << 5)

image = np.array([
    [0, 0, 0],
    [255, 0, 0],
    [0, 255, 0],
    [0, 0, 255],
], dtype=np.uint8)
print(image)

downsampled = np.fromiter((downsample_rgb_24_8(c) for c in image), dtype=np.uint8)
print(downsampled)

"""
[[  0   0   0]
 [255   0   0]
 [  0 255   0]
 [  0   0 255]]
[  0 224  28   3]
"""
Ah, ok
>>> img = np.array([
...     [0, 0, 0],
...     [255, 0, 0],
...     [0, 255, 0],
...     [0, 0, 255]
... ], dtype=np.uint8)
>>> img
array([[  0,   0,   0],
       [255,   0,   0],
       [  0, 255,   0],
       [  0,   0, 255]], dtype=uint8)
>>> r = img[:, 0] // 32
>>> r
array([0, 7, 0, 0], dtype=uint8)
>>> g = img[:, 1] // 32
>>> g
array([0, 0, 7, 0], dtype=uint8)
>>> b = img[:, 2] // 64
>>> b
array([0, 0, 0, 3], dtype=uint8)
>>> rgb8 = b | (g << 2) | (r << 5)
>>> rgb8
array([  0, 224,  28,   3], dtype=uint8)
>>>
i see, now we're thinking with vectors..
iron basalt
You can make it a single liner.
sudden delta
thank you, a whole new world of numpy is in view..
iron basalt
Numpy's operator overloads work element-pair wise.
pine wolf
can kinda cheat with packbits
In [36]: img = np.array([
    ...:     [0, 0, 0],
    ...:     [255, 0, 0],
    ...:     [0, 255, 0],
    ...:     [0, 0, 255],
    ...:     [255, 255, 255],
    ...: ], dtype=np.uint8)

In [37]: np.packbits(img, axis=-1)
Out[37]:
array([[  0],
       [128],
       [ 64],
       [ 32],
       [224]], dtype=uint8)
packbits is not suppose to work with non-binary values as input right? So what is it doing?
pine wolf
it works with integer arrays too
sudden delta
that does not produce the expected output
iron basalt
pine wolf
it works with integer arrays too
Yeah but don't they need to be 1 or 0?
pine wolf
no
iron basalt
Not sure what the docs mean then by "binary-valued array"
I assumed they meant 1 or 0, based on the example and that it could also take an array of booleans.
sudden delta
what it's doing is treating any non-zero value as a 1
iron basalt
Does packbits just check if > 0?
pine wolf
probably just checks if nonzero
sudden delta
which is interesting but not what i had in mind
pine wolf
you can unpackbits first though
sudden delta
also interesting, maybe clever strides over the unpacked stream would be useful
pine wolf
that's what i'm trying atm
grave frost
arctic crown
personal assistant
how are you using NLP in that?
pine wolf
i'm not sure you can stride, at least i don't know of a nice way to do it since the strides are uneven, but i guess you could just slice normally 3 times:
In [55]: unpacked[:, :3], unpacked[:, 8:11], unpacked[:, 16:18]
Out[55]:
(array([[0, 0, 0],
        [1, 1, 1],
        [0, 0, 0],
        [0, 0, 0],
        [1, 1, 1]], dtype=uint8),
 array([[0, 0, 0],
        [0, 0, 0],
        [1, 1, 1],
        [0, 0, 0],
        [1, 1, 1]], dtype=uint8),
 array([[0, 0],
        [0, 0],
        [0, 0],
        [1, 1],
        [1, 1]], dtype=uint8))
and put it back together, the upside is that these are views so no new arrays have been created
besides the unpacked array
oh yeah,
In [68]: def downsample(bit24):
    ...:     return np.packbits(
    ...:         np.unpackbits(bit24, axis=-1)[:, [0, 1, 2, 8, 9, 10, 16, 17]]
    ...:     )
    ...:

In [69]: img
Out[69]:
array([[  0,   0,   0],
       [255,   0,   0],
       [  0, 255,   0],
       [  0,   0, 255],
       [255, 255, 255]], dtype=uint8)

In [70]: downsample(img)
Out[70]: array([  0, 224,  28,   3, 255], dtype=uint8)
is this expected output
grave frost
atomic gull
most probably a DNN seeing the number of instances
its like they are basically begging you to give that
kill me if I am wrong tho
sudden delta
pine wolf
is this expected output
doesn't quite work when testing against img = np.arange(8*8*3, dtype=np.uint8).reshape(64, 3)
expected
[  0   0   0   0   0   0   0   0   0   0   0  36  36  36  36  36  36  36
  36  36  36  41  73  73  73  73  73  73  73  73  73  73 109 109 109 109
 109 109 109 109 109 109 110 146 146 146 146 146 146 146 146 146 146 150
 182 182 182 182 182 182 182 182 182 182]
downsample()
[  0   0   0   0   0   0  32  32  32  32  32  68  68  68  68  68 100 100
 100 100 100 105 137 137 137 137 137 169 169 169 169 169 205 205 205 205
 205 205 237 237 237 237 238  18  18  18  18  18  50  50  50  50  50  54
  86  86  86  86  86 118 118 118 118 118]
maybe start at 0
pine wolf
that's a pretty neat solution though, filed away
still makes two new arrays in memory
the other solution made 4 i think
won't be much of a difference at this scale though
also have no idea how fast unpack and pack are
sudden delta
vectorized about 3x faster on a 128*128
in practice will be chunking 18k points at a time
enough to need more speed but not enough to need less memory
sub-millisecond either way
pine wolf
well, initializing new arrays is the slowest part of numpy usually, which is why i brought it up, not because of the memory
numpy has to find contiguous blocks of memory and do whatever with it
there's probably functions written specifically for this in scipy.ndimage
which is part of the numpy ecosystem
sudden delta
nothing jumped out at me in scipy, they would probably say "just use PIL"
or opencv
pine wolf
i guess i see nothing for colors in ndimage either
sudden delta
and i have a hunch if i found it in scipy it would look much like the vectorized solution
thanks for the lesson in numpy bitpacking
pine wolf
what you can do to optimize the vectorized version, is keep some arrays initialized and use them as buffers for your operations
all numpy ufuncs i think have an out= parameter so you can reuse the same arrays
this for the arrays you create in the intermediate steps
don't know if it matters for your use-case
but if you need to squeeze out anymore speed, it's something you can try
sudden delta
it turns out anything is OOM faster than iterating the points with a Python function, though maybe part of that was using bit-shifting instead of multiplication
nope, not much difference
pine wolf
python loops are famously slow
sudden delta
downsampled purely in 0.11731505393981934s
downsampled quickly in 0.00028061866760253906s
as expected
that's a really big improvement
i think unpack might be really slow since it creates an array 8x the size of the original
grave frost
I just learned Fourier Transform - but I still don't get how you can use an integral over discrete values. correct me if I am wrong, but isn't the underlying assumption that signal function is continuous? how does a computer accomplish it discretely then?
lean ledge
Discrete signals use the discrete Fourier transform which is a sum not an integral
The theory is almost identical
lean ledge
There's:
Fourier transform
Fourier series
Discrete Fourier transform
Discrete time Fourier transform
Cosine transform
Sine transform
Laplace transform
Z transform
Wavelet transform
Maybe a few more here and there
grave frost
well, thank god I don't have to do them all
I just have to get up to Mel-spectrograms. after that , Im bailin'
 red hound
Do you know any precise methods to figure out, if my code (numpy or tensorflow) is executed on GPU or CPU and if its using Float32 or Float64?
If possible i would like to check at runtime as "gpu availability" doesn't need to mean its executed on gpu aswell
grave frost
it would be using 32 by default, and you can check GPU usage with nvidia-smi
red hound
the info about the default is useful. My problem with nvidia-smi ist, that ists just for the moment, when my script just run for like 2 seconds
iron basalt
grave frost
I didn't even know discrete FT was a thing
Your computer can't compute infinite things. You either need an exact analytical solution, or approximation. And sums are approximate for this.
(just like how you start out when learning calculus, approximate integrals with the rectangles under the curve)
(Ofc there are many details to getting a good approximation)
(And numerical stability)
(etc)
 tidal bough
I mean, that's not even really the reason - DFT isn't an approximation of FT, it is just for sequences what FT is for functions
since signals are discrete, you need DFT for them
iron basalt
Yeah I did not really read the comment chain well enough, I was thinking general (numeric) integration on a computer. Should have payed more attention.
 modest bone
is anyone familiar with the face_recognition library? I'm having some small troubles
 modest jungle
Is pyspark.streaming.kafka deprecated? If yes, then is there any workaround?
atomic gull
grave frost
~~kill me if I am wrong tho~~
I will reply once I get the answer, could take some days/weeks
 tender sapphire
- Problems on Text/image using Machine learning and Deep learning.* Any suggestions what/how to start with ?
grave frost
I agree, it does kinda seem like Intel Marketing Bullshit

reddit
433 votes and 85 comments so far on Reddit
 granite wolf
anyone know what's going on here?

i was expecting an 'r' shape as k increases the r2 score begins to tail off?
215 is the max number of my feature columns
if i use a significantly lower number than 215 like 160 i get the expected graph shape:

 hard frost
model = Sequential()
model.add(LSTM(128, return_sequences=True ,input_shape=(train_X.shape[1], train_X.shape[2])))
model.add(Dropout(0.2))
model.add(LSTM(64))
model.add(Dense(1, activation = 'relu'))
model.compile(optimizer='adam', loss='mse', metrics = ['accuracy'])
history = model.fit(train_X, train_Y, epochs=200, batch_size=128, validation_data=(test_X, test_Y), verbose=2)
Hi community, This is a LSTM model in python and this is the predicted result. It seem like my model cannot predict well when fit in the real world data, so what should I do to enhance model accuracy ?

it get the flat value instead of up and down
 sullen hull
When I use an LSTM with keras I only get one value, is there a built in way to output several or do i need to then put in the next.
For example can I put [1,2,3] and get roughly [4,5,6] as an output, or do i need to put [1,2,3] with result of x and then put [2,3,x] result y [3,x,y] and then output z so we have [x,y,z] which is roughly again [4,5,6]
hard frost
??
sullen hull
Different question not an answer to you
lean ledge
sullen hull
When I use an LSTM with keras I only get one value, is there a built in way to o...
Look up "lstm many to many"
Or seq2seq
sullen hull
ty
 hard hound
Hey
 modern phoenix
in pandas, how can I aggregate values on dup rows like: [[1, a, 1], [1, a, 4], [1, b, 1], [1, b, 3], ...] -> [[1, a, 5], [1, b, 4], ...]] ?
basically sum col 3 for unique cols 1-2
or is there another channel for pandas?
oh I got it, df.groupby(["col1", "col2"]).sum("col3")
hard hound
@modern phoenix hey for small function finding you could use stack overflow
modern phoenix
@hard hound I tried but I wasn't sure how to formulate my question to best find a response
hard hound
oh Well it happens with me too all the time
modern phoenix
🙂
I have a visualization question as well
I have 800 entities that sometimes produce errors, I have a database of each entity and their error counts per day going back 2 years. What visualization might be best to see the trend on these errors?
I tried 800 line-plot subplots but that's unwieldy
putting all 800 into a single plot, it's too hard to see what line is for which entity, or to track an individual entity for that matter
hard hound
Scatter plot might be good or You could visualise the data in parts
modern phoenix
what might work is like a grid where x is day, y is entity then each cell contains the error count for that entity-day and then colorize from green to red?
let me try a scatter plot quickly
are you aware of a tool in jupyter to allow for creating such a heatmap grid?
hard hound
I know how to create one But i didn't really ever needed one try seaborn.heatmap
modern phoenix
thanks
hard hound
modern phoenix
thanks
here at your service
modern phoenix
after my groupby + sum, I now have a multi index of [col1, col2].. not sure how to get col2 out of the multiindex
hard hound
I think distinct() might help
 desert oar
modern phoenix
after my groupby + sum, I now have a multi index of [col1, col2].. not sure how ...
desert oar
modern phoenix
after my groupby + sum, I now have a multi index of [col1, col2].. not sure how ...
.reset_index(level=-1)
!d g pandas.DataFrame.reset_index
arctic wedgeBOT
DataFrame.reset_index(level=None, drop=False, inplace=False, col_level=0, col_fill='')```
Reset the index, or a level of it.

Reset the index of the DataFrame, and use the default one instead. If the DataFrame has a MultiIndex, this method can remove one or more levels.

Parameters  **level**int, str, tuple, or list, default NoneOnly remove the given levels from the index. Removes all levels by default.

**drop**bool, default FalseDo not try to insert index into dataframe columns. This resets the index to the default integer index.

**inplace**bool, default FalseModify the DataFrame in place (do not create a new object).

**col\_level**int or str, default 0If the columns have multiple levels, determines which level the labels are inserted into. By default it is inserted into the first level.

**col\_fill**object, default ‘’If the columns have multiple levels, determines how the other levels are named. If None then the index name is repeated.

Returns  DataFrame or NoneDataFrame with the new index or None if `inplace=True`.

See also... [read more](https://pandas.pydata.org/pandas-docs/stable/reference/api/pandas.DataFrame.reset_index.html#pandas.DataFrame.reset_index) frail root
!d g pandas.DataFrame.resample
arctic wedgeBOT
DataFrame.resample(rule, axis=0, closed=None, label=None, convention='start', kind=None, loffset=None, base=None, on=None, level=None, origin='start_day', offset=None)```
Resample time-series data.

Convenience method for frequency conversion and resampling of time series. Object must have a datetime-like index (DatetimeIndex, PeriodIndex, or TimedeltaIndex), or pass datetime-like values to the on or level keyword.

Parameters  **rule**DateOffset, Timedelta or strThe offset string or object representing target conversion.

**axis**{0 or ‘index’, 1 or ‘columns’}, default 0Which axis to use for up- or down-sampling. For Series this will default to 0, i.e. along the rows. Must be DatetimeIndex, TimedeltaIndex or PeriodIndex.

**closed**{‘right’, ‘left’}, default NoneWhich side of bin interval is closed. The default is ‘left’ for all frequency offsets except for ‘M’, ‘A’, ‘Q’, ‘BM’, ‘BA’, ‘BQ’, and ‘W’ which all have a default of ‘right’.... [read more](https://pandas.pydata.org/pandas-docs/stable/reference/api/pandas.DataFrame.resample.html#pandas.DataFrame.resample)@frail root resample is like groupby but for date/time ranges
grave frost
Time/frequency trade-off in STFT: I don't get if the frame size decreases, isn't there a lesser amount of time steps present which leads to lower time resolution (as opposed to the increase in time resolution stated in the theory)
 winter geode
Hi.
 regal rapids
Helloo guys. I try to measure image similarities with skimage.metrics functions like SSIM structural_similarity() and MSE mean_squared_error().
are there others metrics for that?
||(i hope that i am writing in correct channel )||
tidal bough
I believe a big field is computing certain hash-functions from the images that tend to not get changed much by transformations
https://pypi.org/project/ImageHash/ - like the links in the description here, for example
 candid shadow
doing a malbourne price prediction project and im trying to predict the accuracy but the accuracy_score thing from sklearn doesnt work with regression. any tips on what i could do to predict the accuracy when using regression?
 dapper halo
candid shadow
doing a malbourne price prediction project and im trying to predict the accuracy...
dapper halo
candid shadow
doing a malbourne price prediction project and im trying to predict the accuracy...
Could do fractional error and look at the distribution of those results.
 primal pilot
When plotting a sphere using the mplot3d lib, the sphere does not seem to be round

How would I fix this? ax.set_aspect("equal") does not exist...
 glad mulch
i have a graph in where i have highlighted areas
2 questions
- how do i make it so that the edges are not so obvious
i want it to blend
and 2 how do i add the lables only once

my graph for reference
 serene scaffold
@glad mulch you'll have to show what code created this graph or no one will know
 exotic maple
@glad mulch Also specify your library. We can "assume" its mpl, but who knows
glad mulch
here is my code
 velvet thorn
glad mulch
i want it to blend
velvet thorn
glad mulch
i want it to blend
define "blend"
velvet thorn
the lines appear because there is overlap
if you stop them from overlapping you can keep the alpha
velvet thorn
glad mulch
now its just the legend
you could
create the legend manually
or
not specify the label for each artist you create
what I suggest is
glad mulch
cheers ill try to do just that
velvet thorn
glad mulch
cheers ill try to do just that
Stack Overflow
Here is a very simplified example:
xvalues = [2,3,4,6]
for x in xvalues:
plt.axvline(x,color='b',label='xvalues')
plt.legend()
The legend will now show 'xvalues' as a blue line 4 times in the
this might help
glad mulch
it did! thanks a bunch
velvet thorn
yw 👋
 exotic maple
glad mulch
exotic maple
glad mulch
Im assuming you were tryinmg to track the S&P 500 index performance vs overall economic situation?
 cursive rune
Hey guys - I'm building an open source AI-powered compiler that can take a simple specification and generate high quality source code for Django and Node (things like ORM code, API code, tests, etc). We are going to launch this in the coming weeks but if someone is interested in the topic of smart compilers / meta frameworks, would love to do a sneak peak 🙂
glad mulch
exotic maple
Im assuming you were tryinmg to track the S&P 500 index performance vs overall e...
Sort of. I created a portfolio that tracked the business cycle and would invest in index funds of sectors that have historically out performed
exotic maple
glad mulch
Sort of. I created a portfolio that tracked the business cycle and would invest ...
my finance knowledge is nothing to be proud of but isnt there a finance KPI (think it's the Beta from ARIMA) that tracks the "market" performance or bias vs the stock bias itself?
exotic maple
cursive rune
Hey guys - I'm building an open source AI-powered compiler that can take a simpl...
you mean like Gradio? like "i want a button that does X" and does that?
glad mulch
Are you talking about a firm's beta?
exotic maple
glad mulch
Are you talking about a firm's beta?
yes, exactly. Isn't this related to that?
glad mulch
Not really
This uses economic indicators
And creates a composite index from that
Depending on the composite index, we invest in index funds
A firms beta is just correlation
Or, more precisely, a firm's volatility compared to the markets
exotic maple
interesting. so this "decomposes" the economy and instead of doing a stock-vs-mraket does stock-vs-"insert kpi here"?
cursive rune
exotic maple
you mean like Gradio? like "i want a button that does X" and does that?
Gradio looks cool. In our case the input spec is not quite as free form as Gradio. We have created a simple structured syntax as input from which we're able to generate running code for like APIs (REST/GraphQL) etc. Sort of like what you get from Hasura but in addition to working endpoints, you also get Django/Node source code behind it (the code looks like what an experienced engineer would write).
glad mulch
exotic maple
interesting. so this "decomposes" the economy and instead of doing a stock-vs-mr...
More like market sectors vs kpi
But yeah
exotic maple
cool.
Btw i think there's a library more suied for financial plots
I swear I saw it before
@glad mulch check this out
GitHub
Financial Markets Data Visualization using Matplotlib - matplotlib/mplfinance
glad mulch
anyone have an idea to do this more efficiently. i am trying to calculate how often my portfolio beats the index during each signal

i keep getting this
 velvet thorn
glad mulch
velvet thorn
glad mulch
Please Post Code As Text
glad mulch
d = c.groupby('Signal')['Portfolio','S&P 500 Index']
hit_rate = d.apply(lambda x:x[x['Portfolio'] - x['S&P 500 Index'] > 0].count()/ x['Portfolio'].count())
I...don't get it
maybe you can explain in words what you mean
like what I think you want is df.loc[df['Portfolio'] > df['S&P 500 Index'], 'Signal'].value_counts()
but I can't really tell
glad mulch
i want the total amount of times that df[portfolio] > df['S&P 500 Index] during a signal / total # of signals
so lets say there are 30 #1 signals
port > s&p500 during 10 of those signals
port beats the s&p500 33.33% of the time
iron basalt
glad mulch
i want the total amount of times that df[portfolio] > df['S&P 500 Index] during ...
>>> df
   Animal  Max Speed
0  Falcon      380.0
1  Falcon      370.0
2  Parrot       24.0
3  Parrot       26.0
>>> df.groupby(["Animal"]).count()
        Max Speed
Animal
Falcon          2
Parrot          2
>>> df[df["Max Speed"] > 25.0].groupby(["Animal"]).count()
        Max Speed
Animal
Falcon          2
Parrot          1
>>> df[df["Max Speed"] > 25.0].groupby(["Animal"]).count() / df.groupby(["Animal"]).count()
        Max Speed
Animal
Falcon        1.0
Parrot        0.5
>>>
 hoary wigeon
Hello Everyone!
I want to mine google playstore data.
Any idea how can i proceed or where i can find the googleplaystore dataset?
 sour mango
hey I have a general question.. what data structure should I use to search in O(1) time? (currently I am using lists and it takes O(n) time).. I want to have duplicate values conserved. I am converting from pandas data frame to list
 bitter harbor
sour mango
hey I have a general question.. what data structure should I use to search in O(...
bitter harbor
sour mango
hey I have a general question.. what data structure should I use to search in O(...
wdym by search? if you're talking about iteration, O(n) is best case scenario across all* structures, get/set item on the other hand is O(1) for lists/sets/dicts
iron basalt
(Unless your stuff is sorted already (log(n) with binary search))
lean ledge
Unless you have knowledge about what you're searching over (ordering, etc), you can't do better than a list
iron basalt
I think they probably want a dict though?
lean ledge
cant say without more detail
 pulsar karma
erm... how do i create a dataset in a .CSV file. I know how to retrive data from the file BUT I want to know how I fformat data to retrive it. What I'm trying to get at is, I'm not sure how I can create data in the .CSV file, do you make a list like: ["hi", "die", "me", 12113131] or do you just... type random stuff in the .CSV file?
ping me when you can :)
iron basalt
pulsar karma
erm... how do i create a dataset in a .CSV file. I know how to retrive data from...
Read about CSV file format. It's very simple, which is why it's used a lot.
pulsar karma
iron basalt
Read about CSV file format. It's very simple, which is why it's used a lot.
ok, thanks!
iron basalt
A comma-separated values (CSV) file is a delimited text file that uses a comma to separate values. Each line of the file is a data record. Each record consists of one or more fields, separated by commas. The use of the comma as a field separator is the source of the name for this file format. A CSV file typically stores tabular data (numbers and...
Basic Rules section
(has examples too)
pulsar karma
thank you!
velvet thorn
sour mango
hey I have a general question.. what data structure should I use to search in O(...
multiset?
AKA Counter
 verbal light
When i want to teach my RCNN how to detect objects, do i need to add regions where there's no objects?
 nova tulip
HI GUYS AM INTERESTED IN PERUSING DATA SCIENCE AS MY CAREER WHICH DEGREE SHOULD I CHOOSE AFTER 12 TH CLASS (INDIAN) AND WHAT ARE THE BEST UNIVERSITIES OR COLLAGES WHICH PROVIDE THIS DEGREE WORLD WIDE
serene scaffold
nova tulip
HI GUYS AM INTERESTED IN PERUSING DATA SCIENCE AS MY CAREER WHICH DEGREE SHOULD ...
When you type in all caps, people will think that you're shouting at them
that being said I would explain your circumstances in #career-advice and see if anyone knows how all of that works in India. I'm only familiar with education in the United States.
nova tulip
serene scaffold
When you type in all caps, people will think that you're shouting at them
oh sorry i didnt see my caps lock was on
nova tulip
serene scaffold
that being said I would explain your circumstances in <#470889390588035082> and ...
thanks
lean ledge
verbal light
When i want to teach my RCNN how to detect objects, do i need to add regions whe...
nope
a decent rcnn implementation will throw in a bunch of non detections while training automatically
verbal light
lean ledge
a decent rcnn implementation will throw in a bunch of non detections while train...
but what if i want to make my own implementation? dataset with only wanted objects would be sufficient ? Do you know some good implementation of rcnn algorithm?
 ripe forge
Then, as long as you make your own implementation sensibly, then only wanted objects would be sufficient.. But it would depend on your implementation
 hallow bronze
Hey guys what is a panel data?
lapis sequoia
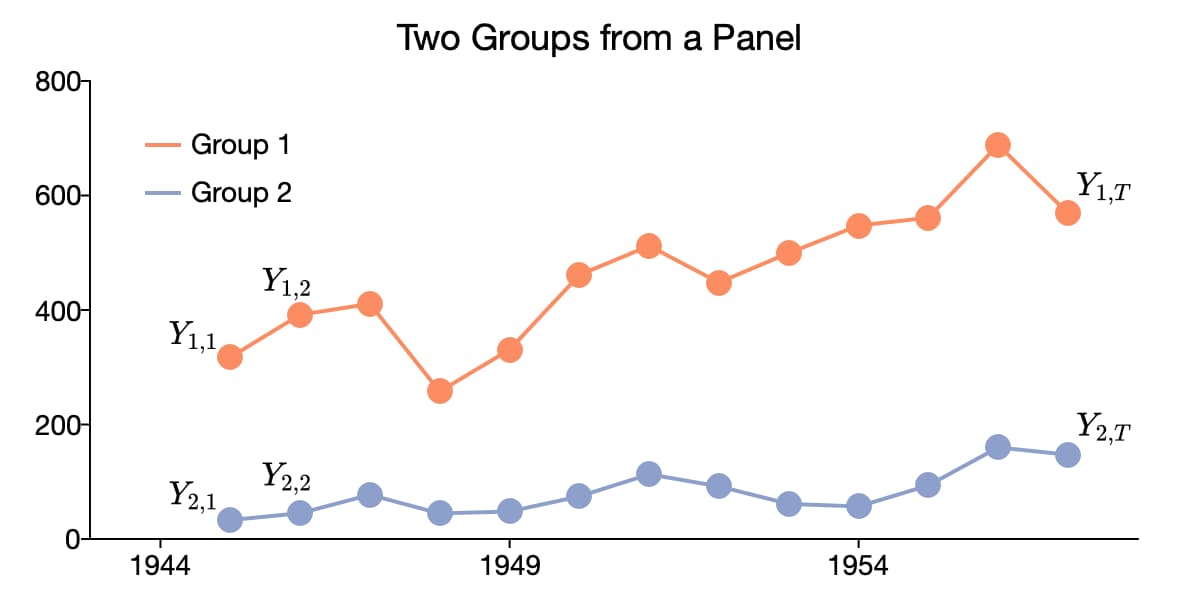
Panel data, sometimes referred to as longitudinal data, is data that contains observations about different cross sections across time. Panel data exhibits characteristics of both cross-sectional data and time-series data. This blend of characteristics has given rise to a unique branch of time series modeling made up of methodologies specific to ...
 hushed wasp
I am trying to use SIFT but i don't know why i can't display the picture and only have true at the end of my code... If someone can help please
 uncut kindle
I think the last line writes the output to file. you'll have to look for how to display the output image in-line instead. google keyword should be $FRAMEWORK in-line jupyter display
uncut kindle
oh btw you should look into virtual environment management. locking dependencies version. I recommend pyenv + pipenv
hushed wasp
indeed I should
not very good understanding all of this but it seems a lot of people speak of it
lapis sequoia
can i use https://clip.backprop.co/ to make my own classifier on python?
uncut kindle
@hushed wasp I had a fair share of fixing errors and hunting down the correct module version from research notebooks😂
hushed wasp
uncut kindle
<@!697072102431522826> I had a fair share of fixing errors and hunting down the...
Ahaha ok 🙂
Thanks for the help!!
lapis sequoia
can i use https://clip.backprop.co/ to make my own classifier on python?

 soft salmon
(neural networks)
suppose i have
softmax_activation | cross_entropy | classifier | actual_output
0.25 ? dog (1) cat (0)
0.75 ? cat (0) cat (1)
How do i calculate cross_entropy ?
cross entropy = -actual_output * log(predicted)
in case of 0.25 how should i calculate cross entropy
is it -cat * log(softmax_activation) or -dog *log(softmax_activation)
grave frost
lapis sequoia
can i use https://clip.backprop.co/ to make my own classifier on python?
that's pre-trained, you have to do nothing except give your money

you know, im kinda impressed
 devout breach
is numba often used in machine learning?
rotund dagger
im working on an assignment that predicts the author of a book. it uses 4 algoritms an example output would look like this:
