#data-science-and-ml
1 messages · Page 281 of 1
 austere swift
 copper ridge
can anyone help me with pandas and openpyxl?
austere swift
copper ridge
can anyone help me with pandas and openpyxl?
you'll get more help if you just ask your question
 copper ridge
@bot.command()
async def logbikedata(ctx, date: str, destination: str, distance: str, start: str, end: str, rating: str, difficulty: str):
  wb = openpyxl.load_workbook(Log)
  sheet = wb.active
  sheet['B1'] = f'{date}'
  sheet['B2'] = f'{destination}'
  sheet['B3'] = f'{distance}'
  sheet['B4'] = f'{start}'
  sheet['B5'] = f'{end}'
  sheet['B6'] = f'{rating}'
  sheet['B7'] = f'{difficulty}'
  wb.save(Log)
  await ctx.send(f'New biking data from {date} logged')
  print(f'Documented data from {date}')
@austere swift
I need help figuring out how to make a new column with the title today (for example seen above) and all the inputs after date to go in the new column made in their corresponding rows
my code only lets me send to column B as you can see
what i input
 misty flint

copper ridge
how i return the data
misty flint
so...you want your input to be placed into a new column each time
copper ridge
ik, i used it to test everything
copper ridge
misty flint
you have to use a variable
how
copper ridge
nothing on youtube or stackoverflow seems to help
misty flint
i think theres a function for it in python
copper ridge
i think so too but in 2 days pf researching and testing i cant figure it out
misty flint
ah you have to import string.ascii_uppercase
yikes

GeeksforGeeks
A Computer Science portal for geeks. It contains well written, well thought and well explained computer science and programming articles, quizzes and practice/competitive programming/company interview Questions.
so instead of your B1
you have to loop through the entire alphabet
concantenate the alphabet letter with the corresponding number for the string
copper ridge
in an excel, after the 26 letters are filled, it goes AA, AB, etc
copper ridge
this is the hardest thing ive come across
copper ridge
same
misty flint
/in my beginner experience
 barren rune
can someone help me with a forest plot ?
copper ridge
i started coding 2 months ago
copper ridge
"self taught"
misty flint
ye
senior programmer could easily solve this problem
in a much more pythonic way too

copper ridge
ya
pulling data is way easier than wrting it
imma do my chem lab, i put it off for so long and its due in 5 hours
copper ridge
thanks
copper ridge
im taking that in a few quarters 👁👁👄👄👁👁
copper ridge
ya
misty flint

copper ridge
thanks, ill need it
 heady tide
who know bash
 nova kelp
import face_recognition
import cv2
#Load a sample picture and learn how to recognize it
obama_image = face_recognition.load_image_file("obama.jpg)
obama_face_encoding = face_recognition.face_encodings(obama_image)[0] ``` right now i can only load one image from the folder and i want to load all the images from a folder, how do i do this? balmy junco
Does anyone know of a quick function for matrix products or do I need to write my own? 😆
 velvet thorn
Does anyone know of a quick function for matrix products or do I need to write my own? 😆
@balmy junco are you using numpy
balmy junco
I actually realized I was messing something up and that I had it all along, but
yes I am using numpy
But the problem now is
velvet thorn
@
balmy junco
I am getting ultra small numbers instead of 0
when the result should obviously be 0 for those values in the product matrix
What can I do to fix that?
velvet thorn
show code
velvet thorn
copper ridge
in an excel, after the 26 letters are filled, it goes AA, AB, etc
I remember doing this when I first started programming
it was a pretty fun experience actually
balmy junco
Sure
import numpy as np
import scipy.linalg as la

M = np.array([[1, 2], [3, 7]])
inverse_M = la.inv(M)

print(inverse_M @ M)
The problem is that this is my output:
[0.00000000e+00 1.00000000e+00]]```looks about right to me
those are just float precision issues
1.33226763e-15 is very close to 0
balmy junco
true
any property of the np.array i can use to zero it?
if not, it wont be hard to fix ig
velvet thorn
hm
velvet thorn
balmy junco
any property of the np.array i can use to zero it?
why do you want to?
balmy junco
i was thinking there might be a parameter in the inverse_M.dot(M) method that i could pass proabbly lol
i mean
velvet thorn
is it necessary?
balmy junco
i would think so
zero is a pretty significant value imo
if it's zero i want to guarantee that its zero lol
but
i can fix that
just was wondering if theres a shortcut
velvet thorn
you can round
.round
but I should also highlight that the result you get will likely be OS + system-dependent
array([[ 1.00000000e+00,  4.44089210e-16],
       [-2.22044605e-15,  1.00000000e+00]])
this is my result for the same calculation
array([[ 1.0000000e+00,  0.0000000e+00],
       [-4.4408921e-15,  1.0000000e+00]])
^ and the same, using np.linalg instead of scipy.linalg
but anyway
rounding off to, say, 10 significant figures should be more than sufficient
velvet thorn
however...
that's only in the case where you know you only have integer results
because that would also round non-integer, non-zero results, causing loss of precision (probably not enough to matter, but it would)
so
the best way to do this would be to mask those values over a certain magnitude and zero the others
something like a[a.abs() < 0.000001] = 0
balmy junco
interesting but im not sure what you mean
how does what you wrote differ?
ahhhh
you mean if it is a different value type
but it rounds as if the bits were those of a float?
misty flint
this was an interesting figure

time to look for jobs in SG ig
jk
hiring index = AI jobs / total linkedin members

 charred quarry
 rugged comet
charred quarry
Hello. Can I import variables from another file? Example : there are 2 files : a...
rugged comet
charred quarry
Hello. Can I import variables from another file? Example : there are 2 files : a...
Yes. Although I don't see how that question relates to Data Science.
charred quarry
rugged comet
Yes. Although I don't see how that question relates to Data Science.
Thanks. Sorry. I can't find the general help
 cursive goblet
is MIT course in youtube is the same as edx?
copper ridge
velvet thorn
I remember doing this when I first started programming
do you think you would be able to help me?
 sleek robin
is the error in the final layer in an ANN always computed as (predicted label) - (actual label) even if we use e.q. crossentropy loss or softmax in the last layer?
i am kind of confused on this
velvet thorn
copper ridge
do you think you would be able to help me?
think about the pattern
velvet thorn
sleek robin
is the error in the final layer in an ANN always computed as (predicted label) -...
error is the same as loss
copper ridge
velvet thorn
think about the pattern
hmmm
sleek robin
well, isn't the error in the last layer the partial derivative of the loss with respect to the output * partial derivative of ouput with respect to weighted input? like the first bits of the chain rule that you can just multiply cumulatively to get the ones further back
velvet thorn
sleek robin
well, isn't the error in the last layer the partial derivative of the loss with ...
okay wait
by "error" do you mean the update to the weights after scaling by learning rate?
velvet thorn
why do you refer to that as error
sleek robin
that's what i see it called everywhere
velvet thorn
got an example
copper ridge
gm can i get a hint?
velvet thorn
like okay, you backpropagate the loss calculated at the final layer but
but anyway
terminology aside
sleek robin
like, here idk
also wikipedia
In machine learning, backpropagation (backprop, BP) is a widely used algorithm for training feedforward neural networks. Generalizations of backpropagation exists for other artificial neural networks (ANNs), and for functions generally. These classes of algorithms are all referred to generically as "backpropagation". In fitting a neural network,...
velvet thorn
oh hm
as in you mean in general
okay I think I was not clear
normally to disambiguate from the actual calculated loss
I refer to that as (backpropagated) loss?
but anyway
to go back to your question
copper ridge
 data = [(f'{date}'), (f'{destination}'),(f'{distance}'), (f'{start}'), (f'{end}'), (f'{rating}'), (f'{difficulty}')]
  for i in data:
    sheet.append(i)
tried this, it it didnt work
@velvet thorn am i on the right track?
sleek robin
copper ridge
I need help figuring out how to make a new column with the title today (for exam...
can't you just change it so you just need to make a new row for each data sample instead of a column? that's the usual way it's done, and you'd only need to use numbers for that rather than constructing a valid A1 notation string
copper ridge
sleek robin
can't you just change it so you just need to make a new row for each data sample...
that makes sense but idk how to do that
sleek robin
you'd only need to use letters B through G plus the row number
copper ridge
how would I code that? I understand what u are saying but dont know how to put it in code
sleek robin
hold on
copper ridge
ok
velvet thorn
copper ridge
<@!171929073063297024> am i on the right track?
I don't remember how to use pyxl
but
in terms of your algorithm
that's basically it?
you have f-strings
and you just need to increase the number
every row
so use like range
copper ridge
copper ridge
```py
data = [(f'{date}'), (f'{destination}'),(f'{distance}'), (f'{start}'), (f...
i get an error just using this
sleek robin
  sheet[f'C{n}'] = f'{destination}'
  sheet[f'D{n}'] = f'{distance}'
  sheet[f'E{n}'] = f'{start}'
  sheet[f'F{n}'] = f'{end}'
  sheet[f'G{n}'] = f'{rating}'
sheet[f'H{n}'] = f'{difficulty}'```like this?
n is row number
try that
copper ridge
copper ridge
i get an error just using this
TypeError('Value must be a list, tuple, range or generator, or a dict. Supplied value is {0}'.format( TypeError: Value must be a list, tuple, range or generator, or a dict. Supplied value is <class 'str'>
copper ridge
sleek robin
``` sheet[f'B{n}'] = f'{date}'
sheet[f'C{n}'] = f'{destination}'
sheet[f'D{...
how do i define n?
sleek robin
okay what do you want your command to do exactly
copper ridge
copper ridge
what i input
^
copper ridge
copper ridge
how i return the data
^
sleek robin
so new row each time you use it
copper ridge
copper ridge
```py
@bot.command()
async def logbikedata(ctx, date: str, destination: str, dis...
^
yup
sleek robin
i don't use pyxl, but you just need to get the first empty row somehow i guess
copper ridge
the empty row is B1
copper ridge
ya...
sleek robin
n = 1
cell = sheet['B1']:
while not cell:
    n += 1
cell = sheet[f'B{n}']```put this before that other bit and try
sleek robin
ok, reorder the header cells
so that they're columns instead of rows
so line them up sideways instead of on top of each other
the Distance: things and so on
also, hold on
copper ridge
sheet[f'B{n}'] = f'{date}', f'{destination}',f'{distance}', f'{start}', f'{end}', f'{rating}', f'{difficulty}'
like that?
sleek robin
no, i mean in the excel file
copy and paste the cells from the first column into the first row
reorient them horizontally
copper ridge
@bot.command()
async def data(ctx, date: str):
    open(Log)
    df = pd.read_excel(Log, index_col=0)
    df.set_index(date, drop = False)
    df2 = df[f'{date}'].to_string()
    dembed=discord.Embed(title = f'Date: {date}', description = f'{df2}', color=0x6b1aea)
    await ctx.send(embed=dembed)
    print(f'Log from {date} sent')
like this?
sleek robin
yeah
copper ridge
would i change cell = sheet['B1'] to A1
copper ridge
wym offset?
copper ridge
copper ridge
like this?
im guessing u mean offset as in add a space between destination, distance, etc?
ohh
sleek robin
okay, this ought to work
@bot.command()
async def logbikedata(ctx, date: str, destination: str, distance: str, start: str, end: str, rating: str, difficulty: str):
    wb = openpyxl.load_workbook(Log)
    sheet = wb.active
    n = 1
    cell = sheet['B1'].value
    while cell:
        n += 1
        cell = sheet[f'B{n}'].value

    sheet[f'A{n}'] = f'{date}'
    sheet[f'B{n}'] = f'{destination}'
    sheet[f'C{n}'] = f'{distance}'
    sheet[f'D{n}'] = f'{start}'
    sheet[f'E{n}'] = f'{end}'
    sheet[f'F{n}'] = f'{rating}'
    sheet[f'G{n}'] = f'{difficulty}'
    wb.save(Log)
    await ctx.send(f'New biking data from {date} logged')
print(f'Documented data from {date}')```like this?
sleek robin
well, no
copper ridge
so leave it as it was?
copper ridge
copper ridge
im trying it now
like it was here?
copper ridge
ok
time to run it
fingers crossed
bless😩
thanks big time
any ideas on how to change my read command so that it still looks like this?
@bot.command()
async def data(ctx, date: str):
    open(Log)
    df = pd.read_excel(Log, index_col=0)
    df.set_index(date, drop = False)
    df2 = df[f'{date}'].to_string()
    dembed=discord.Embed(title = f'Date: {date}', description = f'{df2}', color=0x6b1aea)
    await ctx.send(embed=dembed)
    print(f'Log from {date} sent')
```my old read command@sleek robin
sleek robin
yeah hold on
copper ridge
ok
sleek robin
but think about it yourself as well
sleek robin
you need to find the row using the date you provide
then just read the values and pass it to the embed
copper ridge
would I use sheet.iter_row?
sleek robin
you could
there's probably an explicit function for finding stuff though
at least in pandas
copper ridge
hmmm
im trying to think of what that could be
this is what the dataframe send me, but i want all this to be vertical
sleek robin
what's the command like right now?
copper ridge
@bot.command()
async def data(ctx, date: str):
    open(Log)
    df = pd.read_excel(Log, index_col=0)
    #df.set_index(date, drop = False)
    #df2 = df[f'{date}'].to_string()
    dembed=discord.Embed(title = f'Date: {date}', description = f'{df}', color=0x6b1aea)
    await ctx.send(embed=dembed)
    print(f'Log from {date} sent')
``` comments are there so i could send the dataframedf2 would take df's spot in the embed
sleek robin
what if you tried doing df2 = '\n'.join(str(df[f'{date}'].to_string()).split(' '))
it will replace the spaces with newlines
copper ridge
still there, i deleted the A1 cell tho
sleek robin
oh wait nvm
you had df[f'{date}'] in that comment, that won't work anymore with this orientation
copper ridge
ohh that makes sense
i dont want it to print the date with the other things since the embed does it, is there a way to skip A1 ?
sleek robin
you could just use list slicing
and when you get the entire row, you just pass the first part to the title
and the rest to the embed body
copper ridge
i put "Date:" back in the sheet and the command still gave me the KeyError: 'today' error
sleek robin
nah, that's because if you use df[some string], it will look for a column with that name
copper ridge
ohh
sleek robin
it worked before because you had the date as the column header
sleek robin
kinda busy but i can give you a hint
copper ridge
ok and yes plz
also its almost 3 am for me- i forgot people have lives and live in different time zones💀
sleek robin
you can try using df.loc[df['Date'] == date] to get the row
alternatively df.loc[df['Date'] == date].iloc[0]
 hard canopy
balmy junco
```[[1.00000000e+00 1.33226763e-15]
[0.00000000e+00 1.00000000e+00]]```
hard canopy
balmy junco
```[[1.00000000e+00 1.33226763e-15]
[0.00000000e+00 1.00000000e+00]]```
You should read this: https://perso.ens-lyon.fr/jean-michel.muller/goldberg.pdf
sleek robin
but you may need to use index_col=None in pd.read_excel
hard canopy
anyone working with float should read it btw
tldr: never use the == operator on a float. always use an epsilon. because you cant represent all possible float values
copper ridge
thanks kurohagane
almost perfect, ur a genius, but it sends the weird thing at the bottom
sleek robin
if you iterate over the df.loc[df['Date'] == date].iloc[0] you can get just the row values
[val for val in df.loc[df['Date'] == 'xd'].iloc[0]] will get you a list of the strings
copper ridge
@bot.command()
async def data(ctx, date: str):
    open(Log)
    df = pd.read_excel(Log, index_col=None)
    #df.set_index(date, drop = False)
    #df2 = df[f'{date}'].to_string()
    df2 = df.loc[df['Date'] == date].iloc[0]
    dembed=discord.Embed(title = f'Date: {date}', description = f'{df2}', color=0x6b1aea)
    await ctx.send(embed=dembed)
    print(f'Log from {date} sent')
``` thats the one i used, did I use it wrong?if you don't mind you can just hard code the string to say like f'Destination: {list[1]}' etc
or, wait
try this
@bot.command()
async def data(ctx, date: str):
    open(Log)
    df = pd.read_excel(Log, index_col=None)
    row_vals = [val for val in df.loc[df['Date'] == date].iloc[0]]
    desc = '\n'.join([f'{col_name} {val}' for col_name, val in zip(df.columns[1:], row_vals[1:])])
    dembed=discord.Embed(title = f'Date: {date}', description = desc, color=0x6b1aea)
    await ctx.send(embed=dembed)
print(f'Log from {date} sent')```i owe you my sanity, idk how to thank you
sleek robin
👍
you might want to put in a try-except block around that, otherwise it will print an exception if you put in a nonexistent date
but iirc in discord.py it should just ignore it so if you don't mind the terminal getting spammed, i guess it shouldn't stop the bot working
sleek robin
basically try-catch blocks are like saying "if this error pops up here, then do this instead of stopping the program"
copper ridge
gotcha
sleek robin
so first try putting in a wrong date and see what error pops up
copper ridge
ill figure it out
sleek robin
any time you get an exception it's a specific type of error that is used
copper ridge
IndexError: single positional indexer is out-of-bounds
sleek robin
and you can specify that you want to intercept that specific error class
so in this case it'd be IndexError i guess
so you could do something like
@bot.command()
async def data(ctx, date: str):
    open(Log)
    df = pd.read_excel(Log, index_col=None)
    try:
        row_vals = [val for val in df.loc[df['Date'] == date].iloc[0]]
        desc = '\n'.join([f'{col_name} {val}' for col_name, val in zip(df.columns[1:], row_vals[1:])])
        dembed=discord.Embed(title = f'Date: {date}', description=desc, color=0x6b1aea)
        await ctx.send(embed=dembed)
    except IndexError:
        await ctx.send('Date does not exist')
print(f'Log from {date} sent')``` lapis sequoia
Greetings, working on NLP for Amharic language. Given the following word
ፕይቶን
I would like to read each character and provide a phonetic breakdown based on the following mapping
[
{"unicodevalue":"ፓ","syllable":" paa"},
{"unicodevalue":"ይ","syllable":" ye"},
{"unicodevalue":"ቶ","syllable":" to"},
{"unicodevalue":"ን","syllable":" ne"}
]
so that at the end I get
ፕይቶን = paa-ye-to-ne
Would rather avoid loops if at all possible. Thanks
 tidal bough
Assuming the string correctly breaks down into characters, you should be able to just use .translate.
austere swift
lapis sequoia
Greetings, working on NLP for Amharic language. Given the following word
ፕይቶን
I ...
wouldnt it be better to have it as a single dictionary like this {"ፓ": "paa", "ይ": "ye", "ቶ": "to", "ን": "ne"}
tidal bough
You can do something like:
mapping = {"ፓ": "paa", "ይ": "ye", "ቶ": "to", "ን": "ne"}

# to add the -s:
mapping_with_separators = {k:(v+"-") for k,v in mapping.items()}
table = str.maketrans(mapping_with_separators)
s = "ፕይቶን"
result = s.translate(table)
print(result) #ፕye-to-ne-
note that characters that are not in the mapping will be left as is.
austere swift
yeah that should work
!e
mapping = {"ፓ": "paa", "ይ": "ye", "ቶ": "to", "ን": "ne"}

# to add the -s:
mapping_with_separators = {k:(v+"-") for k,v in mapping.items()}
table = str.maketrans(mapping_with_separators)
s = "ፕይቶን"
result = s.translate(table)
print(result) #ፕye-to-ne-
 arctic wedgeBOT
You are not allowed to use that command here. Please use the #bot-commands channel instead.
lapis sequoia
ፕye-to-ne-
😆 root word should have been ፓይቶን. but that was a good test anyways! thanks so much. I was using another library it was so bloated. This is less than 10 lines. wow, python. why were you not in my life all this time!
tidal bough
mind, I think a more flexible approach would be to iterate over it after all, specifically like:
mapping = {"ፓ": "paa", "ይ": "ye", "ቶ": "to", "ን": "ne"}

s = "ፕይቶን"
def process(s,mapping):
    s = list(s)
    res = []
    for char in s:
        if char in mapping:
            res.append(mapping[char])
        else:
            print(f"Unknown character:{char}; leaving as-is")
            res.append(char)
    return "-".join(res)
result = process(s,mapping)
print(result) #ፕ-ye-to-ne
which will fix the problem of having a trailing - and allow handling missing chars. If performance is a concern, test how they compare first - translate may be implemented in C and as such better-optimized.
lapis sequoia
very nice! now loading sentences from a corpus file and testing, not doing the mapping but the issue is how i tokenize the words from the corpus.
is there a stackblitz type of thing for python?
dont want to post a wall of code
arctic wedgeBOT
Pasting large amounts of code
If your code is too long to fit in a codeblock in discord, you can paste your code here:
https://paste.pydis.com/
After pasting your code, save it by clicking the floppy disk icon in the top right, or by typing ctrl + S. After doing that, the URL should change. Copy the URL and post it here so others can see it.
lapis sequoia
here is my problematic code with error: 'list' object has no attribute 'translate'
https://paste.pythondiscord.com/irofucamup.py
never mind. I see the issue. thanks folks!
 green pecan
Is there anyone around who has done complex CLI commands using argparse that might be able to help guide me?
austere swift
it would be better if you just asked your question
lapis sequoia
@tidal bough I created a mapping txt files that has all of the pairings {"ፓ": "paa", "ይ": "ye", "ቶ": "to", "ን": "ne"} and plan to use it as follows. But seems like it does nothing.
mapping = open("mapping.txt", encoding='utf-8', errors='ignore')
Do I need to define it as a dictionary?
guess I could go this route
d = {}
with open("dict.txt") as f:
for line in f:
(key, val) = line.split()
d[int(key)] = val
tidal bough
@lapis sequoia If your file looks like that, it's in the JSON format and you can load it via json.load.
lapis sequoia
thanks!
tidal bough
ah, based on the loading code you posted, it's space-separated key-value pairs separated by newlines. Then, yeah, use what you're doing.
lapis sequoia
oh that one is the corpus data not the k-v pair file
tidal bough
ah, I see
does your mapping file look like a printed dict? I.e. {"ፓ": "paa", "ይ": "ye", "ቶ": "to", "ን": "ne"}, something like that?Then you can do json.load.
lapis sequoia
😳 it worked!!! omg!
def phonetise(s):
with open('mapping.json', encoding='utf-8') as f:
mapping = json.load(f)
python is scary good
 tidal bough
yeah, the standard libs are very nice, and how little boilerplate there is
 woeful hamlet
Do u know a way to apply random transformation to an image with opencv?
like color contrast scale, rotation idk
i have 1 image and i wanna generate similar ones but different
 slim fox

AI & Machine Learning Blog
This article is a comprehensive review of Data Augmentation techniques for Deep Learning, specific to images.
@woeful hamlet check this
not opencv but might give you some idea/tip you in right direction
woeful hamlet
no no, i dont wanna use Image Data Generator
i wanna apply some filter with opencv maybe
 eager notch
Have any of you used drake before? If so, you know how we need N as a step for all our numbers? Well I want to get rid of that since i'm trying to optimize N basically. logically it makes sense but it doesn't function at all. any help would be appreciated 🙂
lapis sequoia
I don't know if I'm just stupid or what, but how do you solve a 1D linear equation in numpy?
lapis sequoia
I've tried, and I must be doing something wrong?
[3,2]t=[1.5,1]
 cobalt jetty
b = np.array([9,8])
x = np.linalg.solve(a, b)
x
array([2., 3.])```this is the provided example.
you build your system, then the equality members
then you feed the two to the solver.
lapis sequoia
a = np.array([[3],[2]])
b = np.array([[1.5],[1]])
c=np.linalg.solve(a,b)
Looks like linalg can't solve non square systems, i.e. systems with only 1 variable and 2 unknowns.
I think so anyways lest I'm doing something wrong
cobalt jetty
well, sure. you're feeding it a vertical array. While you are likely trying to solve a 2-degree polynomial
you have to specify which polynomial has a factor 0
lapis sequoia
I'm trying to solve this:
3t = 1.5
2t= 1
cobalt jetty
a must be square and of full-rank, i.e., all rows (or, equivalently, columns) must be linearly independent; if either is not true, use lstsq for the least-squares best “solution” of the system/equation.
yep you can't do that.
you will have to find another function
lapis sequoia
Yes, hence the question -- in numpy, what are my options?
I guess since I'll be just working with 1x2 arrays -- I can just divide one of the coefficients out and multiply, then test
cobalt jetty
You can create a Python class implementing the polynomial.
It checks if the polynomial you have have matrix representations that are independent
if so you can use the numpy function
else you can hack at some of the cases
basically whether if all the matrix are independent or not
if they are independent check for a solution
otherwise the system will have many
lapis sequoia
I should've started with my initial question -- given a line of form L1 = [x,y] + [d1, d2]t where x,y is my initial position and [d1,d2] is my direction vector -- see if this line passes through a point [x_1,y_1]
Was trying to solve the system [x_1,y_1]-[x,y] = [d1,d2]t using numpy, but to no avail.
I'll just have to check if x_1-x/d1 * [x_1,y_1] = [d1,d2] and if not, then it doesn't pass through the line
 rough mountain
Am I being dumb, or do binary classification models not output only 1s and 0s.
mine just gave me:
[[0.00091079]]
[[0.00023523]]
[[0.00100089]]
[[0.40408942]]```With Python?
lapis sequoia
Yes
@rugged comet
Hey, I'm currently learning image classification with TensorFlow and Keras.
I followed the clothing tutorial but wanted to test with my own dataset. My goal was to train the model to predict if the image is a landscape or a nsfw image. I built my dataset with a reddit fetcher and I now have the following arrays :
- a train_images array, of shape (4983, 50, 50, 3) (4983 images of 50 by 50 pixels with three color channels (color info is a float between 0 and 1))
- a train_labels array, of shape (4983,), containing either 0 (nsfw) or 1 (landscape)
- a test_images and test_arrays of similar shape but with a smaller number of images (800)
Now my question will sound stupid but, how do I train the model with this specific shape of data ? I've been trying a lot of tutorials on the internet but they all result obviously result in errors because my data shape is not similar. I couldn't find a tutorial that simply explained how to build a model for a specific data shape. Does anyone here have such a resource ? I can send the little code I have if needed.
I know I have to create a model, compile it and train it with fit() but I have no clue how this works.
all the arrays are created by hand, I did not import any model or csv file.
rugged comet
lapis sequoia
<@!188467763558350849>
Take a look at SymPy. You can solve algebraic equations with it.
lapis sequoia
Sadly, I don't have access to SymPy only numpy
barren rune
Help me with a forest plot
 thorn vector
hello one question with regards to making implementations of numerical methods does it make sense to implement it only as functions? is there any point to trying to do it using classes or any way to do such a thing?
velvet thorn
hello one question with regards to making implementations of numerical methods does it make sense to implement it only as functions? is there any point to trying to do it using classes or any way to do such a thing?
@thorn vector in isolation, both will work
depends on the larger context
Am I being dumb, or do binary classification models not output only 1s and 0s.
mine just gave me:[[0.00091079]] [[0.00023523]] [[0.00100089]] [[0.40408942]]```
@rough mountain show code? those look like probabilities
rough mountain
it seems to work now that I just round it to 0 or 1
thorn vector
velvet thorn
> hello one question with regards to making implementations of numerical methods...
I dont really understand how to structure numerical methods program using objects
rugged comet
lapis sequoia
Sadly, I don't have access to SymPy only numpy
Why?
velvet thorn
I dont really understand how to structure numerical methods program using objects
@thorn vector what do you want to do exactly
anyway like I said it’s a design choice
you don’t have to
thorn vector
but for example lets say i had the newton method , bisection method and the fixed point method and i wanted to build a program about these root finding methods which could be some of the classes that could be used? @velvet thorn
velvet thorn
but for example lets say i had the newton method , bisection method and the fixed point method and i wanted to build a program about these root finding methods which could be some of the classes that could be used? @velvet thorn
@thorn vector you might, for example, have a class representing the function to be solved
and each algorithm as a method on said class
you could have a class to track the progress (history) of each algorithm
like iteration count/current value
each algorithm could also be its own class, having solve as a method
shrug like I said is a design choice
thorn vector
ok thanks that gives me some ideas
 marsh chasm
Hi! I was wondering whether stochastic gradient descent is supposed to have a higher accuracy than minibatch or regular gradient descent
(after converging)
my reason for asking is i implemented my own neural net code I have to write a report trying different network configs/properties, and I wanna make sure like it's not me making some sort of mistake with my code
woeful hamlet
from the models keras comes with, which one is the best for image classification? ive tried with xception only, but ive read resnet50 and resnet152 are good too
 nocturne zealot
you guys got any websites that build your skils
my major is information systems and my dream job is to work in the front office for the MLB
lapis sequoia
marsh chasm
Hi! I was wondering whether stochastic gradient descent is supposed to have a hi...
regular gradient descent is most accurate but it also takes more time to compute
accuracy: regular gradient descent > mini batch > stochastic
rugged comet
I'm going to be parsing some poker hands.
Game started at: 2016/9/4 1:7:4
Game ID: 718895155 2/4 (PRR) Medusa (Short) (Hold'em)
Seat 5 is the button
Seat 4: bjv1105 (200).
Seat 5: IlxxxlI (88).
Player IlxxxlI has small blind (2)
Player bjv1105 has big blind (4)
Player bjv1105 received a card.
Player bjv1105 received a card.
Player IlxxxlI received card: [8c]
Player IlxxxlI received card: [8s]
Player IlxxxlI allin (86)
Player bjv1105 folds
Uncalled bet (84) returned to IlxxxlI
Player IlxxxlI mucks cards
------ Summary ------
Pot: 8. Rake 0
Player bjv1105 does not show cards.Bets: 4. Collects: 0. Loses: 4.
*Player IlxxxlI mucks (does not show cards). Bets: 4. Collects: 8. Wins: 4.
Game ended at: 2016/9/4 1:7:11
Here is an example hand from a file. I'm thinking about turning it into json. What are some other ideas to prepare something like this for evaluation by a machine?
 mellow pumice
Is there any way to disable Jedi auto-completion other than writing the command in the jupyter notebook each time? Like permanently... I use hinterland for that so...
misty flint
nocturne zealot
my major is information systems and my dream job is to work in the front office ...
not sure bud since its not my major but i know companies like individuals familiar with the cloud/cloud-certified now
 cerulean spindle
does anyone know if there's a way to enable intellisense inside a VScode jupyter notebook? Pls ping
marsh chasm
lapis sequoia
accuracy: regular gradient descent > mini batch > stochastic
that's what i thought; i realized i made a mistake since this code is a pretty major project i forgot to update part of my function to use the right activation function. thanks for the input
velvet thorn
regular gradient descent is most accurate but it also takes more time to compute
@lapis sequoia not necessarily
depends on the loss landscape
lapis sequoia
how can i generate a combination of strings that follows jaccard's cofficient of 0.04 in the first generation and 0.13 in the second generation?
 vast thunder
Guys would I use a Decision Tree Classifier for recognizing images?
Can I just turn images into numpy arrays and feed them to my model?
lapis sequoia
Hi, I want to ask a question about python papers, do you guys know any type of jupyter notebook based website provide different analyzing articles sharing like https://rpubs.com/ ?
lapis sequoia
velvet thorn
depends on the loss landscape
yeah obviously but in general regular gradient descent is the one that converges to minima best
and I'm assuming minima is the most accurate
Anyways using accuracy with gradient doesn't makes sense but I had to use that to reply to his message
 ripe forge
There's no "in general" to these things I'm afraid. Varies wildly from problem to problem.
velvet thorn
lapis sequoia
yeah obviously but in general regular gradient descent is the one that converges...
IMO, gradient descent on the whole dataset is likely to get you stuck in local minima
lapis sequoia
velvet thorn
IMO, gradient descent on the whole dataset is likely to get you stuck in local m...
true...
you are talking about the best fit and model for a complex dataset
but I'm talking abt it theoretically. Technically if you can initialise your model well then RGD will not get stuck in local minima whereas stochastic will just dance around the minima but it will almost never reach the minima.
but yeah in practice minibatch should give the best answer as it takes care for both local minima problem and finding the good minima that will give good result.
@marsh chasm
vast thunder
Guys when is a decision tree better than a neural network?
ripe forge
Cheeky answer, when it performs better 😛
One safe answer is usually when there's not a lot of data points
 green crow
Hey there!
I need some help with logistic regression. Can anyone help me?
I need to split multiple csv's to train and test. We can use sklearn model selection. But, How to use multiple csv's at once?
I can train_test_split with one csv. Assigned it to df. How do i do it for multiple files?
ripe forge
Can these multiple csvs be loaded in memory at once? If so, just make a single df out of them
green crow
df = pd.concat(map(pd.read_csv, ['./data/TDF.csv','data/fault_data:healthy/healthy:normal.csv', 'data/fault_data:healthy/horizontal_misalignment_0.5mm.csv','data/fault_data:healthy/imbalance_6g.csv']))
This is what I did now
This was my initial implementation:
df = pd.read_csv("./data/TDF.csv")
df1 = pd.read_csv("data/fault_data:healthy/healthy:normal.csv")
df2 = pd.read_csv("data/fault_data:healthy/horizontal_misalignment_0.5mm.csv")
df3 = pd.read_csv("data/fault_data:healthy/imbalance_6g.csv")
 vestal mirage
green crow
vestal mirage
green crow
each dataset is different
And 4 different datasets, 1. all the features 2. healthy dataset 3. fault 1 dataset 4. fault 2 dataset
hard canopy
I am using pytorch. I use loss = nll_loss(output, target) to get the loss for a batch. Is there a way to get the item in the batch with the higest loss ?
 scenic hollow
we dont create new features using target variable right?
vast thunder
ripe forge
One safe answer is usually when there's not a lot of data points
I see thanks
lapis sequoia
my apologies, and thanks for the adivce
lapis sequoia
sorry to ask again. But I got no reponse though.I want to ask a question about python papers, do you guys know any type of jupyter notebook based website provide different analyzing articles sharing like https://rpubs.com/ ?
 hushed swan
Can someone recommend a tutorial series for Data Analytics using Python?
vast thunder
Guys is :
model = keras.Sequential([keras.layers.Dense(units=3)])
the same as this?
 acoustic orbit
Hi people. Can anyone tell me good books or websites to study AI?
vast thunder
In my opinion , you should start with the math first
Learn the math about AI; Calculus is essential , plus linear algebra
misty flint
acoustic orbit
Hi people. Can anyone tell me good books or websites to study AI?
Andrew Ng's Coursera course on AI is a good introduction
go from there afterwards

Coursera
Offered by DeepLearning.AI. AI is not only for engineers. If you want your organization to become better at using AI, this is the course to tell everyone--especially your non-technical colleagues--to take. In this course, you will learn: - The meaning behind common AI terminology, including neural networks, machine learning, deep learning, an...
vast thunder
Also , I'd recommend Luis serrano's youtube tutorials , just search "neural networks luis serrano" . He explains them really good , you just need to know about matrices
And if you just want to get started right away , and just learn all of it in a 7 hour ish video , https://www.youtube.com/watch?v=tPYj3fFJGjk&t=3398s

Learn how to use TensorFlow 2.0 in this full tutorial course for beginners. This course is designed for Python programmers looking to enhance their knowledge and skills in machine learning and artificial intelligence.
Throughout the 8 modules in this course you will learn about fundamental concepts and methods in ML & AI like core learning alg...
That's neural networks , Machine Learning
vast thunder
Mhm
acoustic orbit
misty flint
Andrew Ng's Coursera course on AI is a good introduction
Thanks! I'm gonna see this courses. And sorry for my
English
 misty flint
its nice
vast thunder
mhm
acoustic orbit
misty flint
hopefully you get interested and go into DL immediately
😆 🤘🏽
of course
lapis sequoia
sorry to ask one more time. But I got no reponse though.I want to ask a question about python papers, do you guys know any type of jupyter notebook based website provide different analyzing articles sharing like https://rpubs.com/ ?
 hushed wasp
Can someone could explain to me how works the part with dictionary and replace please? Need to adapt it but don't understand it...
woeful hamlet
can someone help me on #help-cheese pls?
rough mountain
I'm getting a 92% val accuracy on my binary image classification model. I however would like to improve it more. Any tips?
 west lava
Hi there - had a quick DataFrame question and was hoping someone might be able to help.
If I have a DataFrame that looks like this - is there an easy way for me to Transpose this such that I hahve columns of data for each count.
Original DF
   game_id event_type event_detail event_team  counts
0   368725  game_shot      blocked        MET      20
1   368725  game_shot      blocked        MIN      12
2   368725  game_shot        saved        MET      38
3   368725  game_shot        saved        MIN      36
Target DF
event_team  blocked  saved
MET         20       38
MIN         12       36
 shut valve
group_by() ?
misty flint
slicing the array and transposing wont work bc youre not just switching the rows and columns i think...

sleek robin
pretty sure dataframe objects literally have a transpose method
west lava
AH, df.pivot() was the answer!
>>> df_pivot = df_shots_byteam[["event_team", "event_detail", "counts"]].pivot(index="event_team", columns="event_detail")
>>> df_pivot.columns = df_pivot.columns.droplevel(0)

>>> print(df_pivot)
event_detail  blocked  saved
event_team
BOS                 9     24
MET                20     38
MIN                12     36
TOR                18     36

west lava

 warm bane
any links that explain how to deploy our pytorch model to website?
 sand timber
maybe @rough mountain , looks like your model hit a plateau. try a lower learning rate maybe? or your model isn't big enough and is reaching its local optimum pretty quickly
rough mountain
It's pretty big really. I think the learning rate was far to low for the model. After bumping it and making it decay slower it seems to be working better.
rough mountain
Now that I look at it my val_acc has been the same for a while now, though loss started to change
I'm starting to think it's predicting all ones or somthing?
 rapid nexus
def generate_coeffs():
a = torch.rand(size=()) * 10
b = -10 + torch.rand(size=()) * 10
c = -10 + torch.rand(size=()) * 10
return a, b, c
def func(x, a, b, c):
return x.pow(2) * a + x * b + c
def find_min(a, b, c):
# your code goes here
# return x_min, val_min
return
pass
 odd aspen
Is this the right place to ask about bs4?
rugged comet
Is it true that models can only train on integers?
rugged comet
odd aspen
Is this the right place to ask about bs4?
I don't think so.
odd aspen
rugged comet
Is it true that models can only train on integers?
Floats basically
What seems to be the problem?
Floats is all you need
rugged comet
!code @rapid nexus Here's how to format Python code on Discord.
arctic wedgeBOT
Here's how to format Python code on Discord:
```py
print('Hello world!')
```
These are backticks, not quotes. Check this out if you can't find the backtick key.
rugged comet
odd aspen
What seems to be the problem?
Floats is all you need
I was just wondering because I have some non-float data. I could figure out a way to turn it into floats.
odd aspen
rugged comet
I was just wondering because I have some non-float data. I could figure out a wa...
Strings? Or what is it?
rugged comet
Yeah some strings for example.
odd aspen
Then you need NLP for that
Tokenize those sentences to turn them into Arrays of Tokens
rugged comet
Here's some examples.
['10h', 'Qh']
['Ad', 'Ah']
['6c', 'Ah']
['Qc', 'Kc']
['Ac', '6s']
['Ah', '10d']
I could assign a value to each combination of cards I guess.
rugged comet
I see.
velvet thorn
Here's some examples.
['10h', 'Qh']
['Ad', 'Ah']
['6c', 'Ah']
['Qc', 'Kc']
['Ac', '6s']
['Ah', '10d']
I could assign a value to each combination of cards I guess.
@rugged comet you should
these are not strings because they have to be
that’s an artifact of your choice of representation
rugged comet
Very true.
velvet thorn
these are not strings because they have to be
@velvet thorn well, technically nothing has to be
in this case I would suggest two features
one for value and one for suit
rugged comet
Yeah you can like tokenize words or whatever.
I think those cards may not even be important for the pattern I'm trying to find.
What is important is stuff like this
One pair of As
Straight to A
One pair of Ks
Two pairs. Qs and Js
Two pairs. As and 10s
Ideally I'd like to rank each hand on a scale more accurate than 10 - Royal Flush, 1 High Card etc. Struggling to think of ideas for that.
Thinking maybe I could find where they fall index-wise on the list of all combinations.
Like obviously a hand of one rank beats the one below it but I think I need it to be better than that. I suppose I shouldn't worry about it until it becomes an issue. idk.
lapis sequoia
How do I find synonyms of words with same tense. So like for helping, it would be "assisting"
 night trail
 misty flint
better than me
i see people use yahoo finance a lot

float() argument must be a string or a number, not 'tuple'
maybe get rid of the extra set of ()
?
i think...
try tsla.optimize_results(10,50,1) instead
dont quote me tho. im still a beginner
hmm

same tbh
let me copy and paste it into pycharm and see what the IDE tells me
np
hmmmmm
it doesnt like your code
wait gimme a sec
wait
whats the problem
it ran fine for me
after i put it into a virtual environment
kk
what am i putting in as the parameters
did you use class inheritance
tsla not defined
or was it supposed to pull from the yf module
ahh
here we go
im getting the same tracebacks you are
let me try a few things
i think this is the key
oh i was close
its saying youre feeding in 4 arguments
but it only takes 2
yeah
i think it might be in how you defined optimize_results
and how many arguments it allows
oh wait. did you want to turn it into an array first?
yeah...
it doesnt like that
i tried to do it too
honestly i think the only real issue with the code is this portion:
   def optimize_results(self, windowrange):  # ,windowrangehigh,step):
        opt = brute(self.test_strategy, [windowrange])  # ,windowrangehigh,step))
        return opt
that [windowrange]
it doesnt like that its an array
i think you have to set it as an array separately beforehand...i think

we need someone that actually knows data structures
sorry for not being able to
good luck tho

 odd ruin
I cant seems to google out the answers, so I want to ask here. How many percent of nan is acceptable to drop the rows or columns?
rugged comet
How can I guess if I have enough data to get an accurate model before training the model?
 burnt delta
import csv
from datetime import datetime

from matplotlib import pyplot as plt

filename = 'chapter_16/the_csv_file_format/revisions_printing_4/data/sitka_weather_2018_simple.csv'
with open(filename) as f:
    reader = csv.reader(f)
    header_row = next(reader)

    # Get dates, and high and low temperatures from this file.
    dates, highs, lows = [], [], []
    for row in reader:
        current_date = datetime.strptime(row[2], '%Y-%m-%d')
        high = int(row[5])
        low = int(row[6])
        dates.append(current_date)
        highs.append(high)
        lows.append(low)

# Plot the high and low temperatures.
plt.style.use('seaborn')
fig, ax = plt.subplots()
ax.plot(dates, highs, c='red', alpha=0.5)
ax.plot(dates, lows, c='blue', alpha=0.5)
ax.fill_between(dates, highs, lows, facecolor='blue', alpha=0.1)

# Format plot.
ax.set_title("Daily high and low temperatures - 2018", fontsize=24)
ax.set_xlabel('', fontsize=16)
fig.autofmt_xdate()
ax.set_ylabel("Temperature (F)", fontsize=16)
ax.tick_params(axis='both', which='major', labelsize=16)

plt.show()
this is the csv file , but im not sure which one is row[5] row[6] ,
 proven sigil
Does anyone here use pyspark?
 main zenith
Hi. Thanks in advance. I need help. I defined a custom transformer like this:
from sklearn.base import BaseEstimator, TransformerMixin

class FamilyEncoder(BaseEstimator, TransformerMixin):

    M_ = None
    N_ = None
    unknown_ = None
    categories_ = []
    params_ = []

    def __init__(self, unknown_value = -1):
        self.unknown_ = unknown_value
        return None
But when i passed it to ColumnTransformer somehow the unknown_value at the constructor is set to None.
ct = ColumnTransformer([
    ('num', MinMaxScaler(), num_attribs),
    ('cat1', 'passthrough', cat1_attribs),
    ('cat2', OrdinalEncoder(), cat2_attribs),
    ('cat3', FamilyEncoder( unknown_value = 100), cat3_attribs)
])
ct.fit(X_train)
returns
C:\Users\hamor\miniconda3\envs\base2\lib\site-packages\sklearn\base.py:213: FutureWarning: From version 0.24, get_params will raise an AttributeError if a parameter cannot be retrieved as an instance attribute. Previously it would return None.
  FutureWarning)
C:\Users\hamor\miniconda3\envs\base2\lib\site-packages\sklearn\base.py:213: FutureWarning: From version 0.24, get_params will raise an AttributeError if a parameter cannot be retrieved as an instance attribute. Previously it would return None.
  FutureWarning)

ColumnTransformer(transformers=[('num', MinMaxScaler(),
                                 ['Age', 'SibSp', 'Parch', 'Fare']),
                                ('cat1', 'passthrough', ['Pclass']),
                                ('cat2', OrdinalEncoder(),
                                 ['Sex', 'CabinClass']),
                                ('cat3', FamilyEncoder(unknown_value=None), # Here it is somehow set to None
                                 ['LastName'])])
And found a solution here: https://stackoverflow.com/questions/63251437/futurewarning-get-params-from-scikit-learn
and removed the underscore at self.unknown as suggested but it's not working.
What could be the issue?

Stack Overflow
I am getting the warning
File "[...]\lib\threading.py", line 890, in _bootstrap
self._bootstrap_inner()
File "[...]\lib\threading.py", line 932, in _bootstrap_inner
self.run()
 dull musk
 patent shuttle
hey guyesss so i have a downloadable link right here that when u click on it it automatically download the xls file. How can i open and save this file somewhere with python?
 sonic bridge
how can i decode a base64 string to number?
 tall trail
how in the world do i put all the values from one dataframe greater than '70' to another?
df_2 = df[df.max > 70].min()
this is what i have now and it returns only true or false
 wintry atlas
tall trail
how in the world do i put all the values from one dataframe greater than '70' to...
wintry atlas
tall trail
how in the world do i put all the values from one dataframe greater than '70' to...
when you put an explicit argument inside [] you will just get a True/False response. You are essentially is x > 70 and it is answering yes/no
in order to publish the results to another df you should filter first and then add the condition. ```py
df2 = df[df[insert column name]>70]
use int.from_bytes ?
woeful hamlet
anyway to fill a closed area with opencv?
rugged comet
How can I tell if my model is inaccurate due to insufficient data or due to weak correlation between features?
 formal egret
Hey, What are some good beginner recources to start reading/watching... I know an intermediate level of python 3+ and Im decent at math, just cant find any good ways to learn.
 elfin spruce
can anyone help me with this error from the pandas library
df = pandas.DataFrame(temp.get_data())
col_one_list = df['Timestamp'].tolist()```but clearly it is there
when i did df.dtypes
Time stamp is the first one
velvet thorn
elfin spruce
can anyone help me with this error from the pandas library
what is the error?
print(df.columns)
elfin spruce
  File "C:\Users\User\Desktop\python class\hw1\main.py", line 62, in <module>
    col_one_list = df['Timestamp'].tolist()
  File "C:\Users\User\AppData\Local\Programs\Python\Python39\lib\site-packages\pandas\core\frame.py", line 3024, in __getitem__
    indexer = self.columns.get_loc(key)
  File "C:\Users\User\AppData\Local\Programs\Python\Python39\lib\site-packages\pandas\core\indexes\base.py", line 3082, in get_loc
    raise KeyError(key) from err
KeyError: 'Timestamp'
PS C:\Users\User\Desktop\python class\hw1> ```thats the error
but ill print that
when i printed that i got this @velvet thorn
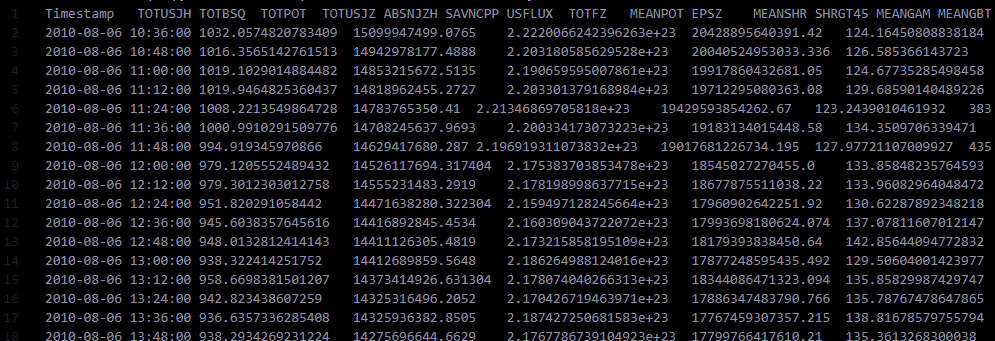
Index(['Timestamp\tTOTUSJH\tTOTBSQ\tTOTPOT\tTOTUSJZ\tABSNJZH\tSAVNCPP\tUSFLUX\tTOTFZ\tMEANPOT\tEPSZ\tMEANSHR\tSHRGT45\tMEANGAM\tMEANGBT\tMEANGBZ\tMEANGBH\tMEANJZH\tTOTFY\tMEANJZD\tMEANALP\tTOTFX\tEPSY\tEPSX\tR_VALUE\tCRVAL1\tCRLN_OBS\tCRLT_OBS\tCRVAL2\tHC_ANGLE\tSPEI\tLAT_MIN\tLON_MIN\tLAT_MAX\tLON_MAX\tQUALITY\tBFLARE\tBFLARE_LABEL\tCFLARE\tCFLARE_LABEL\tMFLARE\tMFLARE_LABEL\tXFLARE\tXFLARE_LABEL\tBFLARE_LOC\tBFLARE_LABEL_LOC\tCFLARE_LOC\tCFLARE_LABEL_LOC\tMFLARE_LOC\tMFLARE_LABEL_LOC\tXFLARE_LOC\tXFLARE_LABEL_LOC\tXR_MAX\tXR_QUAL\tIS_TMFI'], dtype='object')
what do i need to do?
elfin spruce
lol thats always fun
elfin spruce
rip what were you trying to do
velvet thorn
elfin spruce
when i printed that i got this <@!171929073063297024>
...that doesn't look right.
it looks like your columns aren't separated out
elfin spruce
what do i need to do to separate them out
 velvet thorn
ye
okay so
temp.get_data()
^ what is this?
all right basically
if you look carefully
your column names and data aren't aligned
and the columns
should be like
Index(['Timestamp', 'TOTUSJH', 'TOTBSQ'])
for exampe
i.e. one string per column
not one long string
elfin spruce
class MVTSSample:

    def __init__(self, flare_type:str, start_time:datetime, end_time:datetime, data:DataFrame):
        self._flare_type = flare_type
        self._start_time = start_time
        self._end_time = end_time
        self._data = data

    def get_flare_type(self):
        return self._flare_type

    def get_start_time(self):
        return self._start_time

    def get_end_time(self):
        return self._end_time

    def get_data(self):
        return self._data

def read_flare_mvts(data_dir:str, file_name:str) -> MVTSSample:
    global temp
    temp = MVTSSample(flare_type = file_name.split("@")[0], start_time = re.search('_s(.+?)_e', file_name), end_time = re.search('_e(.+?).csv', file_name), data = pandas.read_csv(f'{data_dir}/{file_name}', sep=r'\s*,\s*'))
return None```this is the class
and the function
i have to use both
velvet thorn
why?
elfin spruce
cause my professor is dumb af
velvet thorn
elfin spruce
`Index(['Timestamp\tTOTUSJH\tTOTBSQ\tTOTPOT\tTOTUSJZ\tABSNJZH\tSAVNCPP\tUSFLUX\t...
those are tabs
!e
print('Timestamp\tTOTUSJH\tTOTBSQ\tTOTPOT\tTOTUSJZ\tABSNJZH\tSAVNCPP\tUSFLUX\tTOTFZ\tMEANPOT\tEPSZ\tMEANSHR\tSHRGT45\tMEANGAM\tMEANGBT\tMEANGBZ\tMEANGBH\tMEANJZH\tTOTFY\tMEANJZD\tMEANALP\tTOTFX\tEPSY\tEPSX\tR_VALUE\tCRVAL1\tCRLN_OBS\tCRLT_OBS\tCRVAL2\tHC_ANGLE\tSPEI\tLAT_MIN\tLON_MIN\tLAT_MAX\tLON_MAX\tQUALITY\tBFLARE\tBFLARE_LABEL\tCFLARE\tCFLARE_LABEL\tMFLARE\tMFLARE_LABEL\tXFLARE\tXFLARE_LABEL\tBFLARE_LOC\tBFLARE_LABEL_LOC\tCFLARE_LOC\tCFLARE_LABEL_LOC\tMFLARE_LOC\tMFLARE_LABEL_LOC\tXFLARE_LOC\tXFLARE_LABEL_LOC\tXR_MAX\tXR_QUAL\tIS_TMFI'.split('\t'))
@velvet thorn :white_check_mark: Your eval job has completed with return code 0.
['Timestamp', 'TOTUSJH', 'TOTBSQ', 'TOTPOT', 'TOTUSJZ', 'ABSNJZH', 'SAVNCPP', 'USFLUX', 'TOTFZ', 'MEANPOT', 'EPSZ', 'MEANSHR', 'SHRGT45', 'MEANGAM', 'MEANGBT', 'MEANGBZ', 'MEANGBH', 'MEANJZH', 'TOTFY', 'MEANJZD', 'MEANALP', 'TOTFX', 'EPSY', 'EPSX', 'R_VALUE', 'CRVAL1', 'CRLN_OBS', 'CRLT_OBS', 'CRVAL2', 'HC_ANGLE', 'SPEI', 'LAT_MIN', 'LON_MIN', 'LAT_MAX', 'LON_MAX', 'QUALITY', 'BFLARE', 'BFLARE_LABEL', 'CFLARE', 'CFLARE_LABEL', 'MFLARE', 'MFLARE_LABEL', 'XFLARE', 'XFLARE_LABEL', 'BFLARE_LOC', 'BFLARE_LABEL_LOC', 'CFLARE_LOC', 'CFLARE_LABEL_LOC', 'MFLARE_LOC', 'MFLARE_LABEL_LOC', 'XFLARE_LOC', 'XFLARE_LABEL_LOC', 'XR_MAX', 'XR_QUAL', 'IS_TMFI']
i have like 2kfiles that i was given all are formatted like that
i dont have a choice in the matter
velvet thorn
my point is
when you load the data
tell it to use a tab separator
instead of a comma
velvet thorn
velvet thorn
!e
```py
print('Timestamp\tTOTUSJH\tTOTBSQ\tTOTPOT\tTOTUSJZ\tABSNJZH\tSAVNCPP\tU...
check this
this is what you want to get
velvet thorn
ye
that would be a good start
unless for some reason
your data has different separators for columns and values
which is a bit 🥴 but can be worked around
lmk if that works for you
elfin spruce
it worked! @velvet thorn thanks for the help, this is my first time using the pandas library
its an interesting one for sure
misty flint
is it trying to read extra columns?
import numpy as np

np.loadtxt('ckd_clean.csv',dtype='str,int',delimiter='|')```list index out of range

do i need to use the 'usecols' parameter
what the data set looks like
pandas is so much easier
proven sigil
Does anyone here use pyspark? I do not find many documentation for python and most are redirecting to Scala docs
green crow
Hello, can anyone help me with building a Healthy and unhealthy classifier?
I have 3 different datasets. I have a healthy dataset and 2 faulty datasets. I want to train my classifier.
Each dataset has 250000 rows. Each dataset is of 5 sec data. Hence, I spit the dataset into 5 dataframes. That is 50000 rows each dataframe. Now I want to train the data for classification.
I need help with how to train the classifier.
velvet thorn
proven sigil
Does anyone here use pyspark? I do not find many documentation for python and mo...
what do yo uwant to do?
velvet thorn
elfin spruce
it worked! <@!171929073063297024> thanks for the help, this is my first time usi...
yw!
 sudden swallow
Hello everyone! I have started machine learning and started with the Titanic Disaster on Kaggle. Can you please guide me to how to approach it.
patent shuttle
hey i got a pandas dataframe from which I'd like to access based of indices from this row. How can i approach that?
tall trail
u mean it doesnt seem to load properly?
 lilac geyser
Hello
I'm learning data analytics using python
And I saw this question and I have a doubt
I calculated the value z score(converted to standard normal distribution) and using the z score I found the probability with the help of z table
My doubt is that.Can we find the probability/(area under the curve) without using the z table but with the z score??
Please @ me
wintry atlas
@lilac geyser where is that question from?
lilac geyser
It's actually a quiz question
I don't know the answer
In exam I'm sure that there will be no z table given
So how do we find answers for such questions?
@wintry atlas
wintry atlas
so you just need the pdf right? @lilac geyser
tidal bough
My doubt is that.Can we find the probability/(area under the curve) without using the z table but with the z score??
No. You can, of course, remember the values for common scores like 1,2,3.
oh, lol
lilac geyser
Sorry I didn't get you
tidal bough
@lilac geyser in this particular case, you can easily guess the right answer with barely any knowledge
It's below 50%, because it's random which side the deviation is to. As for whether it's 45% or 5%, remember that the probability to be 1 deviation above the mean is around 16%. Two deviations above the mean: around 2.3%.
And the z-score here is around 1.64, so it'll be something between 16% and 2.3%. Only one of the answers is such.
lilac geyser
tidal bough
It's below 50%, because it's random which side the deviation is to. As for wheth...
1 deviation,2deviation is about the z score rite?
lilac geyser
Ohh ok got it but what if the options are like 0.0495 and 0.1281
If the options are like this then
as 1.65 is nearly equal to 2 so it's going to be 0.0495 am I right??
@ConfusedReptile#6830
tidal bough
I'd presume there just won't be such questions
because it's not really common to remember the values for more than, say, 1,2,3.
lilac geyser
tidal bough
I'd presume there just won't be such questions
Even I'm thinking the same because ztable is also not provided right?
tidal bough
but yeah, I'd expect the 5% in that case.
tidal bough
lilac geyser
Even I'm thinking the same because ztable is also not provided right?
yeah, if you can't use the table of values, then the basic ones should be enough
https://en.wikipedia.org/wiki/68–95–99.7_rule
basically, this. This is about P(-1<z<1), P(-2<z<2) and P(-3<z<3), but you can convert them into one-sided ones.
lilac geyser
Ok thanks a lot for the reply, help,time!
Can I @ you when I get doubt?
tidal bough
sure
lilac geyser
tidal bough
<https://en.wikipedia.org/wiki/68%E2%80%9395%E2%80%9399.7_rule>
basically, this....
My instructor said about this and I didn't get to know how we can use this as I'm beginner to all these
Ya now I got to know
Thanks a lot!😊😊
 atomic sierra
Hello guys, so I need some help, I'm from Brazil and I was doing an analysis of the following dataset: https://www.kaggle.com/spscientist/students-performance-in-exams
in one of its columns we have the term: "race / ethnicity" and is divided by group A, group B, group C, Group D and Group E
I don't necessarily know what that means. Is it a division by monthly income, "skin color", cultural origin? i really don't understand, can anyone help me?

Marks secured by the students in various subjects
 timber quest
I made some graphs with seaborn's regplot that have a nice third-order regression curve in them (is it called regression?). I think that's a pretty way to tell where a maximum would be. Two things. Is this a data-science-ish thing to do? How to I get the parameters? I know seaborn won't offer them, and couldn't see aynthing close here: https://www.statsmodels.org/stable/examples/index.html
timber quest
Hm. I found this. This might help: https://ostwalprasad.github.io/machine-learning/Polynomial-Regression-using-statsmodel.html
Prasad Ostwal
Polynomial regression using statsmodel and python
arctic wedgeBOT
Hey @fiery skiff!
It looks like you tried to attach file type(s) that we do not allow (.docx). We currently allow the following file types: .3gp, .3g2, .avi, .bmp, .gif, .h264, .jpg, .jpeg, .mkv, .mov, .mp4, .mpeg, .mpg, .png, .tiff, .wmv, .psd, .ai, .aep, .xcf, .mp3, .wav, .ogg, .webm, .webp, .flac, .afdesign, .m4a, .csv.
Feel free to ask in #community-meta if you think this is a mistake.
 fiery skiff
what does this error mean? KeyError: "None of [TimedeltaIndex(['09:00:00', '10:00:00', '11:00:00', '12:00:00', '13:00:00',\n '14:00:00', '15:00:00'],\n dtype='timedelta64[ns]', name='Time', freq=None)] are in the [index]"
 tacit granite
What can I create with data science?
lapis sequoia
hello
import pandas as pd

df = pd.DataFrame({
    'col1': [
        'max jo;max3;max;maxT za;max jo;',
        'max jo;maxF zero;max jo;maxD ;maxT;max jo;',
        'wmaxT za;maxF;maxbing;maxT ze;max xw;',
    ]
})


df.head()

# iwant list of unique word of col1

words = df['col1'].str.findall("\w+")

unique = set()

for x in words:
    unique.update(x)
but i want i want unique = [max jo,wmaxT za.....]
idea?
help

 wintry nacelle
I'm trying to make a cGAN by modifying the DCGAN in Tensorflow's tutorial, however I am facing an odd error:```python
InvalidArgumentError: 2 root error(s) found.
(0) Invalid argument: indices[2,0] = -1 is not in [0, 10)
[[node model_1/embedding_1/embedding_lookup (defined at <ipython-input-15-faa7848b8f9b>:9) ]]
(1) Invalid argument: indices[2,0] = -1 is not in [0, 10)
[[node model_1/embedding_1/embedding_lookup (defined at <ipython-input-15-faa7848b8f9b>:9) ]]
[[model/embedding/embedding_lookup_1/_36]]
0 successful operations.
0 derived errors ignored. [Op:__inference_train_step_3684]
Errors may have originated from an input operation.
Input Source operations connected to node model_1/embedding_1/embedding_lookup:
model_1/embedding_1/embedding_lookup/2442 (defined at C:\ProgramData\Anaconda3\envs\tensorflowpractice\lib\contextlib.py:113)
Input Source operations connected to node model_1/embedding_1/embedding_lookup:
model_1/embedding_1/embedding_lookup/2442 (defined at C:\ProgramData\Anaconda3\envs\tensorflowpractice\lib\contextlib.py:113)
Function call stack:
train_step -> train_step
Notes:
The error only SOMETIMES occurs when I test the models on random samples, but ALWAYS occurs on the training function.
x often varies in this: `indices[x,0] = -1 is not in [0, 10)`
Input datasets are created using this code:```python
(train_images, train_labels), (_, _) = tf.keras.datasets.mnist.load_data()
train_images = train_images.reshape(train_images.shape[0], 28, 28, 1).astype('float32')
train_images = (train_images - 127.5) / 127.5 # Normalize the images to [-1, 1]
train_labels = train_labels.reshape(train_labels.shape[0], 1).astype('float32')

train_images = tf.data.Dataset.from_tensor_slices(train_images).shuffle(BUFFER_SIZE).batch(BATCH_SIZE)
train_labels = tf.data.Dataset.from_tensor_slices(train_labels).shuffle(BUFFER_SIZE).batch(BATCH_SIZE)
My train function uses this, which I'm not sure is a good idea:
for image_batch, number_batch in zip(images, numbers):
train_step(image_batch, number_batch)```Yknow it's entirely possible that I'm just dumb
The error lies in the label generator, I was using tf.random.normal
I should have been using tf.random.categorical
The source of the problem was that normal could give the dataset negative numbers, which is something I guess the embedding layer doesn't like
 steel roost
hi guys, i took a help chhannel, would someone mine looking at the #🤡help-banana
 graceful geyser
Any chance someone can help with matplotlib, im very close, i just need the cubes to be on the same plt, and not show up twice
import numpy as np
import matplotlib.pyplot as plt
from mpl_toolkits.mplot3d import Axes3D
from mpl_toolkits.mplot3d.art3d import Poly3DCollection, Line3DCollection

def plot_cube(cube_definiti):
    cube_definition_array = [
        np.array(list(item))
        for item in cube_definiti
    ]

    points = []
    points += cube_definition_array
    vectors = [
        cube_definition_array[1] - cube_definition_array[0],
        cube_definition_array[2] - cube_definition_array[0],
        cube_definition_array[3] - cube_definition_array[0]
    ]

    points += [cube_definition_array[0] + vectors[0] + vectors[1]]
    points += [cube_definition_array[0] + vectors[0] + vectors[2]]
    points += [cube_definition_array[0] + vectors[1] + vectors[2]]
    points += [cube_definition_array[0] + vectors[0] + vectors[1] + vectors[2]]

    points = np.array(points)

    edges = [
        [points[0], points[3], points[5], points[1]],
        [points[1], points[5], points[7], points[4]],
        [points[4], points[2], points[6], points[7]],
        [points[2], points[6], points[3], points[0]],
        [points[0], points[2], points[4], points[1]],
        [points[3], points[6], points[7], points[5]]
    ]

    fig = plt.figure()
    ax = fig.add_subplot(111, projection='3d')

    faces = Poly3DCollection(edges, linewidths=1, edgecolors='k')
    faces.set_facecolor((0,0,1,0.1))

    ax.add_collection3d(faces)

    # Plot the points themselves to force the scaling of the axes
    ax.scatter(points[:,0], points[:,1], points[:,2], s=0)

    ax.set_aspect('auto')

x,y,z = (3,3,3)

cube_definition = [
    (x-.5,y-.5,z-.5), (x-.5,y+.5,z-.5), (x+.5,y-.5,z-.5), (x-.5,y-.5,z+.5)   # HEIGHT
]
plot_cube(cube_definition)
x,y,z = (0,0,0)
cube_definition2 = [
    (x-.5,y-.5,z-.5), (x-.5,y+.5,z-.5), (x+.5,y-.5,z-.5), (x-.5,y-.5,z+.5)   # HEIGHT
]

plot_cube(cube_definition2)
plt.show()
a job
jk
but no really check this out to get kind of an overview of what data science looks like/if you want to get into it https://www.youtube.com/playlist?list=PLtqF5YXg7GLlHv-pD8PVu6NFqjwG-_U-s

YouTube
A playlist of videos on how to learn data science curated from all of YouTube.
tall trail
I need to check a value in a column above a certain treshold for 300 values in a row in panda's, how would one go about this? I already figured out how to get everything above a certain value into a separate dataframe
woeful hamlet
I have a problem
I have 18 different weights for a model. U pass the model an image and it returns u the mask of the image. What i wanna do is display with 5 test images, all the masks given by each model with different treshold, to see which model weights perform the best
Any help on how to display them?
Like, i want a 5x18 image
each col the output of the model thresholded with different value
and row the test images
woeful hamlet
can someone take a look at #help-grapes pleasE?
nova kelp
i am currently able to load single images using import face_recognition import cv2 img = face_recognition.load_image_file("image.jpg") How do i load all the images in a folder? without loading them one by one? Thanks in advance!
 barren plume
Hi, can someone help me with this?
import numpy as np
r = int(input())
lst = [float(x) for x in input().split()]
print(lst)
arr = np.array(lst)```my code so far
arctic wedgeBOT
You are not allowed to use that command here. Please use the #bot-commands channel instead.
 last rivet
@barren plume allowed to use np.split()? or do they want you to understand the principle without any libs?
barren plume
i figured it out
i have another question
i am tryin to install 3.8.3 python using pyenv
$ pyenv install 3.8.3
python-build: definition not found: 3.8.3
The following versions contain `3.8.3' in the name:
miniconda-3.8.3
miniconda3-3.8.3
See all available versions with `pyenv install --list'.
If the version you need is missing, try upgrading pyenv:
brew update && brew upgrade pyenv
i get this
i then do an update
$ brew info python@3.8
python@3.8: stable 3.8.3 (bottled) [keg-only]
Interpreted, interactive, object-oriented programming language
https://www.python.org/
/usr/local/Cellar/python@3.8/3.8.2 (4,137 files, 63.0MB)
Poured from bottle on 2020-04-21 at 11:47:57
From: https://github.com/Homebrew/homebrew-core/blob/master/Formula/python@3.8.rb
==> Dependencies
Build: pkg-config ✔
Required: gdbm ✔, openssl@1.1 ✔, readline ✔, sqlite ✘, xz ✔
==> Caveats
Python has been installed as
/usr/local/opt/python@3.8/bin/python3
You can install Python packages with
/usr/local/opt/python@3.8/bin/pip3 install <package>
They will install into the site-package directory
/usr/local/Cellar/python@3.8/3.8.3/Frameworks/Python.framework/Versions/3.8/lib/python3.8/site-packages
See: https://docs.brew.sh/Homebrew-and-Python
python@3.8 is keg-only, which means it was not symlinked into /usr/local,
because this is an alternate version of another formula.
==> Analytics
install: 398,535 (30 days), 966,259 (90 days), 1,270,935 (365 days)
install-on-request: 11,428 (30 days), 29,656 (90 days), 42,309 (365 days)
build-error: 0 (30 days)


GitHub
🍻 Default formulae for the missing package manager for macOS - Homebrew/homebrew-core

i get this
arctic wedgeBOT
Here's how to format Python code on Discord:
```py
print('Hello world!')
```
These are backticks, not quotes. Check this out if you can't find the backtick key.
last rivet
also #tools-and-devops I know nothing about brew, maybe they do
 hoary spindle
yo can I ask a cv2 question here?
last rivet
Isn't CV2 data science? 😛
hoary spindle
AttributeError: module 'cv2.cv2' has no attribute 'xphoto'
I'm getting this error although it worked like a few months ago
 knotty ocean
is there any discord club about deeplearning?
hoary spindle
hoary spindle
```py
AttributeError: module 'cv2.cv2' has no attribute 'xphoto'
```
I'm getting...
solution to this: pip install opencv-contrib-python==4.3.0.36
hoary spindle
yeah my problem is that it was updated
 finite shuttle
Hi everyone,
I want to retrieve tweets which contains a specific word like "TESLA". I use tweepy. Is there someone who I can ask some questions ?
- For instance Can I retrieve the tweets between specific date ?
- Is there any limit per day or 15 minutes ?
- Is there any other library better than Tweepy ?
thank you
barren plume
last rivet
@barren plume and you expect us to solve it for you?
barren plume
no
once i convert into a panda dataframe
will i just loop through it
check if it is empty/nan
if it is just the pandas.DataFrame.mean
right?
if not i just print
last rivet
Yea, just a for x in y
barren plume
o ok
thx
lst_df = pd.Series(lst)
final = lst_df.fillna(lst_df.mean()).round(1)
print(final)
this works?
wouldn't series be better
last rivet
Bruh, did you even read & type? It said to return a dataframe not a series. But if nobody checks the code a series is fine I guess
I'm not judging
last rivet
As long as you understand tje principle and how things work
 fading sail

hey guys how do i remove those spaces between the borders and the green lines?
i want the 0 of x axis meet the 0 of y axis
 shadow quiver
What would be your first approach to develop an AI that solves mathematical problems like "count 5 to 100", "divide 80 by 4", "is 54 greater than 60?"?
 upper wind
fading sail
https://cdn.discordapp.com/attachments/696353510488539206/805022767161278504/how...
upper wind
fading sail
https://cdn.discordapp.com/attachments/696353510488539206/805022767161278504/how...
try
plt.xlim([0,10])
 steady wigeon
hello, i try to do a sentiment analysis project. I already finished the development of the algorithm which is I built from scratch. so as for now, i try to do a simple gui prototype using tkinter. I tried to do the sentiment analysis using textblob and it successful display. To learn more about the tkinter, I want explore by trying do the prediction using my own scratch algorithm. I had search for an example in google, but still I do not find anything that could help me. So do anyone of you have idea on how to use my own engine model to do the gui prediction?
fading sail
yep ty for ur response
I found it a bit later after posting the question
but i hv another issue.
do u know how i can share x axis in this graph?
@upper wind
upper wind
fading sail
yep ty for ur response
I found it a bit later after posting the question
but i h...
what do you mean by share x axis?
overlap the graphs?
smth like this?
fading sail
no i want the readings of the top x axis to disappear @upper wind
let me edit the picture to how i want it to be and share it with u 😅
i want to remove that reading which is under the red box
yes eugene
upper wind
try removing the labels: plt.gca().axes.xaxis.set_ticklabels([])
i think this achieves the desired result
@fading sail
upper wind
😄
 pure phoenix
Hi Everyone, Would I join the team? This team is interested. Is it a closed community? I am learning in the data science skill with python and R.
pure phoenix
Do you interested in anyone predication?
 native bay
Hey I wanted to implement minimax on chess could anyone give an idea how do I iterate with a particular depth.
The code is at:
https://github.com/NamanMunjal/ChessAI

GitHub
A chess AI using minimax. Contribute to NamanMunjal/ChessAI development by creating an account on GitHub.
 acoustic halo
@native bay Do you have a scoring system for the ai to evaluate how good moves are?
native bay
yes so it technically just sees what piece it can eliminate and scores on that basis now i want it to do that like 2-3 moves ahead so it starts doing strategies too
like if it can eliminate king by any chance the points increase by 200 whereas killing a pawn will get you only 1 point
acoustic halo
Okay so basically what you do now is generate a huge recursive tree of every possible move in sequence to whatever depth you want
You return the lowest score upwards to the parent node and pick whichever path is the least worse
native bay
something like a binary tree?
acoustic halo
It will be more than a binary tree because each node will have loads of children
native bay
so i have to basically build a whole new data structure class for this


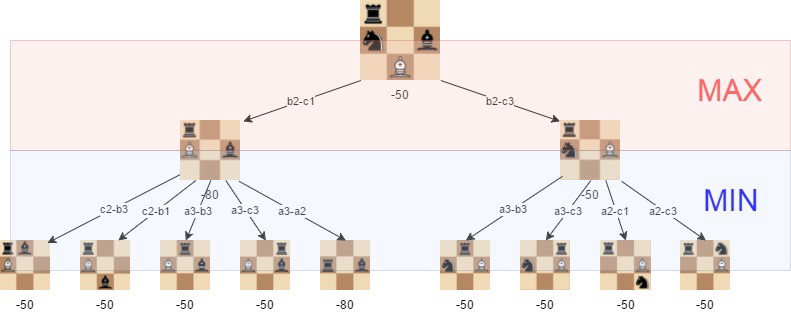 tidal bough
I'm not sure you need to, since you don't need to store the tree, but rather search it depth-first.
though it would be more efficient to store it, since you'll reuse one branch of it the next turn
native bay
hmm any idea about the space time complexity because a chess game can have 10^121 possibilities or will that just depend on the depth
native bay
tidal bough
I'm not sure you need to, since you don't need to store the tree, but rather sea...
so like build a tree and then depth for search right
acoustic halo
Unless you find a win condition
tidal bough
native bay
hmm any idea about the space time complexity because a chess game can have 10^12...
It will scale exponentially with the number of moves predicted, yes. That's why you can't have that many, especially not in Python where iteration is slow.
native bay
every move can cost me almost 32 new moves
acoustic halo
more because each piece can move in many directions
native bay
acoustic halo
more because each piece can move in many directions
yes 32 is like minimum
tidal bough
acoustic halo
Can you depth first a minmax tree?
For each node, you need to calculate the values of all children to calculate the value for the node, yes. But that doesn't seem to me that it means you can't depth-first it.
native bay
the problem is as deep as i think about making that tree is the more trouble i am falling into
acoustic halo
tidal bough
For each node, you need to calculate the values of all children to calculate the...
Sorry I was assuming the whole tree would be stored in memory
tidal bough
let's assume you are looking d steps in advance, and there are n possible moves on average
acoustic halo
native bay
the problem is as deep as i think about making that tree is the more trouble i a...
A tree is simple to make really, you have a class, node, that contains an array of more node objects in it
tidal bough
that's n + n^2 + n^3 +... + n^d = (n^(d+1)-n)/(n-1) calculated positions total
if you reuse one of the brances next turn, you'll only need to calculate the n^d new positions
native bay
ok so how do i know the parent node
acoustic halo
native bay
ok so how do i know the parent node
Why do you need to? Plus the parent can pass itself as a parameter when creating the children
native bay
i have worked with a binary tree and it had only 2 values so it was easy but this can literally have 128 children
native bay
acoustic halo
Why do you need to? Plus the parent can pass itself as a parameter when creating...
i need to store parent information to select the path giving me the least damage
tidal bough
so by storing the tree, you're only getting around 1/n more performance - for n=25, that's 4%.
acoustic halo
native bay
i need to store parent information to select the path giving me the least damage
You can use a recursive function that belongs in the parent node, which recursively iterates though all the children nodes and returns the lowest, or greatest score
tidal bough
So for chess, it sounds to me like storing the tree doesn't really matter and you might as well recalculate it every turn.
native bay
tidal bough
So for chess, it sounds to me like storing the tree doesn't really matter and yo...
but wont that increase the calculation time because if i try to go to depth 10 it will take forever to calculate the best path
acoustic halo
native bay
but wont that increase the calculation time because if i try to go to depth 10 i...
@native bay Look up alpha-beta pruning
That will cut down the number of branches
native bay
ohk
acoustic halo
But first just get the simple min max working to a low depth
native bay
yes that will be my first goal
tidal bough
native bay
but wont that increase the calculation time because if i try to go to depth 10 i...
If my calculations are right, it's precisely because the tree is increasing in size so fast with the depth that this is true. Because most of the tree's nodes are the leaves, calculating the first d-1 layers only takes about 1/nth of the total time, so not having to recalculate them doesn't increase the performance much.
native bay
ok thanks guys
acoustic halo

freeCodeCamp.org
by Lauri Hartikka A step-by-step guide to building a simple chess AILet’s explore some basic concepts that will help us create a simple chess AI: move-generationboard evaluationminimaxand alpha beta pruning.At each step, we’ll improve our algorithm with one of these time-tested chess-programming techniques. I’ll demonstrate how
Happens to have both minimax and alpha-beta pruning
tidal bough
also, I should note that minimax sounds like the kind of algorithm that will never be good in Python
native bay
actually i am pretty new to the field of AI i am just 14 so i want to discover the field on my own by just understanding the idea because copying code doesnt make sense to me
native bay
tidal bough
also, I should note that minimax sounds like the kind of algorithm that will nev...
is it because of python's slow speed?
tidal bough
yup
acoustic halo
That resource doesn't contain any code for it at a glance, just the concepts behind it
native bay
ohk will read it then
acoustic halo
Or if it does, you can easily ignore it
 dusty anchor
hey guys can i ask here for help on CNN?
 spring ivy
idk if if this goes here but its the closest i could find
START
s = "help"
#how do i find a variable inside of a text file like keywords.txt
END
Im trying to organize a huge list of words inside a text file
nevermind
last rivet
Hi, any scrapy users here? I'm trying to understand error handling for it.
I've written a crawler, it works fine. But you know, the website might not like you for some reason or the server rather. Errors like 503 might get thrown, but what happens after 10 retires, does the failed URL get saved or how what class should I fork in the middelware to save failed URLS? 🙂
My end goal is to save the failed urls to a list so I can go through them later on
lapis sequoia
last rivet
Hi, any scrapy users here? I'm trying to understand error handling for it.
I've...
you can just try logger in python and save the 503 errors in some log file and review it later.
 old meteor
Greatly appreciated to help me get rid of the first column and use 'Symbol' as the new index. I have spent more than an hour and failed this....😥
That "Open position summary" can't get off however I try
 tawdry roost
@old meteor did you try index_col={# of symbol}?
I'm guessing you're reading it from csv or something, so when you read it just index_col=0/1/2 whichever
and maybe even index.name="name"
# grab the data
data = pd.read_csv('msft.csv', index_col=0, parse_dates=True)
data.index.name = "Date"
data.shape```
this is how I do it, I just use date as indexThanks for the reply. I was reading from csv, and I did use index_col=#. But I told it to use the 'open position summary' column to be the index column at first, because later I needed it that way for a moment. So...is there a way to get rid of it now...?
I thought it should be easy to change. But that 'Open Position Summary' just seems to get stuck there forever...
tawdry roost
umm no idea, I'm just learning myself as well, so no clue why it keeps using your old one. for me just index_col=# & index.name work fine to whatever I set it to
old meteor
The original csv looks like this.
df = df[df.index=='Open Position Summary']
I make the first column to be index to get rid of all the other rows with the second line of code
If you have a way to do it without making the first column to be index?
tawdry roost
try df.set_index('column_name') @old meteor
btw your index_col should be 2 if you want ticker/symbol
old meteor
tawdry roost
btw your index_col should be 2 if you want ticker/symbol
You misunderstood me. I was saying I intentionally make the first col to be index because I want to do the 2nd step which is to get rid of all the other rows with df =df[df.index=='Open Position Summary']
tawdry roost
hmm
actually, no idea how to do exactly what you want sorry, but i think df['Open position Summary'] should give you only those columns and nothing else
old meteor
My first step was to get rid of all the rows that don't have 'Open Position Summary' after reading the csv.
 compact matrix
Has anyone faced kernel restart issue in Spyder IDE? Any solution for the same ?
 mild meadow
hey guys how could i sum these in 3 groups
so for example group 0-1 would have 0.66+0.12=0.78
group 2-3 and group 4-5
pandas
scenic hollow
Can we use randomised searc cv if our dataset deals with datetime prediction as we cant do cv on any dataset involving datetime?
cobalt jetty
because it has a datetime, is your dataset a time series?
if so, you might want to look into a window search (I think it's the proper name).
misty flint
mild meadow
hey guys how could i sum these in 3 groups
access the elements you need in the array and then sum them?
pandas indexing is the same as numpy
woeful hamlet
Guys, i have a model that returns the mask of an image. Can i combine different weights of the model to get different but similar masks into 1 single mask for better results?
 shy moat
In quasi-Monte Carlo method, how many samples are appropriate for m-dimensional multivariate normal distribution to compute the expected value?
lapis sequoia
Can someone explain cost function and how to calculate it please?
 rotund dagger
is it possible to use filtering to get answers similar to groupby() without using groupby?
velvet thorn
is it possible to use filtering to get answers similar to groupby() without using groupby?
@rotund dagger what do you want to do?
Can someone explain cost function and how to calculate it please?
@lapis sequoia a cost function calculates the difference between, in general, an answer predicted by a model and the “correct” answer
so it depends on what cost function you use.
it’s just a mathematical function.
rotund dagger
well im working in a census csv and i am trying to find which state has the highest density for each race respectively. the propblem i am having is that the census data lists by state and county so i first felt that i had to groupby(['State']) in order to have the dataframe display each state grouped together, and then aggregate the data i am looking for which has worked to collect the answer i need but its in the wrong format. when i asked my professor he simply said dont use groupby use filtering instead and i have tried every possible way i can think of and i cant seem to figure out how to get remotely close without using groupby().
the final format should display like : white: Texas, Hispanic:Vermont, ect. what i get is White 95.4, it cuts the state off