#data-science-and-ml
1 messages · Page 253 of 1
 arctic wedgeBOT
 desert oar
!e ```python
import sys
print( sys.float_info.max )
@desert oar :white_check_mark: Your eval job has completed with return code 0.
1.7976931348623157e+308
 merry ridge
Just basic addition, subtraction, multiplication, and exponentiation,
desert oar
this is kind of stupid but can you just divide by 1e400, do the operations you need, then multiply by 1e400 again?
maybe using arbitrary-precision decimals
!d g decimal
arctic wedgeBOT
Source code: Lib/decimal.py
The decimal module provides support for fast correctly-rounded decimal floating point arithmetic. It offers several advantages over the float datatype:
• Decimal “is based on a floating-point model which was designed with people in mind, and necessarily has a paramount guiding principle – computers must provide an arithmetic that works in the same way as the arithmetic that people learn at school.” – excerpt from the decimal arithmetic specification.
• Decimal numbers can be represented exactly. In contrast, numbers like 1.1 and 2.2 do not have exact representations in binary floating point. End users typically would not expect 1.1 + 2.2 to display as 3.3000000000000003 as it does with binary floating point.
... read more
merry ridge
No, that will cause stiffness problems
desert oar
python supports arbitraily large integers
can you stick with integers?
that said im not sure how to even create 1e400 as an integer
!e ```python
print( 10400 + 10400 )
@desert oar :white_check_mark: Your eval job has completed with return code 0.
20000000000000000000000000000000000000000000000000000000000000000000000000000000000000000000000000000000000000000000000000000000000000000000000000000000000000000000000000000000000000000000000000000000000000000000000000000000000000000000000000000000000000000000000000000000000000000000000000000000000000000000000000000000000000000000000000000000000000000000000000000000000000000000000000000000000000000
I don't think I will be able to no
desert oar
you need 400 significant figures and fractions?
merry ridge
I suppose I realistically do not need the decimals
desert oar
i think decimal might support arbitrarily large numbers as well as arbitrary precision
merry ridge
but I do need these calculations to not just turn into being infinity
desert oar
!e ```python
from decimal import Decimal
print( Decimal(10400) + Decimal(10400) )
@desert oar :white_check_mark: Your eval job has completed with return code 0.
2.000000000000000000000000000E+400
so you can do it, but integers will probably be faster and take up less memory
so if performance isn't a concern just use Decimal
merry ridge
That looks like it will be able to do it.
I am hoping when I hear back from the principal investigator for this side project they just made a sequence of unfortunate typos when emailing me the problem statement because I really do not want to have to worry about these computational issues
 delicate nymph
hello
i've been told you might help me with a problem i have
i am using pandas, i have two dataframes of different length with datetime index
my_list1 = list((Counter(obs.index) - Counter(data.index)).elements())
i use this code to find the same dates in both frames but i actually want the ones that are different. is there a way to do that?
merry ridge
There is probably a smarter way to do it, but you could generate a list of the two date times and use the symmetric difference?
delicate nymph
symmetric difference?
merry ridge
It is a set operation like union and intersection. It gives you elements of A or B that are not in the intersection of A and B.
 steady dome
is this a place I can ask a data science question?
or do I hit up an available help channel for help and this is more discussion based in special topics?
 wise garden
what's your question
steady dome
I'm trying to see if there is any sort of correlation between two columns of data. I first thought I could dump in my data like:
r, p = scipy.stats.pearsonr(x=x, y=y)
but my second column is a boolean yes or no; the value is either 0 or 1.
so now I'm not sure if that makes sense? I have a collection of numbers in the first column but the second column only has two possibilities and I feel like I should be able to think clearly and tell if that is an issue that makes this approach not fit but I've been staring at this too long and too closely to see clearly.
I'm sorry if this is dumb.
 velvet thorn
@steady dome it's fine if it's binary
@delicate nymph there's a more idiomatic way IMO
outer join on index, then drop the ones that come from both DataFrames
of course, if it works, it works.
steady dome
it is?! thank dog
velvet thorn
it is?! thank dog
@steady dome yes, subject to certain assumptions
but in a loose, general sense, it's fine
 merry fern
pandas/dataframes - how would you loop thru a dataframe and check for rows w/ a dupe of Col A/B pairs but don't delete the row, save data from Col C?
want to take isolate to unique Col A/B pairs and sum Col C
desert oar
generally you shouldnt be looping through rows
for example you can do something like this data.drop_duplicates(subset=["A", "B"])["C"].sum()
merry fern
generally you shouldnt be looping through rows
@desert oar i was reading about that, vectorization over looping...
merry fern
https://paste.pythondiscord.com/bisakosiqe.py
this is where i'm at @desert oar
 rustic apex
With libraries like Numpy, Pandas, Scipy, ect.... is does Datascience go by library? At times? I’m learning Numpy now and then I’ll look at Pandas
 worldly schooner
please anyone tell me how can i concatenate a string with a variable in print statement.
 brittle agate
@worldly schooner
x = 'hello'
print('text: ' + x)
I hope u know how to convert integer to string mate.
 keen pine
hello,i working on textCnn and i've built model for it but in first epoch, in model validation loss increase while traning loss decrease, how thats possible? my data set balanced and shuffled.
 lapis sequoia
with pandas:
df.plot()
how do I use one of the column of the df for the x-axis?
keen pine
transform dataset
 paper niche
https://pandas.pydata.org/pandas-docs/stable/reference/api/pandas.DataFrame.plot.html @lapis sequoia you should be able to specify the column name for x
lapis sequoia
@paper niche I have 2 df that I'm trying to plot on the same plot
but this the result I get so fat
 feral spoke
Guys where can I find examples to practise on pandas along with the questions related to datasets and solutions with it?
 proper needle
Hi all. Anyone knows libs, that work good with docx templates. Specifically with end/start of new page? Problems are with repeatable footer and last line of tables. P.S. sorry for my English
paper niche
but this the result I get so fat
@lapis sequoia get a help channel #❓|how-to-get-help and ping me; I'll see if I can help
@feral spoke kaggle has a short pandas course you could do https://www.kaggle.com/learn/pandas
Solve short hands-on challenges to perfect your data manipulation skills.
also there are community tutorials available; this is featured on the pandas docs, for example: https://github.com/guipsamora/pandas_exercises

GitHub
Practice your pandas skills! Contribute to guipsamora/pandas_exercises development by creating an account on GitHub.
lapis sequoia
@paper niche managet to solve it, thanks
 mild topaz
suppose i have a folder structure this way ```python
demo --> training--> armenia --> driving_licence --> invalid images (img1.jpg , img2.jpg)
--> valid images (img1.jpg , img2.jpg)
--> passport --> invalid images (img1.jpg , img2.jpg)
--> valid images (img1.jpg , img2.jpg)
      testing--> armenia --> driving_licence --> invalid images (img1.jpg , img2.jpg)
                                              --> valid images  (img1.jpg , img2.jpg)
                         --> passport        --> invalid images (img1.jpg , img2.jpg)
                                             --> valid images   (img1.jpg , img2.jpg)
what training path i should give means till which folder ?
do u get my point here? @eager heath
keen pine
should datasets always be balanced ?
is there any situation that be convenient for imbalanced datasets ?
velvet thorn
should datasets always be balanced ?
@keen pine most real life data isn't balanced
keen pine
@velvet thorn yes that's right nut my question about models.
all models should be trained with balanced sets.
is above always true ?
 rugged owl
Hi everyone, I'm working with the open-source project called dstack (https://github.com/dstackai/dstack). We'd like to kindly ask you to help us and everyone else in the community get insight from the data science community on how reports, dashboards, and data applications are built with Python or R.
We've designed a quick survey and we'd like to kindly ask everyone for help.
Here's the survey: https://dstackai.typeform.com/to/Xi3ZryqX
All respondents will of course receive a complete report. In order to get even more interest from the community, we will give away a few free licenses for JetBrains PyCharm to randomly chosen respondents.
Thank you, everyone!

Turn data collection into an experience with Typeform. Create beautiful online forms, surveys, quizzes, and so much more. Try it for FREE.
velvet thorn
is above always true ?
@keen pine no
desert oar
@merry fern df_int and df_pb are just numbers, i.e. sums. you want to compute the sum within group of duplicates? that's a totally different operation..
maybe you want .groupby instead
merry fern
@merry fern
df_intanddf_pbare just numbers, i.e. sums. you want to compute the sum within group of duplicates? that's a totally different operation..
@desert oar
Hmm I thought dfs were tables of data, I have strings and numbers in there.
What I want to do is consolidate duplicate A/B pairs
 formal oasis
right
web scraping
I'm using scrapy on a job website as a way to learn how to datascrape
and I have came across a problem
I got the tutorial documentation code and changed a few variables to test
class Seek(scrapy.Spider):

    name = "Seek"

    def start_requests(self):
        url = 'https://www.seek.co.nz/'
        tag = getattr(self, 'tag', None)
        if tag is not None:
            url = url + tag + '-jobs/in-All-Auckland'
        yield scrapy.Request(url, self.parse)

    def parse(self, response):
        for jobs in response.xpath("//div[@class='_3MPUOLE']"):
            yield {
                'Job Name': jobs.css('._2iNL7wI::text').get(),
                'Classification': jobs.css('._3AMdmRg[data-automation="jobClassification"]::text').get(),
                'Sub classification': jobs.css('._3AMdmRg[data-automation="jobSubClassification"]::text').get(),
                'Location': jobs.css('._3AMdmRg[data-automation="jobLocation"]::text').get(),
                'Area': jobs.css('._3AMdmRg[data-automation="jobArea"]::text').get(),
                'Desc': jobs.css('.bl7UwXp::text').get(),
on this site, div containers are used as a way to list job listings
in which there are child containers which contain the actual needed information
I'm trying to loop over all of them but I just can't
no matter what I try
desert oar
@merry fern just because you call the variable df, doesn't make it a dataframe
if df is a DataFrame then df['y'] is a Series, and df['y'].sum() is just a number
also it's considered bad style to use triple-quoted strings as general-purpose comments
consolidate duplicate A/B pairs
what do you mean by consolidate here?
merry fern
Gotcha I need to look at it.
I added those triple quotes last night to narrate the code.
desert oar
also there's no reason to abbreviate variable names 😉
filenames is perfectly fine, fns is hard to read
merry fern
what do you mean by consolidate here?
@desert oar
The data is Col A B C D
a pair of col A and B creates a unique item, with characteristics C and D
desert oar
you can just do .drop_duplicates() on the dataframe itself then
you might also want to consider setting Type and ISIN to be the index columns, but that will cause the dataframe to have a "multiindex" which can be harder to work with
@merry fern what isnt clear to me is, what do you want to do with the values of C and D from the duplicate records
do you want to just delete the rows that are duplicates by A and B? do you want to sum C and D within each A,B group? do you want to collect/aggregate C and D values some other way?
merry fern
i want to sum C within each A,B group correct
D is a different animal, probably average
desert oar
ok, then that requires groupby, not drop_duplicates
import pandas as pd

filenames = {'int': './internal.xlsx', 'pb': './pb.xlsx'}
sheets = {'int': 'Internal', 'pb': 'PB'}

df_int = pd.read_excel(
    filenames['int'],
    sheets['int'],
    header=0,
    usecols=[0, 2, 4, 5],
    names=['Type', 'ISIN', 'Quantity', 'Price']
)
df_int = df_int.sort_values(by=['Type', 'ISIN']).reset_index()

df_pb = pd.read_excel(
    filenames['pb'],
    sheets['pb'],
    header=3,
    usecols=[4, 6, 10, 11],
    names=['Type', 'ISIN', 'Quantity', 'Price']
)
df_pb = df_pb.sort_values(by=['Type', 'ISIN']).reset_index()

df_int['Price'] = df_int['Price'] * 100

df_int_agg = df_int.groupby(['Type', 'ISIN']).agg({
    'Quantity': 'sum',
    'Price': 'mean'
})

df_pb_agg = df_pb.groupby(['Type', 'ISIN']).agg({
    'Quantity': 'sum',
    'Price': 'mean'
})
then you can do ```python
diff_cols = ['Quantity', 'Price']
df_agg_diffs = df_int_agg[diff_cols] - df_pb_agg[diff_cols]
so the goal here, is to take the 2 dataframes (df_internal / df_pb), and create a results table that shows each unique ColA/B pair with the difference between the 2 lists in quantity and price
desert oar
why don't you run this and see what df_agg_diffs looks like
merry fern
(this is my first data science project, i have been taking tutorials and reading docs for 3 weeks, thank you for your help)
desert oar
let me know if its still not what you need
it looks like you did a good job finding a lot of pandas functionality already
a lot of people read garbage tutorials and don't/can't understand the docs or don't bother trying to read them
so you're doing well by that standard
merry fern
so now df_int_agg and pb_agg are lists, not dataframes ?
same with diff_cols
and df_agg_diffs
C:\Users\micha\PycharmProjects\PositionRec\venv\lib\site-packages\pandas\core\indexes\multi.py:3366: RuntimeWarning: The values in the array are unorderable. Pass `sort=False` to suppress this warning. uniq_tuples = lib.fast_unique_multiple([self._values, other._values], sort=sort)
desert oar
no, they shouldnt be lists
diff_cols is obviously a list
can you give me some sample data to work with?
i want to make sure im doing it right but its hard to work blind
doesnt need to be real numbers
just a handful of rows that mimic the real thing
merry fern
do I send to you in DM ?
desert oar
you can just post here
merry fern
1 sec let me clean up
desert oar
you know what, let me just generate some
its fine
i dont want to see your real data
merry fern
thank you
lapis sequoia
I'm trying to use the pd.series().quantile() method
but pandas return ValueError: Can only compare identically-labeled Series objects
desert oar
@merry fern https://repl.it/@maximum__/JadedUnluckyBellsandwhistles#main.py this worked how i expected it to work

@lapis sequoia you need to show the code you used and the full error output
 solid blaze
Greetings strangers. I have a question regarding how to properly merge dataframes in Pandas so the models built on the data are at least useful.
lapis sequoia
boot_mean_diff = []

for i in range(3000):
    boot_before = before_proportion.sample(frac=1, replace=True)
    boot_after = after_proportion.sample(frac=1, replace=True)
    boot_mean_diff.append(boot_after - boot_before)
print(boot_mean_diff[:11])
# Calculating a 95% confidence interval from boot_mean_diff
confidence_interval = pd.Series(boot_mean_diff).quantile([0.025, 0.975])
confidence_interval
thanks, looking into it, i should be able to extrapolate technique from this and work on it more...
desert oar
@solid blaze you need to clarify what exactly you mean by "properly" and "merge", and you need to explain how the "models built on the data" part is related
lapis sequoia
@desert oar
https://www.paste.org/110164
www.paste.org - allows users to paste snippets of text, usually samples of source code, for public viewing.
desert oar
@lapis sequoia it looks like boot_mean_diff is a list of dataframes? this is confusing code
 runic stream
hey! so i'm trying to make a prediction model (using GRU) for heart conditions, and it has 5 classes (which i numbered as 0-4) but while training, every epoch the loss is 0. i don't understand this and also the predicticted values are all 1. can someone help? should i paste my code here or in one of the help channels?
desert oar
it looks like boot_after - boot_before is meant to be a single number, but i don't think that's what you actually get here
did you mean to do size=1 instead of frac=1?
@runic stream yes post your code here, also can you share what % of the data is in each class?
solid blaze
@desert oar Thank you for the reply! It's like this. I have two dataframes. One has the population data for each neighbourhood in Toronto. The other has the ratings, categories and price tiers of restaurants on each neighbourhood, I have between 5 to 10 restaurants per neighbourhood. I want to evaluate how the population data affects the ratings of each restaurant. My question is how do I go about joining those two dataframes? Do I add the population data of each neighbourhood to every restaurant result? Do I take an "average" of the restaurants and merge it with the neighbourhood data? What's the correct way of going about this?
desert oar
hm. i dont see anything egregiously wrong with your code, but im not well-versed in the numerical/computational details of adam and neural nets. how imbalanced is the data? @runic stream
runic stream
majority of the classes are 0, wait ill paste the y array
desert oar
@runic stream i dont need the whole y array
rustic apex
When you start with Data-Science, what libraries should you learn/focus on?
desert oar
highly imbalanced data might be the problem
runic stream
but then it should predict 0 right?
desert oar
@rustic apex core python competence, and numpy, pandas, and matplotlib
yes it should be predicting mostly/all 0 if the training data is mostly/all 0
runic stream
its predicting all 1
desert oar
check your data then
make sure you didnt goof up the data processing
and try to fit just a plain logistic regression first, purely as a baseline
your NN should always do better than logistic regression otherwise you are wasting your time with the NN
(or you designed a particularly bad network architecture, or there is a bug in your data/code)
ah wait is this image data
maybe never mind, sorry i thought it was just tabular
runic stream
i'm trying to implement a paper, and i used their architecture
desert oar
right. in that case we can rule out the architecture as the problem
especially if youre using the same hyperparameters as them
runic stream
yes same
desert oar
not familiar
runic stream
oh ok
desert oar
way outside my normal problem domain
@solid blaze that's a great question. what question are you actually trying to answer?
from a probabilistic perspective, the first case you are proposing a model where the rating of a restaurant is a random variable, and the mean of the random variable depends on the population of the neighborhood
it really depends on whether you want to make inferences about neighborhoods or restaurants
if you want to answer questions about restaurants, dont aggregate restaurants
if you want to answer questions about neighborhoods, do aggregate restaurants to the neighborhood level
obviously this is a gross oversimplication
and if you are just exploring the data without a clear direction yet, try everything
solid blaze
@desert oar I want to be able to extrapolate restaurant ratings based, neighbourhood of choice (population), type of restaurant and price tier. I also have the average rental cost per square feet, to see if this determines the price tier of the restaurants.
desert oar
then it sounds like you should not average over restaurants
right?
how could you possibly get restaurant-level inferences if you average across all restaurants in a neighborhood?
solid blaze
Hmm, then I have the doubt. If I'm adding the same data to each restaurant. Am I not not messing with the data in some way? I don't have the same amount of restaurants per neighbourhood.
desert oar
ah 🙂 that's a good question. it depends somewhat on the model you have in mind
in general though, "no you are fine" -- with one caveat
solid blaze
I was thining of doing some basic multiple linear regression just to see what sticks.
desert oar
yeah
i think you are fine to aggregate
what might happen is that your model errors are correlated within neighborhoods
which technically violates the iid assumption
and it is very likely that your data is not iid as there are almost certainly unobserved factors that are common among restaurants within the same neighborhood
(what im about to explain applies to pretty much any model, not just linear regression - including deep learning)
including neighborhood in the model means that the average restaurant rating predicted by your model is conditional on the neighborhood
in a linear model, this means that changing the neighborhood amounts to shifting the average rating up or down by some amount
solid blaze
So...to safeguard the iid assumption, would it be best to have an equal amount of restaurants on each neighbourhod?
desert oar
so if the neighborhood has additional influence on the rating apart from just shifting the average, then it technically becomes unobserved heterogeneity, i.e. something that causes the model errors to be statistically interdependent, i.e. violating the iid assumption
no, number of restaurants per neighborhood has absolutely nothing to do with it
solid blaze
Oh..OK-
desert oar
it has to do with how exactly the neighborhood influences the rating
however, in a lot of cases this iid assumption violation simply doesn't matter
and in your particular case i recommend ignoring it for now, but keeping it in the back of your mind
the problem you are most likely to encounter is that the variance of rating might be different within each neighborhood - a linear regression model typically assumes constant error variance across all the data
this will throw off the results of statistical inferences like hypothesis tests and confidence intervals
so while i think a multiple linear regression is perfectly useful and valid in your case, i would be very wary of actually doing statistical inference on the fitted model
at least not without bringing to bear more sophisticated modeling methods that can account for the unobserved/uncaptured effect of neighborhoods
and like i said, this is a very important concept that applies to almost all statistical modeling and machine learning that i know of, even when the model is complicated and nonlinear
i wish i had a good book or article reference for this, i cant remember where i first learned this stuff. maybe an econometrics textbook, or gelman&hill's hierarchical modeling book
rustic apex
@desert oar 👍 how long untill someone can be proficient to work with Datascience? (Studying themselves)
solid blaze
And that's exactly what I want to determine. Each neighbourhod has a distinct population distribuition, some older, other younger. And different incomes, I want to explore how to these affect restaurant ratings, maybe some wealthier neighbourhood prefer more expensive restaurants and give higher rating to those. While less..."fortunate" restaurants with younger population prefer cheaper restaurants.
desert oar
@rustic apex no idea, it took me years and i still consider myself a "high functioning moron"
solid blaze
I may be over my head in this.
desert oar
nah you arent over your head
go ahead with your model. its fine
copy down what i wrote into a note file somewhere
rustic apex
@desert oar what type of work do you do?
desert oar
and look at it in a month
one thing you will want to do is plot the residuals of your model
you especially want to look at the distribution of residuals by neighborhood
@rustic apex my job title is "data scientist", for whatever that is worth
solid blaze
That's exactly what I'm going to do, plot residuals. But I wanted to to have an idea of what might happen when I add neighbourhood population data to each restaurant result on my dataframe. I now have a better idea of what might happen. I'll have to evaluate every model to the best of my abilities.
desert oar
if it makes you feel better, the heterogeneity is always there, whether or not you add the feature to your model 🙂
so adding "neighborhood population" to your model can only help reduce its effect
solid blaze
Even if it's not added on the same "proportion"?
merry fern
how long have you been working in python/data science @desert oar ? you seem very knowledgeable 🙂
desert oar
what do you mean by that @solid blaze ?
solid blaze
@desert oar Thank you for taking the time to answer to my questions. I'll go back to number crunching.
merry fern
cool. best resources you've used to learn on your own? i have python for finance and python for data science, but there's so much info im not sure where to focus....
solid blaze
what do you mean by that @solid blaze ?
@desert oar I mean, some neighbourhoods will have 10 restaurants. Others only 3. So maybe the effect of those neighbourhoods with more results will skew the model.
It probably means not all neighbourhoods are equally suited for opening restaurants, or at least, opening restaurants that would get any good ratings.
desert oar
@merry fern https://stats.stackexchange.com and https://towardsdatascience.com can be nice places to get exposed to ideas and topics that you dont currently understand, which might help give you some direction
merry fern
thank you.
solid blaze
@merry fern Courserra and Kaggle can also give lots of info. What little info I have, I picked it up from those places.
merry fern
is this correct, if i want to drop rows that have NaN in both of these columns, but not only one?
df_agg_diffs = df_agg_diffs.dropna(['Quantity', 'Price'], inplace=True)
@desert oar
desert oar
that will drop rows that have missing values in either column
@solid blaze neighborhood size shouldnt skew the model for any mathematical reason. but
It probably means not all neighbourhoods are equally suited for opening restaurants, or at least, opening restaurants that would get any good ratings.
this is an astute observation, and it's heading towards a discipline called "causal inference". unfortunately it's outside the scope of what you can handle with a simple linear model. one thing you can do is also include a count of the number of restaurants in the neighborhood, in addition to the neighborhood population
but thats only useful if you know the true total # of restaurants in the neighborhood
the 5-10 in your dataset almost certainly is not related to the true number of restaurants in the neighborhood
and the true number of restaurants in the neighborhood will also depend on the physical geographical size of the neighborhood as well as its population
so id actually leave it out unless you can get the true number (or at least an estimate of the true number) from somewhere
solid blaze
HMMMMMM!!!!. iiiiiinteresting. I'll throw some code around this new info. THANK YOU so much.
desert oar
good luck
solid blaze
Maybe if I scrounge Toronto's city "registered restaurants" database, or something similar and then search the ratings of those who are on the database....but I digress. And the scope of this hobby project begins to creep beyond my current skill level and time available. I'll focus on a less ambitions; albeit flawed, initial model first.
merry fern
I guess this is wrong?
df_agg_diffs = [df_agg_diffs['Quantity'].notnull() & df_agg_diffs['Quantity'] != 0]
print(df_agg_diffs)
I am trying to filter out NA/null and 0's
I tried using ~
solid blaze
missing df_agg_diffs at the beginning of the of the right side of the assignation.
merry fern
thanks, that almost worked, it returned a few values then i got:
C:\Users\micha\PycharmProjects\PositionRec\venv\lib\site-packages\pandas\core\indexes\multi.py:3366: RuntimeWarning: The values in the array are unorderable. Pass `sort=False` to suppress this warning. uniq_tuples = lib.fast_unique_multiple([self._values, other._values], sort=sort)
@solid blaze
 lusty coral
df_agg_diffs = [df_agg_diffs['Quantity'].fillna(0) != 0] is easier
solid blaze
df_agg_diffs['condition 1' & 'condition 2']
merry fern
df_agg_diffs = [df_agg_diffs['Quantity'].fillna(0) != 0]is easier
@lusty coral that produced some True/False boolean results
lusty coral
oh, sorry let me fix
df_agg_diffs = df_agg_diffs.loc[df_agg_diffs['Quantity'].fillna(0) != 0]
it was a filter basically 😄
mild topaz
when i train a model for the following folder structure```python
demo --> training--> albania --> driving_licence --> invalid images (img1.jpg , img2.jpg)
--> valid images (img1.jpg , img2.jpg)
--> passport --> invalid images (img1.jpg , img2.jpg)
--> valid images (img1.jpg , img2.jpg)
      testing--> albania --> driving_licence --> invalid images (img1.jpg , img2.jpg)
                                              --> valid images  (img1.jpg , img2.jpg)
                         --> passport        --> invalid images (img1.jpg , img2.jpg)
                                             --> valid images   (img1.jpg , img2.jpg)

     training--> armenia --> driving_licence --> invalid images (img1.jpg , img2.jpg)
                                             --> valid images   (img1.jpg , img2.jpg)
                         --> passport        --> invalid images (img1.jpg , img2.jpg)
                                             --> valid images   (img1.jpg , img2.jpg)

     testing--> armenia --> driving_licence --> invalid images (img1.jpg , img2.jpg)
                                              --> valid images  (img1.jpg , img2.jpg)
                         --> passport        --> invalid images (img1.jpg , img2.jpg)
                                             --> valid images   (img1.jpg , img2.jpg)```
i get in my output layer (dense layer) ["albania", "armenia"] this way. is this possible to get as ["armenia_driving_licence_valid", "armenia_driving_licence_invalid"] in output layer?
merry fern
df_agg_diffs = df_agg_diffs.loc[df_agg_diffs['Quantity'].fillna(0) != 0]
@lusty coral boom! that was great. why am I getting this?
: RuntimeWarning: The values in the array are unorderable. Pass `sort=False` to suppress this warning. uniq_tuples = lib.fast_unique_multiple([self._values, other._values], sort=sort)
desert oar
you showed me that warning somewhere else too
you might have some weird data in there
mixed data types maybe, unclear
df_agg_diffs = [df_agg_diffs['Quantity'].notnull() & (df_agg_diffs['Quantity'] != 0)]
print(df_agg_diffs)
you need parentheses around the != part
because of python's operator precdence
a & b != c in python is (a & b) != c which is not what you want
mild topaz
when i train a model for the following folder structure```python
demo --> training--> albania --> driving_licence --> invalid images (img1.jpg , img2.jpg)
--> valid images (img1.jpg , img2.jpg)
--> passport --> invalid images (img1.jpg , img2.jpg)
--> valid images (img1.jpg , img2.jpg)testing--> albania --> driving_licence --> invalid images (img1.jpg , img2.jpg) --> valid images (img1.jpg , img2.jpg) --> passport --> invalid images (img1.jpg , img2.jpg) --> valid images (img1.jpg , img2.jpg) training--> armenia --> driving_licence --> invalid images (img1.jpg , img2.jpg) --> valid images (img1.jpg , img2.jpg) --> passport --> invalid images (img1.jpg , img2.jpg) --> valid images (img1.jpg , img2.jpg) testing--> armenia --> driving_licence --> invalid images (img1.jpg , img2.jpg) --> valid images (img1.jpg , img2.jpg) --> passport --> invalid images (img1.jpg , img2.jpg) --> valid images (img1.jpg , img2.jpg)```i get in my output layer (dense layer)
["albania", "armenia"]this way. is this possible to get as["armenia_driving_licence_valid", "armenia_driving_licence_invalid"]in output layer?
can anyone look into this?
 modest rune
This should be an easy question: I need to construct a dataframe from two 2D numpy arrays, each 2D array is 200 x 2000. I want the resulting dataframe to be 400x2000. And I have an array of 400 column names I want to apply to the dataframe as well.
I was thinking there was an easy way to do this pandas dataframe constructor, but I am having no luck so far.
modest rune
yeah, I assume that would be slower... or it is always a safer bet to do it in numpy first.
velvet thorn
pandas should be slower
but not by much
that's my guess
because there's the additional overhead of constructing two DataFrames
as well as what I assume is index alignment checking
on pd.concat
 wild dome
does anybody use Plotly?
solid blaze
I understand some stuff have to be super fast and optimized when they're products and people are querying all the time. But does efficiency and speed really matter that much when you're coding on your own? Hey, if it works.
wild dome
I understand some stuff have to super fast and optimized when they're products and people are querying all the time. But does efficiency and speed really matter that much when you're coding on your own?
@solid blaze I'll say yes, for practice
solid blaze
hmmm...of course.
wild dome
I mean if your code is slow that's up to you, but you can practice by optimizing it
solid blaze
Well, I'm still in that phase where I'm trying to get things to work at all! I'll eventually get to the optimization part. However, for me to get ANY result at all is a win.
wild dome
yeah, first make it work correctly, then you can optimize it
premature optimization is the root of all evil
rustic apex
Getting started learning DS.
I have: inducing&slicing, broadcasting, iterating over array, array manipulation, binary operators, mathematical functions, arithmetic operations, shallow/deep copy
 glacial rune
I have this data in SQL that I want to extract into Python, what data structure would be best for this? I will be using the data in a string for each record e.g.
Product: {}
Previous Price: {}
Current Price: {}
URL: {}
a list of dictionaries for each record? a list of tuples?
wild dome
@glacial rune if you want to access the columns by their name, use dictionaries, if you want to acccess them by index, use tuples
I think that it actually depends on your problem and your needs
glacial rune
which would be more performant?
 ripe forge
A pandas dataframe.
Well, don't worry about performance that much, they'll all be fast enough
desert oar
yeah... dont use lists of tuples or dicts
use a dataframe
it does the job of both, and significantly better for working with tabular data
ripe forge
But this is basically a table. Suited fit for pandas
desert oar
import pandas as pd
# need to install sqlalchemy, but don't need to import it

query = "SELECT a, b FROM foo"
conn_str = "mysql://scott:tiger@localhost/test"
data = pd.read_sql_query(query, conn_str)
@glacial rune
for sqlalchemy connection string syntax, see here https://docs.sqlalchemy.org/en/13/core/connections.html
you will also need a database library that supports your database
 dusk aspen
i need some help, i am trying to create an smb server that i can use on a linux computer. I have found modules for smb clients but nothing that i can use for an smb server
desert oar
@dusk aspen this is a better question for #unix or #tools-and-devops
but maybe look here https://ubuntu.com/tutorials/install-and-configure-samba#1-overview

Ubuntu
Ubuntu is an open source software operating system that runs from the desktop, to the cloud, to all your internet connected things.
dusk aspen
thanks
 austere swift
So i was doing a little bit of research on using XLA in deep learning, and apparently it delivers like 1.15x the performance according to tensorflow, and in tensorflow you're able to use it with gpu but according to pytorch docs you can only use it with TPU in pytorch, why is that?
rustic apex
What’s the difference between using something like GraphQL and data from a page with Numpy/Pandas? I saw some projects like the Titanic and a shop project on Keggel
 odd yoke
@austere swift it's really just because they haven't implemented it yet, and it was the easiest way to support TPUs until then
in fact torch_xla also supports cpus, not that it is useful
odd yoke
xla is a graph -> llvm ir -> machine code compiler, it could theoretically support any target
austere swift
Yeah I did some research on it, but I feel like it wouldve been smarter to implement it on gpu before tpu since that's more common anyways
odd yoke
the purpose of torch_xla was to allow torch to have some support for TPUs, not xla itself
it just happened that xla was the easiest solution to support tpus
 proud iron
Regarding collecting data through web scraping. What would be a smart way to periodically take snapshots of the HTML of a page without flooding the site with requests? :)
velvet thorn
Regarding collecting data through web scraping. What would be a smart way to periodically take snapshots of the HTML of a page without flooding the site with requests? :)
@proud iron sleep in a loop?
 alpine bay
does anyone know what needs to be implemented to use np ufuncs like np.multiply on a subclass of an ndarray?
For methods that have both an array and ndarray version, the docs say to override the function while keeping the signature in order to use the ndarray version but I don't see where it mentions ufuncs.
when I try to multiply the subclassed ndarray by an int an attribute error appears. AttributeError: 'int' object has no attribute 'view'
alpine bay
never mind! I figured it out
velvet thorn
Anyone around ?
@feral spoke just ask.
feral spoke
I'm an economical wine buyer. Which wine is the "best bargain"? Create a variable bargain_wine with the title of the wine with the highest points-to-price ratio in the dataset.
So apparently this dataset have 3 columns points,price and winery. Based on the question above I want to get the winery name.
@velvet thorn
feral spoke
on the ratio function
velvet thorn
well, yes, but that's the next step
then you can just sort by the ratio
and take the first value (assuming you're sorting in descending order)
feral spoke
so something like this df[df['col_1]/df['col_2].sort_values(ascending=False)].head(1)
@velvet thorn ?
velvet thorn
you probably don't want .head(1)
feral spoke
ya
velvet thorn
well, you can do that, I guess
up to you
whether you want the row
or just the name cell
but no, not exactly like that
feral spoke
just the name cell
velvet thorn
df['col_1]/df['col_2].sort_values(ascending=False) this isn't going to work
feral spoke
why?
velvet thorn
you could do this:
df['ratio'] = df['points'] / df['price']
df.sort_values(by='ratio', ascending=False).head(1)['name']
But this would return the max value right?
velvet thorn
try it.
df[df['col_1]/df['col_2].sort_values(ascending=False)].head(1) wouldn't work because df['col_1]/df['col_2].sort_values(ascending=False) gives you a Series of values
but you're trying to use that as an index
feral spoke
Yes but I want the string value corresponding to it
velvet thorn
yes
but that's not relevant
at this point
first you want to get the row with the max value of ratio
THEN you pull the name column out.
because you need the other columns to determine the max.
feral spoke
ok thanks
let me try
@velvet thorn it returns the series but I want to have the string
velvet thorn
you could do this:
df['ratio'] = df['points'] / df['price']
df.sort_values(by='ratio', ascending=False).head(1)['name']
@velvet thorn this
feral spoke
yes
velvet thorn
what error
feral spoke
Incorrect: Expected bargain_wine to have type <class 'str'> but had type <class 'pandas.core.series.Series'>
velvet thorn
show code
feral spoke
reviews['ratio'] = reviews['points'] / reviews['price']
bargain_wine = reviews.sort_values(by='ratio', ascending=False).head(1)['winery']
wait I will show you the question
I'm an economical wine buyer. Which wine is the "best bargain"? Create a variable bargain_wine with the title of the wine with the highest points-to-price ratio in the dataset.
Does the question makes sense?
velvet thorn
yes
feral spoke
can I dm you the screenshot?
austere swift
So what would be the equivalent of using padding='same' (from keras) in pytorch?
feral spoke
@velvet thorn thnx for helping me out,I got the solution 🙂
 grand mason
Hello guys, this chat is for beginners too?
austere swift
yeah this chat is just for general data science
grand mason
Ohh great hehe I'm very noob on this topic hahaha
Have some pattern to ask questions here? Because I want know some stuffs and i will be glad if someone could help me!
mild topaz
hey sorry to ping u @brittle agate , i want to train a CNN model for e.g i have classes and subclasses how i can train for the following folder strucutre?python project -- training -- albania -- driving_licence -- valid images -- invalid images -- passport -- valid images -- invalid images armenia -- driving_licence -- valid images -- invalid images -- passport -- valid images -- invalid images testing -- albania -- driving_licence -- valid images -- invalid images -- passport -- valid images -- invalid images armenia -- driving_licence -- valid images -- invalid images -- passport -- valid images -- invalid images can u please look into this?
velvet thorn
Have some pattern to ask questions here? Because I want know some stuffs and i will be glad if someone could help me!
@grand mason just ask
@velvet thorn thnx for helping me out,I got the solution 🙂
@feral spoke that's good! what was wrong
feral spoke
@feral spoke that's good! what was wrong
@velvet thorn We needed to use the iloc function in beginning and we had to use the idx function
grand mason
So, for a beginner, you guys think it's is better start with Tensorflow or Pytorch?
Have some good roadmap for 'became' a datascientist?
And the big question: Python or R?
feral spoke
Tensorflow/pytorch are used for deep learning
There are many other libraries and things you need to learn before jumping to that
grand mason
I hear about pandas, numpy, scikit-learn, seaborn and sciPy
grand mason
Hmn, the documetations of them are good?
feral spoke
It depends on you
grand mason
Or have some other resources to learn about them?
feral spoke
Are you comfortable with reading the documentations or you like to watch videos and practise?
grand mason
I prefer read
feral spoke
I mean there are many courses available on udemy,coursera,edx
But I guess you need to practise on your own too
grand mason
Have some good book? I know some of O'Reilly
lapis sequoia
udemy also
grand mason
For learn about the libraries, or the math bihend the scene
lapis sequoia
I am just a python beginner
feral spoke
For numpy,pandas,matplot there are videos on YT
or go to kaggle
It is descriptive mostly along with the exercise
grand mason
Like i have this book, Mathematics for machine learnin, but i don't know if is really necessary knows about the math before start practice
feral spoke
Have you taken the class for calculus ever before?
grand mason
Yep
feral spoke
There is Andrew Ng course on ML available on coursera
You should try that
He explains the math needed for understanding and implementing the algorithms
Only drawback is the programming language used is octave/matlab
grand mason
Oh my god, it's easy to learn? I know python well and javascript
mild topaz
@feral spoke sorry to ping u can u look into my issue ?
feral spoke
Oh my god, it's easy to learn? I know python well and javascript
@grand mason Practise makes men perfect
@feral spoke sorry to ping u can u look into my issue ?
@mild topaz sorry man I'm yet to start with the ML
I'm still learning
mild topaz
ok np
grand mason
True, I search now, this website kaggle is really interesting!
Wtf have a lot of challenges haha
feral spoke
Yes there are learning resources as well as challenges
grand mason
Well tks man, I will explore this site!!!
feral spoke
No problem buddy 🙂
grand mason
You like some challenge of him?
Oh never mind hahaha have this about pokemon, I will try this haha
@feral spoke one more question, it's interesting use Linux for do ML?
feral spoke
@feral spoke one more question, it's interesting use Linux for do ML?
@grand mason Tbh I don't have idea regarding which OS you should use for ML but I'm using windows as of now
grand mason
Hmn ok, tks man 😆!
austere swift
So I get this error when I'm trying to train a pytorch model in the line that it calls the loss function: IndexError: Dimension out of range (expected to be in range of [-1, 0], but got 1)
I did some research and found that it had to do with something with the shape of the outputs and the labels being incorrect, but I don't really understand what the expected shape is. The outputs shape is torch.Size([15]) and the label's shape is torch.Size([1, 15]), so I'm guessing that would probably be the issue, but I don't get why they are different shapes anyways since they were both originally size [15]
https://github.com/pytorch/pytorch/issues/5554 I also found this issue on gh for it, and they say that the they are supposed to be different shapes, so I don't see what's wrong

GitHub
criterion = nn.CrossEntropyLoss() print(outputs.data) print(label.data) loss = criterion(outputs, label) # getting error at this point The output that I'm getting is => 0.0174 0.1866...
lapis sequoia
doesn't .mean() return a single number? how am I supposed to plot that?
 fiery cloak
whats excess_returns?
 zenith yarrow
Hello. I am new to python and I'm struggling to draw an histogram with multiple data for school.
Basically I have a list of values and a list of list of frequencies
I want to achieve something like that
arctic wedgeBOT
Hey @earnest forge!
It looks like you tried to attach file type(s) that we do not allow (.ipynb). We currently allow the following file types: .3gp, .3g2, .avi, .bmp, .gif, .h264, .jpg, .jpeg, .mkv, .mov, .mp4, .mpeg, .mpg, .png, .tiff, .wmv, .svg, .psd, .ai, .aep, .xcf, .mp3, .wav, .ogg, .webm, .webp, .flac, .afdesign, .m4a.
Feel free to ask in #community-meta if you think this is a mistake.
brittle agate

Hello. I am new to python and I'm struggling to draw an histogram with multiple data for school.
Basically I have a list of values and a list of list of frequencies
I want to achieve something like that
@zenith yarrow
Go to rooms help-***. And ask this.
 grave frost
Can anyone confirm what an empty assets folder means when checkpointing in TensorFlow? It does say "Assets written to <path to assets folder of chexkpoint folder>" but assets remains empty and there are other things like saved_model.pb and variables folder. I was actually having trouble when loading trained model's checkpoints, so am training it again, but noticed this anomaly...
 pearl crystal
Minmax normalization or mean normalization, which one do you choose to normalize your data?
and is it essential to normalize data?
grave frost
Also, can anyone advise me on how to use tf.data? I want to basically have 2 files - 1 is source file and 1 is target file. I want to find the relationship b/w the source sequence and target sequence (like 1st line of src.text corresponds to 1st line of target.txt). so what should I use? tf.dataset? convert to Tfrecords? tf.data.TextLineDataset?? PLease help!
 gray sedge
having a bad time with Pandas, can anyone help ):
gray sedge
One sec I was trying so much and still no luck i know I'm messing up syntax somewhere
Gotta revert it to that
 uncut shadow
@gray sedge Look at the last line of Ur code
Basically, the error says you cannot do temp_df(...)
And you are trying to do that on the last line
 swift nebula
gray sedge
swift nebula
gray sedge
just gotta get it to take multimple indeces
rustic apex
Using Numpy and Panda. So, is this how you create a “updated” visual of business sales???
I create a Django project, setup my classes and views, have a “order” page that writes into to a .txt , and then I can use Numpy/Pandas to display the info visually of how my sales look?
velvet thorn
Minmax normalization or mean normalization, which one do you choose to normalize your data?
@pearl crystal what is "mean normalisation"?
I think you mean "scaling" - "normalisation" has a specific meaning.
because there are other ways, too.
unless you really mean specific min-max normalisation vs mean normalisation
in which case I would say "it depends on your data".
🥴
gray sedge
Okay dead ass at this point I'm willing to pay someone to do this pandas assignment I'm about to lose it
 serene scaffold
@gray sedge you can get help with general questions pertaining to an assignment, but you can't ask someone to do assignments for you here or request paid work.
gray sedge
Moreso just frustration lol i've never struggled this bad
serene scaffold
I'm sorry to hear that :/
I'm trying to figure out a pandas assignment myself.
though it's not so much a pandas assignment as much as one where we're allowed to use pandas if we want
gray sedge
i think i'd rather learn C in depth than finish this assignment
serene scaffold
probably not
gray sedge
Yea you're likely right
but it's making me regret this semster I've got 24 hours to finish this assignment, I've been 90% fine up until pandas 😐 this is only halfwayish into the assignment
serene scaffold
Well, if anyone happens to know
    for i in range(10):
        for b in (TRUE, FALSE):
            row_is_nan = np.isnan(matrix[:, i])
            row_is_relevant = matrix[:, 10] == b
            matrix[row_is_nan & row_is_relevant] = np.mean(matrix[~row_is_nan & row_is_relevant].flat)
I need to make sure that the last line is only applied towards the ith column, but I'm not sure how to do that and still have row_is_nan & row_is_relevant
TRUE and FALSE are constants that are not True and False
it just makes sense to call them that in this context
if I had a bool matrix where I could make the ith column truthy, I could just throw that in with another &
rustic apex
With a retail type site. Do you ever implement pandas to organize/analyse sales in real-time?
 hard pelican
Can anyone suggest a resource on learning about the different layer types in keras?
I understand the broad theory behind neural networks, but want to know more about what to do on a practical level
I'm specifically interested in regression tasks
serene scaffold
@velvet thorn we were talking about it in #algos-and-data-structs because I'm a hypocrite
(since I'm always telling people in the CS channel where to go)
serene scaffold
the task is to perform conditional mean imputation, if you've heard of that. I haven't.
serene scaffold
I have not, but it's past 1am for me so I may not be able to dedicate full brain power to it
I mean I know what conditional mean imputation is now, I just hadn't before.
velvet thorn
so...am I missing something?
why can't you just do matrix[row_is_nan & row_is_relevant, i] = ...
serene scaffold
why cam?
lapis sequoia
To activate this environment, use
$ conda activate C:\Users\Main User\desktop\sample_project_1\env
However, when I run it I receive this error:
Enter-CondaEnvironment : A positional parameter cannot be found that accepts argument
'User\desktop\sample_project_1\env'.
At C:\Users\Main User\miniconda3\shell\condabin\Conda.psm1:170 char:17
-
Enter-CondaEnvironment @OtherArgs; -
~~~~~- CategoryInfo : InvalidArgument: (:) [Enter-CondaEnvironment], ParameterBindingException
- FullyQualifiedErrorId : PositionalParameterNotFound,Enter-CondaEnvironment
how to solve this error ?
serene scaffold
my professor told me to.
velvet thorn
same thing for the right side
serene scaffold
so np.array.__setattr__ accepts a tuple of the mask followed by a slice?
velvet thorn
does it not...?
serene scaffold
I thought you had to do a mask or a slice
velvet thorn
I'm pretty sure it does
velvet thorn
as in I've never thought about it in explicit terms
but that's how I would do that
>>> import numpy as np
>>> a = np.array([[1, 2], [3, 4]])
>>> a[[True, False], 1]
array([2])
i.e. select the first row and the second column
which is what one would expect
serene scaffold
!e
import numpy as np
a = np.array([[1, 2], [3, 4]])
print(a[[True, False], 1])
@serene scaffold :white_check_mark: Your eval job has completed with return code 0.
[2]
is that what was wanted?
serene scaffold
it might be, but it's easier to ask you than to think about it 🙂
velvet thorn
perhaps 2x2 is not clear enough
>>> a = np.arange(16).reshape((4, 4))
>>> a[[True, False, False, True], :2]
array([[ 0,  1],
       [12, 13]])
in other words, the first and last row, and until the 3rd column, exclusive
same thing as what you want
 minor ember
Someone help me please how should i find the true nature of user input if the input function always make it a string>
serene scaffold
I'll need to focus on this tomorrow but I appreciate your input @velvet thorn
@minor ember I'm not sure that this is a data science question but for any object, the __class__ attribute is the type
velvet thorn
@minor ember I'm not sure that this is a data science question but for any object, the
__class__attribute is the type
@serene scaffold I think what they're really asking is
lapis sequoia
To activate this environment, use
$ conda activate C:\Users\Main User\desktop\sample_project_1\envHowever, when I run it I receive this error:
Enter-CondaEnvironment : A positional parameter cannot be found that accepts argument
'User\desktop\sample_project_1\env'.
At C:\Users\Main User\miniconda3\shell\condabin\Conda.psm1:170 char:17
Enter-CondaEnvironment @OtherArgs;~~~~~
- CategoryInfo : InvalidArgument: (:) [Enter-CondaEnvironment], ParameterBindingException
- FullyQualifiedErrorId : PositionalParameterNotFound,Enter-CondaEnvironment
how to solve this error ?
@lapis sequoia ?
velvet thorn
input() returns a str; how can we determine whether there is any additional data type it can be converted to?
serene scaffold
@lapis sequoia take a look at #❓|how-to-get-help
minor ember
input()returns astr; how can we determine whether there is any additional data type it can be converted to?
@velvet thorn yes exactly my question
lapis sequoia
@lapis sequoia take a look at #❓|how-to-get-help
@serene scaffold okay
velvet thorn
@velvet thorn yes exactly my question
@minor ember okay, so in the simple cases
int and float, you can just try to convert them
do you have to handle list, tuple, and dict?
and set?
minor ember
yes every data type
velvet thorn
well, there's a dirty way that I don't think you're supposed to use
I guess you would need to parse the string
for example, a list always starts with [
serene scaffold
well, there's a dirty way that I don't think you're supposed to use
@velvet thorn gimme that #esoteric-python
velvet thorn
so you can tell if it's a compound data type by the first character
(don't forget None)
@velvet thorn gimme that #esoteric-python
@serene scaffold justast.literal_eval
more "dirty" in the sense of "cheating"
serene scaffold

lapis sequoia
Hi everybody! I've been working on an issue for a couple of days, but I don't know if there is a straightforward solution for it or it has to be a totally custom solution.
I have a pandas dataframe with the following columns: [A, B, C, D, E, F, G, H, I, J]. I want to convert this dataframe to a list of dicts such as the one here https://paste.pythondiscord.com/iqarosenuc.json
(it should be group by [A, B, C, D] then group the resulting lists inside this grouping by [E, F], and finally by [G, H, I] to have a list of Js in the last level)
The dataframe is directly obtained from a query to a postgresql db if that helps to find any alternatives.
I've tried applying a group_by but I am only able to do it for the first grouping. I've tried to make custom functions that iterate over the rows, but I got no luck.
how can I share the structure I'm looking for?
 lyric canopy
If you want to share something text-based that's relatively long, the best way to do that is by using a paste service or a gist. We've got a paste service (https://paste.pythondiscord.com/), but there are plenty of others on the web as well. It helps with keeping the conversation on screen on all devices, as large chunks of code/data takes up a lot of vertical screen.
paper niche
@lapis sequoia Can you provide some sample data for us to play with?
lapis sequoia
Yeah, sorry, what's the preferred format?
paper niche
the pandas dataframe, maybe as a csv in hastebin?
lapis sequoia
okay, give me a sec
I think that the problem is that I don't have the required knowledge to parse this to a nested list of dicts iterating over the rows 
 coral hound
this is my csv data go to https://archive.ics.uci.edu/ml/index.php
 proven moon
yo, is there any way to create such barplots?
for example, i have data that have 4 columns:
name; count1; count2; count3
foo; 2; 3; 1
bar; 6; 4; 1
hue should be the counts columns
name of stacked barplots are the name column
paper niche
@lapis sequoia can you check if this gives the result you're looking for?
(df.groupby(['A', 'B', 'C', 'D', 'E','F', 'G', 'H', 'I']).apply(
    lambda x: pd.Series({'third_grouping': x[['J']].to_dict('records')})).reset_index()
 .groupby(['A', 'B', 'C', 'D', 'E' ,'F']).apply(
     lambda x: pd.Series({'second_grouping': x[['G', 'H', 'I', 'third_grouping']].to_dict('records')})).reset_index()
 .groupby(['A', 'B', 'C', 'D']).apply(
     lambda x: pd.Series({'first_grouping': x[['E', 'F', 'second_grouping']].to_dict('records')})).reset_index()
).to_dict('records')
if it doesn't, can you provide the desired output for the specific example you gave? I tried my best to work out from your earlier json structure but I'm not 100% sure I understood it correctly.
lapis sequoia
I get this error:
Traceback (most recent call last):
  File "private/test_survey_formating.py", line 49, in <module>
    result = (df.groupby(['A', 'B', 'C', 'D', 'E', 'F', 'G', 'H', 'I']).apply(
  File "/venv/lib/python3.6/site-packages/pandas/core/frame.py", line 5810, in groupby
    observed=observed,
  File "/venv/lib/python3.6/site-packages/pandas/core/groupby/groupby.py", line 409, in __init__
    mutated=self.mutated,
  File "/venv/lib/python3.6/site-packages/pandas/core/groupby/grouper.py", line 598, in get_grouper
    raise KeyError(gpr)
KeyError: 'A'
I'm running it like this: https://paste.pythondiscord.com/salupawogo.py
can you share your csv loading code?
oopsie, sorry, i copy pasted this loading snippet
paper niche
import io
df = pd.read_csv(io.StringIO(input_string))
try with this
lapis sequoia
KeyError B
lapis sequoia
yeah it does have them
 A                         B                C                   D              E                    F    G             H                                                  I                                         J
0   42  22jDAqicaEepSd5KcbXIrAK6  tracking_survey  Liquid Registry ☕️  1592478773258  2020-06-18 11:13:49   56      Checkbox        Select the types of liquids you have taken:  Non-alcoholic and non-stimulant drinks:
ah your column names have a space before them
lapis sequoia
yeah, that was it
paper niche
change the first line of your input_string to "A,B,C,D,E,F,G,H,I,J"
lapis sequoia
it seems to be good, but in this example there seems to be always one element in the third grouping, so let me check with the full data
Anyway, this may help me get it, it was sth that I was trying to do (the multi-grouping), but couldn't make it work, now I know the correct syntax, thanks!
paper niche
yeah, it may be abit confusing. I suggest figuring out:
- what
.to_dict('records')does - what
.groupby(...).apply(lambda x: pd.Series(...)).reset_index()gives you
with a small example (say, a df with 4 columns 'A'-'D' with random integers 0-2) filled in.
I'll just add on: the general approach here is to start with the innermost "json", and work your way outwards. Track what happens after the first set of groupby,apply,reset_index, then you should be able to reason what the other 2 sets are doing. Good luck!
lapis sequoia
okay, it seems to be okay, there is a couple of things that I need to tweak, but I think that I can make it work
Thank you very much @paper niche !
paper niche
sure, happy to help!
lapis sequoia
@paper niche ME STATING THAT THE RESULT IS NOT THE ONE I WAS LOOKING FOR WITHOUT REVIEWING THE COMPLETE RESULT
actually, no, I'm dumb, it's working perfectly!
 hearty token
how do i render javascript for beautifulsoup web scraping?
velvet thorn
how do i render javascript for beautifulsoup web scraping?
@hearty token you can't
use Selenium
 patent bough

Explore and run machine learning code with Kaggle Notebooks | Using data from Immigration to Canada IBM Dataset
serene scaffold
    for b in (TRUE, FALSE):  # TRUE and FALSE are classes
        is_class = np.tile((matrix[:, 10] == b).transpose(), (11, 1)).transpose()
        is_nan = np.isnan(matrix)
        for i in range(10):
            matrix[(is_class & is_nan), :, i] = np.nanmean(matrix[is_class, :, i], axis=0)
    matrix[(is_class & is_nan), :, i] = np.nanmean(matrix[is_class, :, i], axis=0)
IndexError: too many indices for array: array is 2-dimensional, but 4 were indexed
>>> matrix.shape
<class 'tuple'>: (8795, 11)
>>> matrix[is_class].shape
<class 'tuple'>: (10296,)
matrix[is_class, :, i] is meant to pull all the values from a column where the row has the correct properties
I guess it doesn't work like that
I think I'll try using just pandas
for this part
 dense copper
hello, is it possible to somehow use a generator to reduce the mem usage of a for loop that doesn't use just simple numbers? I'm working with a large pandas dataframe, and given a list of strings (about 150 of them, each being an indicator), I'm running into the following when I run memory_profiler on the function:
1966 1023.211 MiB  187.102 MiB       td_group = data.sort_values(by=['calendardate']).groupby(['ticker', 'dimension'])
1967 1057.488 MiB   34.277 MiB       mrq_t_group = mrq.sort_values(by=['calendardate']).groupby('ticker')
1968 1092.551 MiB   35.062 MiB       mry_t_group = mry.sort_values(by=['calendardate']).groupby('ticker')
1969 1207.020 MiB  114.469 MiB       mrt_t_group = mrt.sort_values(by=['calendardate']).groupby('ticker')
1970
1971 2256.359 MiB    0.000 MiB       for indicator in indicators:
It looks like that for loop is basically doubling the memory consumption. I'm trying to reduce this as much as possible
merry fern
I need to add a column ('Type') to a dataframe based on the starting string in another column, whats the best way to do that?
rustic apex
Data.gov and datasetsearch.research.google.com
Are those good sites to use for Numpy/Pandas?
 weary ravine
Guys how could i get my computer audio?? (obs: its not the microphone)
like in real time
velvet thorn
I need to add a column ('Type') to a dataframe based on the starting string in another column, whats the best way to do that?
@merry fern show example data
matrix[is_class, :, i]is meant to pull all the values from a column where the row has the correct properties
@serene scaffold isn't your data 2D
I feel like you want to move your nan calculation into the loop
and then just have is_class = matrix[:, 10] == b
 restive scroll
I don't understand why the val_acc stays at 0.5. Anyone encountered this problem before?
I am doing Cats vs. Dogs using augmentation with Keras
velvet thorn
I don't understand why the val_acc stays at 0.5. Anyone encountered this problem before?
@restive scroll model isn't learning, most likely
restive scroll
The learning rate is set to 0.001, could this be the problem?
 hasty grail
np
rustic apex
Which do you prefer using .py or csv? Why not just use a py file? For Numpy and Pandas
velvet thorn
Which do you prefer using .py or csv? Why not just use a py file? For Numpy and Pandas
@rustic apex like...to store data?
rustic apex
@velvet thorn I’m starting to learn Numpy and Pandas, is one file better then the other? It seems quicker to use a .py then a jupyterlab
 brittle agate
mild topaz
brittle agate
mild topaz
Traceback (most recent call last):

  File "E:\paymentz\template.py", line 20, in <module>
    res = cv2.matchTemplate(gray_img, template, cv2.TM_CCOEFF_NORMED)

error: OpenCV(4.2.0) C:\projects\opencv-python\opencv\modules\imgproc\src\templmatch.cpp:1109: error: (-215:Assertion failed) _img.size().height <= _templ.size().height && _img.size().width <= _templ.size().width in function 'cv::matchTemplate'```@brittle agate sorry to ping u , can u look into this issue?
hasty grail
The error basically says that your input image cannot be larger than the input template
mild topaz
okay means template image should be greater than input image ? @hasty grail
hasty grail
yeah
mild topaz
see thispython img.size: 151242 template.size 50286
hasty grail
more specifically the dimensions of your image have to be smaller than that of the template
so if you have a template that's 720x480px, your image has to be no more than 720px in width and no more than 480px in height
lapis sequoia
people, how can I debug the groupby method of pandas dataframe? It's raising a KeyError exception (although the key is there), and only fails with the data that belongs to one user, but not with the data of another one
You know it the groupby applies a dropna? that could drop a column entirely?
 winter portal
can someone please help me with writing concurrently to a database with sqlite3?
pls ping me when u help
velvet thorn
people, how can I debug the groupby method of pandas dataframe? It's raising a KeyError exception (although the key is there), and only fails with the data that belongs to one user, but not with the data of another one
@lapis sequoia provide code and sample data
lapis sequoia
I think I found the issue: the values in one column are NaN, so they are dropped entirely when the groupby is performed
So what I did was put dropna=False in the groupby and also fill the column with values where the NaNs are
.fillna("", inplace=True)
brittle agate
Traceback (most recent call last):

  File "E:\paymentz\template.py", line 20, in <module>
    res = cv2.matchTemplate(gray_img, template, cv2.TM_CCOEFF_NORMED)

error: OpenCV(4.2.0) C:\projects\opencv-python\opencv\modules\imgproc\src\templmatch.cpp:1109: error: (-215:Assertion failed) _img.size().height <= _templ.size().height && _img.size().width <= _templ.size().width in function 'cv::matchTemplate'```
@mild topaz
Well, let's see what is wrong.
You are using template that is huger than original image.
 icy stirrup
 eager heath
Beware of little bobby tables https://xkcd.com/327/
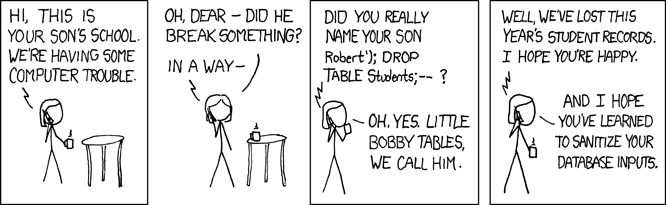
For real though, you shouldn’t use an F-string in an SQL query
mild topaz
loc: (array([], dtype=int64), array([], dtype=int64)) i am getting empty array @brittle agate
 earnest forge
oh
you certainly should use left_on=, right_on= and on=, how=
they might help you in what you want to achieve
hasty grail
@mild topaz np.ndarray.shape
 lime saddle
Hello
I'm looking at the Intel Image Classification dataset on kaggle and I have an error which I don't know why and how to fix
I used ImageDataGenerator for gathering, rescaling and labeling the images
train_datagen = ImageDataGenerator(rescale = 1. /255)
train_generator = train_datagen.flow_from_directory(train_dir,
                                                   target_size=(300,300),
                                                   batch_size=128)
test_datagen = ImageDataGenerator(rescale = 1. /255)
test_generator = test_datagen.flow_from_directory(test_dir,
                                                   target_size=(300,300),
batch_size=128)```I have a small CNN model
model.add(Conv2D(32, (3, 3), activation = 'relu', input_shape = (150, 150, 3)))
model.add(MaxPool2D(2,2))
model.add(Conv2D(32, (3, 3), activation = 'relu'))
model.add(MaxPool2D(2,2))
model.add(Flatten())
model.add(Dense(128, activation='relu'))
model.add(Dense(6, activation='softmax'))
model.compile(optimizer = 'adam', loss = 'sparse_categorical_crossentropy', metrics=['accuracy'])```and then I call the fit method
                   steps_per_epoch=10,
epochs=15)```I get the following error:
     [[node sequential_3/flatten_2/Reshape (defined at <ipython-input-14-3c76c98050a9>:4) ]] [Op:__inference_train_function_994]

Function call stack:
train_function```How can I fix it?
brittle agate
@lime saddle
Try to set up in Conv2D layer padding='valid' or 'same'.
Maybe that's can fix this problem.
lime saddle
Ok, I'll try
I now have another error:
[[node sparse_categorical_crossentropy/SparseSoftmaxCrossEntropyWithLogits/SparseSoftmaxCrossEntropyWithLogits (defined at <ipython-input-18-44f659394c13>:3) ]] [Op:__inference_train_function_1783]```Ok, so I noticed something wrong
Here:
                                                   target_size=(300,300),
                                                   batch_size=128)```

I set the target_size to 300,300 but in the first layer of the convolution I have the input_shape to 150 150I changed the target size to be the same as the input_shape but same error
Okkkkk
So I changed the loss from sparse_categorical_crossentropy to categorical_crossentropy
When I compile my model
Seems to work now
Maybe it could be helpful for someone
lapis sequoia
Hi there! I'm wondering if someone has an idea on how to retrieve a value from a probability distribution function (pdf), I have started to fit my data to a pdf and now I want to use the pdf to retrieve values for some x-values
 terse cargo
I don't really know anything about data science, machine learning, or statistical analysis and I'm hoping this might be the right place to get ideas or links to relevant articles but I have a game server I host and the players are interested in seeing their game time. I've got log files for about two years and I wrote a small program that goes through them and looks for connect/disconnect events and put it into a sqlite db. I've got a timestamp, game account id (only for connecting), connection state boolean (1 connect, 0 disconnect), and the ip.
The way the game works it has a lot of different states connecting/disconnecting is wonky so you might see a connection event then two disconnects or none or vice-versa. Is there anything cool (I like learning new technologies) I can do with this information to plot online activity for the users?
 winged steppe
Hey guys! i just posted a question on stack overflow, maybe some of you know the answer? https://stackoverflow.com/questions/63996926/how-to-delete-empty-duplicates-in-a-dataframe-in-a-smart-way

Stack Overflow
I have a large dataset. It has some data missing. Dataset contains variables of types string (for columns such as name) and float (for columns such as height). Some rows in this dataset are just
 shut robin
Heyho people of datasience does anyone here know his way around pytorch?
lapis sequoia
@shut robin For some projects Tensorflow might be better
I have found the Keras library to make more sense to me
shut robin
Well... the goal is to create a DeepL Ai that predicts a simple line
lapis sequoia
Either should work for that
shut robin
so Tensorflow has a lower entry barrier then?
lapis sequoia
No AI has an easy barrier to entry
the only reason I understand AI at all is because i literally think of everything in terms of Analog synthesizers
shut robin
I am a student rn so I am not unfamiliar but some concepts are still out there for me
lapis sequoia
with each node being an input output into another synth feature
Its very much magic box for most people who use it
shut robin
like a jacobi matrix which I only kinda understand but hey ;D
lapis sequoia
the math behind it is fairly complex
shut robin
I buy that for a penny
lapis sequoia
Watch some videos about what tensors are
and vectors of course. If you can understand that, then things will make more sense
shut robin
lol I am not a highschool student 😄
lapis sequoia
all tensorflow and most deeplearning is just a hyper complicated geometry problem using tensors
shut robin
okay Ill try my best ^^
lapis sequoia
Well I dropped out so I don't know what people learn lol
I learned everything on my own
shut robin
you wouldnt happen to have any recommendations for learning the more complex mathematical models would you?
lapis sequoia
Well it depends on which one specifically
There should be an assortment of videos that walk you through the Keras models
which is what you would be using within TF
shut robin
I mean I get what you mean but seeing these things I just kinda stare at it a lot 😄
lapis sequoia
Yeah learning what tensors are will help
shut robin
fair enough
lapis sequoia
It all starts with learning about vectors
So a vector would be on the x,y only for instance
then you learn about vectors in x,y,z
lapis sequoia
and a tensor is basically a vector, but its the set of all vectors for that object, so that no matter how you move the axis everything is the same
shut robin
huh okay yeah I gotta read into that
lapis sequoia
Basically imagine a cube, its every vector for the cube
shut robin
okay
grave frost
Does anyone know a way to represent a UNIQUE string (not a category) in numerical format to be used in a Pandas?Dataframe
lapis sequoia

Dan Fleisch briefly explains some vector and tensor concepts from A Student's Guide to Vectors and Tensors
this is the video that got me started down the rabbit hole
Then you can watch more complicated ones. once you have a good grasp of Tensors, you can start to learn about all the Keras modules, and what the different type of structures are like, RNN, CNN, Etc
You will use different structures for different things. Like if you are looking at a time series (Which is my interest in TF) you will need to learn about LSTM's and RNN's
@grave frost Can you provide more context in what you are trying to do?
serene scaffold
I'm trying to understand how I can use pandas for conditional mean imputation. I know I can use DataFrame.groupby, but I'm not sure how to replace the nans in each column with the nanmeans for those columns.
lapis sequoia
@serene scaffold can you make a new df, in which you drop everything with a nan?
serene scaffold
the mean method in certain pandas objects automatically ignores nans
lapis sequoia
You could do a try statement inside of a forloop, with the except having a nan
grave frost
@lapis sequoia I have an arbitrary string that I want to somehow convert it into a form that I can make an ML model for. Since data has to be numerical, I have no idea on how will I encode a string into something else...
serene scaffold
my goal is to use pandas built-in functionality so that I don't have to write for loops in Python
also I thought I was on another server? oops.
lapis sequoia
@grave frost What ML Library are you using?
grave frost
@lapis sequoia TensorFlow and Keras
lapis sequoia
did tf.string.to_number not work?
shut robin
@lapis sequoia haha same I was watching it rn 😄
grave frost
@lapis sequoia You misunderstand. The string contains both number and alphabets (e.g:- test123)
Though I think I have an idea to convert it into int, but it would require a custom encoder...
lapis sequoia
Whats the data?
grave frost
Alphanumeric
lapis sequoia
I think your solution will have to be dependent on the data. Right but dates can be alphanumeric like 23 January 2020
But solving that is easy
where if its performance data for a serialized component, its more challenging
hard pelican
So I've got a sort of baseline understanding of the function of RNNs and different layer types, but I'm not clear on how exactly I can best combine them and for what tasks - does anyone have reading they'd suggest on the subject?
grave frost
@lapis sequoia So how do we encode such alphanumeric data?
lapis sequoia
Im thinking
@hard pelican Look up LSTM/RNN Stocks
Medium has several articles and it can give you a really good context for how they work and how to modify them
@grave frost have you tried to_numeric yet? And if so whats the output look like?
or does it even let you do it?
grave frost
@lapis sequoia Nope InvalidArgumentError: StringToNumberOp could not correctly convert string: hu342 [Op:StringToNumber]
I think I will make a custom encoder then...
hard pelican
oh wow the first article i found with that term seems to have clarified something that was screwing me up
I was sending data in a weird format to my LSTMs
so obviously they did nothing
grave frost
@lapis sequoia But the most biggest problem is the delimiter
I could keep 1 digit aside as the seperator but I don't want myself 1 digit short...
lapis sequoia
Is your problem type a classification one?
@hard pelican I have done that many times in nearly every library I have ever used
 lapis sequoia
Thats me with dash right now lol
Bokeh and Dash are so cool if you know what your doing, but id you dont its 100% Ragefuel
 pine cloak
if i have multiple columns with a single letter in one dataframe, and another dataframe has a weight for each letter, how do I multiply the weights?
lapis sequoia
What do you mean multiply the weights?
@grave frost https://www.tensorflow.org/tutorials/structured_data/feature_columns
This works with a lot of strings that are alphabet. May have the snippet of code you are looking for

 grave frost
@lapis sequoia It's not a classification problem, but sequence2sequence 🙂
lapis sequoia
pine cloak
lets say one row of the first df is ['a,'b,'c'] , another df has the value associated with each letter [a=1,b=2,c=3] how do I get it to multiple 123?
lapis sequoia
I looked it up on the Keras website. This is only alphabet again
shut robin
k so a tensor is basically just three vectors expressed in one matrix
lapis sequoia
@pine cloak Is there any particular reason the df's are seperate?
@shut robin It can be more than three vectors, but yeah basically
pine cloak
that's the way it was provided
shut robin
yeah I meant a tensor to the third power
lapis sequoia
Yeah
@pine cloak So Df1 = A,B,C within the rows of column one or in the index column?
& DF2 = the weights? or wht weights with labels?
pine cloak
char0 charq char2
0 a b c
1 d b a
2 c f. c
that's df1
df2 is
char prob
a 0.123
b 0.375
c 0.009
is df2
lapis sequoia
ok ill enter that five me a minute
pine cloak
would it be something like df1['product'] = np.prod([df2[prob] for char in df1])?
pine cloak
basically
 solar phoenix
hi all- i am struggling with something on pandas, perhaps you can help. I have a column of my dataframe which is 1,2 or 3. If it is "1" i want to apply function 1, if it is 2 i want to apply function 2, and if it is 3, i want to apply function 3. But one of the inputs for the function is also based on the same row of the dataframe
if that makes any sense
lapis sequoia
@pine cloak does df2 have two columns? one for letter and one for the probabilitie
pine cloak
the char is the index
lapis sequoia
Ok gotcha
solar phoenix
an example of mine:
df:
"a" "b"
1 5 1
2 5 1
3 5 2
4 5 3
def func1(input):
output = input*10
return(output)
def func2(input):
output = input+10
return(output)
def func3(input):
output = input+1
return(output)
desired output:
df:
"a" "b" "c"
1 5 1 50
2 5 1 50
3 5 2 15
4 5 3 6
pine cloak
ok thanks
lapis sequoia
import numpy as np
import pandas as pd

data1 = {'Char1':  ['A', 'D',"C"],"Char2":["B","D","F"],"Char3":["C","A","C"]}
data2 = {"Index":["A","B","C","D","F"],'Probabilities':  ['.2', '.4',".5",".3",".7"]}

df = pd.DataFrame (data1, columns = ['Char1',"Char2","Char3"])
df2 = pd.DataFrame (data2, columns = ["Index", 'Probabilities'])
df2 = df2.set_index("Index")

for n in df.index:
    Char1Probability = float(df2.loc[df["Char1"][n]]["Probabilities"])
    Char2Probability = float(df2.loc[df["Char2"][n]]["Probabilities"])
    Char3Probability = float(df2.loc[df["Char3"][n]]["Probabilities"])
    RowNProbability = Char1*Char2*Char2
    print("Row Number: "+str(n))
    print(RowNProbability)
    print("----------------")
A forloop makes it pretty simple
you just have to use .loc to use the value in one df to select the value in the other
and by using the for loop you don't have to manually select each location each time
pine cloak
my df1 is larer than what I posted (about 1000 rows), should still work right?
lapis sequoia
yes
and if its super slow you can do it by slices
so you would add make the for loop say
for n in df.index[0:10]:
gotcha, thanks so much
lapis sequoia
and you can make a new empty DF and use .append to add all the output values to that df so you dont have to read them all from the print statements
pine cloak
gotcha
lapis sequoia
Good Luck!
 jaunty scroll
hello would a question about an XML parser be appropriate here?
I am trying to parse an XML document that has six sets of parent-child relationships. I can get the parser to run through the document but it doesn't respect the structure of it and just returns the values as if they were all at the same level. This in turn causes problems with the schema validation. Been working on this for a while and not sure where to turn
 safe sparrow
Im looking for a way to multiply all nodes in a tensorflow layer
so essentially concatenate layers, but multiplying them
But only multiple the nodes if the nodes are non zero
merry fern
@merry fern show example data
@velvet thorn
I need to add a column ('Type') to a dataframe based on the starting string in another column, whats the best way to do that?
I want to insert a column ('Type') and fill values ('A' 'B' or 'C') depending on the values in 2 other columns
A = if value for column 'Name' does not start with 'RP' 'RV' or 'Buy' or 'Sell' AND 'Price' isnot '0.00'
B = if value for column 'Name' does start with 'RP' or 'RV' AND 'Price' is 0.00
C = if value for column 'Name' does start with "Buy" or "Sell"
 modern hatch
write a function that takes in a row of the dataframe and applies that logic
    # do your conditional checks
return label```then you can just df["Type"] = df.apply(lambda row: mapper(row), axis=1)
merry fern
i will try thx
modern hatch
no problem, good luck
jaunty scroll
If I want to access an element in an XML whose attributes are child elements, what is the best/most efficient way to do so? Having a hard time getting parser to recognize document structure. I have tried to create a new element object and set it equal to the desired element, but it only picks up on elements that have no children.
merry fern
I have no idea what I'm doing @wide heath 🙂
no problem, good luck
@modern hatch
I have no idea what I'm doing 🙂
merry fern
@lapis sequoia do you have matplotlib installed?
lapis sequoia
Yessir
I'm just confused why it doesn't work on the ide
It work on cmd
but when it runs on ide it just gives me that error
merry fern
environment, so maybe the IDE is in another environment or a virtual environment
lapis sequoia
what does that mean
like do I have to configure matplotlib to the ide
and I'm just using the basic python ide I don't want to use atom or pycharm till I need to
merry fern
run help("modules") from the IDE and see if matplotlib shows up
lapis sequoia
what would modules be
If I type it in brackets
oh
my bad
I'm dumb
👍
I see what you mean
matplot
it gave me this module
@merry fern
merry fern
👍
lapis sequoia
But how do I get matplotlib
to work
Do I have to update matplot
because its an older module or
@merry fern can I dm quikc
quick*
merry fern
IDK @lapis sequoia , i would pip install matplotlib
lapis sequoia
Alright
merry fern
<-- a newbie as well
no problem, good luck
@modern hatch tried this a few diff ways, I think I'm off the mark...
def admin_mapper(row):
    label = ''
    for column in df_admin[['Price', 'Name']]:
        if column['Name'].str.startswith('RP', na=False) or column['Name'].str.startswith('RV', na=False) and column['Price']==0:
            label = 'Repurchase Agreement'
        elif column['Name'].str.startswith('BUY', na=False) or column['Name'].str.startswith('SELL', na=False):
            label = 'CDS'
        elif column['Price'] != "0":
            label = 'Bond'
    return label
Using keras, how should I format my X array for an LSTM?
I'm doing regression on some market data, so I've got 5 features and want to predict one
I have a context value, which is at 50 for now, so it gets those 5 features 50 timesteps from the point it's supposed to predict
how would I put that in?
[[[features], [features], [features], [features]], [[features], [features], [features], [features]]]?
hard pelican
Okay, I think I'm doing this wrong again.
I'm putting my data in like that
and it's giving me these ludicrously low loss
which I think means it's wrong
(low as in scientific notation low)
this is a pretty simple system, I think
model = Sequential()
model.add(LSTM(32, input_dim=5, input_length=CONTEXT))
model.add(Dense(1))
model.compile(loss='mean_squared_error', optimizer='adam')```5 features, CONTEXT is 50 and how many sets of each features is in a datapoint
on the first epoch it gives me this:
901/901 - 3s - loss: 5.4002e-04
my data is scaled with a minmaxscaler, could that be screwing it up?
i really don't know what's causing this
well unscaling it results in a loss of 140k
so
not that, either
The ridiculously low loss is inversely proportional to how much data there is
why
velvet thorn
@velvet thorn
I want to insert a column ('Type') and fill values ('A' 'B' or 'C') depending on the values in 2 other columns
A = if value for column 'Name' does not start with 'RP' 'RV' or 'Buy' or 'Sell' AND 'Price' isnot '0.00'
B = if value for column 'Name' does start with 'RP' or 'RV' AND 'Price' is 0.00
C = if value for column 'Name' does start with "Buy" or "Sell"
@merry fern
what about the other cases?
serene scaffold
Still trying to figure out numpy; can I use np.where to get all the rows where the nth element is not nan?
velvet thorn
Still trying to figure out numpy; can I use
np.whereto get all the rows where the nth element is not nan?
@serene scaffold you should be using isnan
serene scaffold
well, I can use isnan to get a boolean array/matrix
but then I need the rows where a specific element isn't nan.
velvet thorn
hm.
okay, let me illustrate.
>>> a = np.array([1, 2, np.nan, np.nan, 5, np.nan, 7])
>>> a
array([ 1.,  2., nan, nan,  5., nan,  7.])
>>> a[~np.isnan(a)]
array([1., 2., 5., 7.])
@serene scaffold do you see what I mean?
now then, say that was a 2D array...
>>> b = np.array([[1, 2], [np.nan, 4], [5, np.nan]])
>>> b
array([[ 1.,  2.],
       [nan,  4.],
       [ 5., nan]])
>>> b[~np.isnan(b[:, 0])]
array([[ 1.,  2.],
       [ 5., nan]])
in other words, "get me b where the first column is not nan"
velvet thorn
one step further; I think this might be helpful, based on what you said the other time:
>>> b[~np.isnan(b[:, 0]), 0]
array([1., 5.])
"get me the second column of b where the first column is not nan"
you're welcome
serene scaffold
so within the subscript brackets, you get a mask expression followed by an index
and you can do really bizarre indexing with both colons and commas.
serene scaffold
bonus?
velvet thorn
>>> a = np.zeros(shape=(12, 24, 36, 48))
>>> a[..., 1].shape
(12, 24, 36)
the ellipsis means "all axes until..."
so in this case it replaces a[:, :, :, 1]
not sure if you'll need it for the problem you're solving (I doubt it) but just so you know it exists
kinda like a, *b, c = [1, 2, 3, 4]
serene scaffold
def manhattan_distance(x: np.array, y: np.array) -> np.float:
    not_null = ~np.isnan(x) & ~np.isnan(y)
    x, y = x[not_null], y[not_null]
    return np.mean(np.absolute(x - y))


def hot_deck_imputation(df: pd.DataFrame):
    matrix: np.array = _to_numpy(df.drop(BIN_LABEL, axis=1))
    matrix_is_nan = np.isnan(matrix)
    for i in range(len(matrix)):
        is_nan = matrix_is_nan[i]

        if not np.any(is_nan):
            continue

        for j in np.where(is_nan):
            options = matrix[~np.isnan(matrix[:, j])]
            matrix[i, j] = None  # this is a placeholder
the goal is to replace matrix[i, j] with whichever array in options returns the lowest value from manhattan_distance given mahattan_distance(matrix[i], x) for an x in options
my understanding is that you're supposed to avoid writing Python loops though
velvet thorn
sometimes you do need loops
serene scaffold
but maybe I'm overrating the importance of avoiding loops.
velvet thorn
it depends.
in particular, you cannot avoid a loop where one calculation depends on another
which doesn't seem like the case to me
let me try to parse your code
it's a bit early
okay, so first, you skip all rows where every value is not null, because you don't need to perform imputation
fair enough
serene scaffold
I skip all the rows where there are no nans. At least that's the point.
velvet thorn
not null
missed an operative word there
wups
yup, got that part
I don't get the inner loop
serene scaffold
Disclosure, this is for school, but we're not being graded on numpy or pandas knowledge. I just want to learn how to use them and am using this as an excuse.
velvet thorn
where is the manhattan_distance call?
serene scaffold
haven't implemented that.
velvet thorn
oh, okay.
serene scaffold
if two rows have a nan in the same column, we can't use them to calculate the manhattan distance to replace either nan
so the for j loop is to get all the indices of a row that have a nan
velvet thorn
np.where returns values though, right
serene scaffold
because then I need to calculate the manhattan distance for every other row that doesn't have a nan in that slot
merry fern
@velvet thorn this is what I have so far, both methods dont work...
velvet thorn
oh, wait, you're passing isnan to it
that's fine
the slightly more canonical way to do that is .nonzero(), but that's a minor point
serene scaffold
so in pure Python, I could do min(manhattan_distance(matrix[i], x) for x in options)
velvet thorn
options is an array
serene scaffold
so is matrix[i]
velvet thorn
which means
you can pass both to manhattan_distance directly
assuming they are the same size
velvet thorn
and they would have to be, right, along one axis
serene scaffold
and options are supposed to be all the rows that pass that condition