#data-science-and-ml
1 messages · Page 251 of 1
 lapis sequoia
 tame pelican
@desert oar says Error: no such option: -1
 desert oar
1 iteration has too much variation
lapis sequoia
in matlab i wrote this
tic
for j=1:10000
for i=1:j
x=1;
end
end
toc
desert oar
but yeah iteration in python can be very slow
lapis sequoia
i think if i can find a way to remove loops python will be faster
desert oar
@tame pelican no, your situation has nothing to do with iteration
@lapis sequoia yes, numpy tries to give you a lot of opportunities to do that
but sometimes you can't avoid it
Numba can help a lot
it is an optimizing JIT compiler for python functions that use numba
so you can try compiling your nested looping code with numba to see if that makes it faster
lapis sequoia
ok
desert oar
@tame pelican what did you actually type in the command line?
and did you add another parameter for the --num option? you need one
 slender nymph
hi how can i do a simulation. i need to simulate .
Simulate a portfolio of home insurance policies (5,000 homes insured).
The value of damages is distributed according to a Uniform law between $ 250,000 and $ 2.25 million.
An “accident” can occur with probability p. If this is the case, there is a probability q that the damage is the maximum possible (total loss). With probability 1-q, the loss is partial according to a Uniform distribution on (0,1).
how can i start that? my problem is how to start it
tame pelican
python myscript.py abs ---num -10 @desert oar and yes
desert oar
@slender nymph is this for school, or an interview? it sounds like you are expected to know how to do this
slender nymph
it is for school. not, he thinks we are a data scientist with 10 years of experience
im not eaither
either
desert oar
actually, they are telling you how to do it:
The value of damages is distributed according to a Uniform law between $ 250,000 and $ 2.25 million.
An “accident” can occur with probability p. If this is the case, there is a probability q that the damage is the maximum possible (total loss). With probability 1-q, the loss is partial according to a Uniform distribution on (0,1).
it's not a very clear question
but it looks like they want you to simulate losses & damage amounts for each home
but you should clarify w/ your instructor instead of relying on random strangers
slender nymph
it is insurance simulation .. it is about loss
i dont know how to simulate 5k insurance policies
i never did a simulation , so thats my question
 junior quest
so i was trying to do both conda and pip install datapane
and i'm having trouble w that cuz it's not installing
on pip it says that it can't directly install pyarrow (pep 517)?? so
idk
tame pelican
#Absolute
@cli.command()
@click.argument('N1', type=int)
@click.option('--num', is_flag=True, help='INTEGER')
def abs(n1, num=False):
"""Calculates absolute value."""
answer = int(abs(n1))
click.echo('abolsute value = {}'.format(answer))```
@desert oar this is what i have now.. still not working lyric rampart
Can anyone help with building Caffe despite getting libprotobuf errors?
lyric rampart
description of the error is in https://www.reddit.com/r/learnpython/comments/io2j8c/unsatisfiableerror_for_conda_uninstall_libprotobuf/
reddit
1 vote and 0 comments so far on Reddit
 brittle agate
so true lol
Worst is when it keeps jumping up and down like it does with gans
@flat quest
Momentum can help with that shit, batch normalization, but yeah, u know this already I think...
This crazy graph was because I set up epsilon=0.002.
Default is 0.001.
When I used BN and DropOut my graph looked like fucking ladder XD
 tidal bough
you can & numpy boolean arrays - it works elementwise on them.
 gray sedge
I really wish I didn't erase the middle of what I had written
tidal bough
such as, for example, the boolean arrays you get when you do X<5 and such 🙂
 winged verge
Hello brothers i am Ozan
gray sedge
Hi
winged verge
i have already joined new
I am studying master in data science at Germany
and i joined dataquest , datacamp and udacity data science courses
gray sedge
And confusedreptile
If you were to write this, how would you write that line
I don't know what I'm doing wrong
Damn Bileda you're goin hard
winged verge
i just wonder a thing about what should i do after finished those programs
what is the next which part i should move into NLP or something
what is your suggestions brothers
gray sedge
Ohhh
that much I could not help you with, I'm struggling with probably basic numpy
That may actually be a decent advanced-discussion channel question
winged verge
oh okey thank you brother
gray sedge
if they're not happy with that my bad
winged verge
no problem i will search right path as much as i can
gray sedge
good luck fam
winged verge
thanks
 velvet thorn
That may actually be a decent advanced-discussion channel question
@gray sedge not really
advanced discussion is for stuff like the future of the languge
not like "I've done some mid-level projects, what now?"
@winged verge what are your interests?
how good are you with ML
gray sedge
just felt like advanced would be a good place to ask advanced people "what would you do next if you were in this position", but I do see what you're saying
velvet thorn
just felt like advanced would be a good place to ask advanced people "what would you do next if you were in this position", but I do see what you're saying
@gray sedge that would probably be #career-advice
i have made ml projects in the company based on price predictions
@winged verge what do you want to do?
like
get side project ideas?
looking for a job?
want to build your own product (as a startup)?
learn about more specialised forms of ML?
winged verge
looking for a job
velvet thorn
okay
gray sedge
ah see that much I didn't realize
velvet thorn
so like you want to know how to increase your chances?
ah see that much I didn't realize
@gray sedge yup the name is a bit confusing
velvet thorn
but in a nutshell #internals-and-peps is actually for discussing improvements to the language, its direction, etc.
NLP or Computer Vision specialist
@winged verge this is really up to you
follow your interests
also the job market varies from country to country
both of those are hot sub-areas of ML though
winged verge
i am also in data science master at IUBH germany university
velvet thorn
but from what I've seen
winged verge
i wanna get a job in Germany
velvet thorn
CV positions are generally a bit more demanding in terms of academic qualifications
velvet thorn
i wanna get a job in Germany
@winged verge yeah, so what you need to do to maximise your chances there will depend on the situation in Germany
which anyone not living there would find it more difficult to advise you on.
winged verge
so i need to make market research first i guess
gray sedge
I am now following what his original message was asking lmao that is 100% my bad
winged verge
@velvet thorn thanks for your advices
 slate hollow
mnist_time.fit(X_train, y_train, validation_data=[X_valid, y_valid], callbacks=[early_stopping])```so apparently this doesn't work, as it throws this:
```py
 Layer sequential expects 1 inputs, but it received 2 input tensors. Inputs received: [<tf.Tensor 'IteratorGetNext:0' shape=(None, 28, 28) dtype=float32>, <tf.Tensor 'ExpandDims:0' shape=(None, 1) dtype=uint8>]```however when i change the validation data to `(X_valid, y_valid)` instead of `[X_valid, y_valid]`, tf doesn't complain-
why?
mnist_time.fit(X_train, y_train, validation_data=[X_valid, y_valid], callbacks=[early_stopping])```so apparently this doesn't work, as it throws this:
```py
 Layer sequential expects 1 inputs, but it received 2 input tensors. Inputs received: [<tf.Tensor 'IteratorGetNext:0' shape=(None, 28, 28) dtype=float32>, <tf.Tensor 'ExpandDims:0' shape=(None, 1) dtype=uint8>]```however when i change the validation data to `(X_valid, y_valid)` instead of `[X_valid, y_valid]`, tf doesn't complain-
why?
@slate hollow conceptually, lists and tuples represent different things.
velvet thorn
no
slate hollow
then what it do
velvet thorn
okay
this is actually a pattern that is common in other DS/ML libraries
such as numpy and pandas
slate hollow
where tho
but like why does keras want a tuple and not a list
what does a list prevent it from doing that a tuple doesn't is what i'm asking
velvet thorn
>>> import numpy as np
>>> a = np.array([[1, 2], [3, 4]])
>>> a[[0, 1]]
array([[1, 2],
       [3, 4]])
>>> a[(0, 1)]
2
yes, I'm coming to that
a list is seen as a collection of values, all of which have the same meaning
whereas a tuple is seen as a grouping of values, which are given meaning by their position
e.g. you can have a 2-tuple representing X and y
slate hollow
ok?
velvet thorn
where the first element means "X" and the second element means "y"
so one X tensor and one y tensor
slate hollow
what about a list?
velvet thorn
but there are some networks which take more than one input
so, say you need 3 inputs
you would put that in a list
representing "the inputs"
slate hollow
inside of that tuple right?
velvet thorn
in this case, I believe it would be outside, actually
hm, but I'm not sure about this one
been a while since I did that
slate hollow
the book i'm learning from puts it like this
validation_data=([X_valid_A, X_valid_B], [y_valid_A, y_valid_B])```trust the book then
I don't really remember
been like half a year since I last touched ML
velvet thorn
yes
there are
practically speaking, lists and tuples are the same, except that one is mutable
however, conceptually speaking, there is a need to distinguish the two
another example...say you want to represent a point in 2D space
you could do that with a tuple like (2, 5)
which is not the same as (5, 2)
because position matters
but if you had a number of points, you could put them in a list, like [(2, 5), (5, 2), (1, 3)]
slate hollow
couldn't [2, 5] represent the same thing?
slate hollow
ok then
velvet thorn
you could do ([2, 5], [5, 2], [1, 3]) if you wanted
tidal bough
tuples are a bit faster, since they are immutable
velvet thorn
faster to what?
another way you can look at this: does it make sense to add elements to the collection?
tidal bough
also it just make more sense to use an immutable collection to represent something with a fixed length.
velvet thorn
in the case of the point, each tuple represents a point in 2D space; you don't need 3 numbers for that.
but if you want more points, it does make sense to extend the list.
slate hollow
i mean ok
velvet thorn
but because Python is dynamically typed
slate hollow
just wondering why they couldn't accept both lists and tuples
velvet thorn
the distinction between list and tuple is not very clear
as it is in other languages
just wondering why they couldn't accept both lists and tuples
@slate hollow to distinguish between "this is a group of tensors for ONE input" and "this is multiple tensors, each of which is one input"
velvet thorn
yw
 eternal cloud
Hello everyone.
So we have this project where we want to train our model with pictures of different objects (Cars, etc) using google street view.
Now the question is, is there a way that street names won't be there lying along the roads and streets?Want the pics to be clean with no written stuff. I would be really thankful if someone can help me with this.
velvet thorn
Hello everyone.
So we have this project where we want to train our model with pictures of different objects (Cars, etc) using google street view.
Now the question is, is there a way that street names won't be there lying along the roads and streets?Want the pics to be clean with no written stuff. I would be really thankful if someone can help me with this.
@eternal cloud so basically
you want to remove all words on signs and stuff?
eternal cloud
yea man. lemme send u an example
velvet thorn
no need
 hasty grail
By "remove", would blurring/masking the words be good enough, or do you need the signs to look like legit blank signs?
eternal cloud
Well I would say completely removing them ... Because I guess it is possible since I read some stuff in this link but don't know anything about these api stuff.
https://developers.google.com/android/reference/com/google/android/gms/maps/StreetViewPanoramaOptions#panningGesturesEnabled(boolean)

Google Developers
I assume this must be it right? but again, idk how to implement this since I'm not good at programming at all.
hasty grail
iirc google maps only blurs the text
 flat quest
@brittle agate yeah both of those help. You could also use a custom learning scheduler, which might help in certain scenarios. Depends on the problem tho
and yeah just use default 99% of the time.
slender nymph
the people in general python send me here
maybe you can help me
dot_product_of_matrix = np.dot(part_loss_uni,houses_5_000)
multiplication_scalar = part_loss_uni*houses_5_000

prob_q = 0.0
for i in len(float(prob_p)):
    prob_q[i] =  ((65_000_000/prob_p[i]) - sum(multiplication_scalar))/(total_val - sum(multiplication_scalar))


---------------------------------------------------------------------------
TypeError                                 Traceback (most recent call last)
<ipython-input-23-47512b314ac6> in <module>
      1 prob_q = 0.0
----> 2 for i in len(float(prob_p)):
      3     prob_q[i] =  ((65_000_000/prob_p[i]) - sum(multiplication_scalar))/(total_val - sum(multiplication_scalar))

TypeError: only size-1 arrays can be converted to Python scalars```what to do?
hasty grail
where have you defined prob_p?
slender nymph
i will show you all the code<
Avg_law_uni = (250_000 + 2_025_000)/2

#simulation  5k houses
houses_5_000 = np.random.uniform(250_000,2_025_000,5_000)

#total value houses
total_val = sum(houses_5_000)

#mean value houses
avg_Houses = np.mean(houses_5_000)

# distribution plot
sns.distplot(houses_5_000, bins = 20)

#fraction partial loss
part_loss_uni = np.random.uniform(0.0,1.0,size=5_000)

# possibles probabilities p to find q
prob_p = np.arange(0,1,0.0001)

#loop for the probability q as a function of the probability p and the loss```dot_product_of_matrix = np.dot(part_loss_uni,houses_5_000)
multiplication_scalar = part_loss_uni*houses_5_000
prob_q = 0.0
for i in len(float(prob_p)):
prob_q[i] = ((65_000_000/prob_p[i]) - sum(multiplication_scalar))/(total_val - sum(multiplication_scalar))```< lusty coral
what len(float(prob_p)) gives?
slender nymph
the size of the prob_p
lusty coral
why use len and float?
slender nymph
thats gives nothing
lusty coral
then why use it for FOR?
slender nymph
because i want find prob_q
lusty coral
you assigned pron_q = 0.0
so it's a float now
you cant access prob_q[i] because it's not a list?
lusty coral
oh ok
slender nymph
so it is why i used fload
lusty coral
you used it inside for as well
the float one
it should be prob_p then
prob_p[i] ...
 arctic wedgeBOT
You are not allowed to use that command here. Please use the #bot-commands channel instead.
hasty grail
You're trying to convert an ndarray with multiple elements into a Python scalar float, which obviously doesn't work
it's like trying to convert a list of ints into a single integer
slender nymph
when i dont use float
TypeError: 'int' object is not iterable
i have this error
for prob_p
hasty grail
len returns an integer
you should be using range(len(...))
but given that NumPy supports slice-based assignment/broadcasting
you don't need to use a for loop at all
prob_q = ((65_000_000/prob_p) - sum(multiplication_scalar))/(total_val - sum(multiplication_scalar))
i have this error
nly size-1 arrays can be converted to Python scalars
TypeError: only size-1 arrays can be converted to Python scalars
lusty coral
can you do 65_000_000/prob_p
just that
then do this
sum(multiplication_scalar)
which one is giving the exception?
slender nymph
it is okay @hasty grail resolved the probel. thank you
i can continue to work thanks
!close
lusty coral
you can't close this channel 😄
 wheat knoll
Soldierssssssssssssssssss
I require your assistance
I am unable to install pytorch and I have no clue why
At your earliest convience please help me 🙂
wheat knoll
I'm trying to install the package via pip and its just flooding me with errors
It worked for others like pyautogui etc
I went on the website and ran the command after selecting my OS and other info etc etc
pip install torch==1.6.0+cpu torchvision==0.7.0+cpu -f https://download.pytorch.org/whl/torch_stable.html
And this is the error I run into:
(c) 2019 Microsoft Corporation. All rights reserved.

C:\Users\Phillip>pip install torch==1.6.0+cpu torchvision==0.7.0+cpu -f https://download.pytorch.org/whl/torch_stable.html
Looking in links: https://download.pytorch.org/whl/torch_stable.html
ERROR: Could not find a version that satisfies the requirement torch==1.6.0+cpu (from versions: 0.1.2, 0.1.2.post1, 0.1.2.post2)
ERROR: No matching distribution found for torch==1.6.0+cpu

C:\Users\Phillip>```I went on a lot of codestack replies from people having the same issue but none of what they posted worked
hasty grail
try installing torch by itself first
wheat knoll
Pastebin
Pastebin.com is the number one paste tool since 2002. Pastebin is a website where you can store text online for a set period of time.
hasty grail
the error message indicates that you're trying to install torch 0.1.2
hasty grail
specify the version
wheat knoll
How exactly? @hasty grail
hasty grail
pip install torch==1.6.0+cpu
wheat knoll
ERROR: No matching distribution found for torch==1.6.0+cpu```hmm try triple equal signs
wheat knoll
Same error
hasty grail
with the -f option?
wheat knoll
Usage:
  pip install [options] <requirement specifier> [package-index-options] ...
  pip install [options] -r <requirements file> [package-index-options] ...
  pip install [options] [-e] <vcs project url> ...
  pip install [options] [-e] <local project path> ...
  pip install [options] <archive url/path> ...

-f option requires 1 argument```Not sure which one to use
Same error with 2 equal signs
hasty grail
pip install torch==1.6.0+cpu -f https://download.pytorch.org/whl/torch_stable.html
what is your Python version, btw?
wheat knoll
That's what I was using earlier from the website and it was giving me the same error
I am on Python 3.8.5
32bit
hasty grail
they are all sorted by version so it shouldn't take too long to find the one you need
wheat knoll
Got no clue what I'm doing wtih these versions from that page
I'd like to solve the problem I've having installing packages normally, will save me some grief in the future
Don't know what else to do though 😦
brittle agate
@brittle agate yeah both of those help. You could also use a custom learning scheduler, which might help in certain scenarios. Depends on the problem tho
and yeah just use default 99% of the time.
@flat quest
oki doki
hasty grail
I'm afraid I can't really help you in that case
wheat knoll
Figured it out.
Had a 32-bit install and you HAVE to be on 64-bit Python for Torch
The only other option would've (apparently...) been to downgrade Python version and use older Torch versions
hasty grail
Cool
lapis sequoia
Hi guys I'm trying to integrate some models I trained in TF using TFLite into a Flutter Android App, My model size is obnoxiously huge (200MB) and i can't upload it on Github as i had previously intended
Will making a Dart Client Server Application help me?
eternal cloud
iirc google maps only blurs the text
@hasty grail any suggestions on how to do this? I could use a bit more explanations.
hasty grail
you could train (or download a pretrained) object detection model, use the model to predict the regions that contain signs, then apply heavy gaussian blur on those regions
eternal cloud
you could train (or download a pretrained) object detection model, use the model to predict the regions that contain signs, then apply heavy gaussian blur on those regions
@hasty grail Can I DM u?
hasty grail
Unfortunately no, I'd prefer if you could keep it on this server
eternal cloud
Unfortunately no, I'd prefer if you could keep it on this server
@hasty grail Yea sure. Sorry if my questions are pretty basic because this task I was assigned for, I had no experience in it so need to find a way in by asking a bit.
Aside from doing what you said, is there any other way to completely remove that? I mean I see some other websites using google street view as games where they hid it.
hasty grail
I think you should try the method I suggested first, it's the most straightforward way I could think of
after you manage to achieve that, you can build on top of that
eternal cloud
after you manage to achieve that, you can build on top of that
@hasty grail Alright I will try to see what I can do, where can you find pretrained models?
hasty grail
I think this is a good place to start: https://github.com/facebookresearch/detectron2
hasty grail
no
feature map refers to the activations of a layer given an input
it's also known as an activation map
lapis sequoia
anyone have any experience switching from tensorflow to pytorch, is the transition smooth?
lapis sequoia
Yep Pytorch already without all the additional frameworks is a breeze after Tensorflow
Writing low level code in torch is a much better experience than writing low level code in TF, though I'm still using TF often because idk how to deploy Pytorch code yet
 red hound
Hey guys just started with neural network stuff. I was working with AND and XOR gates, and for AND I initialized all the weights and biases as 0 and it seemed to work fine but had to randomize XOR weights and biases for the loss to change at all
Why is that?
Specifically why does AND work but not XOR
Hmm it seems to cause a "saddle point", also AND was not working properly, it just works if there is no hidden layer
 plucky zephyr
i want to know where i can learn python, i'm already learn it from kaggle, and i feel now i just google code if i want to know what code i need, i want to code it my self and i think my basic is bad, is there good resource to learn it (with exercise better)
lapis sequoia
 limber flax
anyone working in banking/finance that can send me a pm? trying to get some insight
 daring crag
Hello there... I hve been leraning the basis of python for 2 months, can someone recommend me the best ways to learn machine learning from cero? Thanks by the way
 earnest wadi
My network is giving some weird outputs
when I predict the outputs are all super small
5.6342713e-05 1.5367814e-06 8.3271778e-10]```
this is my model
```classifier = Sequential()
classifier.add(Dense(units=16, activation='softmax', input_dim=16))
classifier.add(Dense(units=12, activation='softmax'))
classifier.add(Dense(units=8, activation='sigmoid'))
classifier.compile(optimizer='rmsprop', loss='categorical_crossentropy')
classifier.fit(X_train, Y_train, batch_size=1, epochs=50)```
also at start of training my loss is >1
```Epoch 1/50
2000/2000 [==============================] - 1s 453us/step - loss: 2.0792
Epoch 2/50
2000/2000 [==============================] - 1s 440us/step - loss: 2.0467
Epoch 3/50
2000/2000 [==============================] - 1s 447us/step - loss: 1.8429
Epoch 4/50
2000/2000 [==============================] - 1s 452us/step - loss: 1.6066
Epoch 5/50
2000/2000 [==============================] - 1s 429us/step - loss: 1.4954
Epoch 6/50
2000/2000 [==============================] - 1s 415us/step - loss: 1.4414```
It goes down to 0.22 after 50 epochs ripe forge
Your activation is sigmoid. What should it have been?
earnest wadi
uh
ripe forge
Or, to simplify. What's your target variable? What type of a variable is it
earnest wadi
i just copied down from like 3 or 4 different sources, im still just understabdubg
uh
so bassically
ripe forge
Gotcha so you've copied something that doesn't make sense for your task most likely.
earnest wadi
there is a 16 digit code, the 2nd number is always the only one that counts, so it should be [0,0,1,0,0,0,0,0] if the code was 13567...
yeah just a mix and match of what i thought might not error
So you got an idea of how it could work?
ripe forge
OK go on could you elaborate the explanation, I didn't get your task yet.
earnest wadi
yeah so
i generate 2000 16 digit random codes for X_train, then for Y_train i just grab the second digit of the corresponding x_train and set it to that, so if the second digit is 4, y_train would be 0,0,0,1,0,0,0,0 etc etc
I want it eventually to work out more complex codes
so i can intercept my friends secret messages 😄
bassically 16 digit input, 8 different outputs
ripe forge
Oh okay. This might be fine then
earnest wadi
what might
ripe forge
You can change your optimizer to sparse categorical cross entropy. I guess activation makes sense for 0 and 1.
(which is what sigmoid does.)
ripe forge
Yep
ripe forge
(on phone. Forgive the typos I hate typing underscores)
earnest wadi
ValueError: Shape mismatch: The shape of labels (received (8,)) should equal the shape of logits except for the last dimension (received (1, 8)).
earnest wadi
how do i find that
ripe forge
Ytrain.shape
ripe forge
Oh. Uh, yeah shape is a np.array method
But now I'm really confused as to what the heck your model was running on and predicting
earnest wadi
just lists
ripe forge
Is it lists of lists? Like nested?
earnest wadi
yeah
y train is like this
[[0,0,0,1,0,0,0,0], [0,1,0,0,0,0,0,0]...]
etc etc for 2000 of them
ripe forge
I'll have to search a bit. I don't know off the top of my head.
earnest wadi
Oh alright
ripe forge
Yeah okay so
Your activations were wrong it seems like
Use sigmoid for all the initial ones, and softmax for the last
Basically flip them. What messages do you get after?
earnest wadi
yeah I just found that out in the tensorflow disocord, trying now
still really low
1.2752962e-03 4.9836026e-06 4.5844875e-09]```What's the result
earnest wadi
what should i equal
ripe forge
Just add them together and let me know the answer
earnest wadi
alr
doing it
uh wait that didnt work
hang on
nvm it works, had to use relu not sigmoid
 grave frost
Hey everyone. I wanted to train some Deep Learning models on a GCP instance which would run for about 20hours but I found that if something is running in the instance and when I ssh into it, it stops doing whatever job it was given and starts up the prompt so that I may give it further commands. Does anybody know if there is a way to ssh into the instance just to read whatever it's printing out and not stop the execution?
 austere swift
have you tried using screen
grave frost
screen?
 waxen lake
ya
is it ubuntu
Screen or GNU Screen is a terminal multiplexer. In other words, it means that you can start a screen session and then open any number of windows (virtual terminals) inside that session. Processes running in Screen will continue to run when their window is not visible even if you get disconnected.
so bfr you run the program
type in screen
then do the prorgam
 plush zenith
hi can someone help me? I tryed in the help channels but they recomend me to ask here. I have troubles to plot some data. I made a taylor calculator but i cant make it show me graphs. It tells me that x and y doestn have the same dimension
they told me to show you the code
i know that the plot at the final has no sense
i want it to make me a graph with al the terms
so that i can see
but i cant make it print the function
for that error
and less make the other graphs
and this is what i was asking
if someone could help
ill be truly gratefull
 mellow spruce
I need help iterating through a dictionary that looks like this:
'k1':['v1','v2','v3']
'k2':['b1','b2','b3']
}```

I want to print each key value pair separetely so my expected output is this

```k1 v1
k1 v2
k1 v3
k2 b1```
and so onI haven't found examples online to do this for dictionaries with more than one values
Thank you master
not the best way but lazy and easy to understand
@void anvil unfortonetly didn't work
desert oar
@void anvil don't you need a probability of appearance for each word or something
Yeah you need P(word appears in corpus)
Seems like a reasonable approach
How about a mixture model
P(technical or nontechnical)
Then P(word | technical or nontechnical)
So you can still make use of the existing very large non technical corpora
That's a nice idea
Yeah thats a better but more complicated model
CRF maybe
Or CBOW even lol
desert oar
No but would be cool @void anvil
brittle agate
What I should use instead of subsplit?
I has this example of code. But he doesn't work because subsplit was deleted.
train_validation_split = tfds.Split.TRAIN.subsplit([6, 4])
 surreal idol
Hi, i tried to post my question on reddit but it is not allowed to post pictures. My question is formulated in the figure above. I would like to use the groupby function but keep one of the attributes from the duplicate to include in the dataframe
 bold rune
I have an exercise that I can't figure out how to solve. The exercise itself is described at the top of this gist, my code in the middle, and the result I'm getting with my code at the bottom.
https://gist.github.com/denivic/2a67c161335b4abd7c8b357e42830052
Clearly I'm doing something wrong, but I can't figure out how to fix it.

 frail arch
I am getting
AttributeError: 'DataFrame' object has no attribute '_data'
error when trying to read a pickle file into dataframe in colab
but the file reads fine in my local system and kaggle
grave frost
Hey everyone. I wanted to train some Deep Learning models on a GCP instance which would run for about 20hours but I found that if something is running in the instance and when I ssh into it, it stops doing whatever job it was given and starts up the prompt so that I may give it further commands. Does anybody know if there is a way to ssh into the instance just to read whatever it's printing out and not stop the execution?
@frail arch Could you post your code in here so that we may be able to help you out?
frail arch
got it solved. it was version problem. colab had older pandas
desert oar
Good find ty @void anvil
What language is the other one, java?
I only skimmed on my phone
 keen root
Hi guys, I'm learning a bit of classifiers and I'm starting with the logistic regression, and I've tried it with the mnist dataset as many tutorials use it, but then I tried it on the moon dataset (the one generated by the scikit learn) and I'm getting this result
Any idea why?
that is, why don't I have a curved decision boundary? Is it something inherently impossible to achieve with the logistic regression?
tidal bough
I mean, logistic regression is linear. If you didn't artificially introduce polynomial features (a very common way to allow linear/logistic regression to produce nonlinear functions), the decision boundary will be a single hyperplane (in a 2d case, a line) separating one class from the other.
tidal bough
Then you want PolynomialFeatures, also from sklearn 🙂
First time trying seaborn after always using matplotlib; I love it
 young spruce
For those trying to improve in DS and Algo. Here is group , NO advt, just doubt solving and helping.
https://t.me/dailycodingpractice
 keen root
@tidal bough That perfectly solved it! I have to learn more on this 😄
How did you see that what I needed was PolynomialFeatures? From what understand, using it leads me to a higher dimensional dataset that I can't visualize
 novel remnant
logistic regression is a linear solver. this means that the decision function is a line. but by transforming the feature space using transformations such as polynomial features you can encode non linear behavior even with linear solvers
desert oar
Polynomial is just the easiest way to make a linear model fit nonlinear data
keen root
so it was just, in a way, "protocol"?
there was nothing special about the dataset besides the nonlinearity?
desert oar
Sorta, its easy to see what's happening here in 2 dimensions
novel remnant
no every data science problem depends on the dataset
desert oar
In higher dimensions you can't just eyeball the plot and know what to do
It's easy to see here that the decision boundary is smoothly curved and has only a few "turnaround" points
Thats pretty typical for behavior for a polynomial function
Polynomials have the downside that with a large number of features they have a lot of parameters and can be hard to fit
And while theoretically an arbitrarily high order polynomial can approximate any function, they can badly overfit to the training data
keen root
yeah that makes sense
still its weird that its the addition of polynomial features that lead to a curved decision boundary and not the modification of the current features that do it
desert oar
This is the kind of stuff you have to keep in mind when doing feature engineering. A mix of understanding the mathematical behavior of various transformations, understanding the problem itself and the data you have available, and understanding how your model works
What do you mean by that?
3x^2 - 2x + 4 is still quadratic despite having "linear" terms
keen root
3x^2 - 2x + 4is still quadratic despite having "linear" terms
Its embarassing that this makes so much sense... ahah
desert oar
That's just how learning goes 🙂
 dense copper
hey peeps, I've got a pandas dataframe that looks like this and I'm trying to figure out how to calculate the pct_change() of revenue, which I've done, but when it gets to the end of each ticker it's calculating the change from the previous ticker (so literal row by row). Any ideas how to tell it to skip the final entry for each ticker (e.g. 2015 in this case should be NaN):
     ticker       revenue calendardate
None
0      AAPL  260174000000   2019-12-31
1      AAPL  265595000000   2018-12-31
2      AAPL  229234000000   2017-12-31
3      AAPL  215639000000   2016-12-31
4      AAPL  233715000000   2015-12-31
5         A    5163000000   2019-12-31
6         A    4914000000   2018-12-31
7         A    4472000000   2017-12-31
8         A    4202000000   2016-12-31
9         A    4038000000   2015-12-31
here's an example of what I mean:
>>> res['rev_growth'] = res.sort_values(by=['ticker', 'calendardate'])['revenue'].pct_change()
>>> res
     ticker       revenue calendardate  rev_growth
None
0      AAPL  260174000000   2019-12-31   -0.020411
1      AAPL  265595000000   2018-12-31    0.158620
2      AAPL  229234000000   2017-12-31    0.063045
3      AAPL  215639000000   2016-12-31   -0.077342
4      AAPL  233715000000   2015-12-31   44.267286
5         A    5163000000   2019-12-31    0.050672
6         A    4914000000   2018-12-31    0.098837
7         A    4472000000   2017-12-31    0.064255
8         A    4202000000   2016-12-31    0.040614
9         A    4038000000   2015-12-31         NaN
it's working like I expect but row 4 there is incorrect
it's calculating the pct_change from 5163000000 to 233715000000
I tried using groupby('ticker') but got an AttributeError cause apparently you can't use sort_values on a groupby object: AttributeError: Cannot access callable attribute 'sort_values' of 'DataFrameGroupBy' objects, try using the 'apply' method
.......and I think I just rubber ducked it. lol reversing the sort/groupby order seems to work.
tidal bough
After many unsuccessful attempts, I finally realized that to fit complex distributions, one should throw more neurons at it until they stick 😅
tidal bough
experimenting with ways of representing the differences between the target and the predictions
dense copper
Does anyone know if there's a way to get pandas.DataFrame.to_csv() to fill inf data with empty strings like it does for NaN?
or, alternatively, to get pct_change() to fill division by zero with NaN instead of inf?
I found this df.replace([np.inf, -np.inf], np.nan) which works but it feels hacky to me.
 rancid dove
how is that hacky?
the processes were you are getting inf is completely standard, if you dont want inf then you haev to replace them some how
dense copper
it feels hacky cause it seems like there should be a way to pre-fill rather than have to replace them (e.g. like ffill or bfill but fill with NaN for both NaN and also div/0). It's ok though, this worked fine.
just thought there might be a better way
 storm scroll
Hey guys n gals, has anyone here made a visual dashboard with Dash? I have some questions about good practices. Would love to discuss other questions as well.
flat quest
@tidal bough I mean that's sorta why a lot of times ppl just make the model bigger. Like open ai with GPT3. That thing is massive.
Tho eventually it gets to a point where you can't practically run it on average hardware. You should also look at ensemble/compositional models, they usually help increase accuracy too.
tidal bough
from what I saw, GPTs were at least in part research into how well do advanced models handle scaling, and the answer is "quite well" (on many tests like the maths ones, there's been a monotonic progression from 1 to 3 without signs of slowing down yet), which suggests that if there's a point where making models bigger stops producing better results, it is past GPT3's size, and that thing is massive.
austere swift
Hey guys, so I'm working on trying to use transfer learning and testing out different premade models in pytorch on a different dataset but this dataset is black and white so single channel color while most premade models are rgb with 3 channels, so what would be the best way to modify the inputs of the premade model to accept the single channel images?
tidal bough
worst case scenario, and probably the only way actually, you can just make your grayscale pictures RGB 🙂
Like, translate the grayscale value x (from 0 to 255) to (x,x,x) (RGB).
austere swift
Yeah i'm trying to avoid that but if i have to i can
tidal bough
well, you could also do something invasive like average the 3 channels of the first array of weights
like, if the first neuron is connected to the first pixel in the input with weights r, g, b, replace them with one weight of (r+g+b)/3
no idea if the model will survive it though. It sounds like it should, but...
austere swift
hmmm
tidal bough
actually, not average.
It has to be sum.
Then the results will be exactly the same that the original model had on gray (all channels equal) images.
austere swift
https://discuss.pytorch.org/t/how-to-modify-a-pretrained-model/60509 i saw this on the pytorch forums and I was thinking of trying to do something like this but i dont know if this code is meant for specifically vgg net or if it can be used on other models

PyTorch Forums
Hey there, I am working on Bilinear CNN for Image Classification. I am trying to modify the pretrained VGG-Net Classifier and modify the final layers for fine-grained classification. I have designed the code snipper that I want to attach after the final layers of VGG-Net but ...
but i could try to do that same thing with using the original features code then modifying the input shape from that i guess? i'm not sure
oh well that wouldnt keep the weights lol, yeah I guess I have to just modify the images to become rgb
@tidal bough thanks for the help!
 sudden pumice
Hey guys did cropping faces make face recognition more acuurate or not ??
 weary tapir
Could anyone suggest some sources for beginner/intermediate level in data science? Books or courses prom Pluralsight/udemy/Lynda, etc
Please send them to me directly. Thx a lot.
 sonic bridge
UnicodeDecodeError: 'utf-8' codec can't decode byte 0x83 in position 0: invalid start byte
how can i fix this error
 proud iron
Question regarding the Anaconda environment. Why is the environment folder stored in "envs" folder that is in the C: drive? What difference will it make if it is just in the project folder? :)
dense copper
is there a way with Pandas to run a function like pct_change() conditionally based on the value of a column? and/or return a specific thing (like NaN) based on teh value of another column?
for example here: ```python
ticker calendardate dimension revenue revenue_growth_mry
None
0 AAPL 2019-12-31 MRY 260174000000 -0.0204
1 AAPL 2018-12-31 MRY 265595000000 0.1586
2 AAPL 2017-12-31 MRY 229234000000 0.0630
3 AAPL 2016-12-31 MRY 215639000000 -0.0773
4 AAPL 2015-12-31 MRY 233715000000 NaN
5 AAPL 2020-06-30 MRT 273857000000 0.0219
6 AAPL 2020-03-31 MRT 267981000000 0.0011
7 AAPL 2019-12-31 MRT 267683000000 0.0289
8 AAPL 2019-09-30 MRT 260174000000 0.0044
9 AAPL 2019-06-30 MRT 259034000000 NaN
25 AAPL 2020-06-30 MRQ 59685000000 0.0235
26 AAPL 2020-03-31 MRQ 58313000000 -0.3649
27 AAPL 2019-12-31 MRQ 91819000000 0.4338
28 AAPL 2019-09-30 MRQ 64040000000 0.1901
29 AAPL 2019-06-30 MRQ 53809000000 -0.0725
What if I only want that revenue_growth_mry to be filled in for MRY dimensions and NaN for everything else?
then I want to add another column like revenue_growth_mrt and calculate it for that in a different way or something?
would it be better to just split the dataframe into three separate ones for MRY, MRT and MRQ dimensions?
slate hollow
hey so when i try to import tensorflow as tf i get a illegal instructions (core dumped)
after some painful googling i found that it was bc my cpu didn't support avx or something
so would i have to build from source?
or something like that? (ping plz)
dense copper
if anyone cares I found a solution for the above by just splitting the df into multiple dfs. In doing that I realized I don't need to at all for this particular situation, , but I will need to for others and I found a combination of breaking into dataframes based on the dimension and then using np.where() should work wonders to conditionally fill values
pandas is cool but ... so much stuff lol
I'm sure buried deep within it after years of experience there is a function that does exactly what you want in about 0.0000000000001 seconds but you have to spend 3 yrs learning it first lol
austere swift
@slate hollow what cpu do you have? its very rare for modern cpus to not support avx
austere swift
ooof
slate hollow
how old is that?
slate hollow
f
austere swift
i mean there are more modern pentiums
slate hollow
well ok
austere swift
but if its a pentium that doesnt support avx thats old
slate hollow
at least i know for sure that's the problem now
austere swift
yeah honestly even if it did work you wouldnt be happy running tensorflow on that cpu anyways
slate hollow
neat
austere swift
yeah you could try running it on like google colab or something
the hosting is free
and you can use GPUs and TPUs too
lapis sequoia
#Pulling Random Usernames
url = "https://svnweb.freebsd.org/csrg/share/dict/words?view=co&content-type=text/plain"
r = requests.get(url)
text = r.text
userName = text.split()
randomUsername = random.choice(userName)
print(randomUsername)

#Emails
emailProviders = ["@gmail.com", "@yahoo.com", "@hotmail.com", "@outlook.com"]
emails = randomUsername + random.choice(emailProviders)
print(emails)
I wasn't getting an error before (literally 5m ago) and now I am
Here's the error: https://paste.pythondiscord.com/ohalenesop.sql
 serene scaffold
it doesn't look like there's a straightforward way to find a line of separation between two classes in 2d space
lapis sequoia
wym
If I was using Atom it would've worked fine but idk how to set-up and use PyCharm iss completely diff from what I use
If there are some settings that are important lmk
serene scaffold
I'm talking about something else entirely. Though I did look at your error message and I don't know the solution.
lapis sequoia
Thass so weird cz it worked before perfectly fine
I think I messed up again with PyCharm omg
serene scaffold
is what you're trying to do working from the terminal?
serene scaffold
I've never seen that error message
socket.gaierror: [Errno 11001] getaddrinfo failed```I would search that part on Google
that's coming from socket and not from your code, so there's probably a known solution
lapis sequoia
okay thank u
serene scaffold
I need salt rock lamp 😢
 wild kelp
Hey guys! Does anyone know if the DeepSpeech project is supposed to be multithreaded?
I guess it's more related to tensorflow, but anyways - I only see one core utilized when running training
desert oar
@limpid oak there might be a few GIS experienced people here. it's better to just ask your question, don't "ask to ask"
 limpid oak
I'm making polygons from gpds cords, but there are few errors while recording data
some points are having big interval
eg. 73.88,73.85,75.3
I want to remove this big interval points and connect only those points which are having small interval
desert oar
@limpid oak can you give a more complete example of the data?
limpid oak
can we discus it private grp
desert oar
id prefer not to
i dont need real data
its just not clear what you mean by "remove"
73.88, 73.85, 75.3, 75.41 - i will call these points A, B, C, D. you want to connect A->B and C->D, but not connect B->C?
desert oar
i see. are these latitudes and longitudes?
limpid oak
yes, in json format
limpid oak
yes
desert oar
ok. there are a few solutions
you need to compute the distances between points
not between numbers
limpid oak
every row is recorded points for that polygon
desert oar
using either euclidean distance (for small distances) or haversine distance (for large distance)
this is why i wanted a bigger example of the data
its still not clear how this relates to polygons
limpid oak
wait i will copy some points for you
using either euclidean distance (for small distances) or haversine distance (for large distance)
@desert oar new thing (haversine distance) for me i will read about it
tidal bough
TIL it's called this 😛
desert oar
there is also the "vincenty formula" which is more correct because it takes the elliptical shape of the earth into account, but it's more complicated and slower to compute
tidal bough
sklearn has it, nice
desert oar
see my correction above 😛
limpid oak
can you refer something to read while i copy some data for you
desert oar
wikipedia i guess
thats where i first learned it
i just dont understand how this relates to polygons
tidal bough
https://scikit-learn.org/stable/modules/generated/sklearn.metrics.pairwise.haversine_distances.html is what google gave me as first result, heh
desert oar
in general i can think of 2 ways to determine which points to connect: 1) select a distance threshold by hand, or 2) use HDBSCAN for 1-dimensional clustering (which still requires some parameter tuning)
you can use some metrics like "silhouette distance" to evaluate whether your clusters are good, but im not sure if they make sense in this one-dimensional case
limpid oak
[{"position":0,"Latitude":18.3077341,"Longitud....}]
i have this type of points data for each field
if i connect those points it, means A to Nth it gives polygon
but some times lat or long are recorded with great interval if device lost signal or if we have less satellites in the constellation
my output polygon is having ideal 1acer area and which is very small area on ground
but due to those errors some times sliver polygons are created
or one point is connected farther from nearest point
these type of issues
i hope you understood
i'm using this fun
def f(row): try: return Polygon([(pt['Longitude'], pt['Latitude']) for pt in json.loads(row['PlotGeoFence'])]) except: return numpy.nan
which converts points to polygons
InputFile['geofence_poly'] = InputFile.apply(f, axis=1)
@desert oar
desert oar
@limpid oak i guess i still dont understand how this is meant to represent a polygon, but it might just be a technical term that i dont understand
im not a GIS expert so maybe there are special techniques for it. but i think my general recommendation is a good starting point. compute successive distances between lon,lat pairs, and if the distance is above a threshold then do not connect the two points
or you can try DBSCAN/HDBSCAN
 keen prism
Hi, I'm trying to execute a Python program using the IPython interpreter.
Most recently I ran the program here and got a lengthy output: https://hatebin.com/yyhkmhrkqz
I can't understand it.
tidal bough
Something is broken with the matplotlib backend that's being used.
ImportError:
    Could not load requested Qt binding. Please ensure that
    PyQt4 >= 4.7, PyQt5, PySide >= 1.0.3 or PySide2 is available,
    and only one is imported per session.

    Currently-imported Qt library:                              'pyqt5'
    PyQt4 available (requires QtCore, QtGui, QtSvg):            False
    PyQt5 available (requires QtCore, QtGui, QtSvg, QtWidgets): False
    PySide >= 1.0.3 installed:                                  False
    PySide2 installed:                                          False
    Tried to load:                                              ['pyqt5']
actually, that's quite descriptive 😅
so yeah, install PyQt5 or make it use a different backend (TKinter is the default for Windows; does it work for Linux too maybe? ) @keen prism
keen prism
command to install pyQt5?
desert oar
@keen prism before you install anything else... what operating system are you using, how did you install python, how did you install ipython, and are you working inside a venv/virtualenv or conda env?
tidal bough
Also, does matplotlib work for you outside of ipython?
keen prism
@desert oar
Kali Linux
I don't recall the commands I used to install python or ipython but I figure pip was used.
I'm using WSL
@tidal bough
I'm not sure what test I could do to know.
keen prism
I am remoted into the OS tho. I'm not using Windows Terminal.
desert oar
things like modifying PATH variables
keen prism
I'm getting pretty darn familiar. Yeah I can modify those.
desert oar
i assume youre pretty familiar if you're using Kali?
ok. frankly i recommend avoiding the system python when possible
keen prism
Yeah I'm getting there. This is good practice for that honestly.
desert oar
there are a lot of reasons for this, but basically it conflates "python as a dependency for other applications" and "python as a tool in and of itself" - you want the latter, APT is only good at handling the former
therefore what i recommend is: apt install python3-venv python3-wheel python3-setuptools, then use python -m venv <path> to create a "virtual env" for your project
keen prism
😅 I'm literally at the introduction of a class.
I didn't think I could've messed too much up.
desert oar
heh not yet
things can get very ugly and messy
and unfortunately this isnt communicated to beginners at all
keen prism
also. i got ipyton to work in windows. i'm just being redundant for learning purposes.
can you explain your 2nd instruction?
desert oar
# Make sure you have the core Python package management tools installed
apt install python3-venv python3-wheel python3-setuptools

# Create a "virtual environment" to keep your own Python packages isolated from APT
# This can be called anything and placed anywhere; you typically create (at least) one per project
python -m venv ~/py-sandbox-env

# Activate the env we created
. ~/py-sanbox-env/bin/activate

# Install stuff into the env
pip install matplotlib ipython

# Run stuff
ipython
❯ python -m venv ~/py-sandbox-env
/usr/bin/python: No module named venv
desert oar
yep you need python3-venv
normally it's included with Python but APT packages it separately
because debian things
keen prism
python3 -m venv ~/py-sandbox-env ?
desert oar
(technically its not required for the python runtime so in embedded contexts and other "minimalist" setups you can do without it which is why its not installed by default)
yep, python -m venv invokes the Venv tool, and ~/py-sandbox-env is just a path i made up
when you're learning it's nice to have 1 virtual env that you use for general purpose work
desert oar
did you apt install python3-venv?
keen prism
yea
desert oar
huh, really
desert oar
ah ok
keen prism
can i run it now?
keen prism
oh we definitely do
keen prism
bash? terminal? uhh...
desert oar
well zsh and bash are different
thats why i ask
https://www.bleepingcomputer.com/news/linux/kali-linux-20203-begins-journey-of-replacing-bash-with-zsh/ it looks like they switched to zsh this year

BleepingComputer
Kali Linux 2020.3 was released today by Offensive Security, and it begins the first steps of switching from Bash as the default shell to ZSH.
keen prism
oh. well that shows what i know.
desert oar
echo ${ZSH_VERSION}
what does this show?
keen prism
5.8
keen prism
desert oar
readlink -f /usr/bin/python
readlink -f /usr/bin/python3
what about this?
keen prism
desert oar
hm. do you know if in kali linux /bin and /usr/bin are the same?
it looks like you might only have one python 2 and one python 3 installed
which is pretty normal
keen prism
can't i just eradicate 2.7?
desert oar
it might be a dependency for something
desert oar
apt-cache rdepends --installed python
so it looks like you have a few things that use python 2 still
keen prism
maybe i can change the path for all of them?
desert oar
python --version
just to confirm, does this say it's 2.7?
no definitely dont start messing with system packages
keen prism
yes it does say 2.7.18
desert oar
alright
keen prism
but
python3 --version
says the latest
which means... if you want to evoke python3 you have to say so
yeah?
desert oar
yes (but only if you dont have a venv activated)
now the question is, why isn't venv found even though you have installed it
dpkg-query -L python3-venv | less
not sure what this shows, maybe its a wall of text or maybe its only a few lines
keen prism
sorry i went digging for this screen
but this is what it took to get IPython to use 3.8
do you think if i changed it back everything would function?
/.
/usr
/usr/bin
/usr/share
/usr/share/doc
/usr/share/man
/usr/share/man/man1
/usr/bin/pyvenv
/usr/share/doc/python3-venv
/usr/share/man/man1/pyvenv.1.gz
(END)
this was the output for your command
dpkg-query -L python3-venv | less
desert oar
so yes change it back lol
before you lose track of what you changed
and again this begs the question, how did you install ipython in the first place
keen prism
but how else am i going to get IPython to use the latest version of python?
i'll change it back just a sec
let me perform a test
desert oar
by installing it correctly, associated with the correct version of python
im not sure whats up with kali here. it looks like they set up pyvenv as the only entry point into venv
try pyvenv --help and post what you get
keen prism
ok i edited the file in vim so it'd auto-default back to 2.7 but it didn't result in a successful run of the die roll test
(but even if it did it doesn't seem like a great idea to have ipython be using 2.7)
@desert oar command not found
desert oar
not sure why ~/py-sandbox-env is in that list
keen prism
desert oar
ah
well first of all if you do ipython3 it should give you the ipython attached to python 3
desert oar
and i guess for the sake of just making your life easy.... yes go ahead and install python3-pyqt5
huh
does kali linux have a package repo online anywhere
im going off my memory of what i might do on debian
keen prism
🤔 i'm blanking out on this.
desert oar
i really am not sure why venv doesnt appear to be set up right
this might be a "kali linux problem" and not a "starcat problem"
keen prism
the traceback says line 11 but i don't see the issue
desert oar
it's probably because ipython itself isnt installed correctly (in python3)
it seems like something is generally wonky with the python 3 packages on your system
keen prism
well that sucks. :C i could screen cast my misery?
desert oar
i cant say its your fault without more information, but this is precisely the category of "wtf is going on" problems that using venv will help you avoid in the future
personally i'd just apt purge python3 and start over
keen prism
i'm not against that. i just want this to work.

Stack Overflow
I've been having trouble with Python, iPython and the libraries. The following points show the chain of the problematics. I'm running Python 2.7 on Mac Lion.
iPython doesn't read the libraries of
i was following this earlier
desert oar
so were you messing with other files too?
or just the one change that you reverted
this is all ass backwards and nobody should ever do any of this stuff in this thread
keen prism
i did this
but got stuck on 5
and also... conda install never worked
so i had to use pip
sudo apt-get install python3-pip i think i did this iirc
Stack Overflow
I'm getting into using Jupyterlab from Jupyter notebooks. In notebooks I used to use:
import matplotlib.pyplot as plt
%matplotlib notebook
plt.figure()
x = [1,2,3]
y = [4,5,6]
plt.plot(x,y)
for
@desert oar yeah these were the instructions i was following
desert oar
@keen prism yeah this is the classic mess every novice gets into
that said in your case everything should have worked
keen prism
if you give me a purge and re-install command sequence to try i'll do it
also maybe we can talk about envs and compartmentalization so i can organize this better
i need to know that anyway
i'm really organized irl but really dislike feeling like my files don't know what they're for
desert oar
sure
apt purge python3
apt install python3 python3-pip python3-wheel python3-venv python3-ipython
start here
keen prism
let me know if you want me to post logs for your review too so we're proceding in as an informed manner possible too
desert oar
as long as theres no error message you can probably hold off for now
keen prism
okay sounds good. i'm opent to posting to hatebin etc
i'll run the 2nd command w/ sudo
i noticed your command doesn't mention pip3 is that right?
desert oar
you probably need sudo for both
pip3 is just an alias for "pip running under python3"
keen prism
keen prism
it says no modual with that name
desert oar
what in the world
can you do this in a fresh shell
exit and reopen
log out and log in
keen prism
let me close all shells eyah
desert oar
what does /usr/bin/python3 -m site show
keen prism
i'm going to paste bins of the 3 tracebacks just a sec
∅ /
❯ /usr/bin/python3 -m ipython
/usr/bin/python3: No module named ipython
desert oar
yeah try /usr/bin/python3 -m site
keen prism
i'm struggling to copy the whole doc via vim btw
sys.path = [
    '/home/starcat',
    '/usr/lib/python38.zip',
    '/usr/lib/python3.8',
    '/usr/lib/python3.8/lib-dynload',
    '/home/starcat/.local/lib/python3.8/site-packages',
    '/usr/local/lib/python3.8/dist-packages',
    '/usr/local/lib/python3.8/dist-packages/ipython-8.0.0.dev0-py3.8.egg',
    '/usr/local/lib/python3.8/dist-packages/stack_data-0.1.0-py3.8.egg',
    '/usr/local/lib/python3.8/dist-packages/pure_eval-0.1.0-py3.8.egg',
    '/usr/local/lib/python3.8/dist-packages/executing-0.5.2-py3.8.egg',
    '/usr/local/lib/python3.8/dist-packages/asttokens-2.0.4-py3.8.egg',
    '/usr/lib/python3/dist-packages',
]
USER_BASE: '/home/starcat/.local' (exists)
USER_SITE: '/home/starcat/.local/lib/python3.8/site-packages' (exists)
ENABLE_USER_SITE: True

~ ```does ls /usr/lib/python3.8 | grep venv show anything?
rather, ls /usr/local/lib/python3.8/dist-packages | grep venv
keen prism
it did not show anything
∅ /usr/lib/python3.8
❯ ls -m
abc.py, aifc.py, antigravity.py, argparse.py, ast.py, asynchat.py, asyncio, asyncore.py, base64.py,
bdb.py, binhex.py, bisect.py, _bootlocale.py, bz2.py, calendar.py, cgi.py, cgitb.py, chunk.py, cmd.py,
codecs.py, codeop.py, code.py, collections, _collections_abc.py, colorsys.py, _compat_pickle.py,
compileall.py, _compression.py, concurrent, config-3.8-x86_64-linux-gnu, configparser.py,
contextlib.py, contextvars.py, copy.py, copyreg.py, cProfile.py, crypt.py, csv.py, ctypes, curses,
dataclasses.py, datetime.py, dbm, decimal.py, difflib.py, dis.py, distutils, doctest.py,
dummy_threading.py, _dummy_thread.py, email, encodings, ensurepip, enum.py, filecmp.py, fileinput.py,
fnmatch.py, formatter.py, fractions.py, ftplib.py, functools.py, future.py, genericpath.py,
getopt.py, getpass.py, gettext.py, glob.py, gzip.py, hashlib.py, heapq.py, hmac.py, html, http,
imaplib.py, imghdr.py, importlib, imp.py, inspect.py, io.py, ipaddress.py, json, keyword.py, lib2to3,
lib-dynload, LICENSE.txt, linecache.py, locale.py, logging, lzma.py, mailbox.py, mailcap.py,
_markupbase.py, mimetypes.py, modulefinder.py, multiprocessing, netrc.py, nntplib.py, ntpath.py,
nturl2path.py, numbers.py, opcode.py, operator.py, optparse.py, os.py, _osx_support.py, pathlib.py,
pdb.py, phello.foo.py, pickle.py, pickletools.py,
pipes.py, pkgutil.py, platform.py, plistlib.py,
poplib.py, posixpath.py, pprint.py, profile.py, pstats.py, pty.py, _py_abc.py, pycache, pyclbr.py,
py_compile.py, _pydecimal.py, pydoc_data, pydoc.py, _pyio.py, queue.py, quopri.py, random.py,
reprlib.py, re.py, rlcompleter.py, runpy.py, sched.py, secrets.py, selectors.py, shelve.py, shlex.py,
shutil.py, signal.py, _sitebuiltins.py, sitecustomize.py, site.py, smtpd.py, smtplib.py, sndhdr.py,
socket.py, socketserver.py, sqlite3, sre_compile.py, sre_constants.py, sre_parse.py, ssl.py,
statistics.py, stat.py, stringprep.py, string.py, _strptime.py, struct.py, subprocess.py, sunau.py,
symbol.py, symtable.py, _sysconfigdata__linux_x86_64-linux-gnu.py,
_sysconfigdata__x86_64-linux-gnu.py, sysconfig.py, tabnanny.py, tarfile.py, telnetlib.py, tempfile.py,
test, textwrap.py, this.py, _threading_local.py, threading.py, timeit.py, tokenize.py, token.py,
traceback.py, tracemalloc.py, trace.py, tty.py, turtle.py, types.py, typing.py, unittest, urllib,
uuid.py, uu.py, venv, warnings.py, wave.py, weakref.py, _weakrefset.py, webbrowser.py, wsgiref,
xdrlib.py, xml, xmlrpc, zipapp.py, zipfile.py, zipimport.py
@desert oar there's no dist-packages folder?
keen prism
you asked me to grep 3.8 not 3
3.8 didn't work but i can try 3??
doesn't help
i feel like i'm having an amazingly hard time with this
i think these tracebacks are the key
desert oar
@keen prism something just seems really wrong with your installation
and i dont think its your fault
you might need to get help from a kali linux forum or something
keen prism
mabye it's the way WSL relates to xrdp and the visualization tools
desert oar
it looks like it's installing your python 3 packages into the python 2 site & trying to run them with python 2
keen prism
it could be an OS issue but... i seriously feel like that shouldn't be the case
desert oar
find /usr/lib/python/dist-packages -iname '*ipython*'
what does this show
or ```zsh
find /usr/lib/python2.7/dist-packages -iname 'ipython'
this is really a #unix question at this point since it has nothing to do with ipython or jupyter or conda
keen prism
@desert oar
 gleaming hatch
Ok I see three issues
- Venv not working
- Ipython
- Display
Right?
@keen prism ?
Let's start with venv
Did you do this
sudo apt install pyhon3-venv
Then
python3 -m venv -p python3 .
Then
source bin/activate
That should do it for venv
Then in the venv just do
pip install ipython
desert oar
we already did that @gleaming hatch
something is more generally wrong with their install
nothing they install with apt install python3-* works
gleaming hatch
Then
python3 -m venv -p python3 .
desert oar
packages are missing or seem to be associated with python 2
feel free to try and figure it out
they are on kali linux
and lets please move this to #unix
gleaming hatch
Ok
 alpine bay
Does numpy have any methods that if given a min,max and a number of samples could be used to produce the corresponding values relative to their position on a horizontal line?
I'm trying to simplify a method that creates positions to draw tick marks on a slider
hasty grail
Can you provide a concrete example (e.g. for an array with 10 values)?
velvet thorn
Does numpy have any methods that if given a min,max and a number of samples could be used to produce the corresponding values relative to their position on a horizontal line?
@alpine bay what do you mean?
what you want sounds like linspace but I can't really tell
hasty grail
Yeah that looks like something linspace would do perfectly
alpine bay
the number of positions I need changes based on the width
okay thanks, I'll have a look at that
Any chance there is something similar for logarithmic values?
hasty grail
logspace
alpine bay
well thats swell
lapis sequoia
Every time I quit the Python debugger I get the following:
~/Desktop
base ❯ python zbreakpoint.py
[1] > /Users/gavinw/Desktop/zbreakpoint.py(5)saynumber()
-> print('x is', x)
(Pdb++) x
99
(Pdb++) exit()
Traceback (most recent call last):
  File "zbreakpoint.py", line 8, in <module>
    saynumber()
  File "zbreakpoint.py", line 5, in saynumber
    print('x is', x)
  File "zbreakpoint.py", line 5, in saynumber
    print('x is', x)
  File "/Users/gavinw/miniconda3/lib/python3.7/bdb.py", line 88, in trace_dispatch
    return self.dispatch_line(frame)
  File "/Users/gavinw/miniconda3/lib/python3.7/bdb.py", line 113, in dispatch_line
    if self.quitting: raise BdbQuit
bdb.BdbQuit
@lapis sequoia Seems some people think its caused by multiprocessing / --parallel
have you seen this https://stackoverflow.com/a/23654936 ?
Stack Overflow
I need to debug a child process spawned by multiprocessing.Process(). The pdb degugger seems to be unaware of forking and unable to attach to already running processes.
Are there any smarter python
lapis sequoia
If I use ipdb for debugging I don't get the BdbQuit message.
desert oar
@lapis sequoia i think that's just how the debugger works
might be a better question for #internals-and-peps
i always get that
 bold ledge
AJTToday at 8:23 PM
how do you iterate through
       [ 25.96811899,  32.50910874],
       [ 18.07540068,  21.69568568],
       [ 15.02320635,  17.21685884],
       [ 95.63339586, 139.24364214],
       [  7.50030986,   6.6625219 ],
       [  0.29438217,   0.37201494],
       [ 11.67577435,  11.01543899]])```
, but the first column in in the numpy array
so the 3.11... and 25.968.. and 18.075...
preferable without for loops, but not the end of the world if i do@bold ledge how do you want to iterate without a for loop?
are you asking how to transpose?
.T
bold ledge
hmm well i want to run a function on each of those values
velvet thorn
what function?
velvet thorn
a gaussian pdf
@bold ledge which library
velvet thorn
hm.
bold ledge
np.array([[  1. ,  85. ,  66. ,  29. ,   0. ,  26.6,   0.4,  31. ],
                       [  8. , 183. ,  64. ,   0. ,   0. ,  23.3,   0.7,  32. ],
                       [  1. ,  89. ,  66. ,  23. ,  94. ,  28.1,   0.2,  21. ],
                       [  0. , 137. ,  40. ,  35. , 168. ,  43.1,   2.3,  33. ],
[ 5. , 116. , 74. , 0. , 0. , 25.6, 0.2, 30. ]])```there are 8 features
so the shape is (8, n)
and the previous array is shape (2,8)
the first column is the false result, 2nd is true result
velvet thorn
uh-huh
bold ledge
log_p_x_y = np.array(((-1* ((features - mu_y).square()) / ((2* sigma_y)) + sigma_y) ) + some_log_py)
so i want to do 1 -3.1155426
then the rest of that and throw it into an array
then 85-25.968
then 64-18.07
this is a gaussian naive bayes pdf
velvet thorn
a[0] - b[:, 0]
bold ledge
log_p_x_y = np.array(((-1* ((features[0] - mu_y[:,0]).square()) / ((2* sigma_y)) + sigma_y) ) + some_log_py)
is my guess of what you are saying
correct?
but for the features array, i want to iterate through all of them? so do i do a for loop
bold ledge
       [ 25.96811899,  32.50910874],
       [ 18.07540068,  21.69568568],
       [ 15.02320635,  17.21685884],
       [ 95.63339586, 139.24364214],
       [  7.50030986,   6.6625219 ],
       [  0.29438217,   0.37201494],
[ 11.67577435, 11.01543899]])``` is mu_yokay not getting an "operands could not be broadcast error
np.array(((-1* ((features - mu_y[:, 0]).square) / ((2* sigma_y)) + sigma_y), trying to figure out how to square it now
velvet thorn
you want the square of the difference?
bold ledge
yea
velvet thorn
(features - mu_y[:, 0]) ** 2)
bold ledge
snaps nice
dang got the error again
operands could not be broadcast together with shapes (5,8) (8,2)
bold ledge
def log_prob(features, mu_y, sigma_y, log_py):
    N, d = features.shape

    log_p_x_y =  np.array(((-1* ((features - mu_y[:, 0]) ** 2) / ((2* sigma_y)) + sigma_y) ) + some_log_py)


    assert log_p_x_y.shape == (N,2)
return log_p_x_y```sigma is array([[ 3.1155426 , 3.75417931],
[ 25.96811899, 32.50910874],
[ 18.07540068, 21.69568568],
[ 15.02320635, 17.21685884],
[ 95.63339586, 139.24364214],
[ 7.50030986, 6.6625219 ],
[ 0.29438217, 0.37201494],
[ 11.67577435, 11.01543899]])
velvet thorn
no point
bold ledge
the standard deviation calcualted in a previous function
velvet thorn
doing everything in one line
bold ledge
roger. will do
velvet thorn
oh, mu and sigma are mean and std
velvet thorn
okay, it is clearer to me what you were doing
bold ledge
they both have been calculated already
bold ledge
gotcha
im turning that into code
x being the feature data, minus its mean, then square, then / 2 times std squared
velvet thorn
yeah, got that
that is simple
(-1 / 2) * ((features - mu_y[:, 0]) ** 2) / (sigma_y ** 2)
redundant parentheses but I think they make it clearer
lapis sequoia
looks like you're trying to calculate standard deviation?
you know there's libraries for this
 rustic apex
How do you get started with Data-Science? What do you get familiar with? Numpy?, Pandas?
 leaden snow
watch videos @rustic apex
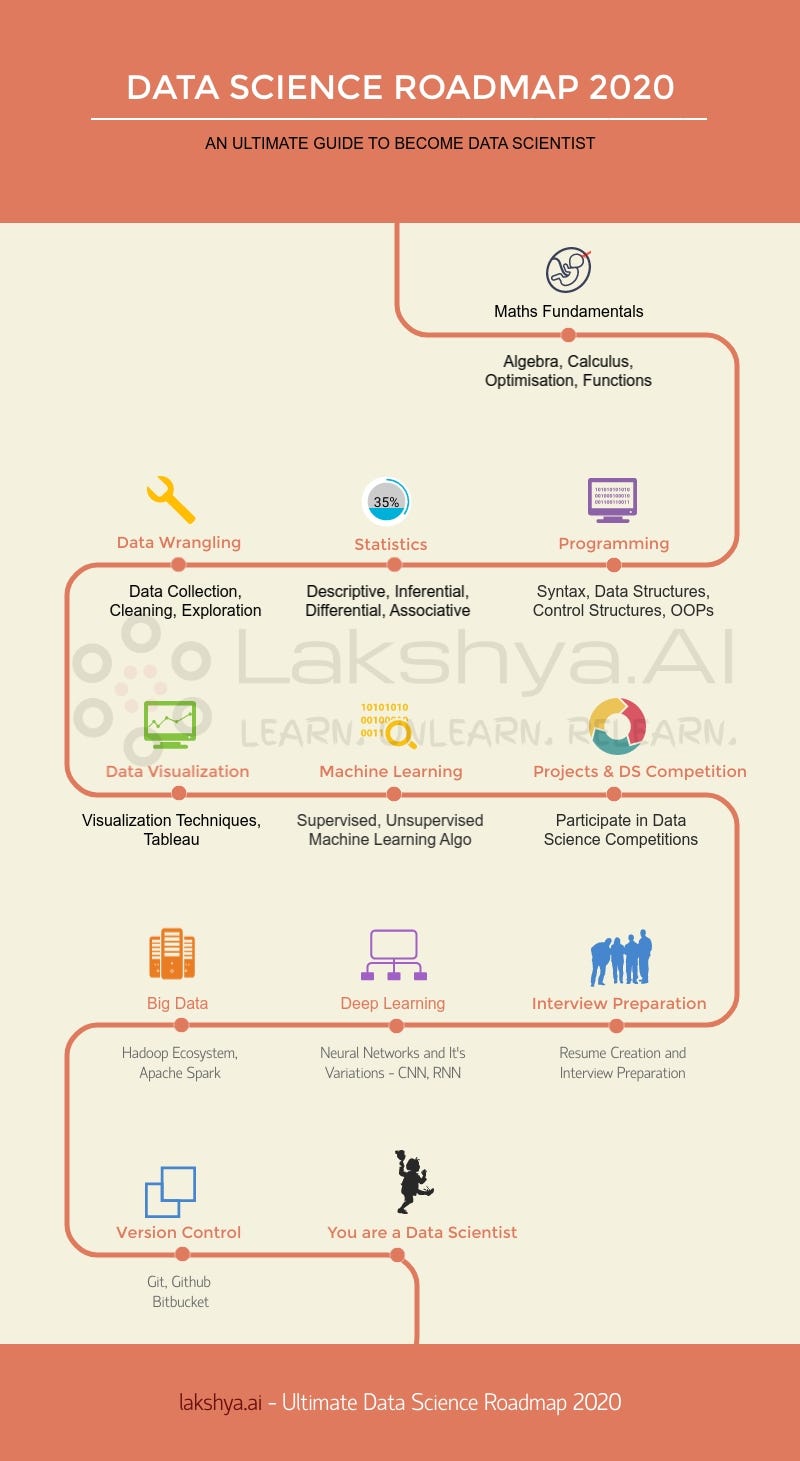
Medium
Disclaimer — Everyone has different question paper in life. Many people fail because they try to copy others. This is true even if you…
 wet jasper
i have a filtered dataframe. i want to reset the indexes. how can i do that? .reset_index is not working
 paper niche
how are you using .reset_index()? it should work
wet jasper
filt_reseted.reset_index()
ah damn
filt_reseted = filt.reset_index()
i need to do this
 chrome barn
df.reset_index(inplace=True)
wet jasper
so im doing this to get my new df ```py
filt_reseted = filt.reset_index()
filt_reseted
filt_reseted.style.applymap(highlight_cols, subset=pd.IndexSlice[:, ['float_value_x', 'price_x']])
why is this saying: ValueError: style is not supported for non-unique indices.
i just resetet the indices
chrome barn
try: df.reset_index(inplace=True, drop=True)
wet jasper
ok the i got the reseting done
but not the problem i tried to solve
im trying to add color to specific columns
but even if im reseting the indices, i get: ValueError: style is not supported for non-unique indices.
    filt_reseted = filt.reset_index()
    filt_reseted = filt_reseted.style.applymap(highlight_cols, subset=pd.IndexSlice[:, ['float_value_x', 'price_x']])
    display(filt_reseted)
@chrome barn
keen root
Hi, I've been trying to learn a few things on data science, and I think the best way to learn is by doing. Does anyone know any place that hosts regular data science competitions or challenges?
 woven radish
Kaggle
 fast bluff
I'm using pandas w/ Alpha Vantage to monitor and buy stocks.. Does anyone know why this isn't returning the latest data?? It says in the metadata that it was last updated a few days ago.. But doesn't that kinda defeat the entire purpose?? Not sure if this is an issue w/ my code or just something with their api or the stock market. Sorry for being a big newb
avdf = ts.get_intraday(symbol='VVPR',interval='15min',outputsize='compact')
Is there any way to forcefully refresh it? Or is this something that is out of my hands?
chrome barn
@wet jasper you did also do drop=true in the reset_index ,otherwise are the column names unique and else maybe this video will help you out: https://www.youtube.com/watch?v=ADV5BzqFtlg

Pretty basic style value error, indicating that either the rows or the column titles are not unique, yielding:
ValueError: style is not supported for non-unique indices
#pandas #style #ValueError
Code I used below:
import pandas as pd
import numpy as np
np2=[]
for cd in range(...
 modest rune
I have the following: (a) Dataframe with 5000 rows, called dataframe. (b) large 2D numpy array, called csurf. (c) large 2D numpy array, called psurf
I want to add a column to dataframe named surface and assign either csurf or psurf to that column. csurf and psurf will be evenly distributed between the rows.
How do I do this in python and ensure that the rows are always referencing the same csurf and psurf. I want to do this in a way so that csurf psurf never get copied, that way they share the same memory and reduce the load on my PC.
NOTE: Once csurf and psurf are calcuted, they are never changed.
In a strictly typed language I would just pass csurf and psurf around by reference.
tidal bough
@modest rune Make them empty columns first, explicitly specifying the dtype of object for both. Then you should be able to assign without any copying happening.
(instead, they will store pointers to one of the two)
(realistically, if they are of such a type that can't be easily copied (so... basically anything that isn't a valid numpy dtype), then that'll happen automatically, to be honest)
modest rune
Are there ways I might accidentally copy the data when I am manipulating the entire dataframe?
tidal bough
What type are csurf and tsurf?
modest rune
numpy.array() of shape 200,200
tidal bough
hmm. Don't think it should ever end up copying the arrays, really.
modest rune
ok. that is good enough for me. How do you know this? Is there a good pandas article on when/why/how it chooses to copy data?
 safe sparrow
in Keras, how do i average my layers towards the.. rows? of my data
instead of the.. columns?
So here, how do i get the global_average_pooling1d into a None, 500 instead of None, 16
tidal bough
ok. that is good enough for me. How do you know this? Is there a good pandas article on when/why/how it chooses to copy data?
@modest rune in general, in Python assignments usually don't copy data. Also, dataframes work by having each column be a 1d numpy array, and numpy has to use theobjectdtype to store arbitrary objects.
 glacial rune
I've got a SQL database and I'd like to make a front end admin page for it to e.g. insert rows, view tables, etc.
What would people recommend? I've never made an FE before
using sqlite btw
I wonder if it's even needed because I have a good DB gui but it might be worthwhile, the skills I'll learn, etc.?
chrome barn
you could learn basic django and use the builtin admin feature to get a admin front end
wet jasper
what did i do that pycharm things this is part of my function?
bold ledge
hi, im trying to duplicate the array, im thinking its repeat or expand_dims but playing around i still cant figure it out
i want my array to look like
([[[ 3.48641975, 4.91866029],
[109.99753086, 142.30143541],
[ 68.77037037, 70.66028708],
[ 19.51358025, 21.97129187],
[ 66.25679012, 100.55980861],
[ 30.31703704, 35.1492823 ],
[ 0.42825926, 0.55279904],
[ 31.57283951, 37.39712919]],
[[ 3.48641975, 4.91866029],
[109.99753086, 142.30143541],
[ 68.77037037, 70.66028708],
[ 19.51358025, 21.97129187],
[ 66.25679012, 100.55980861],
[ 30.31703704, 35.1492823 ],
[ 0.42825926, 0.55279904],
[ 31.57283951, 37.39712919]]
[[ 3.48641975, 4.91866029],
[109.99753086, 142.30143541],
[ 68.77037037, 70.66028708],
[ 19.51358025, 21.97129187],
[ 66.25679012, 100.55980861],
[ 30.31703704, 35.1492823 ],
[ 0.42825926, 0.55279904],
[ 31.57283951, 37.39712919]]
[[ 3.48641975, 4.91866029],
[109.99753086, 142.30143541],
[ 68.77037037, 70.66028708],
[ 19.51358025, 21.97129187],
[ 66.25679012, 100.55980861],
[ 30.31703704, 35.1492823 ],
[ 0.42825926, 0.55279904],
[ 31.57283951, 37.39712919]]
[[ 3.48641975, 4.91866029],
[109.99753086, 142.30143541],
[ 68.77037037, 70.66028708],
[ 19.51358025, 21.97129187],
[ 66.25679012, 100.55980861],
[ 30.31703704, 35.1492823 ],
[ 0.42825926, 0.55279904],
[ 31.57283951, 37.39712919]]],)``` spark stag
@bold ledge idk if there is a better way using 1 command but you can combine both of your suggested commands to get ```py
import numpy as np
x = np.random.random((4, 2))
x
array([[0.91886901, 0.19953614],
[0.81151906, 0.844908 ],
[0.4569922 , 0.35278349],
[0.38418714, 0.81161599]])
np.expand_dims(x, 0).repeat(3, axis=0)
array([[[0.91886901, 0.19953614],
[0.81151906, 0.844908 ],
[0.4569922 , 0.35278349],
[0.38418714, 0.81161599]],
   [[0.91886901, 0.19953614],
    [0.81151906, 0.844908  ],
    [0.4569922 , 0.35278349],
    [0.38418714, 0.81161599]],

   [[0.91886901, 0.19953614],
    [0.81151906, 0.844908  ],
    [0.4569922 , 0.35278349],
    [0.38418714, 0.81161599]]])```
alternatily just use the array constructor, py np.array([x]*3) does the same thing
bold ledge
@spark stag ahh thanks i also found .tile does the same thing
spark stag
good to know
lapis sequoia
After watching a couple of neural network / reinforced learning explaining videos, they show images of lines going to dots. Are these graphical representations ever visible / come back while using the python module gym, or are they just graphical representations and gym is just a black box?
Also, is gym the only module for these type stuff?
safe sparrow
Is there a way to, instead of averaging all into 50 length vector, that i average all 128 filters into a single (50, 50)
 crude karma
do data scientists sometimes handle with qualitative data?