#data-science-and-ml
1 messages · Page 119 of 1
 craggy agate
Like if you want to predict financial data and I compare a CNN-LSTM to a regular vanilla LSTM, of course I would say vanilla is better.
But for processing videos or photos, the CNN LSTM would be better and I would say it's better than the regular or vanilla LSTM.
 sturdy kiln
well yeah pretty obvious any convolutional model will always be the best bet for any 2d image data
craggy agate
sturdy kiln
well yeah pretty obvious any convolutional model will always be the best bet for...
I know but my point is that each model is great at something and not so good at others.
sturdy kiln
22.64 RMSE on a single LSTM layerr, not great not terrible
 craggy agate
sturdy kiln
22.64 RMSE on a single LSTM layerr, not great not terrible
craggy agate
sturdy kiln
22.64 RMSE on a single LSTM layerr, not great not terrible
That's a pretty good prediction.
craggy agate
Yeah
sturdy kiln
im assuming since you can do stacked LSTM, and bidirectional lstm, you can do stacked bidirectional?
craggy agate
sturdy kiln
CNN and MLP scored better tho lol
CNN is good at finding patterns 🤷
sturdy kiln
true but a basic ml perceptron is beating all of it lol
craggy agate
sturdy kiln
im assuming since you can do stacked LSTM, and bidirectional lstm, you can do st...
Not something I have specifically tried but in theory I don't see a problem with it.
sturdy kiln
those are some very erratic metrics if i see one
 sturdy kiln
wow bidirectional sucked ass

 clever karma
yo i wanna check how much players a minecraft server has and then after that if it is a certain amount it pings anyone with a certain role how can i go about checking the players
craggy agate
sturdy kiln
wow bidirectional sucked ass
Bidirectional LSTM is typically used as a language model.
sturdy kiln
hmm TIL
so the only thing i can take out of here, a simple MLP is the best performing model for any financial time series data lol
craggy agate
sturdy kiln
those are some very erratic metrics if i see one
If it's going down, try to see how far you can get the loss to drop before it plateaus.
craggy agate
sturdy kiln
so the only thing i can take out of here, a simple MLP is the best performing mo...
Yeah, what's weird is that it's better than an LSTM and CNN-LSTM at stock prediction.
 past meteor
sturdy kiln
wow bidirectional sucked ass
past meteor
sturdy kiln
wow bidirectional sucked ass
I don't even know if bidirectional LSTMs make sense for time related modelling
craggy agate
past meteor
I don't even know if bidirectional LSTMs make sense for time related modelling
Exactly
craggy agate
You just experimenting?
sturdy kiln
homework actually lol
past meteor
I mean you can build the model but conceptually you're conditioning on the past and the future
craggy agate
sturdy kiln
homework actually lol
Ohk lol
past meteor
That makes sense for text but not for time series
craggy agate
Yep and stock prices cannot be predicted using the past data unless you are predicting a short period.
sturdy kiln
i am actually doing that
im using samples instead of the whole thing
as a training set
past meteor
I don't know financial data well enough. Is there no seasonality whatsoever?
craggy agate
past meteor
I don't know financial data well enough. Is there no seasonality whatsoever?
There could be but it's not enough to accurately predict share prices.
There are hundreds of factors influencing stock prices.
past meteor
Agreed
But the point isn't necessarily predicting exactly what the stock will be
You "only" need to do better than making safe bets
craggy agate
past meteor
But the point isn't necessarily predicting exactly what the stock will be
Yes but even a rough idea can be wrong a lot of the time.
sturdy kiln
craggy agate
There are hundreds of factors influencing stock prices.
ive read a paper that made use of LSTM and paragarph vectors to forecast stock markets based on current news articles, tweets, posts about that specific company
so thats one way to get that lol
craggy agate
Like for example TSLA shot up 30% in like 1 day, if we used an LSTM to predict its price for the day using past data, it would have probably predicted a negative 1-2% change.
craggy agate
sturdy kiln
ive read a paper that made use of LSTM and paragarph vectors to forecast stock m...
News articles and financial data for the company might be a better approach than solely relying on past prices.
sturdy kiln
yeah i didnt say my approach is very practical, its quite the opposite lol
the market is extremely volatile, and forecast based on past data is barely enough
im just doing model analysis just on this data
craggy agate
sturdy kiln
the market is extremely volatile, and forecast based on past data is barely enou...
Exactly.
craggy agate
sturdy kiln
im just doing model analysis just on this data
Alrighty
If you were analyzing the news articles, the bidirectional LSTM and transformer models would be great.
 toxic mortar
@sturdy kiln I am currently doing something similiar for PIPE deals
Just with sequential neural nets
In neural networks, how do you aproach feature engineering. For example should I include:
-ParamA
-ParamB
-Ratio ParamA/ParamB
as the input parameters of my neural network.
Is the ParamA and ParamB redundant if I have some function that is composition of ParamA and ParamB?
ParamA and ParamB arent highly correlated, in fact not corelated at all
 bleak pier
hi people!
I have a question. What should I do if I use a Jupyter Notebook that I want to execute a command directly on the terminal with ! ... . This specific command is a source activation, source ./script.sh. After this execution, I have 'new commands' prefixes to use and they are only visible after this source, right?
The problem is that I have to do it in many parts of my notebook but I want a way to set it once all for all cells that I want to execute the commands from script.sh. Is there a way to do it?
 teal lance
What’s the fastest way to connect to Mt4 using Oanda with Python ? I can’t seem to find much info anymore
 desert oar
bleak pier
hi people!
I have a question. What should I do if I use a Jupyter Notebook that...
desert oar
bleak pier
hi people!
I have a question. What should I do if I use a Jupyter Notebook that...
Are you trying to activate a venv from inside a notebook?
 unkempt apex
I have a confusion regarding polynomial distribution
suppose I have 2 columns
salary and years
I considered salary as y and years as x
so now we have only one feature which is years
so after training model , when I send value as "5" it says
ValueError: X has 1 features, but LinearRegression is expecting 2 features as input.
https://paste.pythondiscord.com/VZAA
this is full code
 jaunty helm
how do you guys deal with ordinal features?
e.g. for a feature with 3 possible values, Very high, High, Medium, up until now I'd just encode them to 1, 2, 3 respectively (or 3, 2, 1 but that doesn't really matter)
but I just had a thought, what if say Very high actually meant the value of 100, while high and medium mean 5 and 0; that'd be pretty bad for linear regression techniques right?
obviously one hot encoding is always an option, but then I waste the ordering info
uhh, I'm still in traditional ML land, haven't looked into neural nets yet 😅 but ty for your info
 spring field
what's traditional ML land?
anyway, I find using increasing scalar values for encoding sth like that a bit weird, although I can't shake the feeling that it just might work... usually when you have labels and these pretty much seem just like ordinary labels, you'd use an embedding as Kwisatz mentioned
you can take a bit of a step back and use only one-hot encoded vectors as well
 wooden sail
spring field
what's traditional ML land?
anyway, I find using increasing scalar values for en...
wooden sail
spring field
what's traditional ML land?
anyway, I find using increasing scalar values for en...
they probably mean classical optimization approaches with no networks
(the line is thin, you can unfold many iterative algorithms into something identical to a network)
spring field
alright, does classical optimization at any point use one-hot encoding for labels?
wooden sail
sure
before you can do anything, you need to choose how to represent your data reasonably
spring field
oh, ok, ahh, actually, ig one can classify simple stuff as well...
bit of a silly question and currently can't provide even the graphs, but suppose I decided to use an RNN for some sequential data and it happens to fit test data exceptionally well (despite how little of it is available (I got 6 batches (for training, 1 batch for testing) of 8 sequences, each of which has 48 data points, each of which has 3 values as input and 2 values as output), now, for the silly question, do the fantastic results mean I chose the right approach? 😁
wooden sail
that, massive overfitting, or data leakage
you'd wanna run several sanity checks to be sure
spring field
I mean, they're not super duper perfect results, but I was surprised nonetheless
I'm more happy about finally understanding RNNs a bit deeper
alright, to elaborate a bit more, it's data spanning over a couple weeks and it's been recorded in rather short intervals, a couple minutes between each measurement, so what I did was split it up every couple hours to get those sequences and then just trained on those, I was wondering what could be improved here
for one, it seems using LSTM might be beneficial as it could train on longer sequences while retaining context
another idea that came to me was implemented something similar to a denseblock or a resnet type thing where I could supply different lengths of sequences and the shorter ones could retain some features from the longer ones
another approach would have been using simple linear regression, I just had my doubts about LR being able to predict future outcomes, as it would likely need to regress against time and while it may have a certain pattern, it's not exactly a simple model probably, and then after regressing against time and getting future outcomes from that, use those predictions against some other value and then regress that
speaking of overfitting, I had no variation in sequence lengths at any point
does it matter much for RNNs? the sequences themselves seemed quite diverse tbf
there might be some continuity issues at some point, but those are unlikely to affect many sequences...
 warm trellis
Hey leute,
channels in Conv1d would be the columns in tabular dataset?
 severe inlet

im studying for a test tmr, how would i go about trying to find the weights vector by hand? especially when the weights and inputs are of different lengths
wooden sail
warm trellis
Hey leute,
channels in Conv1d would be the columns in tabular dataset?
sure thing
 lapis sequoia
hi
can i leave a file here for a gpt bot im tryna code but it hangs up and doesnt record and paste my audio. Its getting stuck at line 52.
audio = recognizer.listen(source, timeout=None)
import openai
import pyttsx3
import speech_recognition as sr
from gtts import gTTS


def transcribe_audio_to_text(filename):
    recognizer = sr.Recognizer()
    with sr.AudioFile(filename) as source:
        audio = recognizer.record(source)
    try:
        return recognizer.recognize_google(audio)
    except sr.UnknownValueError:
        print("Google Speech Recognition could not understand audio")
    except sr.RequestError as e:
        print(f"Could not request results from Google Speech Recognition service; {e}")
    except Exception as e:
        print(f"An error occurred in transcribe_audio_to_text: {e}")


def generate_response(prompt, client):
    response = client.chat.completions.create(
        model="gpt-3.5-turbo",
        messages=[
            {"role": "system", "content": "You are a helpful assistant."},
            {"role": "user", "content": prompt},
        ],
    )

    return response.choices[0].message.content


def speak_text(text, engine):
    engine.say(text)
    engine.runAndWait()


def main():
    client = openai.OpenAI(
        api_key=""
    )

    # Initialize the text-to-speech engine
    engine = pyttsx3.init()

    while True:
        # Wait for the user to say "discord"
        with sr.Microphone() as source:
            recognizer = sr.Recognizer()
            try:
                print("Say 'discord' to start recording your question...")
                audio = recognizer.listen(source, timeout=None)
                print("finished listening")
                transcription = recognizer.recognize_google(audio)
                print(f"Transcription: {transcription}")
                if "discord" in transcription.lower():
                    # Record audio
                    filename = "input.wav"
                    print("Say your question...")
                    with sr.Microphone() as source:
                        recognizer = sr.Recognizer()
                        source.pause_threshold = 1
                        audio = recognizer.listen(
                            source, phrase_time_limit=None, timeout=None
                            )
                        with open(filename, "wb") as f:
                            f.write(audio.get_wav_data())

                    # Transcribe audio to text
                    text = transcribe_audio_to_text(filename)
                    if text:
                        print(f"You said: {text}")

                        # Generate Response using GPT-3
                        response = generate_response(text, client)
                        print(f"GPT-3 says: {response}")

                        # Record audio with gTTS for video
                        tts = gTTS(text=response, lang="en")
                        tts.save("sample.mp3")

                        # Read response using text-to-speech
                        speak_text(response, engine)
            except sr.UnknownValueError:
                print("Google Speech Recognition could not understand audio")
            except sr.RequestError as e:
                print(
                    f"Could not request results from Google Speech Recognition service; {e}"
                )
            except Exception as e:
                print(f"An error has occurred: {e}")


if __name__ == "__main__":
    main()
import openai
from speechtotextbot import generate_response

client = openai.OpenAI(
    api_key="sk-proj-5UWznYrSQjlDLacViE0dT3BlbkFJlPrZESypkh4Z6ZrHvMIO"
)
response = generate_response("what does a yoyo do", client)
print(response)
 orchid forge
how to do web scraping with unstructured data using python?
 hollow escarp
@past meteor hi i read everything which you send me about onnx and im having a trouble with finding detection boxes in output data from onnxruntime, i transfered my pt model to onnx with following command yolo export model=<my_model> format=onnx imgsz=640,640 and i cant find the boxes and confidence of predictions. Im getting predictions with following code:
  model_url = "./models/license_plate_detector.onnx"
  session = onnxruntime.InferenceSession(model_url)

  image = cv2.imread('./test_photos/test1.jpg')

  input_size = (640, 640)
  resized_image = cv2.resize(image, input_size)
  image_bchw = np.transpose(np.expand_dims(resized_image, 0), (0, 3, 1, 2)).astype(np.float32)
  pred = session.run(None, {"images": image_bchw })
  .....
Hey, I am working on a project to give my Ryze tello drone a track me feature, I want to use object detection or object tracking for this but there are just soo many methods, I have tried a full body haarcascade but it failed to accurately track me, I am trying to use a SIFT feature Detector but I doubt it will work just cause of all the distractions in the background and a possibility of more than one person being in the original capture frame. What type of object tracking would you guys recommend?
orchid forge
orchid forge
how to do web scraping with unstructured data using python?
Anyone?
The thing is that the it's can be a shopping website so how can I scrap my ideal data from it?
 deep veldt
should i use pytorch or tensorflow for convolution neural network?
 buoyant vine
Personally I think PyTorch is just the standard now days
unless you're following some Keras tutorial to learn some basics
deep veldt
should i use convolution neural network or siamese neural network for images?
 charred compass
orchid forge
The thing is that the it's can be a shopping website so how can I scrap my ideal...
charred compass
orchid forge
The thing is that the it's can be a shopping website so how can I scrap my ideal...
I didn't understand the question but i guess you can manually look at the html structure and then scrape. If you are planning to scrape the same page then u can just run that script
orchid forge
charred compass
I didn't understand the question but i guess you can manually look at the html s...
If there's a website a normal website how am I suppose to gather the data if it's not in table form
hollow escarp
hollow escarp
<@260493929047130113> hi i read everything which you send me about onnx and im h...
Okay i found it, https://dev.to/andreygermanov/how-to-create-yolov8-based-object-detection-web-service-using-python-julia-nodejs-javascript-go-and-rust-4o8e this article was really helpfull

DEV Community
Table of contents Introduction YOLOv8 deployment options Export YOLOv8 model to...
warm trellis
Let's say I've a data in shape (32, 28, 8) where 8 is the number of the columns, 28 is the length of the time windows, 28 values in each windows, what should be my in channel in 1dconv networks? 8 or 28?
 tidal bough
typically when doing timeseries analysis one convolves along time, I believe. so 28 is your "input length", and 8 is the number of input channels. Which means you'll probably need to transpose your data to (32,8,28) first, because Conv1d expects the axis to be convolved over to be the last one.
 clear oriole
What could I be doing wrong that my neural network doesn't get trained at all? Just outputs straight values.

this is the model code that I have, I am doing something wrong but I can't really pin point that bug
 placid sentinel
Good day, I am new to this channel!
I have a "Collaborative-filtering concept of proof" task that I coded using Python Flask and need help with some additional requirements in the task. Can someone help me with that? I will put the task description below to view it easily.
I need web-based software written in Python Flask to visualise how user-based collaborative filtering works. It should be a table type where there are other users ratings and then I can interact with items to get recommendations.
I have to make a user-item table with 5 users ( u1, u2, u3, u4, u5) vertically and 5 items (i1, i2, i3, i4, i5) horizontally. Here, as a user, I can give points (ratings) to every item for all users between 1-5 or give them a "?" value (using dropdown options). After completing the user-item ratings and clicking the submit button, you will display another table below filling the empty cells (the cells with the value "?"). This time, you will predict the rating for the user-item. For instance, we have been given a table below:
User1: 5, 3, 4, 4, "?"
User2: 3, 1, 2, 3, 3
User3: 4, 3, 4, 3, 5
User4: 3, 3, 1, 5, 4
User5: 1, 5, 5, 2, 1
Considering these given ratings, in the next table, you will fill in that cell which was previously indicated as "?" with a predicted rating value that you will calculate using Pearson correlation. You can use any Python libraries, such as Spark or any relevant ones to solve this collaborative filtering task.
The user can change the rating values (between 1-5) or leave the table cell empty (“?”) as they wish. For example:
User1: 5, 3, 4, 4, "?"
User2: 3, 1, "?", 3, 3
User3: 4, "?", 4, 3, 5
User4: 3, 3, "?", 5, 4
User5: "?", 5, 5, 2, 1
Based on the edited table above, the program should list the predicted values indicated as “?”.
Generate app.py and index.html codes.
past meteor
hollow escarp
Okay i found it, https://dev.to/andreygermanov/how-to-create-yolov8-based-object...
Glad you ended up finding it
craggy agate
Hey, I am working on a project to give my Ryze tello drone a track me feature, I want to use object detection or object tracking for this but there are just soo many methods, I have tried a full body haarcascade but it failed to accurately track me, I am trying to use a SIFT feature Detector but I doubt it will work just cause of all the distractions in the background and a possibility of more than one person being in the original capture frame. What type of object tracking would you guys recommend?
 thorn cairn
hey, my word2vec model is overfitting and i dont have a clue about NLP cause my prof just told us to use an algs that hasnt been taught yet, soo is there any thing i can do to stop the overfitting?
buoyant vine
Dropout, doing less epochs, not such an aggressive LR, etc... More data/better data...
hard to tell you if anything is the cause without the code
thorn cairn
can i post my ipynb on the forum?
thorn cairn
buoyant vine
Dropout, doing less epochs, not such an aggressive LR, etc... More data/better d...
let me try decreasing the LR
#Defining Neural Network
import keras
from keras.models import Sequential
from keras.layers import Dense,Embedding,LSTM,Dropout,Bidirectional,GRU
import tensorflow as tf

model = Sequential()
#Non-trainable embeddidng layer
model.add(Embedding(vocab_size, output_dim=EMBEDDING_DIM, weights=[embedding_vectors], input_length=20, trainable=True))
#LSTM
model.add(Bidirectional(LSTM(units=128 , recurrent_dropout = 0.3 , dropout = 0.3,return_sequences = True)))
model.add(Bidirectional(GRU(units=32 , recurrent_dropout = 0.1 , dropout = 0.1)))
model.add(Dense(1, activation='sigmoid'))
model.compile(optimizer=keras.optimizers.Adam(learning_rate= 0.01), loss='binary_crossentropy', metrics=['acc'])

del embedding_vectors
note: im just copying off people on kaggle, idk what im doing.
So, what the difference between this and using word2vec from gensim.models?
thorn cairn
im trying to build a model that detecs sarcasm from news headlines
but they're both word2vec? im confused... maybe just a same algs, but different library?
thorn cairn
does anyone know why the x output shape is always none when i add dropouts?
 tidal bough
doesn't that just indicate a variable number of samples?
spring field
given a somewhat traditional RNN, approximately how far can it reasonably predict the future? in terms of how much data has been given, suppose the sequence is 12 data points long, can it predict the next 12, 24, 36 data points, what would it depend on?
the way I decided to roll out future predictions was for the network to predict the next input values alongside the output values that I want to actually predict and then use these predicted future inputs to do the next prediction on the next future inputs and the next outputs and then I only take the very last output of the predicted sequence
visually speaking it's something like this...

so say I have the initial sequence of say 12 data points and I get back 12 data points where part of the data is the predicted inputs and the other part is the output that is of interest, so basically it moves by one data point forward, then uses that to predict the next inputs and the outputs that are of interest and then uses those inputs for the next prediction and so forth
x = [1, 3, 2, 5, 1]  # if continued, the next value would be 4
y = [[3, ...], [2, ...], [5, ...], [1, ...], [4, ...]]  # [next input, ...]
so, it should learn to predict the next input and also the other values that are of interest
but then it uses those predicted inputs for the next prediction of the next inputs and next values and so on
here's a concrete example from training, the graph on the right, shows a randomly selected period from the dataset that is 10 times the length of a sequence used in training, it is given a 10th of this sequence as a base (the yellow line) and then, as described above, it tries to predict the next elements in the sequence one by one, but as you can see, it quite quickly converges to a constant value
 spring field
given a somewhat traditional RNN, approximately how far can it reasonably predic...
spring field
spring field
given a somewhat traditional RNN, approximately how far can it reasonably predic...
hence this question
and then of course I guess there's potential running into the network forgetting most of the stuff if longer sequences are used (in training and as a base) to predict longer time periods
 iron basalt
spring field
given a somewhat traditional RNN, approximately how far can it reasonably predic...
iron basalt
spring field
given a somewhat traditional RNN, approximately how far can it reasonably predic...
Depends on the problem, potentially forever.
If it's something really simple, like a straight line, then easily forever.
spring field
spring field
here's a concrete example from training, the graph on the right, shows a randoml...
well, it is not a straight line
I mean, clearly the network thinks otherwise
iron basalt
spring field
well, it is not a straight line
Right now we mostly just have empirical evidence. This depends on the type of "traditional RNN" (there are multiple). Some have some more math to explain them. But it's still mostly just trying them out and comparing (for anything sufficiently complex).
 iron basalt
spring field
basically I have this
iron basalt
spring field
basically I have this
Yeah i'm assuming what most mean by RNN, the deep learning kind trained with backpropagation (through time).
RNNs have been around prior to backpropagation taking off.
spring field
oh
iron basalt
It's still being figured out, you can more or less just measure it. See how much it can remember.
Improvements come from trying to solve issues with backpropagation, intuitions that make a new design, then backed up by results.
Like with LSTM.
Meanwhile some people are trying to analyze the math more, but it will take some time.
Math kind of happens in that way, where it slowly corners the problem from all sides.
spring field
I'm also wondering whether my sort of general approach is in the right direction
basically I just have a bunch of continuous (mostly) sequential data that I split up in smaller sequences for training, I'm about to try to have more splits because currently it just takes out the sequence length, steps by the sequence length to the next chunk and takes that out and so on, I'm gonna try stepping by 1 elemnt and taking out a sequence length that way
spring field
iron basalt
Improvements come from trying to solve issues with backpropagation, intuitions t...
yeah, I start noticing more and more that there's a lot of intuition involved as well
iron basalt
spring field
I'm also wondering whether my sort of general approach is in the right direction...
Not sure what is meant by the 1 element part at the end there, but random chunks, yeah.
spring field
iron basalt
Not sure what is meant by the 1 element part at the end there, but random chunks...
hope this helps 
 iron basalt
spring field
hope this helps <:pg_rofl:837436444770304050>
iron basalt
spring field
hope this helps <:pg_rofl:837436444770304050>
Ah, stride 1. So you want random, not in-order.
Shuffled data.
spring field
no no, so, I have a bunch of continuous data, that I split up in sequences, so each sequence is like its own thing and the sequences are then ofc shuffled and randomly distributed across batches
spring field
sequentially
iron basalt
In the image given before, are you training in a random order of those blocks?
Like 3, 1, 2.
They can overlap, but it's just important that the blocks you pick are random all over.
And ideally not clustered then if they overlap.
So, uniform.
spring field
!e
# continuous, sequential data
data = list(range(10))

seq_length = 4
# stride the same as seq length
for idx in range(0, len(data), seq_length):
    print(data[idx:idx + seq_length], end=" ")
print()
# stride = 1
for idx in range(len(data)):
    print(data[idx:idx + seq_length], end=" ")
all of these sequences are then shuffled during training
 arctic wedgeBOT
@spring field :white_check_mark: Your 3.12 eval job has completed with return code 0.
001 | [0, 1, 2, 3] [4, 5, 6, 7] [8, 9]
002 | [0, 1, 2, 3] [1, 2, 3, 4] [2, 3, 4, 5] [3, 4, 5, 6] [4, 5, 6, 7] [5, 6, 7, 8] [6, 7, 8, 9] [7, 8, 9] [8, 9] [9]
Ok, that should be fine then. Important thing is that deep learning does not like in-order.
This is the same as just random picking a start index and some fixed length and just picking over and over.
spring field
arctic wedge
<@670379095951147019> :white_check_mark: Your 3.12 eval job has completed with r...
it's just this way I get to get more sequences per sequence 😁
idk if it will actually help
iron basalt
It will, especially if you can start at any point in time. It will have seen examples of starting at those points.
spring field
spring field
here's a concrete example from training, the graph on the right, shows a randoml...
yep, that was what I was thinking, cuz the rollout (on the right) here does start from a random point
iron basalt
spring field
yeah, I start noticing more and more that there's a lot of intuition involved as...
Btw, in the current state of things, RNN's abilities are even emperically unclear. There is a bunch of evidence being tossed around that many have not reproduced, and some even claim to have some new RNNs that beat out transformers for things like LLMs. One big issue with RNNs is that even slight tweaks to them have a huge impact, and they don't train as well (in terms of parallelization), so it's a bit unclear if they are actually better or worse, or if it's just because other things work better with existing hardware so we have more evidence for them (this hardware bias issue applies to a lot of ML (we happen to currently have GPUs, which happen to work well at certain things)).
spring field
I see, yeah, that's kinda crazy tbf, that we don't even know what's happening, it just happens 😄
iron basalt
spring field
I see, yeah, that's kinda crazy tbf, that we don't even know what's happening, i...
We are relying on some general ideas that work well, but especially at smaller scales, the details matter.
(If you make the network big enough and throw enough compute at the problem, it can work, which is the current approach (more cloud hardware in a race) (which requires the approach to work well with the hardware, I just wish we flipped this around and made more diverse hardware to try out different things at scale (but that is really expensive)))
craggy agate
Hey, I am working on a project to give my Ryze tello drone a track me feature, I want to use object detection or object tracking for this but there are just soo many methods, I have tried a full body haarcascade but it failed to accurately track me, I am trying to use a SIFT feature Detector but I doubt it will work just cause of all the distractions in the background and a possibility of more than one person being in the original capture frame. What type of object tracking would you guys recommend?
Can someone please help me? ^
spring field
spring field
here's a concrete example from training, the graph on the right, shows a randoml...
I mean, I managed to get something more interesting with some configuration adjustments and some other hyperparameter changes and whatnot, still feels like I'm missing something and it becomes "less creative" the lower the loss gets (the top small graphs are test fits from the test dataset, so like, it's what it doesn't train on), but the bottom graphs, the two bigger ones are basically rollouts and they are not as exciting as I would hope, it's basically using one day as a base input to then predict future inputs and outputs and so the next 4 days, but it's just not doing something I guess?

idk, maybe I should've taken a different approach
teal lance
Best person for tkk bootstrap customization 🔥🔥
teal lance
spring field
I mean, I managed to get something more interesting with some configuration adju...
This is cool what’s it for🔥
spring field
it's mainly for practice
 serene scaffold
 analog bolt
HOW DOES ONE MAKE THE MACHINE LEARN?
analog bolt
HOW DOES ONE MAKE THE MACHINE LEARN?
math
analog bolt
oh okay
do I actually have to remember how to get a standard deviation or can computer do it for me
 tacit basin
analog bolt
do I actually have to remember how to get a standard deviation or can computer d...
tacit basin
analog bolt
do I actually have to remember how to get a standard deviation or can computer d...
It depends
 pliant heron
hi!
good day to you guys!
I need some wrt continuing learning data science/analytics.
I finished up learning python from a book, and did learn some libraries(matplotlib, pygal). Can someone suggest from where i can get easy project related to the libraries- panda, seaborn, and scikit learn. My friend is in stock market and she is helping me out to break into data analytics, so a related project would be a great help
thankyou


my goal is to be able to do backtesting related to stock markets/trading
please tag me if someone suggests a link or source
 feral wind
hi guys i wanna ask, so i have 3 labels as my y variable and that is dropout, graduate, and enrolled. so i want to classify the data into 3 of this thing and i am using svm. but i dont know what kinda svm i should use because i have 3 classes of labels
jaunty helm
feral wind
hi guys i wanna ask, so i have 3 labels as my y variable and that is dropout, gr...
can you elaborate? sklearn.svm.SVC works out of the box
The multiclass support is handled according to a one-vs-one scheme.
also this seems like a nice read
scikit-learn
This section of the user guide covers functionality related to multi-learning problems, including multiclass, multilabel, and multioutput classification and regression. The modules in this section ...
past meteor
feral wind
hi guys i wanna ask, so i have 3 labels as my y variable and that is dropout, gr...
You mean, what kind of kernel function?
In my opinion, never use the Gaussian kernel SVM. It's between the linear kernel and the RBF SVM
The biggest consideration for picking an SVM is your dataset size. If your dataset is too large you can't use (RBF) SVMs at all. You can still use linear SVMs that are solved in the primal form
jaunty helm
past meteor
In my opinion, never use the Gaussian kernel SVM. It's between the linear kernel...
may I ask for your reason on this?
past meteor
jaunty helm
may I ask for your reason on this?
Because it requires forming the kernel matrix and the size is NxN
You can easily figure out how much memory this takes by taking your dataset, squaring it and checking how much GB it takes with float 32
jaunty helm
past meteor
Because it requires forming the kernel matrix and the size is NxN
ah, too memory intensive 🙂
ty for your reply
feral wind
jaunty helm
can you elaborate? `sklearn.svm.SVC` works out of the box
> The multiclass suppo...
i cant elaborate that, im just starting to learn, do you have tutorials on youtube that might be of help
jaunty helm
feral wind
i cant elaborate that, im just starting to learn, do you have tutorials on youtu...
what I meant was you can directly use SVC even if you have multiple target classes (dropout, graduate, enroll) because it's baked in already
feral wind
past meteor
You mean, what kind of kernel function?
my dataset is not big i dont think, and i dont really know what kernel is and what i should use
feral wind
jaunty helm
what I meant was you can directly use `SVC` even if you have multiple target cla...
how can i do that
jaunty helm
feral wind
how can i do that
use it like any other estimator? I'm a bit confused by what you mean
i am using svm
are you not using sklearn or something?
feral wind
i am using sklearn
jaunty helm
feral wind
i am using sklearn
well yeah, just use it like any other estimator then
svc = SVC()
svc.fit(train_X, train_y)
svc.predict(test_X)
this is what it showed, idk if i did this correctly or not but i think not, because why it shows 0.0 on the 1 value
 jaunty helm
feral wind
this is what it showed, idk if i did this correctly or not but i think not, beca...
jaunty helm
feral wind
this is what it showed, idk if i did this correctly or not but i think not, beca...
I think that just means it never correctly predicts label 1
maybe something was messed up before fitting
feral wind
jaunty helm
I think that just means it never correctly predicts label 1
maybe something was ...
these are my labels, so theres 3 attributes, does 0 refer to the Target_Dropout, and so on?
 jaunty helm
feral wind
these are my labels, so theres 3 attributes, does 0 refer to the Target_Dropout,...
jaunty helm
feral wind
these are my labels, so theres 3 attributes, does 0 refer to the Target_Dropout,...
probably
feral wind
but what could go wrong then on my model
jaunty helm
feral wind
but what could go wrong then on my model
idk, depends on your processing steps I guess?
feral wind
this is what i use
 spring field
I mean, I managed to get something more interesting with some configuration adju...
spring field
spring field
I mean, I managed to get something more interesting with some configuration adju...
alright, I decided to change my approach a bit, basically give the network some days as input and as the output provide some of the output from the days at the end of the days that are in the input and then some of the output that is from the days after those
x: 1 2 3 4 5
y:     3 4 5 6 7
p:     ? ? ? ? ?
inputs and outputs are of the same dimensions though, which ig could be changed by reconfiguring the model a bit for that
and also I was thinking that maybe a (proper, not two chained RNN cells like I have now) DRNN would also help, but yeah... this is the best I got, I suppose this approach at least can reasonably well predict those few days after the given ones, but yeah, maybe it's a lack of data and/or network depth, I don't know, I just know that an RNN-type network is probably the way to go, I think
 past meteor
feral wind
my dataset is not big i dont think, and i dont really know what kernel is and wh...
past meteor
feral wind
my dataset is not big i dont think, and i dont really know what kernel is and wh...
Try both. Split off a bit of data, cross validate on the larger part, select the best model and then that's the winner.
Support vector machines are also quite sensitive to their hyperparameters so you may want to tune them.
past meteor
spring field
alright, I decided to change my approach a bit, basically give the network some ...
What are you doing? I'm quite curious, can you give me a TL;DR?
deep veldt
What are the differences between a Convolution network and Siamese network? i really need the answer
spring field
past meteor
What are you doing? I'm quite curious, can you give me a TL;DR?
sure, I can't provide much details on the dataset, but basically it's a couple (3 parameters) environmental factors and there are 2 (but they are linearly correlated, but I still use both) outputs that depend on them (y depends on x, the usual), the ig more relevant bit is that the input data is sequential, say, for example, every 10 minutes there's a measurement of air temperature, wind speed, and water surface temperature and I want to predict the water surface temperature over the next couple days given say today's air temp and wind speeds over the day
I think that's an accurate representation of the actual data... it's just a bunch of continuous data of such measurements
past meteor
deep veldt
What are the differences between a Convolution network and Siamese network? i re...
A siamese network is one where you give the same network 2 or 3 inputs and then you have it either say if they belong to the same class or not or you use triplet loss and the net needs to specify which 2 are from the same category. Siamese networks do something called metric learning.
Now, the idea of Siamese networks is way more general than CNNs. You can have a siamese network that is a CNN. A good example is unlocking phones with face recognition . They typically use some sort of triplet loss. The network used is a Siamese net.
All clear?
deep veldt
past meteor
A siamese network is one where you give *the same* network 2 or 3 inputs and the...
Should i use CNN or siamese?
for image similarity
past meteor
Reread my answer again please 😄
wooden sail
the question doesn't make sense because the two things are not mutually exclusive
past meteor
Now, the idea of Siamese networks is way more general than CNNs. You can have a siamese network that is a CNN.
wooden sail
"siamese" has to do with what you do with the network and how you train it
CNN has to do with architecture
past meteor
deep veldt
Should i use CNN or siamese?
You can make a Siamese network that uses convolutional layers
deep veldt
oh
past meteor
spring field
sure, I can't provide much details on the dataset, but basically it's a couple (...
What I can say is that a lot of time series docs / methods are really about univariate cases where you use lags to predict future values. Multivariate time series is (currently) my line of work 😄
Have you tried "basic" methods so far or did you jump to neural stuff immediately? Traditional methods are quite competetive.
I would 100 % start of by just using ARIMA, exponential smoothing etc. on just your 2 outputs. Another benchmark I always do is saying basically copying the last available datapoint and computing the error based on that
The next thing I'd do is VAR (vector auto regression) since you mention your 2 outputs are correlated
Afterwards I'd start looking into just making lags of my inputs and giving that to a gradient boosted tree and so on
You kind of need benchmarks to make sense of the performance of neural nets and these are quite low hanging fruit imo
deep veldt
past meteor
You can make a Siamese network that uses convolutional layers
so siamese network is basically comparing if both output is the same?
spring field
past meteor
What I can say is that a lot of time series docs / methods are really about univ...
mmm, I jumped to neural stuff immediately (when all you've got is a hammer...), so yeah... good one (on my part 😁)
though I did consider something simpler like linear regression that seemed a tad inadequate for the issue at hand, another idea that came to mind was to use simpler neural nets and I considered a couple approaches, but I saw a couple flaws with data generation using those and overall they don't care about the order anyway, so I had recently learned about RNNs, thus they seemed as the appropriate solution (the hammer analogy), so I tried to fit it as best as I could... using different variants of lag and such, I think the current last approach I took fared the best overall
but alright, I'll keep the more basic methods in mind next time (this was short practice and other than it being interesting to work with RNNs, I don't have particular interest in the data...), now that you have mentioned them I'll probably do a couple practice rounds to at least remember about their existence 😄
I did consider some polynomial fitting, sort of what I assume exponential smoothing does in a way, since the data is quite periodic, so it probably can be approximated using some sin and cos combinations as well, I suppose also that this goes into the territory of weather forecasting a bit which is a whole another topic I guess
 gritty vessel
Hey everyone I have a doubt
I am performing eda
But when I dropped the na values only 22 rows are remaining
So it's does not make sense right to perform further analysis as like original size was some 1lacs × 22columns
I dropped the rows with na and it came down to 22 rows only
past meteor
spring field
mmm, I jumped to neural stuff immediately (when all you've got is a hammer...), ...
If you lag your data models like linear regression could work. If it's periodic it gets trickier as you'll have to make a kind of time variable and compute the cos and sin. If you have interaction effects you'll have to multiply them with this variable or use a kernel like this https://scikit-learn.org/stable/modules/generated/sklearn.kernel_approximation.Nystroem.html. I don't recommend this approach 😅 .
OTOH, tree-based models naturally can deal with periodicity without any preprocessing (just a time column is enough, you don't need to make a cos/sin or interactions) but they cannot fit trend/extrapolate unless you do some ✨ fancy ✨ stuff. If you don't have trend, feel free to just make lags and use xgboost or similar as a benchmark.https://www.sktime.net/en/stable/ implements all the lagging and so on.
There's also exponential smoothing algorithms that can fit seasonality, holt-winters comes to mind. https://www.statsmodels.org/dev/generated/statsmodels.tsa.holtwinters.ExponentialSmoothing.html so you're covered if its periodic. The same for ARIMA, there is SARIMA (the S stands for seasonal) and even SARIMAX (the X stands for exogenous, extra variables). https://www.statsmodels.org/dev/generated/statsmodels.tsa.statespace.sarimax.SARIMAX.html
But yeah, I do get the fact that it's fun to learn how to work with RNNs and so on so if that's the goal then it's no problems at all 🙂 I was like this but training too many neural nets gave me an aversion to them if there's other methods that can work. Mostly because they take way too long to train and have too many hyperparameters. I'm always stuck thinking "is my net bad because I chose the wrong hyperparameters or is this the lower bound on the error?" and there's no way of conclusively answering this question.
If you're going to be trying out many different configurations I recommend using a similar stack as to what I use at work btw:
- https://optuna.org/ for hyperparameter tuning
- https://mlflow.org/ to save your runs/hyperparameters.
They integrate nicely, you need 3 lines of code to have optuna register its runs in mlflow. It's a more "scalable" way to try out different hyperparameters.

Optuna
Optuna is an automatic hyperparameter optimization software framework, particularly designed for machine learning. It features an imperative, define-by-run style user API.
Description will go into a meta tag in
warm trellis
Hey, how can I understand the importance of the features in my dataset? I‘m feeding 8 columns into model and in the end do prediction only for one column
It‘s based on hybrid conv-gru nn model
gritty vessel
warm trellis
Hey, how can I understand the importance of the features in my dataset? I‘m fee...
Explainable AI models like lime shap eli5
spring field
past meteor
If you lag your data models like linear regression could work. If it's periodic ...
I see, thanks a lot for the information and resources, I'll check them out, those tools look wonderful as well 
 strange elbowBOT
Noooooo!!
@spring field, please enable your DMs to receive the bookmark.
spring field
past meteor
If you're going to be trying out many different configurations I recommend using...
.bm
I should use this feature more often
 spark bane
Hello, I have 2+ years experience with Python and wanna learn data science, I need some advice from persons who has experience in this field, i remember some stuff of math from school but need to remember, so my questions is where should i start learning from? and how? i need best way to learn data science when you already know python and don't need to waste time to learn list, tuple and bla bla. maybe you all understand what i need. Thank you!
 karmic zealot
how can I encrypt data if I want to store it
thorn cairn
i think there is something wrong with my embedding, because when im trying to fit it detects nothing?
from sklearn.model_selection import train_test_split,  StratifiedKFold, StratifiedShuffleSplit, KFold

kfold = StratifiedKFold(n_splits=5,shuffle=True,random_state=11)
splits = kfold.split(df,df['headline'])
x_train, x_test, y_train, y_test = train_test_split(df['headline'], df['is_sarcastic'],  test_size=0.30,random_state=3)
# x_train.info()
# Encoding here
encoder = tf.keras.layers.TextVectorization(max_tokens=10000)
encoder.adapt(x_train.map(lambda text: text))

vocabulary = np.array(encoder.get_vocabulary())
# Creating the model
model = tf.keras.Sequential([
    encoder,
    tf.keras.layers.Embedding(
        len(encoder.get_vocabulary()), 64, mask_zero=True),
    tf.keras.layers.Bidirectional(
        tf.keras.layers.LSTM(64, return_sequences=True)),
    tf.keras.layers.Bidirectional(tf.keras.layers.LSTM(32)),
    tf.keras.layers.Dense(64, activation='relu'),
    tf.keras.layers.Dense(1)
])

model.compile(
    loss=tf.keras.losses.BinaryCrossentropy(from_logits=True),
    optimizer=tf.keras.optimizers.Adam(),
    metrics=['accuracy']
)
history = model.fit(
    x_train,
    epochs=5,
    validation_data=x_test
)
it returns this error,
AttributeError: 'NoneType' object has no attribute 'items'
the original code that i copied has something like this on their encoder. But it returns an error too,
encoder.adapt(train_dataset.map(lambda text, _: text))
TypeError: <lambda>() missing 1 required positional argument: '_'
desert oar
@thorn cairn the error AttributeError: 'NoneType' object has no attribute 'items' means what it says: somewhere in your code you tried to access the items attribute of something, but the something was None (an instance of NoneType) and of course there is no None.items attribute. your task now is to figure out where that happened, and what caused something to be None that you expected to be other than None
you need to look at the traceback part of the error output. that should identify precisely where the error happened.
the other error message says that the function lambda text, _: ... was given 1 argument, but expected 2 arguments, so the _ argument is considered missing. "positional" means they were provided like f(x, y) as opposed to "keyword" which would be provided like f(x=x, y=y)
 odd meteor
spring field
sure, I can't provide much details on the dataset, but basically it's a couple (...
odd meteor
spring field
sure, I can't provide much details on the dataset, but basically it's a couple (...
I find this kind of timeseries analysis that's modelled to predict multiple response variables quite interesting. I don't know why it's not as popular as the conventional timeseries analysis with a single response variable. I worked on this kind of task once where y = 36 columns and X was around 663 columns. I tried RNN, ARIMA, SARIMA, XGBoost, LightGBM, and GAM (used pyGAM), and LightGBM produced the best result.
odd meteor
karmic zealot
how can I encrypt data if I want to store it
There's cryptography and then there's differential privacy (doesn't perform encryption though but it's one of the gold standard currently in privacy preserving ML)
odd meteor
spark bane
Hello, I have 2+ years experience with Python and wanna learn data science, I ne...
Perhaps https://kaggle.com/learn , https://course.fast.ai/ or purchasing a course on Coursera/Udacity/DataCamp/Udemy.
If you prefer books, check the pinned messages on this channel for some nice recommendations
Practical data skills you can apply immediately: that's what you'll learn in these no-cost courses. They're the fastest (and most fun) way to become a data scientist or improve your current skills.
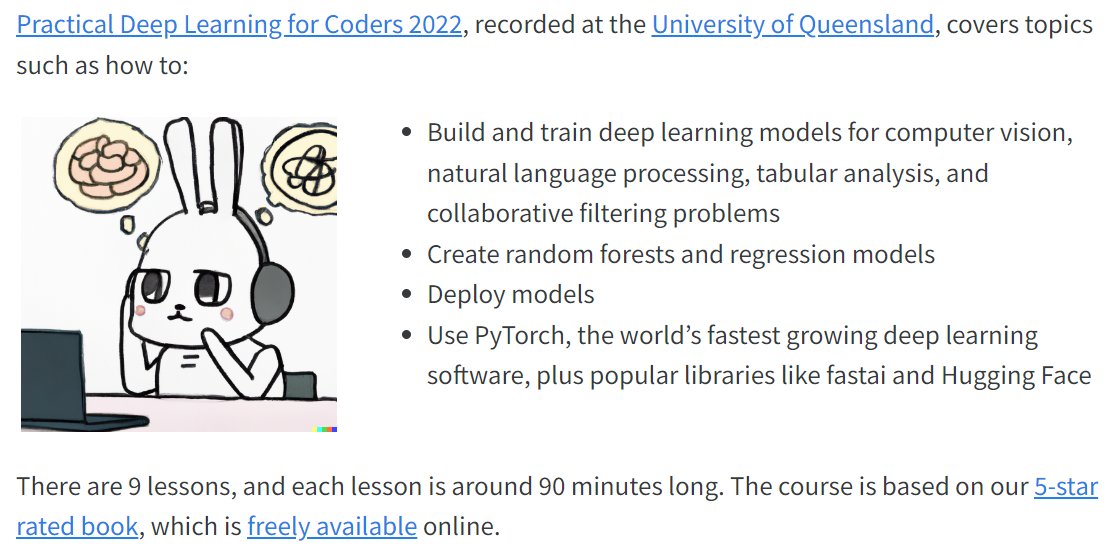
Practical Deep Learning for Coders
A free course designed for people with some coding experience, who want to learn how to apply deep learning and machine learning to practical problems.
 quartz lotus
just a quick question for anyone who has used open CV before but has color conversion to gray scale changed in the past year or so?
grayimg=cv.cvtColor(img,cv.COLOR_BGR2BGRA) vs
grayimg=cv.cvtColor(img,cv.COLOR_BGR2BGRAY)
the bottom is how i'm seeing how it's done from a tutorial from a year ago but that option doesn't exist for me. it's just grayed out in my editor
 agile cobalt
COLOR_BGR2BGRA sounds like Blue Green Red -> Blue Green Red Alpha?
quartz lotus
ah, that might be it then.
agile cobalt
https://docs.opencv.org/3.4/d8/d01/group__imgproc__color__conversions.html
COLOR_BGR2BGRA
Python: cv.COLOR_BGR2BGRA
add alpha channel to RGB or BGR image
quartz lotus
so it is then
agile cobalt
Are you using 3.x or 4.x?
quartz lotus
3.x
agile cobalt
which version exactly
quartz lotus
i think my computer was just throwing me a weird issue i get the option for bgr2gray now
also, i'm on 3.9.6
quartz lotus
4.9.0.80
agile cobalt
Check which version the tutorial you're following uses
major versions (major.minor.patch) frequently contain breaking changes, which means code wrote for 3.x.y will frequently not work for 4.x.y (same for 0.x.y -> 1.x.y -> 2.x.y -> 3.x.y -> ...)
quartz lotus
i'm following a geek for geeks article that doesn't include the version but it was from over a year ago.
I'll keep an eye out for more weird issues like that and report them
agile cobalt
geeks for geeks? I wouldn't be surprised if it never worked then, they have some pretty bad quality things
quartz lotus
do you know of a better place I could learn about open CV?
I'd appreciate it if you did
agile cobalt
.rp opencv
strange elbowBOT
Here are the top 5 results:
Image Segmentation Using Color Spaces in OpenCV + Python
PySimpleGUI: The Simple Way to Create a GUI With Python
Face Detection in Python Using a Webcam
Traditional Face Detection With Python
Fingerprinting Images for Near-Duplicate Detection
Click the links to go to the articles.
agile cobalt
Real Python usually is really good
agile cobalt
agile cobalt
https://docs.opencv.org/3.4/d8/d01/group__imgproc__color__conversions.html
> COL...
looks like 4.9.0 should still have that though, maybe check if you installed and imported things correctly https://docs.opencv.org/4.9.0/d8/d01/group__imgproc__color__conversions.html
 frosty socket
Hi guys, I have this rubik cube, so I figure that the best way to select subcubes wouyld be to put them in a numpy array of shape (3, 3, 3), so I find it easy to find a horizontal slice like that, but is there a way to easiyl select a whole row, column, stage using some kind on numpy syntax ?

like selecting a vertical slice is arr[0]
but how do I simply select a horizontal slice
quartz lotus
agile cobalt
looks like 4.9.0 should still have that though, maybe check if you installed and...
the issue went away after a restart. IDK what caused it but i'm gonna keep a lookout for that and any other issues. Also, thank you for the recommendation
wooden sail
frosty socket
like selecting a vertical slice is arr[0]
arr[0] is the same as arr[0, :, :]. if you wanna pick a whole column you could do arr[:, col, :]
similarly for the other dimension
frosty socket
nvm, chatgpt got me the answer, I suppose the magic thing I was looking for is stage = cube[:, :, stage_index]
ty
yes
I guess the hard part was formulating the question
warm trellis
after adding lstm layer model learns no more, what can be reason?
desert oar
odd meteor
I find this kind of timeseries analysis that's modelled to predict multiple resp...
I suspect "difficulty" correlates inversely with "popularity in blog posts"
I think building a useful multivariate time series model in a real-world project is on the harder end of things
spring field
warm trellis
after adding lstm layer model learns no more, what can be reason?
there could be tons of reasons, like not normalizing the data
odd meteor
desert oar
I suspect "difficulty" correlates inversely with "popularity in blog posts"
Ikr. Even in my undergrad Stats program, multivariate time series wasn't taught. The course was however, reserved for Stats Masters program.
 ashen echo
anybody ever have issue trying to install pandasAI via command prompt, i keep getting this error where its not recognizing MS visual C++, and I have version 14.38 of it installed already
 feral wind
guys how do you do hyperparameter tuning in svm
desert oar
odd meteor
Ikr. Even in my undergrad Stats program, multivariate time series wasn't taught....
it's popular in econometrics, but the use case is more inferential/statistical than predictive
lapis sequoia
All this talk about C/C++, why?
serene scaffold
lapis sequoia
All this talk about C/C++, why?
in this channel, or in the AI/ML discourse in general?
tacit basin
lapis sequoia
All this talk about C/C++, why?
bcs python is slow maybe?
tacit basin
feral wind
guys how do you do hyperparameter tuning in svm
Never tuned svm, but would imagine it is similar to tuning any other supervised ml models?
 sterile heath
Why only one?
past meteor
desert oar
I think building a useful multivariate time series model in a real-world project...
I find multivariate series hard because it could mean anything
Some people mean it to be N univariate series that are correlated, the typical use case for vector auto regression (the stock market etc)). All variables in this case are endogenous. While there's also the ARX/ARIMAX type models that explicitly have exogenous variables.
Both of them are called multivariate but I feel like they should be "split" into endog multivariate and exog multivariate (and the mix) explicitly.
Finally, there's the whole domain of hierarchical time series and reconciliation, hierarchical Bayesian models, shrinkage, pooling, mixed effects modelling 🥴 . Odds are if the time series is multivariate you ought to be looking at a mixed effect model yeah, at least in "typical" use cases like demand forecasting and medical related stuff.
 abstract rune
For instance, consider a company that is interested in conducting a
direct-marketing campaign. The goal is to identify individuals who are
likely to respond positively to a mailing, based on observations of demographic variables measured on each individual. In this case, the demographic variables serve as predictors, and response to the marketing campaign (either positive or negative) serves as the outcome. The company is
not interested in obtaining a deep understanding of the relationships between each individual predictor and the response; instead, the company
simply wants to accurately predict the response using the predictors. This
is an example of modeling for prediction
This is quoted from ISLP, chapter 2.1, page 19 (29 of pdf)
What do we mean by "not interested in obtaining a deep understanding of relationships between each individual predictor and response" ?
Because if we want to find a estimator, which will be a combination of weights vector for each predictor, then we are doing the same thing

 hasty grail
 tender summit
The first line in your screenshot tells you what you need to do
tender summit
hasty grail
The first line in your screenshot tells you what you need to do
i ran pip install chatterbot
on my terminal
but this err
help please
🆘🆘🆘🆘
warm trellis
spring field
there could be tons of reasons, like not normalizing the data
It's really interesting but it's because after conv1d layer output, I needed to change the shape of the values. Like b*m*n to b*n*m
 autumn ruin
tender summit
autumn ruin
tender summit
 spring field
a statistical summary in what regard?
I apologise for the shallow response as ML has been my focus for quite some time and when all you've got is a hammer...
this seems like something that can be solved by a standard feed forward neural network, essentially just a bunch of linear layers, though since you mentioned categorical data, you'll probably want to also have an embedding space though ig at first can just try plain one hot encoding
 trim saddle
tender summit
i ran pip install chatterbot
trim saddle
tender summit
i ran pip install chatterbot
You might need an older python version. The last version is 4 years old
 drowsy sleet
Hi everyone, I am. currently signed up for a Kaggle challenge, as you guys might know we have to use read the csv files provided by Kaggle on their website. My concern is when submitting the notebook will there be an issue in reading the files as the path will be a local path to my device? I know it's a silly question. I ask this because when I refer other notebooks they all have some similar kind of path like shown below
tr = pd.read_csv('/kaggle/input/widsdatathon2023/train_data.csv', parse_dates = ['startdate'])
what's the right way to go about it?
 cedar tusk
anyone here can help me on building my own tokenizer? this will be the first step for me to build my own llm algo
 scarlet owl
what libraries I need to know for machine learning?
buoyant vine
cedar tusk
anyone here can help me on building my own tokenizer? this will be the first ste...
Tokenizers are very difficult to build, is there a reason why you want to create your own VS using a pre-trained type?
scarlet owl
scarlet owl
what libraries I need to know for machine learning?
??
 sly isle
scarlet owl
what libraries I need to know for machine learning?
sly isle
scarlet owl
what libraries I need to know for machine learning?
PyTorch
scarlet owl
only?
cedar tusk
buoyant vine
Tokenizers are very difficult to build, is there a reason why you want to create...
i want to learn
i dont like using blackbox stuff
sly isle
scarlet owl
only?
TensorFlow
buoyant vine
it is not really that they are complicated, it is just a nightmare building the vocab
scarlet owl
can you write all at once?
buoyant vine
my advise is to use Hugging face's tokenizers and you can use your own vocab if you want, or mutate an existing one
at least that way as well it gives a common format since HF tokenizers are basically the standard
cedar tusk
buoyant vine
my advise is to use Hugging face's tokenizers and you can use your own vocab if ...
i am trying to build my own llm, i wont train it
i just want to see how its done
buoyant vine
scarlet owl
only?
Pytorch realistically is enough
cedar tusk
scarlet owl
??
what kind of ml?
scarlet owl
buoyant vine
Pytorch realistically is enough
Ok
agile cobalt
scarlet owl
what libraries I need to know for machine learning?
depends on what exactly you are trying to do
sly isle
You should also become comfortable with Pandas and Numpy as general libraries
scarlet owl
to make algo
cedar tusk
numpy is nice but i would use polars instead of pandas, overall works better. But has less integration since its newer. ur choice
 true stratus
i need a simple easy-to-train image recognition library for training a simple model to detect flags but tensorflow seems complex af
sly isle
cedar tusk
numpy is nice but i would use polars instead of pandas, overall works better. Bu...
So is Polars the new hit?
cedar tusk
sly isle
So is `Polars` the new hit?
its faster and has better syntax, has less integration to other packages such as scikit
as i said
true stratus
true stratus
i need a simple easy-to-train image recognition library for training a simple mo...
anyone knows any libraries for that?
cedar tusk
true stratus
i need a simple easy-to-train image recognition library for training a simple mo...
just use a pretrained huggingface model for "getting shit done"
true stratus
nah i wanna train my own
cedar tusk
no need to get fancy
true stratus
i need accuracy
cedar tusk
u can fine tune the model with ur own dataset
true stratus
cedar tusk
u can fine tune the model with ur own dataset
how? is it complex?
 true stratus
ok thanks
 arctic silo
what are your opinion about datacamp
cedar tusk
arctic silo
what are your opinion about datacamp
not worth
it holds your hand too much
arctic silo
why??
spring field
cedar tusk
https://huggingface.co/docs/transformers/en/training
can people stop using "state-of-the-art" for describing every single advancement in every single direction 😐
arctic silo
so what's you recommand
cedar tusk
spring field
can people stop using "state-of-the-art" for describing every single advancement...
what
cedar tusk
arctic silo
so what's you recommand
just learn from doing
writing 1 line of code is better than writing 100 lines of code that u got from youtube or anywhere else
spring field
cedar tusk
what
 arctic silo
but you need courses to learn the principle
cedar tusk
spring field
hahaha, yea
cedar tusk
arctic silo
but you need courses to learn the principle
no, you need research to learn the principle
what do you want to learn?
cedar tusk
spring field
can people stop using "state-of-the-art" for describing every single advancement...
i mean its "state of the art" if its the latest advancement made : P
arctic silo
data science
cedar tusk
arctic silo
data science
lol, data science is too broad of a term to just "learn"
do you want to learn basic analysis, databases, probability, statistics, basic computer knowledge, servers
u gotta select a topic first to learn
arctic silo
no I mean machine learning because I know statistic probalbility and data analysis because I'm CS student
cedar tusk
data science is not a topic, its a whole fucking science branch
arctic silo
I hand some exp with python and its package like numpy,seaborn,pandas
cedar tusk
ok, let me tell u what u need to do.
implement every big machine learning model by hand in python
such as, linear/logistic regression, support vector machines, dbscan, kneighbours
then, learn their intricacies
such as R^2 for regression, l1 and l2 optimizations, hypothesis testing to see if a variable is important etc
arctic silo
I've implementd only linear regression ,
after learning this stuff what should I do ?
cedar tusk
do this stuf first, then you can start with deep learning mathematics
after that comes the implementation
arctic silo
ok thank yu so what do you do ?
 prime hill
Hi
cedar tusk
wassup
arctic silo
in which university ?
prime hill
Hello friends
I want useful tools to use in the Python language for information
I am a beginner 😬
cedar tusk
arctic silo
in which university ?
tu dortmund
cedar tusk
prime hill
Hello friends
I want useful tools to use in the Python language for information
...
define information
data handling and visualization?
prime hill
cedar tusk
define information
How do I learn it or how do I use it?
jaunty helm
sly isle
So is `Polars` the new hit?
takes a bit to get used to, but imo feels pretty nice
integration is definitely worse than pandas currently
e.g. right now there's a bug with scikit-learn that
X: pl.DataFrame
y: pl.Series
train_X, test_X, train_y, test_y = train_test_split(X, y)  # not just train_test_split but that's the one I can rmb rn
```will error
in this case it's easy to get around though (use `y.to_numpy()`)u want to learn python?
prime hill
I'm such a beginner that I don't understand what you're saying
prime hill
cedar tusk
u want to learn python?
Yes
cedar tusk
no prob, just go watch a 30min tutorial on basic python
then try coding stuf, i myself used this page for questions to work on https://www.practicepython.org/
prime hill
cedar tusk
no prob, just go watch a 30min tutorial on basic python
Fine, thank you 🤍
cedar tusk
after watching that 30 min video dont ever watch another youtube video, just google stuff
jaunty helm
!res
arctic wedgeBOT
Resources
The Resources page on our website contains a list of hand-selected learning resources that we regularly recommend to both beginners and experts.
cedar tusk
if u search for the information urself it stays with you
cedar tusk
arctic wedge
this page is too cluttered, need to be more simple and easy to access
is there a way we can work on the page ourselves?
prime hill
cedar tusk
after watching that 30 min video dont ever watch another youtube video, just goo...
I will watch the video and then try what I learned
spring field
cedar tusk
is there a way we can work on the page ourselves?
you can probably open an issue or submit a PR if you wish https://github.com/python-discord/site
can probably also ask in #dev-contrib ig
cedar tusk
this way i can learn git as well, its an area im very lacking
if ur doing statistical analysis u gotta do it properly
i dont think its exaggerated
u just want to see the means and medians?
spring field
I would disagree with that analogy because usually you'd hunt rabbits because of their meat, thus using an explosive weapon would have greatly diminishing returns, however, using a powerful solution to a simple problem like in this case is not unlikely to have fantastic results and in the end, the issue would get tackled either way, not unlike when hunting a rabbit using an explosive weapon vs a regular hunting weapon, in the latter case you at least get a rabbit, in the former, well, you get no results... except for an explosion ig. now, if we say use an analogy like swatting flies, then it makes much more sense, you can swat a fly using a flyswatter, you can swat one using a nuclear weapon, if we focus specifically on eliminating them flies, then both approaches achieve the same result, though the nuclear weapon likely has greater range than a flyswatter
this can also be described in a single word: overkill
cedar tusk
this needs hypothesis testing
xD
if not overly obvious
well, what u can do is go to this website and follow the same steps https://www.sthda.com/english/wiki/comparing-means-in-r
its in r tho
spring field
I don't know about "basic" here, if you have tons of parameters, it'll get increasingly difficult to manually correlate them all as opposed to letting a neural netowrk figure it out on its own
cedar tusk
u can use https://docs.scipy.org/doc/scipy/reference/generated/scipy.stats.normaltest.html for normality test in python
cedar tusk
spring field
I don't know about "basic" here, if you have tons of parameters, it'll get incre...
cut him some slack, he is trying to get shit done xd
he could just go to chatgpt and do something very wrong in the process and call it good
but he came here for councelling
btw read the documentation for every function u are using, there may be cases where the function may not work
for ex the sample size is a very important factor for normal tests
jaunty helm
if you're "just looking" then there are indeed many stats you can look at like correlation, anova(for numerical-categorical), chi2 (categorical-categorical), PCA, etc.
though do be careful when deciding how you interpret these numbers
 random torrent
Hello, I have a series of pyplots of 2d arrays, how do I combine them into an mp4? I only see tutorials on function plot mp4, but not 2d arrays
cedar tusk
random torrent
Hello, I have a series of pyplots of 2d arrays, how do I combine them into an mp...
mp4 as in a video?
random torrent
yes
random torrent
i have like a million of them
spring field
better get going then
cedar tusk
u are trying to animate?
random torrent
yea, I am trying to use the AnimationArtist but not sure how
cedar tusk
are the plots matplotlib or plotly
random torrent
matplotlib
spring field
do all of those images even fit in your ram?
cedar tusk

This video shows how to make mp4 and gif (movie) files out of figures in python using matplotlib. Maximize your data visualization impact using matplotlib animation when doing data science.
FFMpeg can be downloaded here if you need it:
https://www.ffmpeg.org/download.html
The github repo can be found here for all the examples mentioned:
https:...
just watch this and apply
spring field
now, this might not be the most efficient approach, but if you have those image files, you could use sth like ffmpeg to do this: https://stackoverflow.com/a/37478183/14531062
I mean, ffmpeg is efficient, but if you first need to convert from arrays to images on disk, then that's gonna take a bit
random torrent
cedar tusk
https://www.youtube.com/watch?v=bNbN9yoEOdU
Interesing that he uses ffmpegwriter, I wonder what's the difference between it and AnimationArtist
cedar tusk
random torrent
Interesing that he uses ffmpegwriter, I wonder what's the difference between it ...
u can try finding a video with that too, i just looked at the end result and matplotlib to come up with a vid
spring field
random torrent
Interesing that he uses ffmpegwriter, I wonder what's the difference between it ...
ArtistAnimation deals with matplotlib objects during runtime, it's probably most useful for like interactive plots and such, ffmpegwrite would be used if you wanted to create an mp4 file as the guy in the video explains
random torrent
This is confusing
I don't know how to get it work for 2d arrays
I cannot find a suitable function to update the plot
nevermind
I got it working
random torrent
nono, the writer.saving takes an updating Figure object, so I created a subplot inside the figure and keep plotting a new subplot in a for loop
It should also work by calling writer.saving in a for loop and give it a new figure every loop, but it feels like a bad idea to keep locking and unlocking the file frequently
Thanks anyways
 pale thunder
Does anyone know a working tutorial for CUDA+tensorflow on Ubuntu given a Quadro T1000 mobile? Trying to help a friend.
cedar tusk
pale thunder
Does anyone know a working tutorial for CUDA+tensorflow on Ubuntu given a Quadro...
last time i tried doing it it was a nightmare
good luck
 formal mauve
Whats ternding in this field atm? Anyone have any good idea
cedar tusk
formal mauve
Whats ternding in this field atm? Anyone have any good idea
build your own llm
formal mauve
cedar tusk
build your own llm
llm?
cedar tusk
its a good challenge im doing it now
formal mauve
Gotcha. Yeah that would be interesting.
Im trying to figure out what I could build that could be a beneficial service/tool for people. But theres just so much out there, I dont know what I want to focus on.
cedar tusk
well thats a hard question
formal mauve
cedar tusk
well thats a hard question
Yes it is indeed.
 brisk vapor
We do not permit job seeking posts in this server.
 kind loom
brisk vapor
We do not permit job seeking posts in this server.
kind loom
brisk vapor
We do not permit job seeking posts in this server.
My bad
I’m sorry
 livid sphinx
Hey there, I was wondering, where should I start to learn python for Data analytics
 left tartan
livid sphinx
Hey there, I was wondering, where should I start to learn python for Data analyt...
left tartan
livid sphinx
Hey there, I was wondering, where should I start to learn python for Data analyt...
Do you already know Python? If so, Kaggle.con/learn is a good starter
livid sphinx
left tartan
Do you already know Python? If so, Kaggle.con/learn is a good starter
I know the basics basics, thank you
 abstract wasp
Can anyone explain to me their interview process after getting a job in data science/ml? Plsss, I need help ;-;
left tartan
abstract wasp
Can anyone explain to me their interview process after getting a job in data sci...
#career-advice might be a better place for this q
lapis sequoia
Hello guys,
I'm a full stack web developer and i want to enhance my skills so I'm thinking to get into data science, as a web developer is it really beneficial for me to get into data science?if yes then how(please elaborate)?
As I have still 1.5 years to complete my degree is it beneficial to give this time by learning data science?
With "data scientist + web developer" do I provide value to the marketplace than a "only web developer" (also in future)??
If learning data science with web development is bad idea then you can also suggest me some other thing to learn instead of data science with web dev.
Any suggestions would be appreciated.
Thank You
lapis sequoia
What “certifications” needed? Have a degree in Data Science, don’t feel a masters is necessary. What else do I need?
serene scaffold
lapis sequoia
What “certifications” needed? Have a degree in Data Science, don’t feel a master...
There are no certificates that matter for careers in data science. Have you been applying to jobs and not getting any response?
serene scaffold
lapis sequoia
Hello guys,
I'm a full stack web developer and i want to enhance my skills so I...
There's a lot of data science hype, so unless you can do an internship where you're primarily doing data science (and not primarily web development) or take all the AI/data science courses that your degree program offers, I don't think prospective employers will believe that your purported data science skills will be valuable to them.
gritty vessel
Hey guys does anyone know about data papers?
I have created an ai-ready Data
And I want to publish it
I found the resources what is data paper
But I can't find any data papers that I can refer to
 solemn verge
hey I am just wondering can I write programs with pip after I installed conda and activated the environment? I do have pip installed (on Linux, came out the box)
wooden sail
solemn verge
hey I am just wondering can I write programs with pip after I installed conda an...
what do you mean by "write programs with pip"
deep veldt
what is the difference between a matrix and a tensor?
wooden sail
if you wanna be precise, a matrix is simply a rectangular table of numbers
if that table of numbers represents a linear or multilinear transformation, you can also call it a tensor
if not, but you have some binary operation for it with other matrices and a scalar operation, matrices can also be vectors
the difference depends on what you do with the matrix. if you use it as a function that transforms other vectors, the matrix is also a tensor
solemn verge
wooden sail
what do you mean by "write programs with pip"
well after activating conda now my terminal says (base) name@pop-os I want to write an automation script that basically takes 2 arguments and just a basic task. I wanted to know how I'd know if pip or conda is being used to write this. Meaning let's say I upload this to github and then clone the repo to use on a computer that does not have conda. Meaning if i open vscode now and begin writing this, would it use packages from pip?
wooden sail
you want to automate the installation of requirements/setup of a project?
you could do it either with conda or with pip. conda requires that the user has installed conda. pip already comes with python (though you never want to use the system python directly, you can ruin your OS)
deep veldt
wooden sail
the difference depends on what you do with the matrix. if you use it as a functi...
What do you mean by the "transforms other vectors" part? can i get an example
wooden sail
deep veldt
What do you mean by the "transforms other vectors" part? can i get an example
matrix multiplication
if you multiply a vector with a matrix, you get a new vector. this vector is a "transformed" version of the original vector
e.g. if you multiply a vector by a rotation matrix, you get a rotated version of the original vector
the matrix is transforming the vector
(matrices represent linear transformations in this context)
deep veldt
wooden sail
if not, but you have some binary operation for it with other matrices and a scal...
but matrices are 2d array meanwhile vectors are 1d, how can matrices be vectors tho?
wooden sail
vectors are not 1d arrays
vectors are any element of a set that satisfies the 8 axioms of a vector space
for finite dimensional vector spaces you can choose a basis and represent vectors as 1d arrays, but this is secondary because in many cases there are infinitely many suitable bases, and so the 1d array representation is not unique
orchid forge
Does anyone know how to use selenium in python?
I've been watching videos for it, but if anyone has some kinda developers documents for it, please do recommend
deep veldt
orchid forge
I've been watching videos for it, but if anyone has some kinda developers docume...

Selenium
Selenium is an umbrella project for a range of tools and libraries that enable and support the automation of web browsers.
It provides extensions to emulate user interaction with browsers, a distribution server for scaling browser allocation, and the infrastructure for implementations of the W3C WebDriver specification that lets you write interc...
orchid forge
@deep veldt
Do you use selenium?
deep veldt
orchid forge
<@937926761121988668>
Do you use selenium?
yes
 dense smelt
Hey Everybody! Hope y'all Doing Good
I've been creating dash apps through Plotly
a python interactive visualisation tool
and having some errors to solve
need real help
- The data is being loaded from aws and is not the desired data
- callback error updating ( SchemaTypeValidationError )
if somebody likes to solve it please DM / ask for it
I will post you the full traceback
orchid forge
orchid forge
You scrape web with that ?
@deep veldt
trim saddle
dense smelt
Hey Everybody! Hope y'all Doing Good
I've been creating dash apps through Plotly...
1.: If its not the desired data, than I guess your data source or way of loading the data is not correct?
2.: That is not enough information to help debugging it, do you have the full traceback
In general, just post the info here, I doubt ppl want to go more into DM stuff...
dense smelt
Nope! we are retrieving data through a defined function, based on Id and port
the query is retrieved
the main issue here is the callback! not the data basically
 silver linden
Hello guys can anybody help for my university project?
 atomic shore
silver linden
Hello guys can anybody help for my university project?
atomic shore
silver linden
Hello guys can anybody help for my university project?
Ask away, you'll have higher chance of getting answer by just asking it. Anyone who knows/is willing to, will help. (Also check out #❓|how-to-get-help)
silver linden
I see okay thanks
deep veldt
orchid forge
<@937926761121988668>
yes
 dull flare
anyone familiar with tensorflow? Im trying to run a model on my local machine containing CUDA GPU, but its automatically getting trained on CPU and thats freaking slow. Can someone help me how can I select GPU mode to train my model
cedar tusk
dull flare
anyone familiar with tensorflow? Im trying to run a model on my local machine co...
tf.config.list_physical_devices('GPU')
run this and see what pops up
cedar tusk
dull flare
anyone familiar with tensorflow? Im trying to run a model on my local machine co...
btw what is ur gpu?
hasty grail
dull flare
anyone familiar with tensorflow? Im trying to run a model on my local machine co...
if you're on windows, you'll need to use WSL2 for newer versions of tensorflow: https://www.tensorflow.org/install/pip#windows-native

TensorFlow
dull flare
cedar tusk
`tf.config.list_physical_devices('GPU')`
run this and see what pops up
im on windows so GPU is not supported unfortunately
dull flare
cedar tusk
btw what is ur gpu?
very old one rtx 3050ti
cedar tusk
dull flare
im on windows so GPU is not supported unfortunately
that is wrong
i installed tf for windows on gpu before
it was a big hussle but its possible
dull flare
after tf 2.0 its not supported
cedar tusk
bro just use torch
dull flare
hasty grail
if you're on windows, you'll need to use WSL2 for newer versions of tensorflow: ...
@cedar tusk check this out
cedar tusk
its better anyways
dull flare
whats with that smile 💀
cedar tusk
it sounded funny is all
dull flare
really how so :0
cedar tusk
arc as in chapter
cedar tusk
so you have begun a new chapter which is like a boss of some sorts
dull flare
i get ya lol
odd meteor
gritty vessel
Hey guys does anyone know about data papers?
Our 2020 EMNLP paper is a data paper. https://aclanthology.org/2020.findings-emnlp.195/
I'll also add Prof. Ignatius' brilliant work in creating a data for benchmarking Igbo-English Machine Translation task. https://arxiv.org/abs/2004.00648

ACL Anthology
Wilhelmina Nekoto, Vukosi Marivate, Tshinondiwa Matsila, Timi Fasubaa, Taiwo Fagbohungbe, Solomon Oluwole Akinola, Shamsuddeen Muhammad, Salomon Kabongo Kabenamualu, Salomey Osei, Freshia Sackey, Rubungo Andre Niyongabo, Ricky Macharm, Perez Ogayo, Orevaoghene Ahia, Musie Meressa Berhe, Mofetoluwa Adeyemi, Masabata Mokgesi-Selinga, Lawrence Okeg...

arXiv.org
Although researchers and practitioners are pushing the boundaries and enhancing the capacities of NLP tools and methods, works on African languages are lagging. A lot of focus on well resourced languages such as English, Japanese, German, French, Russian, Mandarin Chinese etc. Over 97% of the world's 7000 languages, including African languages, ...
gritty vessel
odd meteor
Our 2020 EMNLP paper is a data paper. https://aclanthology.org/2020.findings-emn...
Thank you @odd meteor I found few templates of data paper but reading a published work makes it easier to proceed further
lapis sequoia
serene scaffold
There are no certificates that matter for careers in data science. Have you been...
No, I have a job. I just remember some dude said something and I was like “who cares”?
lapis sequoia
Rough take: this 'Data Science trend' is starting to feel like 2016 crypto. Most people do not need to ever use anything beyond matplotlib, pandas, sklearn, statsmodels, ect. Most people, especially if they are not engineers, do not need to know any form of deep learning at all. I remember one 'Data Science' discord server was talking about linear algebra, like it was so important. I am not saying it is not important, but it is a undergrad math class and they are acting so incredibly pretentious about something I took when I was 19 and I would bet all of the money in the world that they never even took that class. Like, I do not know, a lot of people do this all of the time and are not good, do it for money, or they do it because they think it will make them a insane amount of money. IT WILL NOT MAKE YOU A INSANE AMOUNT OF MONEY. There are people who are terrible who get paid well do to LinkedIn connections and do nothing. People need to apply 'Data Science' to things that are not total nonense and serves some sort of purpose.
silver linden
guys can anybody check #1035199133436354600 channel
craggy agate
Switching from Tensorflow to Pytorch, any advice?
left tartan
lapis sequoia
Rough take: this 'Data Science trend' is starting to feel like 2016 crypto. Most...
Classic hype cycle, perhaps, https://en.m.wikipedia.org/wiki/Gartner_hype_cycle
lapis sequoia
@left tartan is this becoming a hype train? I see people who follow 120,000 people and act like GitHub is Instagram and post like a ridiculous amount of stuff to their repositories. It seems like this is indeed a hype train for whatever reason.
Feels like the 2000s hip hop era when rappers made 10,000,000 mixtapes filled with just garbage. This is starting to look like a hustle, not like the gold mine, but the Data Mine. Oh lord.
lapis sequoia
craggy agate
Switching from Tensorflow to Pytorch, any advice?
Yeah, just stop. Quit. Go get a job.
 ivory quarry
lapis sequoia
<@738234281146712084> is this becoming a hype train? I see people who follow 120...
ivory quarry
lapis sequoia
<@738234281146712084> is this becoming a hype train? I see people who follow 120...
people just wanna attach ai to anything nowadays in most cases and hope they have found a gold mine
 neon island
lapis sequoia
Rough take: this 'Data Science trend' is starting to feel like 2016 crypto. Most...
neon island
lapis sequoia
Rough take: this 'Data Science trend' is starting to feel like 2016 crypto. Most...
I agree with your final statement, "People need to apply 'Data Science' to things that are not total nonense and serves some sort of purpose."
Yet observe that linear algebra is first taught to youngsters as the Number Line and Subtraction in primary school. The introductory course in linear algebra given to most undergrads is about as rudimentary and as far removed from most applied linear algebra as a grade-schooler who can add and subtract on a number line is from that introductory undergrad math course. 😉
I've taken that course, numerical linear algebra, and I'd add a year of abstract algebra, but I am only a beginner tbh. It may be less pretentiousness, and more just a sign that math underpins challenging work that serves some sort of purpose.
left tartan
lapis sequoia
Yeah, just stop. Quit. Go get a job.
That doesn't seem very helpful or constructive. Regardless of your feelings on the topic, this channel and server should be a positive place.
left tartan
lapis sequoia
<@738234281146712084> is this becoming a hype train? I see people who follow 120...
Sticking to just the ML part; sure, ML is certainly in the hype phase, but real problems are being solved with it and it's made great advances in a short period of time. The shape of the hype curve feels very different than blockchain, where it was unclear whether it would be useful for broader applications besides crypto
hollow escarp
Hi, im currently working on deploying my license plate recognition system to for production usage, im usinng onnxruntime for that. And im wondering if using dockers for deploying application to raspberry pi is good solution, or it's not neccesserly needed. I know that making images with cuda runtime takes a lot of space ( like 3gb for just nvidia cuda img ) + my requirments gives me like 6gb of just docker img. So I'm figuring out if I should be deploying docker imgs or just my code and make necessary installation on my device side ?
hollow escarp
hollow escarp
Hi, im currently working on deploying my license plate recognition system to for...
Also if not docker what alternatives do you suggest?
 versed cobalt
.cmds
left tartan
hollow escarp
Hi, im currently working on deploying my license plate recognition system to for...
I think a lot of this probably has to do with your bottlenecks/performance profile. Can a pi actually run this workload?
hollow escarp
left tartan
I think a lot of this probably has to do with your bottlenecks/performance profi...
I think ye, there is even a guide in onnxruntime dedicated to raspberry pi
But my bigger issue is the size of docker imgs
Because im using mender as my OTA Updates service
And handling such big files results in errors which indicated that i need to have more ram to perfome such tasks, and ofcourse i can buy instead of 2GB controler 8 GB but Im thiking About other ways to do that
past meteor
hollow escarp
But my bigger issue is the size of docker imgs
If you're worried about the size of your images you should look into using alpine linux as your base image. On top of that, you should likely use multi step builds so you only have what is strictly necessary and nothing more in your final image.
That said, they'll probably be pretty beefy either way.
toxic mortar
i got ~5,6 % worse results with XGB than my neural net
XGB took me 20mins to set up, neural nets 2 weeks
past meteor
did you hyperparam tune xgb?
Maybe if you tune it to the extent you did your network you'll have the same results
toxic mortar
past meteor
did you hyperparam tune xgb?
gridsearch
toxic mortar
how sparse are u aiming for to be
past meteor
You might as well run that in a "line" and only do that hyperparameter
And not considering other ones
toxic mortar
param_grid = {
    'xgbclassifier__n_estimators': [50, 100, 200, 300, 400],
    'xgbclassifier__max_depth': [1, 3, 5, 7, 9],
    'xgbclassifier__learning_rate': [0.01, 0.1, 0.2],
    'xgbclassifier__subsample': [0.5, 0.7, 0.8, 0.9, 1,0],
    'xgbclassifier__colsample_bytree': [0.5, 0.7, 0.8, 0.9, 1.0]
}
Okay Imma try more fine-grain n_est, with 25 step [100,400] and remove min max values for rest
toxic mortar
why not? I always preffer grid if I have enough computation resources
past meteor
Because some hyperparameters are 100 % uninformative
If you grid search you waste compute by spending time on them
I think random -> grid is a good one
toxic mortar
Ye thats intresting take I always thought gs is more thorough one tbh cuz u get to try throughout whole range different sol
but i get what u mean
ill try
cedar tusk
yea ml models being a black box is hardly good for the industry but what can you do? they work most of the time
past meteor
toxic mortar
Ye thats intresting take I always thought gs is more thorough one tbh cuz u get ...
Idk if sklearn gives you this output allready but if you tune with optuna the dashboard gives you hyperparameter importance
toxic mortar
past meteor
Idk if sklearn gives you this output allready but if you tune with optuna the da...
I dont know about hyperparam but I know about shap and input features influence, which is cool
thorn cairn
what alternative is there for comparing paired data? i tried stats.ttest_rel but i have a different length of data
cedar tusk
thorn cairn
what alternative is there for comparing paired data? i tried stats.ttest_rel but...
different lenght paired data?
they are not paired then
thorn cairn
hmm how do i explain this
cedar tusk
paired ttest looks at the differences between paired occurances
if they are of different lenght than that cannot be done
thorn cairn
i gave out a survey that asks in what semester did they borrow a spesific genre of book, and the table looks a bit like this

i just split the records so that they have an atomic value
so the hypothesis is, is there an increase of book borrower after their first year?
doesnt that qualify as a ttest_rel?
hollow escarp
past meteor
If you're worried about the size of your images you should look into using alpin...
Im doing that already, but onnx , opencv etc also require a bit of additional space and extra tools
Which are like 2gb
- nvidia gpu thats also 2gb
So thats why im wondering whats the best way to deploy apps using some trained models to "field devices"
Or how do you deploy generally apps which uses object detection
https://onnxruntime.ai/docs/tutorials/iot-edge/rasp-pi-cv.html#prerequisites and also onnxruntime supports raspberry pi so im thinking about deploying source code and downloading necessary stuff on device side and than just running the main script
 thorn cairn
cedar tusk
all the semesters they borrowed the book?
thorn cairn
cedar tusk
all the semesters they borrowed the book?
yes
or should i split it like this,
translation: Semester borrowed, semester not borrowed

honestly idk what im doing 🔥
cedar tusk
thorn cairn
honestly idk what im doing 🔥
yes i can see that xD
cedar tusk
what i would do is do the test for each semester on its own
to see if there was semesters that was different from each other
 vernal phoenix
Hello everyone, I'm currently working on a python q-learning project in the context of pac man. I'm still a bit weak in programming and wondering if someone could help out
cedar tusk
thorn cairn
honestly im cooked for tmr, its alright
begin with making dummy variables to check when a book is taken on a semester
then do anova to see if the means differ
cedar tusk
vernal phoenix
Hello everyone, I'm currently working on a python q-learning project in the cont...
ask away
vernal phoenix
Thanks
I don't want to dump in a bunch of code in here
So I'll give the context for you
I've recreated the pacman game on python using the pygame module
But my project is more centered around developing an A.I which learns through reinforcement learning (Q-learning)
cedar tusk
and now you are trying to code in the behaviour of the ghosts?
vernal phoenix
No the ghosts are fine
It's actually coding in an A.I pacman where I'm struggling
vernal phoenix
Yea
Well whenever I've implemented my q-learning the pacman takes the inputs and moves around just fine
However, the A.I doesn't seem to actualyl improve at the game at all
cedar tusk
have u given it enough iterations?
vernal phoenix
I'm questioning myself about it honestly
I can't tell if it needs more iterations or if my implementation is weak
vernal phoenix
Nothing apparent which makes me believe something wrong
Slightly for paramters, My epsilon starts at 0.9 and decreases to 0.1 after about 200 something iterations
My alpha is at 0.1 and gamma is 0.9, I've tried using alpha 0.15 and gamma 0.85
cedar tusk
https://paste.pythondiscord.com/
paste ur code here and send it to me
i want to take a look
vernal phoenix
Alright, some of the code is a bit long so there might be some fluff here and there
Send it via dm's correct?
cedar tusk
yea
craggy agate
lapis sequoia
Yeah, just stop. Quit. Go get a job.
Wdym quit?
Switching from Tensorflow to Pytorch, any advice?
serene scaffold
craggy agate
Switching from Tensorflow to Pytorch, any advice?
welcome to the winning team
soon you'll be tired of winning.
craggy agate
serene scaffold
welcome to the winning team
Lmao what are these troll answers haha. Another guy said quit and get a job and you are welcoming me to the winning team?
Lol
spring field
I mean, torch do be way cooler than tf
that other guy clearly doesn't like the hype 😁
craggy agate
Anything that I should be aware about?
craggy agate
spring field
that other guy clearly doesn't like the hype 😁
🗣️🔥🔥They hate us cause they can't be us 😤
😂
iron basalt
craggy agate
Anything that I should be aware about?
In theory TF is better, but it's a Google project...
craggy agate
iron basalt
In theory TF is better, but it's a Google project...
Yes, but the industry is shifting to Pytorch tho.
spring field
craggy agate
Anything that I should be aware about?
ummm, activation functions are separate from layers, loss functions are separate from optimizers, stuff like that would be one difference that I have noticed I guess
craggy agate
+I can use my Mac gpu with Pytorch
iron basalt
craggy agate
Yes, but the industry is shifting to Pytorch tho.
Yes, because Google projects are all sinking ships.
craggy agate
iron basalt
Yes, because Google projects are all sinking ships.
So in theory that makes TF worse?
iron basalt
They have high upfront effort, and then are abandoned (due to internal company reward system).
craggy agate
spring field
ummm, activation functions are separate from layers, loss functions are separate...
So mainly syntax difference?
spring field
sort of I guess, pytorch also allows for greater freedom afaik
craggy agate
spring field
sort of I guess, pytorch also allows for greater freedom afaik
I see
iron basalt
craggy agate
So in theory that makes TF worse?
TF can in theory compile all the shaders together into a nice fast one via its compute graph, but in practice it does not do that, and TF kept breaking a lot of stuff with new versions. Pretty much all old papers that used it are dead and can't be reproduced without large amounts of painful work.
Torch on the other hand, still works.
spring field
spring field
sort of I guess, pytorch also allows for greater freedom afaik
in that you can like implement whatever you want, it's basically numpy, but can run on the GPU (so, sort of like cupy), but it also handles the differentiation for you and such
and ofc, they're much better with backwards compat
craggy agate
spring field
in that you can like implement whatever you want, it's basically numpy, but can ...
GPU is one of the main reasons I am switching.
craggy agate
iron basalt
TF can in theory compile all the shaders together into a nice fast one via its c...
Yeah ig that's true
iron basalt
Torch does have a bunch of extra tools for when you need even more speed though, so after experimentation you can lock it in, and optimize it further.
TF was just suppose to do that by default / be built in / all work on the compute graph, but never really got there.
Putting in a ton of effort into that when all the models were changing so quickly was a waste. Better to optimize after and instead have better iteration speed.
(But really the main issue is that Google projects are all sinking ships, so not a great idea to build everything on)
wooden sail
spring field
in that you can like implement whatever you want, it's basically numpy, but can ...
lemme introduce you to jax real quick https://jax.readthedocs.io/en/latest/index.html literally numpy with jit and autodiff
spring field
I think zestar already recommended me to take a look at it, but thanks anyway 😄 I will check it out eventually
odd meteor
craggy agate
Switching from Tensorflow to Pytorch, any advice?
Just Do It 🚀
craggy agate
Agreed
hollow escarp
hollow escarp
https://onnxruntime.ai/docs/tutorials/iot-edge/rasp-pi-cv.html#prerequisites and...
If anyone has some expirience with deploying object detecion system to devices like raspberry pi ( including OTA updates for software) Would be cool if they could share details how they solve problem of deploying such software for production usage.
 warped ocean
am i allowed to post youtube links when asking for help? im trying to follow along in a tutorial that's about a year old and am trying to copy their environment setup, but the newer python version setup has some visual differences that are a bit confusing
cedar tusk
warped ocean
am i allowed to post youtube links when asking for help? im trying to follow alo...
dm me
craggy agate
cedar tusk
dm me
ok thanks, will do
 austere hemlock
does anybody here do t levels course
cus i really need help asap
and the esp is soo close
starts tommorow
desert oar
warped ocean
am i allowed to post youtube links when asking for help? im trying to follow alo...
Yes you can. But note that this server has a low opinion of YT tutorials and you might get non-YT suggestions for alternative resources
 wary vortex
Guys, what are the possible reasons that my lstm model is not learning (the prediction is always 0). It is a binary text classification model.
spring field
wary vortex
Guys, what are the possible reasons that my lstm model is not learning (the pred...
maybe the text is not encoded in an embedding space and you're training on indices instead
maybe you haven't accounted for a dataset imbalance or have over/underestimated it and thus put a ton more weight on one category compared to the other
idk, could be a lot of reasons, we'd need more information from you, such as the code if possible, what library you're using for this, idk, some diagrams if relevant and such
wary vortex
spring field
maybe the text is not encoded in an embedding space and you're training on indic...
They are encoded and embedded. It is 6 to 4(classes) and it is shuffled. this is the code for model and training:
https://pastebin.com/neQeEyZK
Pastebin
Pastebin.com is the number one paste tool since 2002. Pastebin is a website where you can store text online for a set period of time.
spring field
I might be mistaken but 6 to 4 categories don't seem to quite classify (pun intended?) as binary (2) classification, maybe I'm just misunderstanding something
wary vortex
spring field
I might be mistaken but 6 to 4 categories don't seem to quite classify (pun inte...
6 to 4 is not the category number, it is the ratio of the data for classes
spring field
ah, that
wary vortex
sorry for not explaining it very well.
spring field
wary vortex
They are encoded and embedded. It is 6 to 4(classes) and it is shuffled. this is...
alright, another thing, line 16 causes it to always go the else branch, is that intended?
wary vortex
spring field
alright, another thing, line 16 causes it to always go the `else` branch, is tha...
Yes
it gives an error otherwise
 surreal hemlock

wary vortex
The entire code, with it's all glory, depends on line 16
spring field
alright, well, I'm not yet particularly familiar with LSTMs yet, but I can't imagine that resetting its memory and hidden state before every epoch is the right thing to do
wary vortex
when I move it to init part so it doesnt always go to else, it gives error "RuntimeError: Trying to backward through the graph a second time (or directly access saved tensors after they have already been freed). Saved intermediate values of the graph are freed when you call .backward() or autograd.grad(). Specify retain_graph=True if you need to backward through the graph a second time or if you need to access saved tensors after calling backward."
wary vortex
spring field
alright, well, I'm not yet particularly familiar with LSTMs yet, but I can't ima...
I know but it gives an error for no reason
spring field
spring field
alright, well, I'm not yet particularly familiar with LSTMs yet, but I can't ima...
I say that because I don't know what part the nn.LSTM object handles internally itself, so it might be the case that it's saving some of that state, but then you probably wouldn't need to pass it in yourself...
spring field
wary vortex
when I move it to init part so it doesnt always go to else, it gives error "Runt...
I think you may need to detach those tensors first
wary vortex
spring field
I think you may need to detach those tensors first
I tried detaching which made the model still incapable of learning.
spring field
well, did you get rid of line 16 when you tried to detach?
wary vortex
spring field
well, did you get rid of line 16 when you tried to detach?
yes
I also tried working with hidden and memory outside the model but that did not work either
spring field
wait wait
on line 20
or rather, in that if branch, you don't reassign self.hidden and self.memory
wary vortex
So, u would be right. However due to 16, it never comes to 20
spring field
try to detach and use output, (self.hidden, self.memory) on line 20 and get rid of line 16
wary vortex
It is training, It takes 3 mins for an epoch so see ya in 3 mins
wary vortex
spring field
try to detach and use `output, (self.hidden, self.memory)` on line 20 and get ri...
I am back, and unfortunately, it did not work 😦
spring field
mmm
spring field
wary vortex
I am back, and unfortunately, it did not work 😦
alright, I think I know what the actual issue might be, you're not applying an activation function after your fully connected layer
wary vortex
spring field
alright, I think I know what the actual issue might be, you're not applying an a...
I see
It did not work either though
spring field
can you show your current code?
wary vortex
spring field
can you show your current code?
Pastebin
Pastebin.com is the number one paste tool since 2002. Pastebin is a website where you can store text online for a set period of time.
spring field
wary vortex
https://pastebin.com/j7r1gMjF
alright, new idea... 😁
return self.act(self.fc_out(output.view(output.size(0) * output.size(1), -1)))
oh and you'll need to then just pass pred to the loss function instead of pred[:, -1, :]
although 
it'll still probably error out in the loss function
spring field
spring field
alright, new idea... 😁
```py
return self.act(self.fc_out(output.view(output.siz...
mmm, I don't think this is the right architecture for this, because that's for this

but you're doing this

😩
wary vortex
spring field
alright, new idea... 😁
```py
return self.act(self.fc_out(output.view(output.siz...
this line gave an error "RuntimeError: view size is not compatible with input tensor's size and stride (at least one dimension spans across two contiguous subspaces). Use .reshape(...) instead."
spring field
oh... well, try the same but use .reshape instead of .view
it'll still definitely fail on the loss function
wary vortex
spring field
oh... well, try the same but use `.reshape` instead of `.view`
there is a problem due to tensor size " raise ValueError(f"Target size ({target.size()}) must be the same as input size ({input.size()})")
ValueError: Target size (torch.Size([512, 1])) must be the same as input size (torch.Size([256000, 1]))"
wary vortex
spring field
but you're doing this
so is it not receiving memory and history?
spring field
no no, it is what you should be doing
spring field
spring field
alright, new idea... 😁
```py
return self.act(self.fc_out(output.view(output.siz...
it's just what I wanted you to do would do the first thing
which is not what you want I don't think
so anyway, scratch that idea
wary vortex
So should I switch back to original?
spring field
I frankly am not sure how to help at this point, I'd have to come back after having practiced this myself, though I still think I have a rough idea where the problem may exist, though there are some things I don't know about your code, but yeah, I'll let someone else chime in with their ideas, sorry, it's the best i could do for now 
spring field
yeah, me too, I literally just a couple days ago managed to implement a "standard" RNN (as in, not using the built-in thing) but yeah, still learning 😁
wary vortex
spring field
yeah, me too, I literally just a couple days ago managed to implement a "standar...
well, I wish good luck to both of us
 dawn light
I'm currently following a prediction/regression problem (https://www.youtube.com/watch?v=Wqmtf9SA_kk)
I'm having trouble understanding exactly what happened at around 14:00 where he applied a log transform in order to deal with skewed data
Can someone explain (or point me to some resources) to me why exactly this works/why it's valid because afaik it's a nonlinear transformation right? won't it affect the models if we change the distribution of the features?
 wary vortex
dawn light
I'm currently following a prediction/regression problem (https://www.youtube.com...
wary vortex
dawn light
I'm currently following a prediction/regression problem (https://www.youtube.com...
Logarithmic function is really useful to get rid of extreme values(not really get rid of but to compress), since the slope is decreasing. So simply it reduces the difference between extreme values and the rest which would be considered normal. The reason it is valid is that it stabilizes variance and reduces the impact of extreme values because of the compressing thing.
 merry ridge
dawn light
I'm currently following a prediction/regression problem (https://www.youtube.com...
merry ridge
dawn light
I'm currently following a prediction/regression problem (https://www.youtube.com...
The usual path you would need to derive this is to write down a first order Taylor approximation of the unknown function which stabilizes the variance, and solve the resulting differential equation. In most cases, it just happens that a log is going to be close enough, but for something like electricity markets, you will generally need to optimize it to get a good result.
dawn light
merry ridge
The usual path you would need to derive this is to write down a first order Tayl...
I see, any chance you can point me to a resource on that taylor series?
sounds interesting enough
 earnest rose
Hi all. Who works with Speech Recognition tools, do you know if Faster Whisper has a function to get Confidence Score?
desert oar
dawn light
I'm currently following a prediction/regression problem (https://www.youtube.com...
It affects the model, of course! It usually helps
desert oar
dawn light
I see, any chance you can point me to a resource on that taylor series?
they are talking about this https://en.m.wikipedia.org/wiki/Variance-stabilizing_transformation
In applied statistics, a variance-stabilizing transformation is a data transformation that is specifically chosen either to simplify considerations in graphical exploratory data analysis or to allow the application of simple regression-based or analysis of variance techniques.
the Taylor series thing shows up in the section "relation to delta method" but read the other section first to motivate the reasoning
jaunty helm
slight tangent, but srsly how do you use PowerTransformer effectively
I feel like every time I tried it it was (sometimes significantly) worse than just taking a log or a sqrt etc
 wild sluice
bro how tf do i store my weights for multiple linear regression?
i have a 4x2 matrix of features, each row is a different sample
desert oar
jaunty helm
slight tangent, but srsly how do you use `PowerTransformer` effectively
I feel l...
is that something in sklearn?
odd meteor
Hi all,
I wanted to share openings at ICLR 2024 with you all incase you're interested
https://whova.com/event-job/iclr-2024-the-twelfth-international-conference-on-learning-representations-job-opportunities/
Goodluck!

Full list of the job openings posted on the Whova Community Board of ICLR 2024 -The Twelfth International Conference on Learning Representations, from companies and institutions such as ...
desert oar
wild sluice
bro how tf do i store my weights for multiple linear regression?
i have a 4x2 ma...
how did you fit the regression? usually the weights are just an array that can be stored in the numpy file format
jaunty helm
desert oar
is that something in sklearn?
yea, it implements box-cox and yeo-johnson which you can use
problem is I feel they're usually way off and sticking to something static like an np.log usually worked out better for me
wild sluice
desert oar
how did you fit the regression? usually the weights are just an array that can b...
thats the thing. i don't know what the dimensionality of the weights vector would be
past meteor
jaunty helm
slight tangent, but srsly how do you use `PowerTransformer` effectively
I feel l...
I'm not a fan of it
Oh, I misread and thought it was Polynomial transformer
Honestly, for all of these you need to plot the residuals versus the target and go from there
I had this discussion with a colleague today. You plot the errors and if you notice some sort of heteroscedasticity you act from there. In his case, the data were gamma distributed so actually just taking a log or actually using a gamma posterior (exists for a bunch of models) can make a non-negligible difference
desert oar
@dawn light it's less about specifically detaching variance from mean and more about exposing differences to the model that are useful on a linear scale
that is: if one of your variables is something that spans across several orders of magnitude, you might want to log-transform because you probably aren't as interested in differences as you are in "plain" differences in order of magnitude
dawn light
gotcha, thanks! I think i get it a bit more now
wild sluice
@desert oar could u please explain what the dimensionality of my weight vector would be? like does every individual feature have its own weight or does each column of the feature matrix get its own weight?
past meteor
dawn light
gotcha, thanks! I think i get it a bit more now
I actually think my answer applies to you too. Consider just plotting the residuals versus your variables and deciding on what transforms you need on the basis of that
Modelling is iterative, nothing wrong with doing that 🙂
wild sluice
nvm i got the answer
warm trellis
Does it make sense to go linear layer from conv1d and then from linear to gru?
 hushed kindle
HI GUYS, I need ur help, i am trying to create Churn predicate model in Python, I am using Logical Regression, but the result is not perfect , I mean not even good, accuracy is 67 and recall is 0.57 - Churned
0.75 - Not Churned
And ROC-AUC Score: 0.72
what I am doing wrong? I tried a lot thing but Not getting Better result.
Do u have any suggestion? I mean Tutorial , Youtube or something Like this?
desert oar
warm trellis
Does it make sense to go linear layer from conv1d and then from linear to gru?
for what purpose?
desert oar
hushed kindle
HI GUYS, I need ur help, i am trying to create Churn predicate model in Python, ...
what is Logical Regression? did you mean Logistic Regression?
if your model doesn't fit very well, the first thing you need to consider is: do my features actually make sense for predicting the outcome? if you're looking at shoe size and hair color, there's very little chance that any machine learning technique, no matter how advanced, can improve your churn model.
you might indeed benefit from trying different kinds of models, etc. but you have to think about your data first. i don't have any "tutorials" for this because none exist. you're essentially asking for a tutorial to become a mid-level data scientist. as much as i wish it was easy to learn, unfortunately there is a huge amount of material to cover. too many different things to be considered and decided without knowing what you're doing. it's like asking for a YT tutorial on becoming a software engineer.
i think the only other "short-form" advice that anyone can give is that, if your data is "tabular" like an excel spreadsheet, to try a model like xgboost that can usually combine features effectively without a lot of manual adjustment. but you will still want to learn how to evaluate a model correctly using cross-validation, and you'll need to at least pay some attention to hyperparameter tuning. you might find useful info on those topics specifically, but beware the 100s of junky video and blog tutorials.
warm trellis
desert oar
for what purpose?
There is a paper suggesting an architechture which is called TCN-ECANet-GRU, and how they formulated the flow does not work for my dataset, and model does not work. That's why I am asking, is this even logical?
source of picture: A short‑term forecasting method for photovoltaic power generation based on theTCN‑ECANet‑GRU hybrid model Xiuli Xiang1, Xingyu Li2, Yaoli Zhang2 & Jiang Hu3*
 past meteor
@wooden sail Can I poke your brain again. I keep forgetting what the gotcha is when training neural networks to estimate the parameters of a distribution and simply sampling from that to get your final prediction. In that way you naturally have probabilistic outputs. Now I'm sure something is wrong with this because I don't see it very often in the literature.
There's deep evidential regression but it's not that popular
desert oar
warm trellis
There is a paper suggesting an architechture which is called TCN-ECANet-GRU, and...
on the output side of some other complicated thing, sure why not? on the input side, i'd question its value if you don't at least have something like positional encoding and/or your sequences are reliably fixed size (don't need a lot of padding). depends heavily on how the data in encoded imo.
desert oar
past meteor
<@467435887236612106> Can I poke your brain again. I keep forgetting what the go...
isn't this like asking why we don't use xgboost or linear regression to estimate distribution parameters?
past meteor
warm trellis
There is a paper suggesting an architechture which is called TCN-ECANet-GRU, and...
I think they have the GRU so they can use it for multistep forecasting with an arbitrary horizon
desert oar
i'd love to know Edd's answer of course
past meteor
desert oar
isn't this like asking why we don't use xgboost or linear regression to estimate...
It is
DeepAR does this and DeepAR is popular
desert oar
past meteor
DeepAR does this and DeepAR is popular
let me read the paper to see what they do
it's possible that a lot of ML users don't care about (or don't think they care about) distributions (even though they should)
past meteor
I mean, I suspect you'll just have uncalibrated probabilities that don't mean anything
desert oar
fwiw in general estimating anything other than "conditional central tendency" is hard
there are specialized models for estimating conditional variance along with conditional mean in time series modeling, called "GARCH" models
desert oar
time series is hard
in traditional statistics usually either you assume a distributional form (which is often in the exponential family and has a small number of parameters) or you do something nonparametric and don't have probability estimates anyway
past meteor
I handroll everything
desert oar
and from there you follow some kind of optimization procedure like maximum likelihood, maximum a posteriori, etc. where you have a theoretically-derived objective function and a closed-form likelihood or a posterior that can be estimated with MCMC
past meteor
The same applies for time series though
You can make them Markovian by including lags inside of your covariates
desert oar
right. so you're wondering why do this in time series and not in other kinds of problems?
past meteor
And then the same techniques apply, roughly speaking
desert oar
it kind of looks like the "deep learning" part is being trained to generate samples that match the conditional distribution
past meteor
Very very roughly speaking
desert oar
that's... interesting. my initial instinct is that they have a relatively small number of variables to condition on (time + covariates), so they aren't trying to condition on a tiny slice of some massive high-dimensional space
i have to go to a meeting but i'll read through this paper, i didn't know they had a probabilistic forecasting thing
past meteor
I'll just reread the paper later
desert oar
i still want to know Edd's answer
past meteor
There's the whole gluonTS library as well you can look at
desert oar
👍 i knew about the library but never tried using it / figuring out what it does
 honest sorrel
If anyone has knowledge and experience with machine learning(ML)and its algorithms, I need some guidance to work on machine learning for my personal work. So, if anyone out there, please ping me.
wooden sail
past meteor
<@467435887236612106> Can I poke your brain again. I keep forgetting what the go...
i'm not sure what you mean
or maybe i do
in continuous, random settings, learning the underlying distribution and sampling from it means you get the prediction wrong with probability 1. is that what you're referring to?
the optimality targets are met "in expectation", but each realization of the random process is wrong
past meteor
wooden sail
the optimality targets are met "in expectation", but each realization of the ran...
Yes
But what some are doing is instead of making point predictions they for instance use MSE loss to estimate the parameters of a gamma distribution
And at prediction time they then send the data through the network which produces, in this case, 2 parameters that are then used to sample from a distribution to produce a point prediction
wooden sail
i'd somehow put that under some flavor of bayesian or posterior probability estimation
past meteor
It is yes, it's the poor man's version
But something should be flawed with approach otherwise it'd be more popular
Because as I remember the real deal has each parameter be a distribution
desert oar
past meteor
But what some are doing is instead of making point predictions they for instance...
MSE loss between the data and the sampled data from the learned distribution?
wooden sail
the starting point is a deterministic model f(x) with parameters x, and noise is added. so you have f(x) + n which is now a random variable, and you are interested in finding x from the noisy observations. this is the same as saying the data is a random process and you want the parameters that describe that random process (e.g. if the noise is 0 mean, then we are interested in the x that describes the mean f(x) of the random process)
past meteor
I think my actual question is, what are the pros and the cons of just estimating the parameters of a distribution or having your entire neural network's parameters be probability distribution and using bayes' rule for inference
The con of the latter is obviously compute/poor scaling
wooden sail
this deepAR is already letting f(x) be random itself, meaning there's a prior distribution describing f(x) and it estimates its parameters. that'd be a bayesian setting. f(x) then has additional parameters aside from x which describe its statistical properties
past meteor
desert oar
MSE loss between the data and the sampled data from the learned distribution?
No, estimate the parameters, sample and then calculate the MSE as normal
wooden sail
past meteor
I think my actual question is, what are the pros and the cons of just estimating...
these are the same thing to me, just using a different optimizer and model to find the same thing
unless i'm misunderstanding you
wooden sail
you can explicitly say "this is my distribution, plz find the params" or say "this network is a latent representation of the pdf with arbitrary structure. learn your params so that you are the pdf now"
desert oar
@past meteor was DeepAR the only example of this you had in mind? clearly this is picking up from an existing conversation that I very much want to follow, but I feel like I'm lacking context
past meteor
desert oar
<@260493929047130113> was DeepAR the only example of this you had in mind? clear...
No there's also deep evidential regression that does something similar
wooden sail
the network essentially becomes f(x), with x now a mess of trainable parameters. needs more data, but it'S more flexible than fixing f explicitly
past meteor
When I learnt of Bayesian neural nets it was always having each parameter be a prob distribution + use variational inference or something. Never something as simple as just estimating posterior
So I think my issue is: "if it's too good to be true, it probably is."
desert oar
wooden sail
the network essentially becomes f(x), with x now a mess of trainable parameters....
is this not just all ML modeling?
sturdy kiln
wow it just keeps going up lmao
 desert oar
some fixed f(x) plus additive random noise with some distributional resemblance to E(resid | x) = 0
sturdy kiln
cant tell if keras' image_dataset_from_directory is making this worse or not
wooden sail
desert oar
is this not just _all_ ML modeling?
yes, but the difference here is whether you want f to be deterministic, a deterministic parameter of a random process, or a random parameter of a random process, or a det/rand hyper param of a random process, etc
those all change what you do with the output of the network and how you measure its accuracy (which loss)
desert oar
ah, i see. i think i'm also lost because i don't know how that's typically accomplished outside of a traditional bayesian parametric model. i'll read the deep evidential regression paper & see if i can follow their technique
past meteor
wooden sail
yes, but the difference here is whether you want f to be deterministic, a determ...
It's a nice summary yes. I'll leave it at that for now haha
But still, I just wonder what each of them buys you from the practical pov
If they have calibrated probabilities, if it just ends up being the same as a regularisation scheme, ...
wooden sail
i usually (naively) think of each layer of randomness as regularization
yes
each extra model and prior contrains where the possible solutions can lie
not using any probabilities explicitly is equivalent to assuming your parameters are random with uniform distribution
past meteor
But I suppose if you pick a different distribution than Gaussian you end up with a different regularisation scheme than MAP with a Gaussian prior
wooden sail
because of this, bayesian estimation bounds are usually lower than deterministic ones
past meteor
Which in and of itself is helpful, depending on your problem
wooden sail
gaussian prior yields L2 iirc, laplace prior yields L1 reg
past meteor
Yes
wooden sail
MAP also yields the mode of the posterior, whereas a general bayesian setting cares about the whole distribution
past meteor
Exactly but I suppose if you do this naively the network may converge to something where the parameters it estimated have a very small tail (close to deterministic)
I'd just have to try this out on my data if I have spare time
dense smelt
Exception : List indices must be integers or slices, not str
I've been creating plotly dash apps its a python interactive visualisation tool, backend data for the dash app comes from aws, so this dash app has two tabs and two views/ queries are to be retrieved. To begin with when do this error occur and I'm unable to find where the error is occuring, based on port number the views are extracted from aws, after extracting its populated and loaded into a dataframe (filtered_df), need help I will explain more about the dash app and its structure but have to clear this exception and load data first.
serene scaffold
dense smelt
Exception : List indices must be integers or slices, not str
I've been creatin...
to help with debugging an error message, one needs to see the whole error message and the code that caused it.
 chrome salmon
youre trying to index a list using a string
serene scaffold
chrome salmon
youre trying to index a list using a string
yeah, this. without seeing the code and the whole error message, all one can say is "stop trying to index a list with a string", which of course is not helpful.
@dense smelt I don't help over DMs. If you want help, post the whole error message in this chat. Don't give any additional explanation of what you're trying to do until you've posted the whole error message.
wild sluice
costs=[]
iteration = []
np.random.seed(0)

for i in range(100):
    iteration.append(i)
    weights = np.random.randn(2,1)
    bias = 4
    prediction = np.dot(X,weights)
    n = y.size
    learning_rate = 0.00000005


    residual = y - prediction
    cost = (1/n) * np.sum(np.square(y-prediction),axis=0)
    costs.append(cost)
    d_weight = (2/n) * np.dot(X.T,residual)
    weights -= learning_rate * d_weight

r = sns.lineplot(x=iteration,y=np.hstack(costs))
plt.title('Costs')
plt.show()
can someone tell me what I'm doing wrong

i'm new to this
dense smelt
serene scaffold
<@700251511984357458> I don't help over DMs. If you want help, post the whole er...
Hey There you go this is the whole error message ( this is in the terminal )
layout start
Dash is running on http://0.0.0.0:9999/
- Serving Flask app 'throughput_time'
- Debug mode: on
layout start
within callback: []
pathname: http://0.0.0.0:9999/615eb010-2vvv-42d1-b6ba-50e0394cc5a5
views: ['aws_tpt_line', 'aws_tpt_cell']
within callback: []
views: ['aws_tpt_line', 'aws_tpt_cell']
factory_id: 615eb010-2vvv-42d1-b6ba-50e0394cc5a5
Exception : list indices must be integers or slices, not str
@serene scaffold Data should be loaded after extracting the view name from aws
but have to clear this exception I guess
serene scaffold
dense smelt
Hey There you go this is the whole error message ( this is in the terminal )
la...
I see. turns out that this isn't a data science question. try opening a thread in #1035199133436354600 about getting the full traceback when an error is raised in a Dash app.
wild sluice
serene scaffold
I see. turns out that this isn't a data science question. try opening a thread i...
mine is
plz help
serene scaffold
wild sluice
```py
costs=[]
iteration = []
np.random.seed(0)
for i in range(100):
iterat...
what is the problem? how is that plot different from what you wanted?
wild sluice
serene scaffold
what is the problem? how is that plot different from what you wanted?
well is it ok for the cost function to look like that? i wanted a smooth line to approx 0
serene scaffold
wild sluice
well is it ok for the cost function to look like that? i wanted a smooth line to...
do you know what an epoch is?
serene scaffold
wild sluice
yes its the training iteration
between each epoch, one would expect the average cost for that whole epoch to decrease. but it won't necessarily decrease between adjacent instances.
it looks like you're trying to implement backpropogation by hand?
wild sluice
its just multiple linear regression
wild sluice
serene scaffold
between each epoch, one would expect the average cost for that whole epoch to de...
are epochs and instances different?
i got this graph a while back for simple linear regression

i was expecting sth like this (ignore the increasing cost)
dense smelt
serene scaffold
I see. turns out that this isn't a data science question. try opening a thread i...
Okay Thanks
serene scaffold
wild sluice
are epochs and instances different?
an epoch is where you train on each training instance once
wild sluice
ok
wild sluice
serene scaffold
an epoch is where you train on each training instance once
is it because my data is randomly generated
but i did use fixed weights to calculate the output. its only the features that were randomly generated
past meteor
wild sluice
```py
costs=[]
iteration = []
np.random.seed(0)
for i in range(100):
iterat...
Why is your bias fixed to 4?
The dimension of your weights should be 1 larger than the size of the input. You should also just add a 1 to the front or the back of your input
Yes, a literal 1. That makes it easier, you don't need to add the bias then, you can just dot product and you're there
Consider doing stochastic gradient descent. It's very easy to implement, just add an inner loop
spring field
wild sluice
```py
costs=[]
iteration = []
np.random.seed(0)
for i in range(100):
iterat...
why are you picking new random weights every iteration?
wild sluice
spring field
why are you picking new random weights every iteration?
💀
i did not see that
that wud explain the graph
agile cobalt
I didn't see the demos on the website, but it sounded very robot during the live demo overall
desert oar
sounded like a person who i might insult as being a robot
"HR manager" vibes
but yeah pretty impressive. going to be very useful for running phone scams
iron basalt
past meteor
Which in and of itself is helpful, depending on your problem
Priors, if chosen correctly, make the problem way easier. And if not chosen, implicitly chosen (so it's important to be aware of what your choice is even if not made explicitly).
(Note that trying to have no bias is itself a kind of bias (and so you can put it all under the same mathematical framework))
(The scientific method tries to have this explicitly in its design)
cedar tusk
they say gpt 5 will be able to do these
what u guys think?
yea
i wonder how powerful it will be
and will openai be able to run this kind of real time model on the huge scale they are promising
i gues we are witnessing yet another history xd
 boreal crescent
I need help with my learning machine and neural networks
cedar tusk
will they name this period the postcovid ai boom xD
cedar tusk
boreal crescent
I need help with my learning machine and neural networks
u can ask any question here
boreal crescent
I have a situation my lerning machine give me a result NaN why this happened?
cedar tusk
boreal crescent
I have a situation my lerning machine give me a result NaN why this happened?
your linear algebra code has a fault in it
boreal crescent
cedar tusk
so the multiplication returns nans

 boreal crescent
cedar tusk
so the multiplication returns nans
boreal crescent
cedar tusk
so the multiplication returns nans
Ok but I try several times to fix it and have same results
spring field
if you could not send pictures taken with mobile of your laptop's screen here, that'd be fantastic, like at the very least send screenshots, but best if you just send the code and outputs and ofc if you have plots, screenshots of those
!paste
!paste
good one
boreal crescent
I changed the logical math and have same results
cedar tusk
boreal crescent
I changed the logical math and have same results
paste ur code to the above website and send the link here so we can look at it
boreal crescent
Yes I try but same results
cedar tusk
xD
boreal crescent
Yes give a moment to send you the script
This is other problems the graph 📈 is not visualized on emergents windows from tkinter
Blank screen without graphics from learning machine
cedar tusk
xD
boreal crescent
Let me go back home and I show you the script
Ok I’ll do let me back home to send you the script, almost 20 min
cedar tusk
The plot THICKENS
boreal crescent
I did inside the main loop the call of the instance model
cedar tusk
im loving this conversation 🍿
boreal crescent
First I calculated the rsi and ma5 with Cci next I created the model and set up the call inside the main loop before make a decision to trade buy or sell
 pale lantern
anyone here who could help me with converting my sklearn model to onnx? using skl2onnx?
https://discord.com/channels/267624335836053506/1239704162682277998
boreal crescent
model learning and neural
spring field
are the inputs normalized?
I'm afraid that's how TF be, they're integrated into the layers 😬
also what's this about?

keras? what's the diff between keras and tf?
oh wait, keras is part of tf?
boreal crescent
 boreal crescent
yes
boreal crescent
i can show you the script without learning and neural
spring field
you'd also need to actually make sure that the layers use some activation functions
spring field
spring field
also what's this about?
but I'm kinda concerned about this and whether you are normalizing inputs as well
boreal crescent
and you can tell me what i have to do, step by step not at all but the most important
def trading_loop(self):
previous_trend = None
while self.trading:
symbol = self.symbol
if not self.connected:
print("Not connected. Attempting to reconnect...")
self.connect_to_mt5()
if not self.connected:
time.sleep(10) # Esperar antes de reintentar
continue
# Call the functions to train the neural network and load the trained model
self.train_and_plot()
self.load_model_and_predict()
        utc_from = datetime(2024, 1, 1)
        utc_to = datetime.now()
        rates = mt5.copy_rates_range(symbol, mt5.TIMEFRAME_M5, utc_from, utc_to)

        if rates is not None and len(rates) > 0:
            print(f"OHLC {symbol}")
   ####### #self.text_widget.insert(tk.END, f"OHLC {symbol}\n")
            for rate in rates:
                direction = "buy" if rate[4] > rate[1] else "sell"
                print(f"Time: {datetime.utcfromtimestamp (rate[0])}, Open: {rate[1]}, High: {rate[2]}, Low: {rate[3]}, Close: {rate[4]}, Direction: {direction}")
                #self.text_widget.insert(tk.END, f"Time: {datetime.utcfromtimestamp (rate[0])}, Open: {rate[1]}, High: {rate[2]}, Low: {rate[3]}, Close: {rate[4]}, Direction: {direction}\n")
########################
(i called berfore the trading strategy)
i need to create a class, and singles function ?
 clever inlet
I'm looking at data scraped from upwork with job descriptions and skills required and want to use NLP to see if they match a few different roles. Anyone know where I can start?
serene scaffold
clever inlet
I'm looking at data scraped from upwork with job descriptions and skills require...
You probably don't need anything very sophisticated for this. You just need to identify which words in the job descriptions and which words in the other thing are most important, and then measure the overlap.
clever inlet
yea I had a feeling I just needed to just look for a bunch of keywords... thanks
deep veldt
Should i use vgg16 or vgg19?
lapis sequoia
I need to get better at deep learning. Where can I learn that is not cancer?
spring field
lapis sequoia
I need to get better at deep learning. Where can I learn that is not cancer?
pinned messages would be a good start