#data-science-and-ml
1 messages · Page 80 of 1
 unique ether
Can they only deal with 1s and 0s?
 left tartan
This is a core concept in Pandas... that list indexing is translated to boolean series (bitmasks)
 umbral charm
i think ive complained about it before
left tartan
unique ether
Can they only deal with 1s and 0s?
That's how bitmasks work: 1 means I want the row, 0 means I don't want the row.
umbral charm
left tartan
This is a core concept in Pandas... that list indexing is translated to boolean ...
Where can i learn pandas
like to this detail
coz i watch youtube but that just teaches commands and what they do
not like the things behind them
 young granite
puh good question u need to visit IT seminars i guess
left tartan
import pandas as pd
s = pd.Series([i for i in range(10)])
mask = s % 2 == 0
print(mask)
print(s[mask])
why now masks?
left tartan
umbral charm
Where can i learn pandas
Lots of places, https://www.kaggle.com/learn/pandas is one
Solve short hands-on challenges to perfect your data manipulation skills.
left tartan
young granite
why now masks?
The original question was: housing2 = housing[(housing['date'] > '2016-12-01') and (housing['date'] < '2018-01-01')]
In this, (housing['date'] > '2016-12-01') is a bitmask (boolean series), as is (housing['date'] < '2018-01-01')
young granite
yeh nvm im jumping too many chats
umbral charm
UGHHH im a physics major and im doing this wtf
umbral charm
left tartan
Lots of places, https://www.kaggle.com/learn/pandas is one
Thank you tho!
young granite
umbral charm
UGHHH im a physics major and im doing this wtf
so why bother with bostonhousing?
left tartan
umbral charm
UGHHH im a physics major and im doing this wtf
Oh, any of the sciences will involve a lot of programming & data work. I would imagine this will be forever part of your life as a physicist.
umbral charm
young granite
so why bother with bostonhousing?
? boston
its london housing
and i go back to uni soon
i want to teach myself pandas
young granite
umbral charm
? boston
i assumed boston dataset as its one of the most known ones
umbral charm
and apperently pandas is good with large datasets
young granite
do it for urself
umbral charm
and id rather learn something i can use in uni and irl
young granite
SQL is pretty straight forward
umbral charm
rather than just something irl, as uni is hard do not have that much time
young granite
sure
umbral charm
if you get me
young granite
yeh
umbral charm
But honestly i really wanted to learn so,mething like C++ because apperently its verty useful
but i just turn to my brtohers screen and hes allocating memory to things like WTF
so no thanks
young granite
but why housing and not more field orientated
umbral charm
I needed a large data set
young granite
u know bout kaggle?
young granite
there are science datasets might be more interesting for a fellow science person
umbral charm
Thats true, But like i said i dont want to over complicate it as of now
im still new to pandas
young granite
so ur journey just started?
young granite
but its good u already started coding!
umbral charm
no used to study comp sci, so coding is not really an issue
young granite
will come in handy source: dude trust me
umbral charm
its just when i get introduced to new stuff in coding ive never heard of before
young granite
ah ok
umbral charm
Like pandas
So using numpy and matplotlib was pretty nice
But this pandas is giving me a headache
young granite
pandas is build on numpy if i recall it correctly so jokes on u 🗿 😄
 weak mortar
Yes, pandas use numpy and matplotlib
weak mortar
 umbral charm
and look at the moon tonight guys
 cerulean kayak
I'm doing a function that checks if a numpy array is [255,255,255].
How would I write the if branch? I wrote
if img==[255,255,255]: #img is a numpy array of shape (3)
but it didn't work
weak mortar
Its a hologram 🙄
 spare tinsel
Hello guys,
I'm working on a neural network. It works on my laptop but when I download the virtual enviroment and try to set up the enviroment on another pc it doesn't work because of incompatible issues.
I'm not sure what the problem is but I was wondering if you know about a website or something that tells me which packages including the version
are compatible with each other and which python version is required.
weak mortar
I think make a function that checka it,then use .applymap . Better do it with some lambda i guess , but i cant help with that
The if statement doesnt know it has to iterate through the df
spare tinsel
spare tinsel
Hello guys,
I'm working on a neural network. It works on my laptop but when I d...
Is this even the right place to ask a question like this? 🤔
left tartan
spare tinsel
Hello guys,
I'm working on a neural network. It works on my laptop but when I d...
Generally, start with the obvious stuff: pip freeze on the working environment and compare to the broken environment. Try to narrow it down and resolve major differences
If you can share an error message, we might point you in the right direction
 tidal bough
cerulean kayak
I'm doing a function that checks if a numpy array is [255,255,255].
How would I...
tidal bough
cerulean kayak
I'm doing a function that checks if a numpy array is [255,255,255].
How would I...
np.array_equal would work, say
 shut girder
Hello guys, I am trying to get into Data Analytics with Python. Does anyone have a recommended free course for me or know what I should learn? I currently have a good understanding of the Python basics.
 desert oar
tidal bough
`np.array_equal` would work, say
desert oar
tidal bough
`np.array_equal` would work, say
dang, TIL about this. been using x.shape == y.shape and np.all(x == y) all this time
although in tests i usually use np.testing.assert_allclose or similar
desert oar
shut girder
Hello guys, I am trying to get into Data Analytics with Python. Does anyone have...
i'm sure there are some targeted courses on sites like udemy. but data analytics usually comes down to some combination of data cleaning, data visualization, statistics, and maybe some probability modeling.
on the software side of things, you will definitely want to know the python libraries pandas for data manipulation and at least one data visualization library like matplotlib and/or plotly. some practice with numpy as an adjunct to pandas can help too. skill with sql and ms excel or google sheets can also be extremely valuable. in addition, you will almost certainly end up working with a "dashboarding" tool like PowerBI, Tableau, or QlikView and i often see those listed on job desscriptions.
communication, presentation and reporting/writing skills can also be very important, as data analysts tend to work close to the business and need to be able to communicate with important stakeholders. finally, you might want to focus on a particular industry where you already have some expertise or want to develop expertise. the best data analysts tend to be very knowledgeable about their industry/field/business and use this knowledge to guide their work.
MIT 18.05 could be a good place to get started with statistical things.
for data visualization there are probably good online courses. but i highly recommend the classics The Visual Display of Quantitiative Information by Tufte and The Elements of Graphing Data by Cleveland. these books are old, but they are basically the founding material of all modern data visualization and they remain excellent resources today, as well as increasingly quaint reminders of how amazingly useful computers are. Visualizing Data by Cleveland is also very good. and Exploratory Data Analysis by Tukey is a classic. Tufte, Cleveland, and Tukey are like the founding fathers of data analysis. they're old books, but full of great ideas that we can still learn from.
shut girder
desert oar
i'm sure there are some targeted courses on sites like udemy. but data analytics...
Thanks
 pale hemlock
here
desert oar
@pale hemlock can you clarify what this is meant to do?
coordinates = np.array([(i, j, k) for i in range(x_dim) for j in range(y_dim) for k in range(z_dim)])
it just looks like 1..10 stacked up in an array
so you get all combinations of 1..10 three times
pale hemlock
right the idea is store data as a dictionary.. hold on i got something else for you to gander at
desert oar
but that's not a dictionary of anything
i'm also not convinced that this mapping of coordinates to labels is correct
pale hemlock
yeah i know hold on
this product is something intersting in that well have a look
desert oar
i think you sent this before. i can take a look
oh, i see what you mean by a "triangle". sure
i think what you're getting at is that these "shapes" are defined by particular relationships between x, y, and z. and what you might have discovered is that neural networks are very good at learning nonlinear relationships like that
pale hemlock
the novel concept here is that theses values can start and store as a dictionary reference for the values, AND be used in language modeling, you see common use of square, circle, triangle, so on and so forth is also uderstood natrually
desert oar
right, that's where you lose me
pale hemlock
well at some points certain things come up in conversation like square, this can be used a method to store infor in a dimension that has context like.. square box
desert oar
by "dimension" are you talking about the elements of the output? like if the 1st element is the biggest, then it's part of a circle, if the 2nd is the biggest then it's part of a square, etc?
pale hemlock
if you ask a modle designed to recognize objects via mathematically because the dimensions are written withen in it, how those dimensoins are rendered..
like lets call BOX something for hard ware.
and rectangle something for software
desert oar
what do you mean by "hardware"? this is where i think you're getting a little confused
pale hemlock
hardware can kick out x y values and learned recognition can learn its own dimensions based of hardware context it can look it up, get dimensions, store it in the circle dimension.
useful cause circle encompasses a bubble of enviornment
desert oar
what you're saying unfortunately doesn't make sense
pale hemlock
not quite yet to you but it makes perfedt sense to me.. you maintain data structure, but provide organice access
desert oar
yes, i think you've rediscovered the concept of how classification works in neural networks
pale hemlock
a chat gpt3 model can talk to it by its self. as the modle adds words and data..
ok as a programmer you can call functions that get information form the hardware at a basic level, type, manufacture, blah blah.. this information can be retrieved sorted in the dimensions appropriate to the context.
desert oar
yes, but i think you're getting confused with this metaphor about shapes
 scenic parcel
Do any of you guys use aomni or cognosys?
desert oar
a neural network model has no knowledge of the hardware that it's running on. it's just a bunch of numbers
pale hemlock
yeah i know that but that nero network works with the model in tandum.
desert oar
a "neural network" is just one particular kind of model
if you're talking about training a model on some dataset of computer parts, then yes. the model will learn some internal representation that amounts to some kind of compressed understanding of computer parts, and you are retrieving that knowledge by making predictions with the model
pale hemlock
if you still thinking 'shapes' you have missed the idea, the whole point is that shapes are created via mathematically and cause that process can happen alone we need to define them,
desert oar
i'm not sure what you mean by that
pale hemlock
i know
im starting to feel this
you got the gist
im sure of that
what you agreed to is the process im working toward but the fact that im creating a dimensional storage process i need to think logically how that storage is handled, im starting with baic shapes.. theses shapes start the process of gathering along a dictionary specifically talored and adhered to the original tensor model and offers a dimensional handling.. once i figure out all the shapes thus far.
desert oar
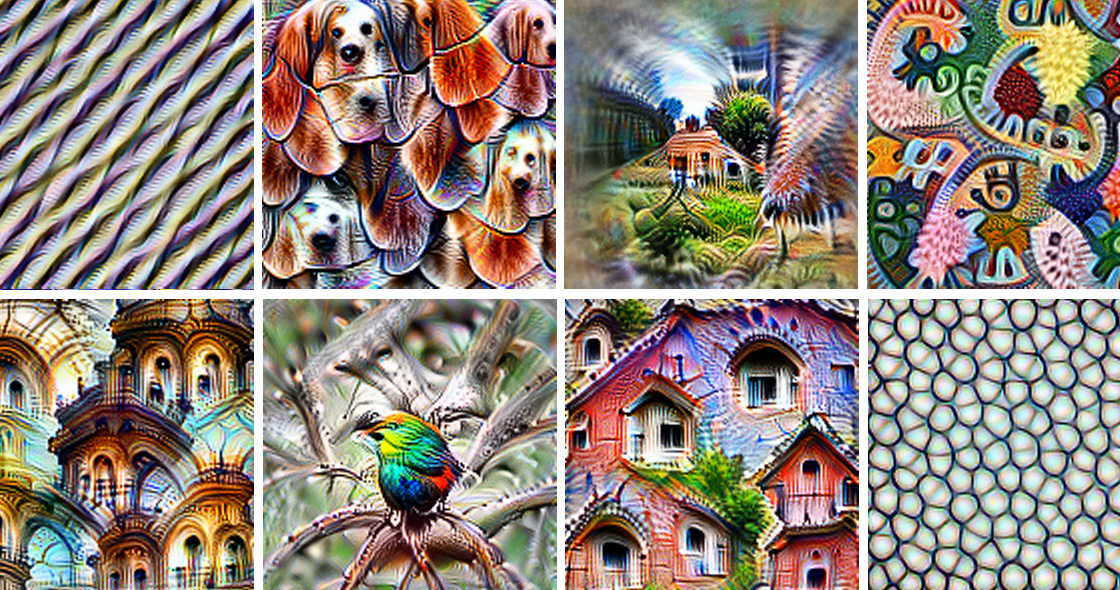
my best guess is that you're talking about the model learning its own internal representation of the data, like this: https://distill.pub/2017/feature-visualization/
and it seems like you're talking about using that internal representation as a kind of universal information storage system, from which arbitrary information can be retrieved.
is that at least somewhat right?
 pale hemlock
the storage i refere too is just the coordinate values the data its self isn't necessaryly important
im trying to store multiple dimensions that have a relational coodinate value, that are created in distinct 'zones' that are connected though its core concept
the zones im useing just happen to be shapes that can have a reference in context when presented and trained.
desert oar
i think you're trying to express that neural networks can learn certain fundamental properties about the data, such as concepts in language or shapes in physical objects?
pale hemlock
yeah basically just seems right
desert oar
if so, yes, they can do that. that's what language models are meant to do
pale hemlock
yes but, to do so in context and seemingly self aware state
desert oar
yeah, gpt-4 is very good at behaving like it's self-aware, but that's the beauty and magic of a gigantic model and a gigantic context
are you familiar with "topic modeling"? this was kind of a popular topic several years ago and seems to have faded from interest somewhat. but it might be interesting to you if you care about finding core "concepts" in data and relationships among those concepts.
most people in applied work care a lot less about actually finding and making sense of those concepts, and more about making accurate predictions or building highly effective agents or generative outputs. the concepts in that case are a means to an end, rather than the goal.
pale hemlock
agreed, but how about a model that seems to understand itself, this model, know its a shape when the training models are presented, this model would evtually understand its presense in a machine... im pretty sure of this.... yes i know what topic modeling is, its what im trying to do, however topology doesn't make a object that can work
desert oar
you might also be interested in the vast literature on low-rank approximations of data and dimension reduction, which long predate the "deep learning" movement
desert oar
pale hemlock
agreed, but how about a model that seems to understand itself, this model, know ...
to some extent this is already possible. gpt-4 is a language model, right? so if you ask it questions about gpt-4, it should be able to understand that you're asking it about itself, as long as information about language models is present in the training data and it's managed to learn some internal representation of the relevant ideas
but does this actually constitute self-awareness? who knows. that's philosophy.
pale hemlock
wanna know what is funny? about a week after i presented my idea on this server Chatgpt4 came out , its ok though, i have yet to check it out.
 iron basalt
pale hemlock
agreed, but how about a model that seems to understand itself, this model, know ...
iron basalt
pale hemlock
agreed, but how about a model that seems to understand itself, this model, know ...
Are you trying to create a quine? Because those are common in ML.
desert oar
pale hemlock
wanna know what is funny? about a week after i presented my idea on this server ...
it might be worth pursuing some formal study in AI and ML, you will find that you aren't alone in having high aspirations here, but you will definitely want to spend some time synchronizing your understanding with the field in general
 vast nexus
Hey @desert oar can I ask if its okay to post a google form survey. Its for my college research on devs opinions on AI/ML.
Its a very small survey, 10 questions.
desert oar
vast nexus
Hey <@389497659087650836> can I ask if its okay to post a google form survey. It...
ask in #community-meta
vast nexus
Thank you
 serene scaffold
pale hemlock
hardware can kick out x y values and learned recognition can learn its own dimen...
serene scaffold
pale hemlock
hardware can kick out x y values and learned recognition can learn its own dimen...
I've never heard the word "hardware" used in a sense that gives coherent meaning to this sentence.
pale hemlock
serene scaffold
I've never heard the word "hardware" used in a sense that gives coherent meaning...
black box?
serene scaffold
pale hemlock
black box?
we don't think of black boxes and glass boxes as hardware. They're just metaphors for functions
Whereas "hardware" is never metaphorically. Even when talking about virtual machines.
pale hemlock
right, but they refer to hard ware, the square dimesion us supposed harbor theses values....
serene scaffold
If you talk about black box functions as being hardware, you'll just confuse everyone around you.
If you don't mind me asking, are you communicating with us through an automatic translator?
It's fine if you are.
pale hemlock
right i am tired it 1215 am... nope no auto translator
english.
typing since 11
anyhow night im tired. sleep calls
serene scaffold
Goodnight
 lapis sequoia
Anyone know of any solid open courses for AI ML?
 small wedge
lapis sequoia
Anyone know of any solid open courses for AI ML?
small wedge
lapis sequoia
Anyone know of any solid open courses for AI ML?
andrew ng's machine learning courses are highly praised
lapis sequoia
Thanks!
link here for anyone else interested
https://www.andrewng.org/courses/
here's one with the free lectures
https://see.stanford.edu/Course/CS229
 serene wadi
hi ppl
 wraith heart
A to Z of Stable Diffusion: Essentials and practical tutorial
Medium
Beyond the Hype: Practical Tutorial to Stable Diffusion and Its Impact on Tech
pale hemlock
brb
 proud briar
import torch
import torch.nn as nn
import torch.optim as optim

class Adder(nn.Module):
    def __init__(self):
        super(Adder, self).__init__()
        self.hidden = nn.Linear(2, 64)
        self.output = nn.Linear(64, 1)

    def forward(self, x):
        x = torch.relu(self.hidden(x))
        x = self.output(x)
        return x

def train_model(model, inputs, targets, epochs=1000):
    criterion = nn.MSELoss()
    optimizer = optim.Adam(model.parameters(), lr=0.01)

    for epoch in range(epochs):
        optimizer.zero_grad()
        outputs = model(inputs)
        loss = criterion(outputs, targets)
        loss.backward()
        optimizer.step()

def add_numbers(a, b):
    model = Adder()

    inputs = torch.tensor([[a, b]], dtype=torch.float32)
    targets = torch.tensor([[a + b]], dtype=torch.float32)

    train_model(model, inputs, targets)

    result = model(inputs).item()
    return result

# User input
a = float(input("Enter the first number: "))
b = float(input("Enter the second number: "))

result = add_numbers(a, b)
print(f"The sum of {a} and {b} is: {result}")
this was my first pytorch thing i made 4yrs ago
 echo vapor
how can i maximize fps on cv2 using webcam for Capture? Ive set resolution to 1920x1080 but only get 5fps, yet with 480x640 i get 28fps. i dont get why it would drop this much
 mild dirge
(1920*1080) / (480*640) = 6.75
About the same ratio as 5 fps to 28 fps
It's just many more pixels
 pearl locust
Hello, everyone,
Since this channel allows discussions on topics related to data science, I'd like to share an app I've been working on for a long time, on occasion of its 1.4 version release. I believe it is very relevant to this discussion, since it is a tool that is very handy for data science.
The software shown above ☝🏽 is completely free, open-source and released to the public domain. You can download it right now with pip:
pip install --upgrade nodezator
And learn more about it here: https://github.com/IndiePython/nodezator
There's also an online manual which is available within the app as well: https://manual.nodezator.com/
Let me know if you have any questions, I'll be happy to answer them.

GitHub
A multi-purpose visual node editor for the Python programming language - GitHub - IndiePython/nodezator: A multi-purpose visual node editor for the Python programming language
Nodezator app's official manual
Also, pardon me if you see similar posts in other channels. I don't intend to spam the server and I only post about this app once in a while. It is just that since it is a multi-purpose/generalist app, it is useful in many different areas. That's all.
echo vapor
mild dirge
About the same ratio as 5 fps to 28 fps
So cv2's max fps for 1920x1080 is ~5fps?
mild dirge
for your pc maybe yes @echo vapor
I don't know what the specs are and exactly what you do with the frames
umbral charm
in Pandas, how do i write to an excel file with data already on it, as in just add a new column without overriding its currnet data
left tartan
umbral charm
in Pandas, how do i write to an excel file with data already on it, as in just a...
You don't. You rewrite the sheet.
Or, better said: You read, modify, and rewrite.
 worn stratus
umbral charm
in Pandas, how do i write to an excel file with data already on it, as in just a...
worn stratus
umbral charm
in Pandas, how do i write to an excel file with data already on it, as in just a...
https://pandas.pydata.org/docs/dev/reference/api/pandas.ExcelWriter.html
if_sheet_exists='overlay'. There is some way to do it in an older version, but I've forgotten. If you don't figure it out, I can log into my work PC and check for you
you need to use something like openpyxl to figure out where to append the row etc
(I don't know how this actually gets materialised in the underlying XML, but it lets you keep all the formatting etc of the left hand columns even if it is doing what BillyBobby said of just entirely overwriting the existing file )
left tartan
Oh, that's a good point, if you have formatting and stuff, yah, overlay it. You still end up reading the dataframe, and writing the dataframe again though.
worn stratus
anecdotally, this is super slow (tens of seconds) for medium sized sheets (megabytes) - but it works, and I end up using it a ton
desert oar
left tartan
Oh, that's a good point, if you have formatting and stuff, yah, overlay it. You ...
i actually didn't know you could overlay. i remember building a business critical report workflow once where i used pandas to dump my output data to a new sheet at the end, and then i would manaully copy and paste the data into the actual sheet where all the formulas were reading from...
left tartan
desert oar
i actually didn't know you could overlay. i remember building a business critica...
It didn't exist until fairly recently. I've done the same many times.
The notes there say 1.4.0 which is fairly recent, most folks were on 1.3.5 for a long time.
desert oar
ah okay, this was before pandas 1.0
umbral charm
worn stratus
you need to use something like openpyxl to figure out where to append the row et...
Yea
I found this
It worked well
desert oar
i didnt want to drop down to using openpyxl, it was easier for me to copy and paste the data from another sheet lol
i remember messing with it for a while but didnt feel like reinventing what pandas already did
left tartan
Yah, I usually just do stuff like have a data sheet that I rewrite/control, and put all the formulas / pivots on another sheet
desert oar
exactly
left tartan
I'm still waiting for access to the Excel/Python beta. I didn't get second wave access.
umbral charm
I learnt about pivot tables and Agg functions the other. Day
They are pretty useful
left tartan
Oh, pivot is life.
One of my clients loves grouped columns in Excel. Generating those is a real pain
worn stratus
left tartan
Yah, I usually just do stuff like have a data sheet that I rewrite/control, and ...
the problem with this is that you can't f9 it in python
which can be really annoying for big sheets
left tartan
worn stratus
the problem with this is that you can't f9 it in python
Wait, then when does it calc?
Or you mean, I can't trigger a recalc from python?
worn stratus
left tartan
Or you mean, I can't trigger a recalc from python?
yeah exactly
you need a human to trigger the calculation
either be opening it on automatic, or pressing f9
desert oar
left tartan
I'm still waiting for access to the Excel/Python beta. I didn't get second wave ...
id still probably just want to use one of the existing tools
left tartan
I've been wondering how I'd coordinate: Excel Do Something -> Python Execution -> Excel Do Something Else
worn stratus
left tartan
I've been wondering how I'd coordinate: Excel Do Something -> Python Execution -...
I've done this with xlwings. it works, but gets a bit flakey
left tartan
Well, this is still better than when I used to generate OOXML from scratch.
(although, it was fast)
worn stratus
I've never had to go down to the ooxml level, but I think at some point I'm going to get to that level
or quit and get a better job
either way
left tartan
worn stratus
I've never had to go down to the ooxml level, but I think at some point I'm goin...
It's not so bad, in hindsight. I really should've just open sourced it, but too late.
desert oar
worn stratus
I've never had to go down to the ooxml level, but I think at some point I'm goin...
im horrified and fascinated at the things people do with excel
does xlwings work with pandas?
worn stratus
desert oar
does xlwings work with pandas?
it does - but I don't know how well, I've mostly just done reading a handful of cells etc - from the docs it looks pretty great though
maybe I'm mixing things up actually. great is overselling it a bit, it seems OKish.
 proven vector
Does anyone in here use looker and not hate it?
 golden haven
Google colab [Selenium] keep giving me this error:
TypeError: WebDriver.init() got multiple values for argument 'options'
If anyone knows how to solve this error please check my post that I have just creatred in python help, thank you! ❤️
 frail kayak
Hey so I want to get into AI and develop chat bots so can anyone suggest me where to start? I am well versed with basic python concepts and have made discord bots in python for 2 years so if anyone can suggest a library or a video or an article?
I have been searching but I am finding many libraries and many concepts so if there is a particular way to learn it? A particular sequential way?
small wedge
frail kayak
Hey so I want to get into AI and develop chat bots so can anyone suggest me wher...
modern chat bots like chatGPT are built in a subfield of AI called machine learning. These are mathematical constructs that let us estimate functions so there is a lot of math involved in understanding what they are doing. Although with modern libraries such as tensorflow or pytorch you can build machine learning models with just a knowledge of the theory no math needed. Up to you to decide what path you wanna go here but here are some resources:
https://developers.google.com/machine-learning/crash-course/ google's crash course
https://www.youtube.com/watch?v=aircAruvnKk&list=PLZHQObOWTQDNU6R1_67000Dx_ZCJB-3pi
3b1b's playlist covering neural networks, it get progressively more mathy as the videos continue but the early parts are very simple and intuitive explanations I would recommend watching the first two regardless of whether you want to dive into the math or not
andrew Ng's courses are very highly acclaimed, here is a link to what I believe is a completely free one https://see.stanford.edu/Course/CS229 and he has many others on coursera
if you're a bit less interested in the math and moreso in the theory sebastian lague has some very intuitive and clear explanations of this stuff in his videos https://www.youtube.com/watch?v=hfMk-kjRv4c
Those just scrape the surface of what you'll need but for a start I believe they are all good resources
frail kayak
small wedge
modern chat bots like chatGPT are built in a subfield of AI called machine learn...
Wow man! Thanks a lot for all this info! Ill save this and get started on them.
Really thanks a lot
 frank storm
is linear algebra that necessary for ml? im still a high schooler who likely won't be at linear algebra anytime soon 💀
small wedge
frank storm
is linear algebra that necessary for ml? im still a high schooler who likely won...
with modern libraries you can implement ml models without understanding any of the math, but to actually make them from scratch yes you need to have a baseline of understanding linalg
frank storm
small wedge
with modern libraries you can implement ml models without understanding any of t...
what kind of linear algebra would i need to learn?
small wedge
for the most basic feed forward neural networks you need to know about dot products and you need to know how vector calculus works (like the difference between the derivative of scalar multiplication and a dot product of two matrices) and things like calculating jacobian matrices.
then there are more advanced concepts required for different techniques as you continue to learn
frank storm
small wedge
for the most basic feed forward neural networks you need to know about dot produ...
tbh that sounds like gibberish so im just gonna stick with the modern libraries
ty tho
 cold osprey
LOL
 slim bone
... brilliant lol
lapis sequoia
guys
i am aboutta work on this project Image processing
and i m gonna apply this on drowsiness alert system...
I'd like to get as many resources as i can. or may be a perfect roadmap.
if anyone can help me with that pls lemme know
serene scaffold
frank storm
is linear algebra that necessary for ml? im still a high schooler who likely won...
If you want to work in ML professionally, you'll need to learn the math at some point.
left tartan
lapis sequoia
and i m gonna apply this on drowsiness alert system...
I'd like to get as many r...
Help with what? Whats your actual question?
 calm gulch
frank storm
tbh that sounds like gibberish so im just gonna stick with the modern libraries
calm gulch
frank storm
tbh that sounds like gibberish so im just gonna stick with the modern libraries
Start small. Learning the chain rule opens up quite a bit of accessible material. But all other answers are relevant, you will need to learn vector calculus and statistics eventually if you want to do ML professionally.
 abstract wasp
Yo, anyone know how to fix this error: ValueError: Input 0 of layer "sequential" is incompatible with the layer: expected shape=(None, 32, 32, 3), found shape=(None, None, 32, 32, 3). Ik there is an extra layer but I don't see where I can edit the code to fix it 😅
This is my code:
`#imports
import tensorflow as tf
from tensorflow.keras import datasets, layers, models
import tensorflow_datasets as tfds
import pandas as pd
import matplotlib.pyplot as plt
#fetching data
cifar = 'cifar10'
(ds_train, ds_test), ds_info = tfds.load(
cifar,
split=['train', 'test'],
shuffle_files=True,
as_supervised=True,
with_info=True,
)
#preprocessing data
def image_preprocessing(image, label):
return tf.cast(image, tf.float32) / 255, label
ds_train = ds_train.map(image_preprocessing)
ds_test = ds_test.map(image_preprocessing)
#building
model = models.Sequential(
[
#convoluntional base start
layers.Conv2D(32, (3, 3), activation='relu', input_shape=(32, 32, 3)),
layers.MaxPooling2D((2, 2)),
layers.Conv2D(64, (3, 3), activation='relu'),
layers.MaxPooling2D((2, 2)),
layers.Conv2D(64, (3, 3), activation='relu'),
#convoluntional base end
    #dense layers start
    layers.Flatten(),
    layers.Dense(64, activation='relu'),
    layers.Dense(10)
]
)
model.summary()
#compiling + optimizing
model.compile(optimizer='adam',
loss=tf.keras.losses.SparseCategoricalCrossentropy(from_logits=True),
metrics=['accuracy'])
#batching
batch_size = 32
ds_train = ds_train.batch(batch_size)
ds_test = ds_test.batch(batch_size)
history = model.fit(ds_train, epochs=10, validation_data=ds_test)`
 glacial rampart
frank storm
is linear algebra that necessary for ml? im still a high schooler who likely won...
glacial rampart
frank storm
is linear algebra that necessary for ml? im still a high schooler who likely won...
Idk, I got all the maths during my studies, but so far I didn't have to use any of those things. As long as you use 'proven' methods, they want you to apply it. But I will soon move to a research position, which will probbably be different. Anyway, I don't think all ML jobs require it. Though they will want you to understand what you're doing
frank storm
calm gulch
Start small. Learning the chain rule opens up quite a bit of accessible material...
Ill start with chain rule, ty
I dont plan on comprehending it too well but whatever
glacial rampart
Chain rule is probably one of the few which you'll want to remember (all the others you can just look up later IF you need it)
calm gulch
abstract wasp
Yo, anyone know how to fix this error: ValueError: Input 0 of layer "sequential"...
check the shape of your input and if there's an extra dimension reshape it to see if that fixes it.
via ds_train.reshape((shape[0], shape[1], shape[2], shape[3]))
abstract wasp
calm gulch
check the shape of your input and if there's an extra dimension reshape it to se...
Well, this is the model.summary()
Model: "sequential"
Layer (type) Output Shape Param #
conv2d (Conv2D) (None, 30, 30, 32) 896
max_pooling2d (MaxPooling2D (None, 15, 15, 32) 0
)
conv2d_1 (Conv2D) (None, 13, 13, 64) 18496
max_pooling2d_1 (MaxPooling (None, 6, 6, 64) 0
2D)
conv2d_2 (Conv2D) (None, 4, 4, 64) 36928
flatten (Flatten) (None, 1024) 0
dense (Dense) (None, 64) 65600
dense_1 (Dense) (None, 10) 650
=================================================================
Total params: 122,570
Trainable params: 122,570
Non-trainable params: 0
calm gulch
it is likely from this input_shape=(32, 32, 3), you want to inspect your data dimensions to ensure it is of the form (image, x, y, channels) when you pass it into your model
just call ds_train.shape and see what your input dimensions are and go from there
abstract wasp
calm gulch
via ds_train.reshape((shape[0], shape[1], shape[2], shape[3]))
I get an attribute error: '_BatchDataset' object has no attribute 'reshape'
 winter drift
Anyone know where I can find lots of images of aquatic garbage
 west grail
Can anyone please create a voice chat for data science 🙏
 stark fractal
anyone know best way to visualize data on a mpa
i would use folium but i need hyelp and no one knows how to use it and the thing i want is pretty specific
i want to make a map of data like this
at first you have one large bubble with count and its not clickable as you zoom in the bbules split up and then as you get to a certain zoom threshol they split into individual incidents which are clickable and tell you info about that specific thing


 calm gulch
abstract wasp
I get an attribute error: '_BatchDataset' object has no attribute 'reshape'
calm gulch
abstract wasp
I get an attribute error: '_BatchDataset' object has no attribute 'reshape'
ah, try just print() on the dataset post batching then, should show you the shape
calm gulch
abstract wasp
I get an attribute error: '_BatchDataset' object has no attribute 'reshape'
Interestingly, if I copy your code exactly, it has no dimensionality errors. Make sure tensorflow is up to date?
calm gulch
abstract wasp
I get an attribute error: '_BatchDataset' object has no attribute 'reshape'
 abstract wasp
Oh
abstract wasp
calm gulch
Interestingly, if I copy your code exactly, it has no dimensionality errors. Mak...
I’m writing my code on a Kaggle Notebook. Do you know if the libraries there are automatically updated? I’m not sure myself ;-;
calm gulch
abstract wasp
I’m writing my code on a Kaggle Notebook. Do you know if the libraries there are...
They should be up to date, a guess is that you're accidentally executing the ds_train = ds_train.batch() call twice (maybe recalling the same block?). e.g.,:

you can double check your tf version via:
 abstract wasp
calm gulch
you can double check your tf version via:
abstract wasp
calm gulch
you can double check your tf version via:
I checked and I have 2.12... currently updating
calm gulch
abstract wasp
I checked and I have 2.12... currently updating
if that doesn't fix it, add "print(ds_train)" and "print(ds_test)" directly before you call "history = model.fit(ds_train, epochs=10, validation_data=ds_test)"
abstract wasp
I updated tensorflow but when I check the version I still have 2.12 T-T
calm gulch
weird, but that version should be up to date enough
abstract wasp
Ah wait
It just gave me a message to restart the kernel
Ayeooo, it's working 😭🤩
Thank you for the support!! 
@calm gulch
small wedge
winter drift
Anyone know where I can find lots of images of aquatic garbage
Something like this? https://www.kaggle.com/datasets/shivamb/underwater-trash-detection
In general https://datasetsearch.research.google.com/ is a good place to look
desert oar
stark fractal
at first you have one large bubble with count and its not clickable as you zoom ...
folium does sound like the right tool for the job. or maybe plotly express has something
there's also holoviews/geoviews but i never got that library to work well
 distant mantle
you aren't python expert?
desert oar
distant mantle
I am looking python expert.
we like to say "don't ask to ask". it's better to state your question and wait for someone to answer. if nobody knows the answer, you might have to ask again in a few days.
desert oar
umbral charm
when should you use pd.concat vs pd.join vs pd.merge
join and merge are both "joins" in the sense that you see them in a database. the difference is that join performs the join using the dataframe indexes, and merge performs the join on data columns.
concat is concatenation. it's only a "join" in that a lot of pandas operations are implicitly a "join", because they align rows by index value before running the operation. e.g. x + y actually aligns rows by index before computing the addition.
in fact, even just assigning a column df2["z"] = df1["z"] has some join-like behavior using the indexes. .join just gives you more control over how that join is performed and makes the operation explicit. but in general, it's safe to think of pandas operations as always being "joins" in that data is aligned by index value, not row position
i only reserve merge for ad-hoc data cleaning and data processing, usually somewhat early in data pipeline when combining datasets. otherwise i try to structure my pandas code around indexes whenever possible.
umbral charm
desert oar
`join` and `merge` are both "joins" in the sense that you see them in a database...
Hm i see, so merge is gone out the window for me, so lets say if i have a dataframe with a bunch of columns and an index 'area', i have another dataframe with the same index 'area' but its just totally different data, how would i add it to my big dataframe
desert oar
consider this hypothetical situation of a cities table and a houses table:
cities = pd.read_csv("cities")
houses = pd.read_csv("houses")
let's say cities has a unique id column city_id. let's also say houses has a city_id column, which is non-null. then you can get all the city attributes into the house data by first setting city_id to be the index of cities, and then join-ing it to houses.
cities.set_index("city_id", inplace=True)
houses = houses.join(cities, on="city_id")
this is a good idea because city_id already acts as a unique identifier for entries in cities, so it's a good design choice to actually set the city id as the row label.
desert oar
umbral charm
Hm i see, so merge is gone out the window for me, so lets say if i have a datafr...
you mean, area has two completely different meanings? you should give them two different names to distinguish them. if you want a single joined table, you can use them both in the index to create a multiindex, corresponding to a "composite primary key" in relational database terminology.
umbral charm
no
calm gulch
umbral charm
Hm i see, so merge is gone out the window for me, so lets say if i have a datafr...
if the columns are different, but indices are the same, I'd concat horizontally to get the resultant single dataframe with columns from both dfs.
umbral charm
theyre both exactly the same indexes
i just wanna simply join it to the bigger dataframe
desert oar
so you have columns a, b, c in df1 and x, y, z in df2, and they are both uniquely identified by column i. then you can either concat or join, both will work
the difference with join is that you get control over how the join works, e.g. how="left" or how="inner"
whereas with concat you can do things like add an extra layer of columns
if you really just want to concatenate them side by side then concat seems like the most natural operation. it's in the name after all
umbral charm
but you see
desert oar
but if the indexes are unique in both tables you can do e.g. df1.join(df2, how="inner") -- or how="left" or whatever as needed
actually i think pd.concat([df1, df2], axis=1) is equivalent to df1.join(df2, how="outer")
might be some edge cases where it varies
calm gulch
I think thats right, but join can handle duplicate indices, iirc concat errors in that case
umbral charm
Omg
im a complete idiot
@desert oar how do you know all that
Like what
I mean i aint complaining
but like wtf
left tartan
fwiw, this stuff (concat/unions, joins, etc) are fundamentals in any data job. The stuff salt rock is talking about are fundamental database primitives: joins, unions (concats), etc are the basic things you learn when you learn SQL. Although this is Pandas, it's the same concepts.
So, it's not esoteric stuff... it's stuff worth studying/understanding.
 half lintel
Is it OK to ask a pandas question here? I'm fairly experienced python, but new to pandas. I have a df like
+----+-----------------+--------+-----------+
|    | period          |     cc |      cost |
|----+-----------------+--------+-----------|
|  0 | week 2023-08-07 | 100755 |    0.1353 |
|  1 | week 2023-08-07 | 100822 |    0.1226 |
|  2 | week 2023-08-14 | 100755 |  257.881  |
|  3 | week 2023-08-14 | 100822 |   83.8    |
|  4 | week 2023-08-14 | 100823 |   44.5931 |
|  5 | week 2023-08-14 |    nan |   27.0419 |
How would I make a column that is "last period cost" (for the same cc)?
So add to row 2 a column last_cost that reads 0.1353 (same period+cc).
Feels kindof like diff() but I can't wrap my head around that one...
half lintel
or rolling()? breaks my brain
weak mortar
good evening. i had some data of 4 columns which was stored as a string inside a single cell in a dataframe. so when i try and extract it, i end up with a single column item. the text looks neatly in rows when printed, but i have to seperate it into appropriate columns. any nice tips and tricks on how to do that ?
pandas
desert oar
calm gulch
I think thats right, but join can handle duplicate indices, iirc concat errors i...
that's good to know, i avoid duplicate indexes at all costs so i don't know what operations do and don't work well with it
i just know that occasionally i get some error about duplicate indexes and when that happens i know i messed something up
weak mortar
weak mortar
good evening. i had some data of 4 columns which was stored as a string inside a...
i just set pandas.set_option('display.max_colwidth', None) , then i can now see that it appears all lines are seperated with \n
left tartan
half lintel
Is it OK to ask a pandas question here? I'm fairly experienced python, but new ...
So, you want the last value for each period "group"?
desert oar
half lintel
Is it OK to ask a pandas question here? I'm fairly experienced python, but new ...
maybe df.groupby("cc")["last period cost"].shift(1) or something like that?
left tartan
.last, not shift, I think.
desert oar
yeah i wonder if "last" means "previous", or actually "last"
from the example i interpreted it to mean previous
left tartan
Oh, and the example is ambiguous.
but I think you meant: df.groupby("period")["cc"].shift(1) (or .last)
half lintel
Soo confused 😉
left tartan
half lintel
Soo confused 😉
The operation we think you're looking for is "groupby". That allows you to group rows by some common field (ie: same period) and do some operation within the group.
Can you clarify what you wanted from this df?
half lintel
I'm already using group-by to "roll up" multiple lines into one, along with a sum() to add up the cost rows.
What I'm looking for is to add a column which is a % diff to the previous period for the same cc
Obviously value->% is no big deal
so row 2 would say "cost_change" = (257.881-0.1353) (the value in the previous period, for that cc)
is it possible to share a jupyter workbook using the online thingy? (like I said, super new to pandas/numpy etc)
If it was all python, I'd do something like:
# make a list of periods, so we can look up the "previous" one
periods = df['period'].unique()
for row in rows:
  prev_period = periods[ index of row.period in periods - 1 ] # deal with edge case
  row['prev_cost'] = rows[prev_period][row['cc']]
  calculate % etc
df["new column name"] = df.loc["what u want to"] x df.loc["calculate like this"] or whatever logic u need to do 🙂
loc locates the header name so you can calculate it, and by calling the df with a col name that doesnt exist, you create a new col
left tartan
half lintel
so row 2 would say "cost_change" = (257.881-0.1353) (the value in the previous...
Oh. Hah. When you said row 2 in the original example, I looked at the second row. Not index=2
left tartan
Yah, I gotcha
half lintel
I want "cost from previous period, for the current cc"
left tartan
It's a groupby().last() plus a shift to get the previous
half lintel
🤯
left tartan
So, you build a new df (groupby) that is: period, last_value ... then use shift to get period, last_value, previous_value
half lintel
I feel like I'm so far from understanding that sentence
left tartan
Can you share the df?
half lintel
Yeah man.
I'm loading it with
df = (pd.read_csv("test.csv", index_col=0)
      .astype({
                  'project_number': 'Int64',
              })
      .drop(columns='project_number')
      )
Then making the data I showed by
df2 = df.groupby(['period', 'cc'], dropna=False).sum('cost')
Now I want to add the previous_cost column (then I can add %change column)
Sometimes previous cost will be not-found/nan then we can use 0
left tartan
Something like: ```py
import pandas as pd
import numpy as np
data = {
'period': ['week 2023-08-07', 'week 2023-08-07', 'week 2023-08-14', 'week 2023-08-14', 'week 2023-08-14', 'week 2023-08-14'],
'cc': [100755, 100822, 100755, 100822, 100823, np.nan],
'cost': [0.1353, 0.1226, 257.881, 83.8, 44.5931, 27.0419]
}
df = pd.DataFrame(data)
period_df = df.groupby("period")["cost"].last().reset_index()
period_df["last_cost"] = period_df["cost"].shift(1)
print(period_df)
Sec. I'm trying in jupyter thingy - easier than my ide
left tartan
import pandas as pd
import numpy as np

df = pd.read_csv(r"yourfile.csv")

period_df = df.groupby("period")["cost"].last().reset_index()
period_df["last_cost"] = period_df["cost"].shift(1)
print(period_df)```I think that's missing the "find previous with the same CC bit"
The groupby makes a df of period-cost which shows the last in each period.
left tartan
Oh, is period-cc unique?
half lintel
yes, it was grouped-by before that
df2 = df.groupby(['period', 'cc'], dropna=False).sum('cost')
to make a period+cc+cost table
half lintel
there might be gaps also. I need the cc from the previous period, or 0 if it was missing.
Sorry I'm very new at this
left tartan
thats fine, this stuff is fun
half lintel
I alrady have a python solution for this, but I'm trying to do it in pd for learning
left tartan
import pandas as pd
import numpy as np

df = pd.read_csv(r"test.csv")
df = df.sort_values('period')
df['last_cost'] = df.groupby('cc')['cost'].shift()
display(df)
oh, wait, ok its good
I'll show you how I'd really have done this tho:
half lintel
in python I made a dict of [period][cc]->cost
then looped through the rows and did item['previous_cost'] = costs.get(previous_period, {}).get(key, 0.0)
The values happen to already sorted by period fwiw
the data actually comes from bigquery
desert oar
there is also a diff method, which you pointed out. so within each group you want something like y.diff() / y right?
left tartan
half lintel
in python I made a dict of [period][cc]->cost
then looped through the rows and d...
Your test.csv has duplicates for cc and period, so make sure you're using the right input df.
half lintel
you missed a step - I groupby() the dataset to make the period+cc df
df = df.groupby(['period', 'cc'], dropna=False).sum('cost')
to sum up all the sku for the same period+cc
left tartan
And, my unhelpful and unaskedfor solution: ||```py
import duckdb
duckdb.execute("select *, lag(cost) over (partition by cc order by period) as last_cost from (select period, cc, sum(cost) as cost from 'test.csv' group by period, cc) order by period, cc").df()
I thin your code works?
df['last_cost'] = df.groupby('cc')['cost'].shift()
but it might just be lucky because there's no gaps?
left tartan
half lintel
but it might just be lucky because there's no gaps?
What do you mean by gaps?
half lintel
Like if there was no cc 100822 for one week. the "previous" for the next week would be 0 not from the week before.
I guess "previous" means precisely the previous period, not the "the last one we had"
Also it doesn't look like it's handling NAN (missing cc) properly
left tartan
half lintel
Like if there was no cc 100822 for one week. the "previous" for the next week ...
Hmm. I guess you could zero it out if the gap between previous period and current period was > 7 days?
But you'd want to convert period to dates first.
half lintel
I'd be happy to find all the valid cc, and make every period have all the cc (zero if it wasn't in the dataset)?
There won't be weeks missing, just missing some cc in a particular week.
FWIW I run the same report on days, and months, so "period" is just a generic name for whichever value was selected from the datasource
DAY_FORMAT = "FORMAT_DATE('%Y-%m-%d', usage_start_time)"
WEEK_FORMAT = "FORMAT_DATE('week %Y-%m-%d', date_trunc(usage_start_time, WEEK(MONDAY)))"
MONTH_FORMAT = "FORMAT_DATE('month %Y-%m', date_trunc(usage_start_time, MONTH))"
Yah, I've done that before, but it's a bit clunky.
half lintel
I've got a biggish sql query that is injected with a bit of SQL that provides the "period" data...
FWIW
BILLING_REPORT_SQL = f'''
    SELECT
      {{period_sql}} as period,
      project.name project_name,
      project.id project_id,
      project.number project_number,
      IF(labels.value is NULL, pl.value, labels.value) AS cc,  -- resource CC label if present, else project CC label,
      sku.description sku_description   ,
      ROUND(SUM(cost),4) AS cost
    FROM
      `{BILLING_PROJECT}.{BILLING_DATASET}.gcp_billing_export_v1_{BILLING_ACCOUNT_ID}`
    LEFT JOIN UNNEST(labels) AS labels ON labels.key = "cost-centre"
    LEFT JOIN UNNEST(project.labels) AS pl ON pl.key = "cost-centre"
    WHERE cost > 0.01
    {{extra_where}}
    GROUP BY period, project_name, project_id, project_number, cc, sku_description
    ORDER BY period, project_name, sku_description
'''
Yah, I've done that... I think it's nicer to look at the time delta, personally
half lintel
Then I do something like
sql = BILLING_REPORT_SQL.format(period_sql=period_sql, extra_where='')
left tartan
Like, you can do this: df[['last_cost', 'last_period']] = df.groupby('cc')[['cost', 'period']].shift()
half lintel
The client wanted "weekly" and "monthly" reports, and need to know for which period it applies
left tartan
And then set any with too large a gap to na... hey, I've got to run, good luck!
half lintel
I got "no such column period".
But thanks!
Yeah, that code doesn't handle missing period|cc (it gets the wrong period).
serene scaffold
@left tartan check your message requests btw
half lintel
how to delete a row where the index has >1 column/value?
left tartan
serene scaffold
<@738234281146712084> check your message requests btw
I responded to only one I had?
Hah, went to spam
half lintel
eg: I did a group_by on period+cc, then I want to delete one of those to make a gap?
If I use as_index=false then I can do df.drop(7)
But if I use as_index=True then Iwant to deltee row with period=week 2023-08-21 and cc= 100822 for example
df.drop(df[(df['period'] == 'week 2023-08-21') & (df['cc'] == 100823)].index, inplace=True)
Only works if period and cc are real columns, not part of the index.
nm found it df.drop(('week 2023-08-21', 100822), inplace=True)
cool. can add missing values with df.unstack(fill_value=0).stack()
FWIW this all seems to work:
df = (pd.read_csv("test.csv", index_col=0)
      .astype({
                  'project_number': 'Int64',
                  'cc': 'Int64',
              })
      .drop(columns='project_number')
      .groupby(['period', 'cc'], dropna=False) # or as_index=False
      .sum('cost')
      # .drop(('week 2023-08-21', 100822)) # test zero-bill below
      .unstack(fill_value=0).stack() # fill missing period/cc with zeros
      .reset_index()
      )

df['previous_cost'] = df.groupby('cc', dropna=False)['cost'].shift()
df['cost_change'] = df['cost'] / df['previous_cost'] - 1
df
Which creates
    period    cc    cost    previous_cost    cost_change
0    week 2023-08-07    100755    0.1353    NaN    NaN
1    week 2023-08-07    100822    0.1226    NaN    NaN
2    week 2023-08-07    100823    0.0000    NaN    NaN
3    week 2023-08-07    <NA>    0.0000    NaN    NaN
4    week 2023-08-14    100755    257.8808    0.1353    1904.992609
5    week 2023-08-14    100822    83.8000    0.1226    682.523654
6    week 2023-08-14    100823    44.5931    0.0000    inf
7    week 2023-08-14    <NA>    27.0419    0.0000    inf
8    week 2023-08-21    100755    1474.9293    257.8808    4.719423
9    week 2023-08-21    100822    506.6815    83.8000    5.046319
10    week 2023-08-21    100823    234.4571    44.5931    4.257699
11    week 2023-08-21    <NA>    166.5320    27.0419    5.158295
12    week 2023-08-28    100755    835.2005    1474.9293    -0.433735
13    week 2023-08-28    100822    258.4479    506.6815    -0.489920
14    week 2023-08-28    100823    130.3564    234.4571    -0.444007
15    week 2023-08-28    <NA>    99.1262    166.5320    -0.404762
ANy style/coding suggestions?
eg: use of chaining, or not?
PS: what's the best file format to use when saving/loading a dataframe (if you don't need interop). Seems like CSV is a little bit awkward with typing, and suppressing the auto-index.
desert oar
half lintel
PS: what's the best file format to use when saving/loading a dataframe (if you d...
Parquet
half lintel
do any of those cooler formats work on jupyter.org? I couldn't figure out how to do imports
weak mortar
lol kind of funny i literally just asked my friend chatgpt the same question
about CSV files. i saved some dataframes, and spend many effors cleaning the data to use it again afterwards
apart from parquet it suggest hdf5
i had some smaller dataframes inside some cells of the dataframe, it seems they all got stripped down to first 5 and last 5 rows after exporting to csv. not an every day situation to have tables inside tables, but this library i am using is doing it like that
they really fooled me by including the amount of rows, so every time i printed out to terminal, i thought all data was there 😂
 serene scaffold
@weak mortar you should never have nested pandas objects--you probably want to use multiindexing in some way
 whole tendon
does anyone know how to solve this error: "C:\Python311\python.exe C:/Users/ashee_mpie0zd/PycharmProjects/pythonProject/HandWritingRecognition.py
Traceback (most recent call last):
File "C:\Users\ashee_mpie0zd\PycharmProjects\pythonProject\HandWritingRecognition.py", line 11, in <module>
mnist = tk.datasets.mnist
^^^^^^^^^^^
AttributeError: module 'tensorflow.python.keras' has no attribute 'datasets'"
I can give the code if you want
serene scaffold
whole tendon
does anyone know how to solve this error: "C:\Python311\python.exe C:/Users/ash...
What version of tensorflow are you using? And why did you import it as tk and not tf?
whole tendon
I am using version 2.13.0
Also for tk, I did this command "import tensorflow.python.keras as tk". I was just playing around with the code to solve the error
serene scaffold
Try doing
from tensorflow.keras.datasets import mnist
whole tendon
yeah sure
When I try that, I get this error: Traceback (most recent call last):
File "C:\Users\ashee_mpie0zd\PycharmProjects\pythonProject\HandWritingRecognition.py", line 7, in <module>
from tensorflow.python.keras.datasets import mnist
ModuleNotFoundError: No module named 'tensorflow.python.keras.datasets'
tensorflow.keras.datasets does not work for some reason
it says tensorflow does not have keras
serene scaffold
Not sure what to do, then. I'm reading this https://keras.io/api/datasets/mnist/
 whole tendon
yeah thanks for the help though
Is there a way to fix this issue though: "Traceback (most recent call last):
File "C:\Users\ashee_mpie0zd\PycharmProjects\pythonProject\HandWritingRecognition.py", line 7, in <module>
from tensorflow.keras.datasets import mnist
ModuleNotFoundError: No module named 'tensorflow.keras'"
I have already tried to uninstall and install tensorflow
Can it be an issue with my python installation or something like that
serene scaffold
Maybe you need to install keras separately
I'm a pytorch user
whole tendon
it says the requirement is already satisfied
serene scaffold
And yet I'm not satisfied
 potent sky
whole tendon
it says the requirement is already satisfied
potent sky
whole tendon
it says the requirement is already satisfied
What version of tf are you using?
whole tendon
2.13.0
potent sky
iirc, From 2.13.0 onwards the recommended import mechanism is back to importing keras separately
whole tendon
so how does the code work for that then
potent sky
Not through tensorflow.
As keras was shifted to a separate python package again
Just import keras should work
potent sky
whole tendon
Thank you
Not a problem! Try if it works
whole tendon
Yeah it showed this error again: Traceback (most recent call last):
File "C:\Users\ashee_mpie0zd\PycharmProjects\pythonProject\HandWritingRecognition.py", line 6, in <module>
from keras.datasets import mnist
File "C:\Python311\Lib\site-packages\keras_init_.py", line 3, in <module>
from keras import internal
File "C:\Python311\Lib\site-packages\keras_internal__init_.py", line 3, in <module>
from keras.internal import backend
File "C:\Python311\Lib\site-packages\keras_internal_\backend_init_.py", line 3, in <module>
from keras.src.backend import initialize_variables as initialize_variables
File "C:\Python311\Lib\site-packages\keras\src_init.py", line 21, in <module>
from keras.src import models
File "C:\Python311\Lib\site-packages\keras\src\models_init_.py", line 18, in <module>
from keras.src.engine.functional import Functional
File "C:\Python311\Lib\site-packages\keras\src\engine\functional.py", line 23, in <module>
import tensorflow.compat.v2 as tf
ModuleNotFoundError: No module named 'tensorflow.compat'
potent sky
whole tendon
I see. Sorry I am new to Machine Learning and all these packages
tbh it has been very messy recently with tf and keras going their separate ways again, all of us are annoyed
whole tendon
I totally see why it has been messy
potent sky
potent sky
tbh it has been very messy recently with tf and keras going their separate ways ...
Made me finally pivot to pytorch as my default choice, I was a big supporter of tf lol
potent sky
whole tendon
Yeah it showed this error again: Traceback (most recent call last):
File "C:\U...
I suppose keras is importing properly now
Try importing import tensorflow as tf and import keras before doing any other imports ig
It may be a module initialisation problem
The recent tf import mechanism changes have been very messy and opinionated imo
.
 sleek harbor
do u use scipy, pingouin, or smth else for hypothesis testing?
 past meteor
sleek harbor
do u use scipy, pingouin, or smth else for hypothesis testing?
past meteor
sleek harbor
do u use scipy, pingouin, or smth else for hypothesis testing?
scipy or ... R
There's some more niche statistical tests that only have very suspicious Python implementations
 wooden sail
naturally you write your own using numpy
abstract wasp
Have any of you guys ever made any AI agents with reinforcement learning?
I saw this AI wars vid. on YT and I wanna replicate something like that, looks so cool.
 worldly dawn
abstract wasp
Have any of you guys ever made any AI agents with reinforcement learning?
I saw ...
worldly dawn
abstract wasp
Have any of you guys ever made any AI agents with reinforcement learning?
I saw ...
it may help to be a bit more specific
past meteor
abstract wasp
Have any of you guys ever made any AI agents with reinforcement learning?
I saw ...
I've dabbled with RL but on toy examples and Nethack. Do you have any specific questions?
abstract wasp
worldly dawn
it may help to be a bit more specific
This is the video I saw:

In this vide YOU are the ones training the A.I!
I have tried several suggestions that you have made in the comments underneath previous Epic AI Wars videos and attempted to implement them, comparing the result. Let’s see if your A.I modifications are and improvement or not!
★Patreon: https://patreon.com/zuzeloapps
★Discord: https://discord.g...
past meteor
What tends to make these vids look good isn't even the AI but the rendering of the agents imho
abstract wasp
past meteor
I've dabbled with RL but on toy examples and Nethack. Do you have any specific q...
I see
For something like the video from above, how do you think I should go about it? For me to replicate something like that. I’ve never worked with RL.
abstract wasp
past meteor
What tends to make these vids look good isn't even the AI but the rendering of t...
Oh
past meteor
sutton & barto's book reinforcement learning: an introduction is always a must read and it's free
abstract wasp
past meteor
sutton & barto's book reinforcement learning: an introduction is always a must r...
Ohh, ok, thanks!!
worldly dawn
abstract wasp
This is the video I saw:
https://youtu.be/KBx2ehxG66k?si=oIEkxKHWNDYUAQ0p
I also do similar things with genetic algorithms.
At the end of the day, it's a matter of:
- Setting up an environment with godot/unity/etc.
- Having agents which can learn based on whatever family of algorithm, you want
The video does mention specifically PPO. So catching up on that (ex: https://towardsdatascience.com/proximal-policy-optimization-ppo-explained-abed1952457b?gi=9ff168a4102b ) would be a good idea if you want to use the same route
 tawdry gyro
Hey! I have a question.
I want to have both Julia cells and Python cells in the same notebook. Is this possible? I can change kernals between running julia and python, but is there a way to specify which cell to use which kernel. I tried using magic functions but it says that they are not recognised
%%julia
print("Hello from Julia")
 cunning agate
why we use the derivative to calculate the gradient descent in the other hand we don't use it in slope calcualtion
small wedge
cunning agate
why we use the derivative to calculate the gradient descent in the other hand we...
Wdym we don't use it in slope calculation?
The derivative of a function F is the function that gives you the slope of that function F at any point where it has one. We do use it in slope calculation.
left tartan
tawdry gyro
Hey! I have a question.
I want to have both Julia cells and Python cells in the ...
Huh, that's a good question. Never tried. But if it doesn't recognize %%julia, did you %load_ext julia.magic first ?
tawdry gyro
left tartan
Huh, that's a good question. Never tried. But if it doesn't recognize `%%julia`,...
UnsupportedPythonError: It seems your Julia and PyJulia setup are not supported.
Probably I didn't download something?
left tartan
There's more to that message, right?
tawdry gyro
tawdry gyro
https://paste.pythondiscord.com/2NKA
This is the error I get
left tartan
tawdry gyro
This is the error I get
Did you run the commands that it tells you to run?
tawdry gyro
This is the error I get when I run the command you tell me to run
Now I change some stuff
I used julia.install()
(Chat GPT told me so)
And now I ran what you told me again
And I am waiting
But it's really slow
Btw is it possible to make a new window for my JupyterLab console?
tawdry gyro
left tartan
Did you run the commands that it tells you to run?
Oh
Now it works
Nice
Thank you!
left tartan
Pro tip is: carefully read the error messages. They're sometimes hard, but usually give you exactly what you need.
 paper cove
Hello there community, i am totally new to Python language but i know few steps.
Can someone guide me? I mean give me some tips to engage in this universe.
Kind regards
serene scaffold
paper cove
Hello there community, i am totally new to Python language but i know few steps....
!resources data science
 arctic wedgeBOT
Resources
The Resources page on our website contains a list of hand-selected learning resources that we regularly recommend to both beginners and experts.
 unkempt quail
Hey I am learning machine learning in python, using tensor flow and scikit learn. How to get a job as a beginner?
young granite
unkempt quail
Hey I am learning machine learning in python, using tensor flow and scikit learn...
do an internship in which u show dedication and try to build a network, but we got a separate channel for that #career-advice
unkempt quail
young granite
do an internship in which u show dedication and try to build a network, but we g...
How to get an internship?
proven vector
left tartan
Pro tip is: carefully read the error messages. They're sometimes hard, but usual...
I carefully paste error messages into chatgpt cuz error messages make my eyes hurt
left tartan
proven vector
I carefully paste error messages into chatgpt cuz error messages make my eyes hu...
I'll give you a dad answer: you're hindering your learning by doing that. At least try to decipher the message first. It's an important skill.
Just depends on your goal. Is your goal to make it work, or is your goal to be a great programmer.
young granite
proven vector
I carefully paste error messages into chatgpt cuz error messages make my eyes hu...
use jupyter the tracebacks are super nice 🙂 (showing line where error results etc.)
wooden sail
that's not really a jupyter thing though
or do you mean that it filters out the rest?
young granite
i mean there are great expansions but i like jupyter tracebacks the most by default
proven vector
left tartan
Just depends on your goal. Is your goal to make it work, or is your goal to be a...
I dunno most of my error messages are multiple pages long about not where my code borked but where the flask app that google app engine generated to run the code borked.
In my mind kind a great programmer is some one who can open the error log and get back out with the right game plan quickly not some one who spends an hour skimming the logs to find the one useful nugget
left tartan
proven vector
I dunno most of my error messages are multiple pages long about not where my cod...
Oh, true... I'm really talkinga bout the second part: just learning how to skim it. I often spend a few seconds with a log, and if I don't get what I need, I add some more logging to narrow it down.
proven vector
Find proto payload if it's Chinese or talkin about flask then chatgpt that bitch if it's a buncha karats mad that I forgot a comma then just go fix it is usually my error message life
I don't even think I have a python interpreter on my work pc cuz there's so much google crap I work in
abstract wasp
worldly dawn
I also do similar things with genetic algorithms.
At the end of the day, it's a...
Thank you!!
 river echo
Hello all I am taking an applied Ml class and was wondering if someone can look at my response
and tell me if i sound stupd
serene scaffold
river echo
Hello all I am taking an applied Ml class and was wondering if someone can look...
well, show what it is that you want to have reviewed--don't wait for a commitment
half lintel
Is it possible/reasonable to add a custom method to dataframe so you can chain your own steps? Otherwise what's a good way to reuse a bunch of steps?
Right now doing:
df = add_extra_stuff(df)
but would be nicer to chain?
serene scaffold
half lintel
Is it possible/reasonable to add a custom method to dataframe so you can chain y...
you can always chain functions that take the entire dataframe with the .pipe method
half lintel
ok cool will look
serene scaffold
half lintel
ok cool will look
be sure that you're still leveraging built-in, vectorized methods as much as you can, or you're missing out on all the performance benefits.
half lintel
I'm totally noob, so I'm probably not
serene scaffold
basically, resist the temptation to use .apply or loops as much as you possibly can.
half lintel
Is .assign bad too? To add columns to a df?
serene scaffold
assign is fine.
half lintel
Is this ok? Given a df with a bunch of rows, that are rolled up by the first groupby
    r2 = (df
          .groupby(['period', 'cc'], dropna=False)
          .sum(numeric_only=True)
          .unstack(fill_value=0).stack()  # fill missing period/cc with zeros
          .assign(previous_cost=lambda x: x.groupby('cc', dropna=False).cost.shift())
          .assign(cost_change=lambda x: x.cost / x.previous_cost - 1)
          .reset_index()
          )
yes, because the lambda is using pandas methods, rather than applying python code in a python loop
half lintel
Is that the right/best way to do that kind of summary of a df?
serene scaffold
not sure what you mean
.unstack(fill_value=0).stack() # fill missing period/cc with zeros -- are you not doing .fillna(0) on purpose?
half lintel
the unstack/stack actually adds rows where they dont exist for elements within the index (one of which is a time period)
otherwise the upcoming shift() would fine the previous row, which is not necessarily "last week"
serene scaffold
I see
left tartan
half lintel
Is this ok? Given a df with a bunch of rows, that are rolled up by the first gr...
Wow, you’ve come a long way since yesterday!
half lintel
eg: (period, cc, cost)
wk1 abc $1
wk2 xyz $2
wk3 abc $3
Without the unstack/stack, the "previous period" for wk3 would be wk1, when it should really be wk2 cost=$0
Thanks for your help yesterday @left tartan 🙂
left tartan
The unstuck/stack is a nice solution. I was going a diff route, but that works: unless there’s an entire gap in the period (not a single entry for the period)
desert oar
half lintel
Is this ok? Given a df with a bunch of rows, that are rolled up by the first gr...
this looks great
half lintel
left tartan
The unstuck/stack is a nice solution. I was going a diff route, but that works: ...
I don;t think that can happen. It's a billing report,and there's always some cost...
thanks guys.
I've got two more "reports" to write, just trying to figure out how to reduce duplicate code between them. pipe() might be the way
desert oar
@half lintel in the future you can also use a join instead of the stack/unstack trick. idk if one is better but it's another option
desert oar
half lintel
I've got two more "reports" to write, just trying to figure out how to reduce du...
extract the logic to functions
or just copy paste. duplicate code isn't inherently bad
half lintel
see my previous question, someone suggested .pipe() to allow chaining
desert oar
it's better to write it twice and figure out the common parts afterwards
half lintel
all the reports need to do the same cost/previous-cost thing; just need to get the data/index lined up before I run that bit
river echo
serene scaffold
well, show what it is that you want to have reviewed--don't wait for a commitmen...
oh sorry I just was not sure if this was the right channel
desert oar
ah yeah that's perfect for a function. you don't need pipe of course but if you like the chaining style go for it
half lintel
Just need to figure out how to add an explicit index now, since I've got a column that shouldn't be denormalised in this report.
df is so powerful. Needed to remove all zero-cost rows
.query('cost > 0.00')
So nice
bbl
 ionic dirge
Hi, what small and simple projects can one build that has to do with AI and how can one get started?
weak mortar
so i was crying a bit about that my csv wasnt including all my nested data inside cells. i looked more into it and i can conclude that if any dataframe or list inside of a cell has more than 99 rows, it will be shortened to first and last 5 rows. just if anyone was wondering how many rows they can put inside a cell ':')
left tartan
I think you’re just seeing the display limit, you can disable it with: pd.set_option('display.max_rows', None)
weak mortar
no it is true, i check in the csv files
i cant say if its a limit in pandas or in the csv exporter
left tartan
For an novice, maybe https://www.kaggle.com/learn. If you’re more intermediate with Python: like cs50 for ai, which has a number of interesting projects: https://cs50.harvard.edu/ai/2023/
left tartan
weak mortar
no it is true, i check in the csv files
You’ll have to share code. You’re not hitting a limit in pandas, or pandas.to_csv
weak mortar
alright, maybe it is the concat function that imposes the limit then. i turned off for today, but you can see an example ss of the csv

anyways, its not something i will pursue too much, im just extracting the data properly and reconstructing it
left tartan
weak mortar
alright, maybe it is the concat function that imposes the limit then. i turned o...
That tells me there’s an error in your code.
You’re taking the string representation of a dataframe and writing it to file, I believe
Instead of using df.to_csv
So, the …’s are because of the display limit I mentioned earlier
weak mortar
i am saving the dataframe directly with to_csv
left tartan
That’s not what that screenshot is showing, if that screenshot is showing your csv.
Somewhere you’re taking string representations of the df. That’s what that screenshot shows.
pale hemlock
good evening
weak mortar
maybe it is string... i dont know what it is. i wish i knew more so i could tell you. but i could make it to a df directly with .to_frame
yea definitely a string
 left tartan
weak mortar
maybe it is string... i dont know what it is. i wish i knew more so i could tell...
left tartan
weak mortar
maybe it is string... i dont know what it is. i wish i knew more so i could tell...
You’ll have to share code. You are definitely taking the str repr of a dataframe and storing it.
desert oar
half lintel
df is so powerful. Needed to remove all zero-cost rows
` .query('cos...
note that the more standard pandas way to do this would be df.loc[df["cost"] > 0.0 although query is very cool
weak mortar
yeah im off for today. if it gets necessary i will, thanks. i think that im able to convert it to proper df with to_frame
desert oar
half lintel
Just need to figure out how to add an explicit index now, since I've got a colum...
like .set_index(mycol, append=True)?
 lavish ember
I am trying to understand minimax algorithm by building tic tac toe game. I have implemented the algorithm but the problem is that I get None when i call Agent.best_action() I can't understand why. It is also painful to debug because upon loggin out the terminal case there were 29592 total such cases.
Here is the code for Agent
https://paste.pythondiscord.com/K4QA
abstract wasp
Yo, I need advice 😭
So I am doing this project with my friend and basically my end of the project consists of me building an AI that with an image, the AI will be able to make estimates of the location where it was taken, the time it was taken, and the date. There are basically no datasets ready with all this info. to train the AI but Ik there are some datasets with just the time or date or location. What would be the easiest way to go about this? Use diff. datasets or just make my own with all the info. and train the AI with that?
And do you guys have a rough idea on how I should structure the AI?
 tender sandal
Use both
Your own and different too
tender sandal
abstract wasp
Yo, I need advice 😭
So I am doing this project with my friend and basically my ...
Best way to do that is to introduce the AI to as many databases as you can.
abstract wasp
tender sandal
Best way to do that is to introduce the AI to as many databases as you can.
Ik transfer learning exists but tbh Idk much about it or how to work with it.
You'd build an RNN for the time and date, I'm guessing, and a CNN for the image itself?
abstract wasp
tender sandal
But they're not much efficient.
Ok, so what do you recommend?
tender sandal
Better use only CNN for both.
Will take some time but it will ensure that the AI has no problems
And atleast it doesn't need to refer to all datasets each time something is required to be done
abstract wasp
tender sandal
Better use only CNN for both.
Do you know about a model I can possibly use or how do you recommend I should build it?
tender sandal
abstract wasp
Do you know about a model I can possibly use or how do you recommend I should bu...
To create an AI that can approximate the location, time, and date when an image was taken, you'll want to build a system that combines several technologies, including image analysis, metadata extraction, and possibly machine learning. Here's a general approach you can follow:
-
Data Collection: Gather a large dataset of images along with their corresponding metadata (e.g., GPS coordinates, timestamps, and image content). You can find such datasets online or create your own.
-
Preprocessing: Extract relevant metadata from the images. This includes GPS coordinates (if available), timestamps, and any other available information.
-
Feature Extraction: Use image processing techniques to extract features from the images. You can employ computer vision models like Convolutional Neural Networks (CNNs) to extract visual features from the images.
-
Metadata Parsing: Parse the extracted metadata to separate the location, time, and date information.
-
Machine Learning: Train a machine learning model (e.g., a neural network or a random forest) to predict the location, time, and date based on the extracted image features and metadata. This could involve regression for numerical prediction (e.g., latitude and longitude), and classification or regression for time and date.
-
Testing and Validation: Evaluate the model's performance using a validation dataset to ensure it can accurately estimate the location, time, and date of images.
-
Deployment: Create a user-friendly interface or application where users can upload images, and your AI system can provide the estimated location, time, and date.
-
Continuous Improvement: Continuously update and fine-tune your model with new data to improve its accuracy.
Tools and libraries you might find useful during this process include TensorFlow or PyTorch for deep learning, OpenCV for image processing, and geospatial libraries for handling location data.
abstract wasp
tender sandal
To create an AI that can approximate the location, time, and date when an image ...
Alright, thanks
tender sandal
👍
tender sandal
abstract wasp
Alright, thanks
Do make sure that the data you use is as accurate as possible, since you wouldn't want your AI to mess up same-looking locations
abstract wasp
tender sandal
Do make sure that the data you use is as accurate as possible, since you wouldn'...
Fs fs thanks!
tender sandal
abstract wasp
Fs fs thanks!
Good Luck 👍
abstract wasp
tender sandal
Good Luck 👍
Thanks
cold osprey
abstract wasp
Yo, I need advice 😭
So I am doing this project with my friend and basically my ...

special ty to stanford students for building this ai and letting me play against it. you can find them here:
michal: https://twitter.com/michalskreta
lukas: https://twitter.com/lkshaas
silas: https://twitter.com/SilasAlberti
& as always ty to lion for his ai: @TraversedTV
edited by: rawcrruz (linktr.ee/rawcruz)
cold osprey
tender sandal
To create an AI that can approximate the location, time, and date when an image ...
is this chatgpt lol
tender sandal
cold osprey
is this chatgpt lol
What else do you think it was?
cold osprey

left tartan
tender sandal
What else do you think it was?
Please don’t post chatgpt responses, it’s against the #rules
tender sandal
left tartan
Please don’t post chatgpt responses, it’s against the <#693837295685730335>
Alright, but just so you know, this isn't a Copy/Paste from ChatGPT, I took some information, that's it, the rest, I wrote it myself. Anyways, I'll keep that in mind, thanks.
 mint palm
Hi,
Whats the best way to do hyperparam tuning?
I have heard to some grid search etc etc, i think there are library also for that, right?
Another issue is my model takes upto 9-10 hours for training once, so what can i do? anything faster then just checking over all possible hyperparam combos?
cold osprey
optuna
 ripe sapphire
You can use paralleization or transfer learning
 silk otter
hi can anyone help me with this,
student performance data set
https://archive.ics.uci.edu/dataset/320/student+performance
Discover datasets around the world!
cold osprey
silk otter
hi can anyone help me with this,
student performance data set
https://archive.ic...
what about it
silk otter
cold osprey
what about it
can yo help me build model on this dataset
about
Predict student performance in secondary education (high school).
cold osprey
lol
silk otter
cold osprey
lol
??
arctic wedgeBOT
8. Do not help with ongoing exams. When helping with homework, help people learn how to do the assignment without doing it for them.
silk otter
cold osprey
read rule 8
there is no rules in website
cold osprey
what website
silk otter
cold osprey
what website
Discover datasets around the world!
cold osprey
lol
silk otter
cold osprey
lol
?
small wedge
silk otter
hi can anyone help me with this,
student performance data set
https://archive.ic...
What have you got so far for your model architecture? Also what exactly are you predicting from this dataset?
past meteor
Architecture? They have ~650 rows and ~30 variables. I hope they are not using a neural net...
small wedge
Oh rip, didn't see that
 thorny lynx
I got this code
import tensorflow as tf
from sklearn.model_selection import train_test_split
import pandas as pd

dataset = pd.read_csv('lungcancer.csv')
x = pd.get_dummies(dataset.drop(['LUNG_CANCER'], axis=1))
y = dataset['LUNG_CANCER'].apply(lambda x: 1 if x == "True" else 0)
tf.
x_train, x_test, y_train, y_test = train_test_split(x, y, test_size=0.2, random_state=42)

model = tf.keras.models.Sequential()
model.add(tf.keras.layers.Dense(units=32, activation="relu", input_dim=len(x_train.columns)))
model.add(tf.keras.layers.Dense(units=64, activation="relu"))
model.add(tf.keras.layers.Dense(units=1, activation="sigmoid"))

model.compile(loss="binary_crossentropy", optimizer='sgd', metrics=['accuracy'])
model.fit(x_train, y_train, epochs=200, batch_size=32)
And I get this error:
File "C:\Users\Utilizador\Documents\AI\main.py", line 16, in <module>
    model.fit(x_train, y_train, epochs=200, batch_size=32)
ValueError: Failed to convert a NumPy array to a Tensor (Unsupported object type int).
btw this is the csv file
past meteor
thorny lynx
I got this code
```python
import tensorflow as tf
from sklearn.model_selection ...
Do you have missing values somewhere
thorny lynx
I dont think so
also ignore that "tf."
this is my current code:
import tensorflow as tf
from sklearn.model_selection import train_test_split
import pandas as pd

dataset = pd.read_csv('lungcancer.csv')
x = pd.get_dummies(dataset.drop(['LUNG_CANCER'], axis=1))
y = dataset['LUNG_CANCER'].apply(lambda x: 1 if x == "True" else 0)
x_train, x_test, y_train, y_test = train_test_split(x, y, test_size=0.2, random_state=42)

model = tf.keras.models.Sequential()
model.add(tf.keras.layers.Dense(units=32, activation="relu", input_dim=len(x_train.columns)))
model.add(tf.keras.layers.Dense(units=64, activation="relu"))
model.add(tf.keras.layers.Dense(units=1, activation="sigmoid"))

model.compile(loss="binary_crossentropy", optimizer='sgd', metrics=['accuracy'])
model.fit(x_train, y_train, epochs=200, batch_size=32)
and my current error:
Failed to convert a NumPy array to a Tensor (Unsupported object type int).
TypeError: Could not build a `TypeSpec` for AGE SMOKING YELLOW_FINGERS ANXIETY PEER_PRESSURE ... SHORTNESS OF BREATH SWALLOWING DIFFICULTY CHEST PAIN GENDER_F GENDER_M
126 51 2 1 1 1 ... 2 1 2 False True
109 53 1 1 1 1 ... 2 1 2 False True
247 67 1 2 1 1 ... 2 1 1 False True
234 77 1 2 1 2 ... 1 1 1 False True
202 74 2 1 1 1 ... 1 2 2 False True
.. ... ... ... ... ... ... ... ... ... ... ...
[247 rows x 16 columns] with type DataFrame
During handling of the above exception, another exception occurred:
File "C:\Users\Utilizador\Documents\AI\main.py", line 16, in <module>
model.fit(x_train, y_train, epochs=200, batch_size=32)
ValueError: Failed to convert a NumPy array to a Tensor (Unsupported object type int).``` somber prism
hello yall ,i got a question, i created a docker image and i pushed it to my docker hub, and when i try to list all the images i got i got 2 images , one local and another with hub name, what happens if i delete both of them ? will the image from the hub deleted too ?
thorny lynx
I dont think this is the right channel for that bud
somber prism
ah ik ik but
thorny lynx
somber prism
ah ik ik but
also idk I never used docker sorry
somber prism
oh ok np
past meteor
thorny lynx
```Exception has occurred: ValueError
Failed to convert a NumPy array to a Tenso...
I'd look at your x_train dataset to be sure if there's no missings and pd.get_dummies parses it correctly for instance I don't know what it does with T/F columns.
thorny lynx
past meteor
I'd look at your x_train dataset to be sure if there's no missings and `pd.get_d...
can I send you my dataset in dm's?
past meteor
If after that it's still not working you can convert everything into a float
Nope, I'm sorry bud you'll have to do it
thorny lynx
how do you want me to do it, I said it's my first time, I never touched tensorflow, I was following a tutorial o.o
thorny lynx
past meteor
Use a Jupyter notebook and actually look at your data
I can look at my data, I have eyes, but how do you expect me to to know if its right or wrong
somber prism
thorny lynx
I can look at my data, I have eyes, but how do you expect me to to know if its r...
try to view how you df looks like after you split your df into x and y
thorny lynx
past meteor
Do you know any Pandas?
no aswell
thorny lynx
somber prism
try to view how you df looks like after you split your df into x and y
aight
past meteor
Neural networks can only take numeric data so if you have any booleans you have an issue.
thorny lynx
past meteor
Neural networks can only take numeric data so if you have any booleans you have ...
I do but I use a lambda to convert them
to 0 and 1
past meteor
Only on your target
Hence why you need to look at your data.
I have no idea what is in X_train.
thorny lynx
do I just print it out?
somber prism
past meteor
Neural networks can only take numeric data so if you have any booleans you have ...
yes yes , but he used pd get dummies on x data b dropping the target feature , but we cant be sure about the x features that are in it , thats why he needs to look it before training the model
past meteor
Print it out, do data.describe(), plot it, ...
somber prism
thorny lynx
change your gender to numeric
thorny lynx
somber prism
change your gender to numeric
OHHH
past meteor
That's what dummies dooes
somber prism
df['GENDER'] = df.GENDER.apply(lambda x : 0 if x == 'M' else 1)
past meteor
No, no
Use a jupyter notebook
Run x = pd.get_dummies(dataset.drop(['LUNG_CANCER'], axis=1))and print out your dataframe
I can't stress enough how important eyeballing your data / trying to make sense of it is. You have to make that reflex.
thorny lynx
so the x printed to the screen is:
X IS AGE SMOKING YELLOW_FINGERS ANXIETY PEER_PRESSURE ... SHORTNESS OF BREATH SWALLOWING DIFFICULTY CHEST PAIN GENDER_F GENDER_M
0 69 1 2 2 1 ... 2 2 2 False True
1 74 2 1 1 1 ... 2 2 2 False True
2 59 1 1 1 2 ... 2 1 2 True False
3 63 2 2 2 1 ... 1 2 2 False True
4 63 1 2 1 1 ... 2 1 1 True False
.. ... ... ... ... ... ... ... ... ... ... ...
304 56 1 1 1 2 ... 2 2 1 True False
305 70 2 1 1 1 ... 2 1 2 False True
306 58 2 1 1 1 ... 1 1 2 False True
307 67 2 1 2 1 ... 2 1 2 False True
308 62 1 1 1 2 ... 1 2 1 False True
and the description is:
AGE SMOKING YELLOW_FINGERS ANXIETY ... COUGHING SHORTNESS OF BREATH SWALLOWING DIFFICULTY CHEST PAIN
count 309.000000 309.000000 309.000000 309.000000 ... 309.000000 309.000000 309.000000 309.000000
mean 62.673139 1.563107 1.569579 1.498382 ... 1.579288 1.640777 1.469256 1.556634
std 8.210301 0.496806 0.495938 0.500808 ... 0.494474 0.480551 0.499863 0.497588
min 21.000000 1.000000 1.000000 1.000000 ... 1.000000 1.000000 1.000000 1.000000
25% 57.000000 1.000000 1.000000 1.000000 ... 1.000000 1.000000 1.000000 1.000000
50% 62.000000 2.000000 2.000000 1.000000 ... 2.000000 2.000000 1.000000 2.000000
75% 69.000000 2.000000 2.000000 2.000000 ... 2.000000 2.000000 2.000000 2.000000
max 87.000000 2.000000 2.000000 2.000000 ... 2.000000 2.000000 2.000000 2.000000
and the error is
past meteor
Okay, so you can see that your Gender column now has False and True
thorny lynx
Failed to convert a NumPy array to a Tensor (Unsupported object type int). at model.fit(x_train, y_train, epochs=200, batch_size=32)
thorny lynx
past meteor
Okay, so you can see that your Gender column now has False and True
should I apply the lambda?
past meteor
You should use scikit learn to make your dummy variables actually. from sklearn.preprocessing import OneHotEncoder
thorny lynx
how would that work, I dont even know whats a dummie is man I was following a damn tutorial
past meteor
You should most likely do that to most of your variables. You might have data that are numbers but they're categories
thorny lynx
I dont really get what you want me to do, Im a noob at this
past meteor
Don't take this the wrong way but what do you want? Do you want a script that runs without errors or do you want to do something that is correct
thorny lynx
past meteor
Don't take this the wrong way but what do you want? Do you want a script that ru...
I just want something that works
past meteor
Then someone else can take it from here
thorny lynx
aight, so that's a no for me, no else is gonna help im pretty sure, ill just abandon this project
somber prism
thorny lynx
aight, so that's a no for me, no else is gonna help im pretty sure, ill just aba...
work with yourself , if you really want to improve ( honest tip )
thorny lynx
also
past meteor
Like, data projects require you to really think about what you're doing. Getting the errors out is just a small part of it. Your script will run but the results will be wrong technically speaking
somber prism
when you figure out the issue youself , you can actually learn more and handle it well next time if it occurs
past meteor
You can get the thing to run by just using a lambda to turn M/F into 0/1
thorny lynx
somber prism
work with yourself , if you really want to improve ( honest tip )
I dont think you guys get something, I've googled before I messaged here, I dont know what Im doing I didint write this code, its a tutorial, also can someone explain to me why a jupyter notebook is different than just running the code on vs code
past meteor
So many data tutorials are really really bad
A jupyter notebook helps because ideally you do whatever you're doing in steps and at each step you ask yourself "what does this mean"
thorny lynx
past meteor
A jupyter notebook helps because ideally you do whatever you're doing in steps a...
oh alright, cause some code runs on the jupyter notebook but then doesnt in vs code
thats something
past meteor
You can run notebooks in vscoode
thorny lynx
for example:
This code works on the jupyter notebook:
import tensorflow as tf
from sklearn.model_selection import train_test_split
import pandas as pd

dataset = pd.read_csv('lungcancer.csv')
x = pd.get_dummies(dataset.drop(['LUNG_CANCER'], axis=1))
y = dataset['LUNG_CANCER'].apply(lambda x: 1 if x == "True" else 0)
x_train, x_test, y_train, y_test = train_test_split(x, y, test_size=0.2, random_state=42)

config = tf.compat.v1.ConfigProto()
config.gpu_options.allow_growth = True
session = tf.compat.v1.Session(config=config)
tf.compat.v1.keras.backend.set_session(session)

model = tf.keras.models.Sequential()
model.add(tf.keras.layers.Dense(units=32, activation="relu", input_dim=len(x_train.columns)))
model.add(tf.keras.layers.Dense(units=64, activation="relu"))
model.add(tf.keras.layers.Dense(units=1, activation="sigmoid"))

model.compile(loss="binary_crossentropy", optimizer='sgd', metrics=['accuracy'])
model.fit(x_train, y_train, epochs=200, batch_size=32)
Just make a file ending with .ipynb
thorny lynx
but then on my friend vs code I get this error: Failed to convert a NumPy array to a Tensor (Unsupported object type int).
on the model.fit(x_train, y_train, epochs=200, batch_size=32)
oh
the error only goes away in a cloud notebook
ill just do it online
@past meteor something weird is happening, the code is working but the loss is very high and the accuracy is always 1
@somber prism
half lintel
is there any consensus on whether operation-chaining is better/tidier than a bunch of
df = df.something()
And (related question) is there a way to do an optional chaining item? Like an equivlent of
if some_condition:
df = df.something()
desert oar
half lintel
is there any consensus on whether operation-chaining is better/tidier than a bun...
i prefer df = df.something(), easier to debug and refactor
actually that's not true
i tend to write things like join, unstack, loc, apply, groupby, etc together
however i tend to draw the line at pipe as ive mentioned above
unfortunately no there's no optional chaining although you could definitely write a chain_if helper function
would be kind of interesting
half lintel
Google tells me people monkey-patch dataframe to add their own methods anyway, so that would be pretty simple. In my case it's a query() so would add query_if(somecondition, 'period == @report_df.period.max()')
desert oar
i used to do that but realized it was just noodling
once in a while there's actually a method i wish pandas had
but 99% of the time i leave it as a function
half lintel
yeah, I think I'll leave it alone. too much of a landmine for the next guy.
report_df = df.this.that.other.blah.blah
if only_latest:
   report_df = report_df.query('period == @report_df.period.max()')
results[whatever] = report_df.query('more stuff')
Any better way to (optionally) remove all the rows except the ones with the last period?
I don't even know about that .max() - I think copilot wrote it, hahaha
Maybe df.period.iloc[-1]
or .values[-1] ?
desert oar
half lintel
```python
report_df = df.this.that.other.blah.blah
if only_latest:
report_df ...
yeah imo this is good style, just finding the right balance
desert oar
half lintel
I don't even know about that .max() - I think copilot wrote it, hahaha
effective but inefficient. sort by period and then use iloc[-1]
also if period is the index or part of a multiindex that can make lookups fairly efficient
half lintel
I can't guarantee that it's sortable like that. I want to filter to the value in the last row
is df.period.values[-1] inefficient?
changed it to
            if only_latest:
                report_df = report_df.query('period == @report_df.period.values[-1]')
technically the 'period' column might not be sortable because it's a user-selected FORMAT_DATE output string, which might have something like day-of-the-week at the start.
desert oar
half lintel
changed it to
```python
if only_latest:
report_df = ...
does .query support iloc? use that instead of .values
i'm not familiar with .query enough to know how it handles that, but in general .values is deprecated and usually isn't what you want anyway
half lintel
report_df.period.iloc[-1] seems to return the right value
half lintel
Nope. there are multiple rows for each period
half lintel
Looks like it is actually sorted (by db) by period and a couple of other fields...
desert oar
half lintel
Looks like it is actually sorted (by db) by period and a couple of other fields....
i like to explicitly sort my data when this kind of thing is relevant
half lintel
Is there a one-shot way to make a column that looks numeric to be treated as a no-decimal str? Right now I'm doing astype(int64) then astype(str).
Is there a better way?
 unique flame
Do you have to update Cudnn and CUDA toolkit everytime there is a driver update? A few months ago PyTorch was able to use the gpu, but now cuda.isavailable shows False.
weak mortar
Good morning guys. Hows your DataFrames behaving today
 dense sage
half lintel
Is there a one-shot way to make a column that looks numeric to be treated as a n...
dense sage
half lintel
Is there a one-shot way to make a column that looks numeric to be treated as a n...
like this?
df.floats.map(lambda x: str(round(x))
just beware that using int(x) will always round down; it's like using math.floor(x).
half lintel
The numbers are only whole numbers, but they can also be absent
 boreal gale
half lintel
Is there a one-shot way to make a column that looks numeric to be treated as a n...
boreal gale
half lintel
Is there a one-shot way to make a column that looks numeric to be treated as a n...
this is already pretty good, is there anything wrong with this?
half lintel
Just wondering if it could be tighter
boreal gale
imo no
weak mortar
you could also make a filter(or map?) with dtypes exclude but thats probably less tight 🤷
 tropic prairie
is it possible to save weights from the best model found using gridsearchCV?
boreal gale
tropic prairie
is it possible to save weights from the best model found using gridsearchCV?
it should be under the best_estimator_ attribute
scikit-learn
Examples using sklearn.model_selection.GridSearchCV: Release Highlights for scikit-learn 0.24 Feature agglomeration vs. univariate selection Shrinkage covariance estimation: LedoitWolf vs OAS and m...
tropic prairie
I tried this code: best_model = gs.best_estimator_ best_model.save_weights('best_model_weights/best_model_weights.h5')but it gives an attribute error that KerasRegressor object has not attribute 'save_weights'
gs is what I named my GridSearchCV
 verbal oar
hi I want to run jupyter lab but jupyter is not recognized
I installed with pip
dont sure In past I used jyputer notebook
boreal gale
tropic prairie
I tried this code: `best_model = gs.best_estimator_` `best_model.save_weights('...
you need to check the documentation of KerasRegressor then. where is it from?
verbal oar
I saw yt video where they do pip install jupyterlab then jupyter lab and ok but in my case its different
boreal gale
verbal oar
I saw yt video where they do pip install jupyterlab then jupyter lab and ok but ...
what operating system are you using?
do you know how to check if a package is installed with pip?
verbal oar
windows 11
package is installed I tracked instalation
I try to add to path
I have fresh os instalation
because I migrated from ssd to hdd files
maybe its need configuration
ah and also I installed python with windows store maybe I should install in standard way go to site and download as usual?
I typed python in terminal windows store showed and install python
hmm maybe as I read in docs it dont have write access
boreal gale
ah, i recall seeing something about that window store python is bad, i don't know exactly why, i don't use windows
i would uninstall that and go with the official one
small wedge
Windows store python only goes to 3.7
weak mortar
playing the windows XP login sound for you all
 quaint loom
would it somehow be possible to import this photo somewhere and get it in numerical with description?

 quiet pebble
pytesseract
 tacit oyster
this is very simplistic, but after watching the Harvard CS50 AI video, I took what I learnt from it, and wrote an MNIST predictor for the Gameboy: https://twitter.com/gbdev0/status/1697986362467602758?t=s6wKDqLulATbIBmBYjR8gw&s=19

Leina developed a neural network-trained number prediction for #GameBoy
dataset:modified MNIST
accuracy:95% (0 dropout, so overfitted, plus loss of accuracy due to not using 32-bit floats on the GB)
performance:depends on grid spaces filled. This 7 took 2.2 frames
ROM in reply

 Twitter
·
Twitter
·
 nimble peak
half lintel
changed it to
```python
if only_latest:
report_df = ...
nimble peak
half lintel
changed it to
```python
if only_latest:
report_df = ...
if only_latest:
report_df = report_df.loc[report_df['period'] == report_df['period'].iloc[-1]]
abstract wasp
Hi, I'm trying to use the Flickr API to get some data and photos but I get a 400 error, how can I fix it?
do_request: Status code 400 received, content:
oauth_problem=parameter_absent
oauth_parameters_absent=oauth_token
desert oar
abstract wasp
Hi, I'm trying to use the Flickr API to get some data and photos but I get a 400...
400 means your request is malformed, and fortunately in this case they are actually telling you what is missing
 ocean fiber
Hi all, I'm going through some Jupyter notebooks that act as lecture notes for a machine learning course I'm taking in grad school. I'm an experienced coder but fairly inexperienced with Python and all the packages surrounding the work I'm doing. Anyway, this notebook has some code in it that creates an animated plot out of some data. In Jupyter Notebook itself, the code runs fine, but when running in Pycharm, it throws a ValueError: shape mismatch: objects cannot be broadcast to a single shape. Anyone know what the difference might be between the two coding environments that is causing this?
past meteor
ocean fiber
Hi all, I'm going through some Jupyter notebooks that act as lecture notes for a...
Are you sure the .py and .ipynb files are exactly the same code wise?
ocean fiber
Ahaha..I was just checking that. Gonna run the original real fast in pycharm
Ahh darn, your right. must have missed something. Thanks!
It's weird that all the other output is the same. But if I still can't figure it out, I'll hit you guys back up.
past meteor
ocean fiber
Ahaha..I was just checking that. Gonna run the original real fast in pycharm
Did you just copy paste it from the notebook cell by cell into a .py or did you make changes?
ocean fiber
I didn't just copy all of it. Some of it, but not all of it. There very well could be a small mistake somewhere. I guess that is the risk of doing something like that. Next time I do this maybe I'll just straight copy and paste what I want and then make changes after.
The actual plotting functions I did copy and paste though.
past meteor
Happens to the best of us. People, incl myself, tend to abuse global scope in notebooks but make it more principled in .py files so discrepancies are normal
abstract wasp
desert oar
400 means your request is malformed, and fortunately in this case they are actua...
I am trying to authenticate and get a token but I'm not sure why Postman isn't working. Do you how to do it?
serene scaffold
@ocean fiber the nbconvert tool is quite helpful--you can convert a notebook to a regular python program
That being said, pycharm exists independently of your code, so it will never have any effect on the runtime behavior
serene scaffold
past meteor
Happens to the best of us. People, incl myself, tend to abuse global scope in no...
If you're not abusing the global scope, you're probably not actually leveraging any notebook-specific functionality
past meteor
serene scaffold
If you're not abusing the global scope, you're probably not actually leveraging ...
That's the most correct way to put it
serene scaffold
I'm glad we're in agreement on everything today
past meteor
Knowing it's abuse means you can keep it to a minimum though, especially if you're writing something that might need to become #industrygrade #enterprise
past meteor
serene scaffold
I'm glad we're in agreement on everything today
Always!! 🤣
serene scaffold
past meteor
Knowing it's abuse means you can keep it to a minimum though, especially if you'...
Inb4 enterprise notebooks
Got an intern in the back executing a cell every time they need to respond to an API call
past meteor
There's projects (not same imho) that develop in notebooks and use some automated tool to convert it to .py's https://github.com/Nixtla/statsforecast/blob/main/nbs/src/ets.ipynb
GitHub
Lightning ⚡️ fast forecasting with statistical and econometric models. - Nixtla/statsforecast
Sometimes if you see how it's cooked you lose your appetite.
boreal gale
https://github.com/mwouts/jupytext is a good alternative if you think nbconvert is clunky
GitHub
Jupyter Notebooks as Markdown Documents, Julia, Python or R scripts - GitHub - mwouts/jupytext: Jupyter Notebooks as Markdown Documents, Julia, Python or R scripts
serene scaffold
What's wrong with nbconvert?
past meteor
That package was such a disappointment. Did 95 % of what I wanted so I figured I'd read source and make adjustments to the 5 % I needed differently
I'm pretty sure no one can figure out what's going on in there.
boreal gale
serene scaffold
What's wrong with nbconvert?
mostly that i need to write additional things to get keep other representation and the underlying notebook in sync
that and probably two way sync (i.e. i can alter *.py and have it updated in the associated *.ipynb, and vice versa)
unless i am missing critical functionality in nbconvert 🤔
past meteor
Btw am I the only one getting burnt out on the generative AI hype train? It's grant writing time for us right now and it's like it needs to be forced into every project even if it has no clear advantage. Maybe it's just my lab, maybe it's time to jump ship 🤷
 ocean lake
Hey can someone join me in voice chat 0 to review my ML results? I have some strange observations.
This would be of interest to anyone with any confidence in analyzing ml performance - recall specifically.
boreal gale
past meteor
Btw am I the only one getting burnt out on the generative AI hype train? It's gr...
ha - yeah it's generative AI this LLM that these days almost everywhere i look..
it's a little tiring indeed, especially if it's just using the tech just for the sake of it..
boreal gale
past meteor
I'm pretty sure no one can figure out what's going on in there.
what did you want to do btw? (i feel i have been nerd sniped here 👀 )
boreal gale
ocean lake
Hey can someone join me in voice chat 0 to review my ML results? I have some str...
not everyone is comfortable hopping on voice chat spending unspecified amount of time to pair debug, you are certainly welcome to try - i would write up something and post here if you get no bites
ocean lake
I am doing a temporal analysis with 16 test weeks of malicious URLs, stratified by the date that they are reported on URLHaus. A malicious URL can only be TP or FN, so idk why my recall matches the volume of malicious URLs reported each week.

I tripple checked my code
I was hoping for ideas on interpreting the results
past meteor
I think all I wanted to do was be able to set a window of say 3 obs and have ETS move forward like such: [1,2,3] -> 4, [2,3,4] -> 5 all their package does was [1,2,3] -> [4,5,6,7,8,9,10, ...]
 young breach
Hello
ocean lake
boreal gale
not everyone is comfortable hopping on voice chat spending unspecified amount of...
I agree. I'm hoping for any novel ideas if any at all. I have 3 ideas that could explain my results but idk.
past meteor
In the context of my work we may have access to y_true after a (short) delay but it has an impact on the usability of our system. I've been toying with comparing different settings, essentially means playing with the horizon parameter.
young breach
What if I make a program that learns from punishment and rewards?
I give it tasks and tests for example, like exams.
If it gets something wrong, I punish it by removing wrong answers.
past meteor
I think ETS specifically had this but not all of their models. Then it becomes a case of "who do I trust more? Myself or these folk" when deciding if I'll reinvent the wheel and write it from scratch... :/
young breach
young breach
What if I make a program that learns from punishment and rewards?
I give it task...
So?
past meteor
young breach
What if I make a program that learns from punishment and rewards?
I give it task...
Something similar to this exists and it's called reinforcement learning
young breach
Great!
desert oar
abstract wasp
I am trying to authenticate and get a token but I'm not sure why Postman isn't w...
No I don't. Every API is slightly different. You will have to read the official documentation and search around for usage details if something is unclear, or you expected something to work that didn't end up working.
 latent ibex
Hi, would you mind chatting over DM about backtesting in python? Would appreciate your help. Thanks.
latent ibex
This seems like the right chat for backtesting, right?
serene scaffold
What is that?
latent ibex
I'm a professional trader with working strategies that I use manually, however, I realize that I'm not making the most efficient use of them due to not automating some of the processes as well as optimizing the strategies a bit with the help of data.
latent ibex
serene scaffold
What is that?
Backtesting is testing how a trading strategy given specific parameters, would have worked in the past.
serene scaffold
latent ibex
I'm a professional trader with working strategies that I use manually, however, ...
I guess this is the right channel for that, but it's unlikely that you'll find many people to talk about it with
latent ibex
serene scaffold
I guess this is the right channel for that, but it's unlikely that you'll find m...
Yeah, that makes sense. I mean I'm sure most people here even without the trading knowledge could easily use the libraries I wish I knew how to use as I'm just a beginner. Unfortunately, I'm very knowledgable in the trading front, but extremely limited when it comes to coding so my ideas are just in pseudo code as I can't code.
serene scaffold
latent ibex
Yeah, that makes sense. I mean I'm sure most people here even without the tradin...
Python is just executable pseudo code, so you will be fine
latent ibex
serene scaffold
Python is just executable pseudo code, so you will be fine
Thanks, I'm hoping things start clicking structure wise, especially with classes, I'm super confused with the whole self thing.
latent ibex
serene scaffold
Python is just executable pseudo code, so you will be fine
Would you mind taking a very brief peak at the home page of a library and telling what you think I might consider focusing on topics wise as python is so vast?
I know classes is one for sure
left tartan
serene scaffold
What is that?
Fwiw, it’s basically cross validation of historical data, looking at the ‘what if’ of applying a particular trading strategy to historical market data, using the knowledge available to you io to that time (ie: no cheating by looking forward)
It’s a complex topic because you still run into overfitting concerns , even if you hold back a train/test split (which is challenging because the most recently period is often the most relevant). The most common problem is running too many models/parameters: classic overfitting. Lots of papers on this.
latent ibex
left tartan
Fwiw, it’s basically cross validation of historical data, looking at the ‘what i...
I love seeing a more technical explanation of backtesting like this. 🙂
left tartan
The book everyone’s talking about right now is… https://www.amazon.com/Advances-Financial-Machine-Learning-Marcos/dp/1119482089/
latent ibex
My goal is to test as many variants as possible of the same type of strategy, just switching around the values for the parameters, and hopefully test out tens or hundreds of possible combinations across multiple sets of data, ultimately, choosing the select few that performed best on average across all sets.
Not sure what this would be called, whether montecarlo or something to that effect
left tartan
I had this bookmarked https://www.davidhbailey.com/dhbtalks/battle-quants.pdf
left tartan
latent ibex
My goal is to test as many variants as possible of the same type of strategy, ju...
Yes, that’s a recipe for overfitting
Read that pdf and just be careful how you proceed
latent ibex
left tartan
Yes, that’s a recipe for overfitting
That's what I figured, but since my strategy doesn't have too many parameters, I'm hoping it will be mitigated somewhat as there is still a lot of things unnacounted for.
latent ibex
left tartan
Read that pdf and just be careful how you proceed
Sounds good. WIll do thanks.
left tartan
The author also has some YouTube videos where he talks about this effect, very good stuff
latent ibex
By the way do you suggest backtesting.py for a beginner in python? seems to be the easiest one based on reviews but not sure if itll be too much for a true beginner?
latent ibex
left tartan
The author also has some YouTube videos where he talks about this effect, very g...
Nice, I'll check it out for sure
My strategy is currently coded in thinkscript in Thinkorswim's proprietary trading platform scripting language and it's working really well, I need it in python to test across longer periods of data as well as do some optimizing faster.
left tartan
I’ve played with it and bt.py. I rolled my own, but I don’t recall it being too difficult: but, I’ve been coding for a long time. If you’re a complete beginner, I’d suggest a Python tutorial first or it might be a frustrating experience
Monte Carlo, fwiw, is not what you described. Monte Carlo is concerned about how a model might work against statistically similar history or future(ie: a parallel universe) not how different models would perform against the same.
latent ibex
left tartan
I’ve played with it and bt.py. I rolled my own, but I don’t recall it being too ...
I wish to one day be able to do such a thing. It's my dream to be honest. Would you mind taking a peak at the home page example of backtesting.py, and based on what you remember already or what you see tell me which python topics I should focus on the most to expedite my learning specific to using this library?
latent ibex
left tartan
Monte Carlo, fwiw, is not what you described. Monte Carlo is concerned about how...
Noted. I knew something was off as the description I read seemed a bit different than what I want to do
left tartan
latent ibex
I wish to one day be able to do such a thing. It's my dream to be honest. Would ...
You need a basic command of control flow, functions, variables, etc. the content of https://python.swaroopch.com (as an example). You’re going to have to connect your data source to backtesting.py. You’ll probably also need to know pandas (https://www.kaggle.com/learn/pandas)
You have to bring your own data, so its not just push button simple
latent ibex
left tartan
You need a basic command of control flow, functions, variables, etc. the content...
Thanks, I will take note of these, I threw the towel in when I hit pandas in a tutorial a few years back. Will try to come back with a renewed mindset and more determination to get through it and use it correctly.
latent ibex
left tartan
You have to bring your own data, so its not just push button simple
True, can't rely on the data built in to the trading platform. I'm considering using some CSV files with OHLC 1 minute data or maybe I will need to learn to call the data from a data vendor online such as polygon
left tartan
You don’t need to master pandas, but just understand it a little and be able to lookup what you need. #python-discussion can help with specific coding questions like: how do I read a csv into a pandas dataframe (although that’s a simple one liner).
left tartan
latent ibex
True, can't rely on the data built in to the trading platform. I'm considering u...
Yah polygon or FinnHub or even yfinance.
latent ibex
left tartan
Yah polygon or FinnHub or even yfinance.
Nice, didn't know about finnhub
Well, I'm going to get started on these resources
Thanks a lot
left tartan
Best of luck!
 idle tree
I want to discuss that how can I make model like whisper where open-source whisper is taking many language but I don't get my birth language, so I want something like speechToText where I have birth language dataset and I want to make model that take input audio and output should be in English text format.
quaint loom
Is it against the rules to get attention by mention them without they answer my message first?
quaint loom
cold osprey
if anything, its annoying esp if uve not previously spoken
Make sense.
I want to develop a code script for my data, but I would like to get it touch privately with one person here. Although I don`t think he see that I have send him a friend request
 ashen latch
how compute accuracy for multi label classification in pytorch
# Output
tensor([[0.8434, 0.0096, 0.1470],
        [0.2488, 0.0757, 0.6755],
        [0.4780, 0.0322, 0.4898],
        [0.9102, 0.0100, 0.0798],
        [0.7645, 0.0240, 0.2115],
        [0.3124, 0.1936, 0.4940],
        [0.9440, 0.0066, 0.0494],
        [0.9390, 0.0108, 0.0502]], device='cuda:0', grad_fn=<SoftmaxBackward0>)

# Labels
tensor([[1., 0., 0.],
        [0., 0., 1.],
        [0., 0., 1.],
        [1., 0., 0.],
        [1., 0., 0.],
        [0., 0., 1.],
        [1., 0., 0.],
        [1., 0., 0.]], device='cuda:0')
Hello
I need help about I have input text data and I want to transform that text to well-formatted text.
 thin wren
idle tree
I need help about I have input text data and I want to transform that text to we...
thin wren
idle tree
I need help about I have input text data and I want to transform that text to we...
Formatted in what way?
weak mortar
latent ibex
Hi, would you mind chatting over DM about backtesting in python? Would appreciat...
Hi! yea sure
idle tree
thin wren
Formatted in what way?
I have text data in paragraph and transform it to well-formatted where I get title-concept, or we can say topic name for that text data based on some similar paragraph.
thin wren
Well-formatted in what sense?
weak mortar
weak mortar
Hi! yea sure
I'm using backtesting.py and plotly. I made alot of functionalities to prepare data, clean results and visualize data. To avoid overfitting i run the optimized results on multiple periods and assets and calculate the variance between the results
latent ibex
weak mortar
I'm using backtesting.py and plotly. I made alot of functionalities to prepare d...
Thanks! Nice. I’m also planning on using backtesting.py
latent ibex
weak mortar
Hi! yea sure
Sent you a friend request. Looks like your current settings require us to be friends to DM.
latent ibex
weak mortar
I'm using backtesting.py and plotly. I made alot of functionalities to prepare d...
I’ve just started going reading the byte of python book as I haven’t touched python code in years and trying to pick up the basics again and get started with backtesting
weak mortar
Alright sounds good, its a nice language to work in
To umderstand how it all works i initially played around with matplotlib pandas. Managed to make it buy and sell and plot red and green circles on a line chart, but then quickly decided to use a library
 simple tapir
def neural_networks(data, epochs=100, activation_function='relu'):
    x = np.array(data[["Boy", "Kilo"]])
    y = np.array(data["Cinsiyet"].values)

    x_train, x_test, y_train, y_test = train_test_split(x,y)

    model = Sequential()
    model.add(Dense(8, input_dim=x_train.shape[1], activation=activation_function))
    model.add(Dense(10, activation=activation_function))
    model.add(Dense(y_train.shape[1], activation='softmax'))
    model.compile( loss='binary_crossentropy', metrics=['accuracy'])
    model.fit(x_train, y_train, epochs=epochs)
    model.predict(x_test)
Error: ---> 10 model.add(Dense(y_train.shape[1], activation='softmax')) Tuple index out of range
past meteor
simple tapir
```py
def neural_networks(data, epochs=100, activation_function='relu'):
x =...
Isn't y_train 1-D?
simple tapir
oh yeah
gotta add 1 more dimension
y = np.array([data["Cinsiyet"].values])
would that work?
I did that with OneHotEncoder, but how would i solve this issue without using any lib but numpy?
 patent vapor
what is this
past meteor
simple tapir
y = np.array([data["Cinsiyet"].values])
what is data["Cinisyet"]? Is it a dict? Is it a pandas dataframe? What does it return, a dataframe? List? Etc...
simple tapir
past meteor
what is data["Cinisyet"]? Is it a dict? Is it a pandas dataframe? What does it r...
it's a df
patent vapor
it looks using numpy
simple tapir
cinsiyet basically means gender in my native language
past meteor
I don't think you need to call values, it's already a series then
simple tapir
yeah
 upbeat glacier
pyplot or seaborns, which would generally be considered better/prefered?
in general terms I mean, not for specific tasks or edge cases
and I'm aware this is a personal/subjective question
simple tapir
I like seaborn's visualization more
upbeat glacier
pyplot's been great until it started kicking my ass over this one color bar
and then I found out I could solve the issue using one line in seaborns
but I don't wanna rewrite the entire project -_-
 open raven
Hi, Regarding class imbalance this question: if for particular case of binary classification the found class imbalance reflects distribution of searched class yet the the rest - the side of reality, why doesn’t the model under training treat the imbalance metric as one additional feature instead of the model trainer be in need to ensure compensation for imbalance, or to be in need to eliminate imbalance?
mild dirge
How do you add a single "imbalance" feature? @open raven
Would that be a single value that is concatenated to each sample? And if so, how would that help the training process
Imbalance is a problem because the ml model can get really good results by just guessing one class more often than the other. Therefore the gradient will be towards just guessing one value more often.
 barren jungle
IndexError: invalid index to scalar variable.
weak mortar
hi 🙂 im making some heatmaps with plotly.graph_objects. it seems that the z axis by default is the mean value of the results. from seaborn and matplotlib im used to be able to specify the aggregation method(ie max,mean,median etc). How can i do this in the plotly.go heatmaps?
i have the documentation at hand but it is not specified(at least not in a language i could comprehend)
past meteor
mild dirge
Imbalance is a problem because the ml model can get really good results by just ...
It's a bigger problem when evaluating imo
If there's a signal the model will "follow" it
You just need a smarter evaluation strategy (e.g., ROC, DET and more)
barren jungle
i am getting errors detecting elephants
https://paste.pythondiscord.com/3IKQ
31 output = results[0][0]
32 for detection in output:
---> 33 score = detection[2]
34 if score > threshold: # Confidence threshold
35 label = "elephant"
IndexError: invalid index to scalar variable.
past meteor
barren jungle
i am getting errors detecting elephants
https://paste.pythondiscord.com/3IKQ
...
detection is an integer/float and not a collection (list, tuple, ...)
So your error is telling you you can't use [] on a scalar (int, float, etc)
barren jungle
past meteor
So your error is telling you you can't use `[]` on a scalar (int, float, etc)
what to do
past meteor
Well, I'd print out what's inside of results and see how the data is structured.
Then you'll how how to "unpack" it properly
weak mortar
weak mortar
hi 🙂 im making some heatmaps with plotly.graph_objects. it seems that the z axi...
df.groupby(['var1', 'var2'])['result'].max().values
~~problem solved. ✅ ~~ No it was actually not working properly. this works:
pivoted_df = optiheatmap_df.pivot_table(index='var1', columns='var2', values='Result', aggfunc='max')
as its now not a df it has to be accessed by .column, .index and .values :
x=optiheatmap_df_max.columns,
y=optiheatmap_df_max.index,
z=optiheatmap_df_max.values,
lapis sequoia
should one briefly learn the math behind each machine learning model, or just taking an overview is enough ?
serene scaffold
lapis sequoia
should one briefly learn the math behind each machine learning model, or just ta...
depends on what your goal is, I guess
we don't have a meme channel
 sterile nebula
serene scaffold
we don't have a meme channel
sterile nebula
serene scaffold
we don't have a meme channel
uh sorry
 odd meteor
Anyone here at Indaba 🇬🇭? 😃 Would be nice to meet anyone from PythonDiscord who's at Indaba. We could go grab a coffee or a plate of jollof 😄
We can as well meet at the NLP Workshop this Friday.
 quaint loom
Is there anyone who is good with python here who is willing to help me develop a script code?
 gleaming burrow
When starting a new machine learning project and want to explore the new dataset, do you manage to keep the code SOLID while writing the code or firstly you write many LOCs and then refactor the code to apply SOLID?
serene scaffold
gleaming burrow
When starting a new machine learning project and want to explore the new dataset...
exploratory code is usually disposable. and then you write things properly once you know what you're working with.
gleaming burrow
serene scaffold
exploratory code is usually disposable. and then you write things properly once ...
that makes sense, but is it there something which allows to return back to the exploratory phase without rewriting everything from scratch?
or is that not a big concern?
serene scaffold
also, AI/ML code in Python is not very object oriented, so SOLID doesn't really apply. DRY is more applicable, I guess.
serene scaffold
gleaming burrow
or is that not a big concern?
that's not really a concern. if you're exploring the dataset, that should be your focus.
gleaming burrow
serene scaffold
that's not really a concern. if you're exploring the dataset, that should be you...
ok, if I understand correctly, it is fine if the exploratory phase results in many LOCs in a single file, then it is up to us to extract from that many LOCs what you need for the task
(like, filled with prints, plots, etc)
serene scaffold
gleaming burrow
ok, if I understand correctly, it is fine if the exploratory phase results in ma...
I usually do exploratory stuff in a notebook or IPython repl. and during that phase, software design best practices do not apply, because you're not designing software. you are just trying to explore the data, and code is a means to that end.
you can refer to the exploratory code if you want when producing a final product, or you can delete it and forget that you ever had it. up to you.
gleaming burrow
ok, so for example making plots as a way to justify the ML procedure can be considered as part of the product, so it is not exploratory, right?
another question: when writing a ML based product (no exploratory analysis), do you apply software design practices right from the start or do you write as much as possible, then refactor it?
left tartan
gleaming burrow
another question: when writing a ML based product (no exploratory analysis), do ...
I'm somewhere in between. I don't stress 'good practices' when sketching or experimenting with something, but I don't ignore them either. I do organize things somewhat intelligently, and try to keep chunks of code somewhat decoupled to make it easier to refactor. We do have a library of building blocks that we call on, so we're not doing everything from scratch every time... so the exploratory stuff becomes smaller and smaller over time.
past meteor
I take code organization very seriously in data science projects as well but like @serene scaffold I usually start with an exploratory phase in notebooks or a repl
left tartan
But, like right now, I needed to build a data simulator. I did the initial sketch and tests in a notebook to flesh out a few design ?, and am in the process of refactoring it now.
past meteor
When I see that a concept needs to be formalized then I do that, but it's rarely my go-to.
For instance, I built an internal tool to do data profiling. It started with me doing stuff in notebooks and it was only made "general" afterwards.
quaint loom
Is there any channels that I can use for talking to people who are good when it comes to creating a modules?
past meteor
quaint loom
Is there any channels that I can use for talking to people who are good when it ...
What exactly do you mean with modules?
quaint loom
past meteor
What exactly do you mean with modules?
I want to create a simple module that is detecting changes in the slope based on a given time interval.
past meteor
quaint loom
I want to create a simple module that is detecting changes in the slope based on...
So with module you mean a program?
quaint loom
past meteor
So with module you mean a program?
More like a python script, I believe
past meteor
quaint loom
More like a python script, I believe
Is there any particular place that you're stuck? Do you remember from math class how you compute a slope?
 crude pilot
Hey folks, beginner question about pandas: do you usually favour using Pandas API, or using custom Python or both?
a use case: I have a column that contains JSON data, from there I want to create more columns suffixed by the field name
it ended up being an awful rabbit hole, as it seems that "df[col].apply()" can output a Series thus creating multiple columns from just one, but it's dead slow because it keeps all rows into memory instead of working per row
so in the end I feel like I've lost some time versus writing a dumb loop that read each row and create new columns
(example: you have "{foo: hello, bar: world}" in the column, it should create new columns "col.hello" and "col.bar" with "hello" and "world" values)
past meteor
crude pilot
Hey folks, beginner question about pandas: do you usually favour using Pandas AP...
I'd say it's generally a good idea to try and use Pandas' idioms to do things.
past meteor
crude pilot
it ended up being an awful rabbit hole, as it seems that "df[col].apply()" can o...
Can this not work for you? https://pandas.pydata.org/pandas-docs/stable/reference/api/pandas.json_normalize.html
crude pilot
past meteor
Can this not work for you? https://pandas.pydata.org/pandas-docs/stable/referenc...
most probably in this case indeed
 indigo wing
Hello, I am thinking of using LSTM models to create a stock market something in python. Can anyone give me some recommendations?
any problem statement and solutions one would propose?
mint palm
ICLR vs WACV??
odd meteor
mint palm
ICLR vs WACV??
Honestly it depends on what you're optimising for. ICLR is a more popular AI conference, hence having your research paper accepted therein, I suppose gives your profile more boost (if you're interested in applying for PhD or Research focused Masters)
For me I prioritise NeurIPS, ICML, ICLR, EMNLP, and ACL.
mint palm
odd meteor
Honestly it depends on what you're optimising for. ICLR is a more popular AI con...
thanks
 fallow frost
does anybody have any project ideas for a Data Engineering pipeline that uses Kafka and Airflow?
I was thinking of doing something with stocks, like maybe analyzing live-data with Kafka to simuate a trade, and using Airflow to schdule some scripts that work with the data and the end of the day to create some sort of report
left tartan
Yah, could build a papertrading system
fallow frost
I dont have experience with either Kafka or Airflow but I want to create a project so I can show I can handle them fine in my job search
fallow frost
left tartan
Yah, could build a papertrading system
yeah I was thinking smth like that, do you have any suggestions?
left tartan
papertrading stuff is somewhat fun, and you could then expand to backtesting
Not particularly, that, or log file analysis, or something. You really would just need to pick some data feed that you want to work with.
fallow frost
I have a lot of experience with trading, but I dont want to get too techinal with Python, I want to practice more devops stuff, like with Docker and scheduling stuff
log file analysis
you mean analyzing logs?
abstract wasp
Someone pls help meeeeee 😭😭
When I run my code with the API, 0 images are extracted 😭😭 helppp
`from flickrapi import FlickrAPI
import pandas as pd
import csv
import os
import requests
api_key = ' ' #I have the key and secret but can't share the info lol
api_secret = ' '
flickr = FlickrAPI(api_key, api_secret, format='parsed-json')
directory = 'flickr_images'
csv_file = 'flickr_metadata.csv'
os.makedirs(directory, exist_ok=True)
parameters = {
'text': 'Los Angeles',
'per_page': 10,
'sort': 'relevance',
'extras': 'date_taken, geo, id',
'geo_context': 2,
'accuracy': 16
}
photos = flickr.photos.search(**parameters)
metadata_list = []
for page in range(1, 5):
for photo in photos['photos']['photo']:
photo_id = photo['id']
date_taken = photo['datetaken']
latitude = photo['latitude']
longitude = photo['longitude']
photo_url = f"https://farm{photo['farm']}.staticflickr.com/{photo['server']}/{photo['id']}_{photo['secret']}.jpg"
    date, time = date_taken.split(' ')

    response = requests.get(photo_url)
    if response.status_code == 200:
        with open(os.path.join(directory, f'{photo_id}.jpg'), 'wb') as f:
            f.write(response.content)

        metadata_list.append([photo_id, date_taken, latitude, longitude, photo_url])
metadata_df = pd.DataFrame(metadata_list, columns=['PhotoID', 'DATE', 'TIME', 'LATITUDE', 'LONGITUDE', 'URL'])
Save metadata to a CSV file
metadata_df.to_csv(csv_file, index=False)
print(f'{len(metadata_list)} images downloaded and metadata extracted.')`
echo vapor
Is it realistic to expect higher frame rate if I change a cv2 program from python to cpp? Ik overall, it runs on underlying C/Cpp regardless, but for the specific use case of running video capture and sending frame buffers to a server, could it be worth looking into? I have read this discussion but the responses are pretty mixed https://stackoverflow.com/questions/13432800/does-performance-differ-between-python-or-c-coding-of-opencv
The example shown seems similar to what I'm doing too

Stack Overflow
I aim to start opencv little by little but first I need to decide which API of OpenCV is more useful. I predict that Python implementation is shorter but running time will be more dense and slow co...
mild dirge
Well like the comments say, it depends on how much native python code you use.
It's hard to make a good estimate without just trying both and comparing them
echo vapor
mild dirge
It's hard to make a good estimate without just trying both and comparing them
Yea, was basically asking to see if it's worthwhile to measure this or not
echo vapor
mild dirge
Well like the comments say, it depends on how much native python code you use.
actually I'm pretty sure numpy can convert its array to buffer right. That would probably be faster than type casting
 normal acorn
last paragraph Indeed, there's even a sense in which gradient descent is the optimal strategy for searching for a minimum. Let's suppose that we're trying to make a move Δv
in position so as to decrease C
as much as possible. This is equivalent to minimizing ΔC≈∇C⋅Δv
. We'll constrain the size of the move so that ∥Δv∥=ϵ
for some small fixed ϵ>0
. In other words, we want a move that is a small step of a fixed size, and we're trying to find the movement direction which decreases C
as much as possible. It can be proved that the choice of Δv
which minimizes ∇C⋅Δv
is Δv=−η∇C
, where η=ϵ/∥∇C∥
is determined by the size constraint ∥Δv∥=ϵ
. So gradient descent can be viewed as a way of taking small steps in the direction which does the most to immediately decrease C
.
Exercises
Prove the assertion of the last paragraph
Does anybody have and ideas? The book recommeds the Chauny-Swartz inequality
wooden sail
the standard proof uses the lipschitz constant of the gradient, which is the induced 2 norm of the hessian