#data-science-and-ml
1 messages · Page 50 of 1
 normal creek
I'm not very smart friend. It's a image of a strip of cinefilm. Would a picture help?
I could link you to my cloud where iv saved all the scans

 mild dirge
What does alligning to horizontal plane mean?
mild dirge
normal creek
What would be the desired result for this image be?
normal creek
I want the strip to be straight and flush with the bottom of the screen. I have over 8000 strips to do
 iron basalt
normal creek
I want the strip to be straight and flush with the bottom of the screen. I have ...
iron basalt
normal creek
I want the strip to be straight and flush with the bottom of the screen. I have ...
You can use line detection to find the edges, then cut out the film, then rotate and translate it.
 simple tapir
import torchvision
from torchvision import datasets
import torchvision.transforms
from torchvision.transforms import ToTensor
import torch
from torch import nn
from torch.utils.data import DataLoader

train_data = datasets.FashionMNIST(
    root="For testing area",
    train=True,
    transform=torchvision.transforms.ToTensor(),
    download=True
)

test_data = datasets.FashionMNIST(
    root="For testing area",
    train=False,
    transform=torchvision.transforms.ToTensor(),
    download=True
)
img, lbl = train_data[0]

train_load = DataLoader(train_data, batch_size=32, shuffle=True)
class_names = train_data.classes

train_features_batch , train_features_label = next(iter(train_load))

class Test(nn.Module):
    def __init__(self, input_shapes, hidden_units, output_shapes) -> None:
        super().__init__()

        self.layer = nn.Sequential(
            nn.Flatten(),
            nn.Linear(input_shapes, hidden_units),
            nn.Linear(hidden_units, hidden_units),
            nn.Linear(hidden_units, output_shapes)
        )
    def forward(self,x):
        return self.layer(x)
model = Test(
    input_shapes=28*28,
    hidden_units=8,
    output_shapes= len(class_names)
)
Why do we set the output shape to length of class names? Won't there be a one output, which is the predicted image?
normal creek
iron basalt
You can use line detection to find the edges, then cut out the film, then rotate...
And where would I go to learn how to do that my friend
iron basalt
normal creek
And where would I go to learn how to do that my friend
The opencv documentation and random stack overflow posts (unfortunately). Here is some code to give you an idea of how it could be done, this is just the detection part, not the cropping and affine transformation: ```py
import numpy as np
import cv2
import matplotlib.pyplot as plt
src = cv2.imread("film.jpg")
dst = src.copy()
gray = cv2.cvtColor(src, cv2.COLOR_BGR2GRAY)
thresh = cv2.adaptiveThreshold(gray, 255, cv2.ADAPTIVE_THRESH_GAUSSIAN_C, cv2.THRESH_BINARY, 11, 2)
contours, hierarchy = cv2.findContours(thresh, cv2.RETR_TREE, cv2.CHAIN_APPROX_SIMPLE)
largest_contour = max(contours, key=cv2.contourArea)
box = cv2.boundingRect(largest_contour)
cv2.drawContours(dst, [largest_contour], -1, (0, 0, 255), 15)
cv2.rectangle(dst, (box[0], box[1]), (box[0] + box[2], box[1] + box[3]), (0, 255, 0), 15)
fig = plt.figure(figsize=(10, 10))
ax1 = fig.add_subplot(221)
ax1.imshow(src)
ax2 = fig.add_subplot(222)
ax2.imshow(gray, cmap="gray")
ax3 = fig.add_subplot(223)
ax3.imshow(thresh, cmap="gray")
ax4 = fig.add_subplot(224)
ax4.imshow(dst)
fig.tight_layout()
plt.show()
The cropping can be done by drawing the contour filled in in a separate image, then use that as a mask. Then extract the film with that mask (using a bit-and) and then you can rotate it by finding the angle from the contour's points.
Also this is more of a #media-processing question, a lot of opencv-ing happening there.
 quasi sparrow
Hi everyone!
I just found out about Apache parquet and the internet says it's pretty fast for data storage and retrieval.
I have a directory with multiple CSV files to train a ML model; is it convenient to read all my CSV files with pandas, combine them into a single dataset and convert to parquet file to have better performance during the data cleanse process?
I am trying to build automated pipelines
Any info helps, thank you all!
 royal hound
do you think the current engineers try to optimize there data
in machine learning
or they just assume anyone trying to do what they are doing have enterprise servers
normal creek
I appreciate your help. Unfortunately I'm a tad drunk. But I will endeavour to do some research tomorrow. David
quasi sparrow
royal hound
or they just assume anyone trying to do what they are doing have enterprise serv...
I don't know, all I know is that I don't have an enterprise server and need to fit mas much data as possible in a small computer 
royal hound
quasi sparrow
I don't know, all I know is that I don't have an enterprise server and need to f...
its time we re write tensorflow
quasi sparrow
So you are saying tensorflow already does this for us?
iron basalt
quasi sparrow
I don't know, all I know is that I don't have an enterprise server and need to f...
Are you memory constrained or runtime or what?
quasi sparrow
Money constraint. I am trying to run a deep learning model next to an industrial machine using a Jetson Nano Developer Kit
And automate the data cleanse and wrangling part on site.
iron basalt
quasi sparrow
And automate the data cleanse and wrangling part on site.
Those are two different problems.
quasi sparrow
Is it a bad idea to do both at runtime?
quasi sparrow
Yesss, a lot of cleaning.
iron basalt
Does that need to happen on the Jetson or can you clean and then send the processed data to the Jetson?
quasi sparrow
Industrial datasets are messy. Operators bypassing functions and Engineers playing with devices' setpoints
I want to do it all in the Jetson, data processing and training "in real time" (I don't know what the correct term is)
And inference
iron basalt
Online learning?
quasi sparrow
I will data from the PLC through OPC server, which runs on TCP/IP, I believe.
Yes, online learning
I want to connect the device and let the system run until the model is accurate.
iron basalt
If the issue is not being able to fit it all in memory at once on the Jetson then you need to load and learn on it in chunks. If your model is an online learner this should not be an issue.
quasi sparrow
Does "online learner" mean I can train the model in chunks and discard the data after the model ingested it?
iron basalt
quasi sparrow
Does "online learner" mean I can train the model in chunks and discard the data ...
Yes.
iron basalt
Non-online methods tend to keep around a "replay buffer" of some kind or just buffer in general from which they randomly sample (for i.i.d. design reasons). These buffers gets larger with problem size. Online learners do not need to keep anything around. They see a thing once and move on, they don't forget things.
However, if you have a fast larger volume storage such as an SSD, you could still page in and out memory to it.
(But it still does not solve the issue entirely of being able to keep learning things without forgetting previous knowledge, eventually the buffer runs out / is not big enough / requires too many resamples)
Assuming your model is an online learner, you have none of these issues.
quasi sparrow
iron basalt
(But it still does not solve the issue entirely of being able to keep learning t...
But wouldn't this be a good thing for a system that is subject to wear and tear?
Gears wearing out and electronics going noisy
Oh, I see, this is reinforcement learning!
I haven't read much about it but do you think I can use TensorFlow Extended to automate the data processing part?
iron basalt
The effect and need of such a buffer becomes more obvious in RL, but it applies in general.
quasi sparrow
quasi sparrow
I haven't read much about it but do you think I can use TensorFlow Extended to a...
will it be an overkill? I heard is used for huge production pipelines
iron basalt
TF is for deep learning, it can't do online learning.
quasi sparrow
Gotcha, thank you very much for all the info!
iron basalt
quasi sparrow
Gotcha, thank you very much for all the info!
That includes deep learning in general.
You did not specify in the original question what type of ML.
quasi sparrow
I am thinking of using a Transformer to model the physical system. I thought maybe a Seq2Seq model could run accurate simulations
The idea is to built a system that predicts what will happen if somebody increases the speed of a motor in a electro-mechanical system
It's just a side project that I have. I am not a Data Scientist, I am an industrial automation engineer.
I'm quite restricted in computational power.
iron basalt
quasi sparrow
It's just a side project that I have. I am not a Data Scientist, I am an industr...
Ok, so the way it works is that you collect a bunch of data of the physical system, then train a model on that (probably in the cloud), and then deploy it in inference mode. It does not train further at that point.
The Jetson is really meant for that deployment. Because large models are much faster in inference than training, but it still takes a lot of compute.
If you want a system that will keep learning forever then that is entering online learning, for which there are not really any big widely used libraries like with deep learning.
quasi sparrow
That makes sense; I was wondering why the Jetson Kits don't have much storage included.
iron basalt
quasi sparrow
That makes sense; I was wondering why the Jetson Kits don't have much storage in...
Yeah it's just so they could get it running at all on stuff like robots. Still not really though due to large power requirement, but it totally works as an option for anything not running on a battery life.
(It's also really expensive and there are better options (Nvidia prices, it's like Apple prices))
(Super high demand due to marketing)
quasi sparrow
Can I achieve the same inference speed on Rapsberry Pis?
iron basalt
quasi sparrow
Can I achieve the same inference speed on Rapsberry Pis?
No. Raspberry pi would be running something much faster (not deep learning).
Although it depends highly on which model and the dimensionality of your input and such.
quasi sparrow
I have a Neural Compute Stick 2 from Intel that I found online, lol
I think I'll give it a try and see how it performs
iron basalt
quasi sparrow
The idea is to built a system that predicts what will happen if somebody increas...
Try using something really simple first and see how that goes. You may end up actually being able to run it on a PI.
The first thing to figure out is what the features are, how many, and which are useful.
If there are not that many then most modern machines can handle it.
quasi sparrow
How reliable is synthetic data created from a real dataset? Can I take readings from a couple of days and then use that data to generate a month worth of data or is it there a threshold of when the synthetic data can get noisy?
iron basalt
quasi sparrow
How reliable is synthetic data created from a real dataset? Can I take readings ...
"It depends." It's something you need to find out by messing around with your specific problem.
(You can do some signal processing stuff to calculate some stuff)
quasi sparrow
Signal processing as feature extraction?
Yes, I can do that! I am a little rusty in DSP but it's doable
 untold cliff
I am reading the book: Hands on machine learning. I'm in chapter2, section: Create a test set. I was hoping you could clarify somethings to me. First this paragraph: Well, this works, but it is not perfect: if you run the program again, it will generate a different test set! Over time, you (or your machine learning algorithms) will get to see the whole dataset, which is what you want to avoid. This suggests that the training and test set should remain consistent on different runs but why exactly ? Second paragaph: However, both these solutions will break the next time you fetch an updated dataset. To have a stable train/test split even after updating the dataset, a common solution is to use each instance’s identifier to decide whether or not it should go in the test set Here by updated, does he mean adding new instances, and we would want to have the same old train and test sets and add to them from the new instances?
quasi sparrow
I think I have that book, is it hands on machine learning with scikit learning & tensorflow?
untold cliff
quasi sparrow
I think I have that book, is it hands on machine learning with scikit learning &...
Yes, i have the 3rd edtion.
quasi sparrow
I think I know what it means:
Running the test_train split multiple will eventually overfit the model because the entire dataset will be seen by the model, eventually.
 novel python
is there a way to convert a month name to a datetime object in pandas? I wanted to order by month but if it's not a datetime object it will order alphabetically (obviously), but pd.to_datetime won't work on this type of string.
quasi sparrow
I think it wants you to randomly split the data set and make sure the model never sees the test split
Adding an identifier to the dataset ensures that the test dataset is not passed to the model accidentally
But I could be wrong
untold cliff
quasi sparrow
I think I know what it means:
Running the test_train split multiple will eventu...
But this would be the case only if your model remebers what it has been trained on right? (which is not the case with linear regression)
untold cliff
novel python
is there a way to convert a month name to a datetime object in pandas? I wanted ...
You can pass a format argument to pd.to_datetime
quasi sparrow
untold cliff
But this would be the case only if your model remebers what it has been trained ...
I just read the page and yes, it is confusing, lol.
I don't know why that is relevant if the model only gets trained once at the time
It shouldn't matter if the model sees the test data from the first run since the model in the second run does not remember or sees the first model
Maybe this is relevant when doing cross-validation
untold cliff
I see. Thanks!
 hasty mountain
Kaggle, Gradient's Paperspace, Amazon SageMaker
Paperspace and SageMaker can be used for free and improved with paid plans
 queen cradle
quasi sparrow
How reliable is synthetic data created from a real dataset? Can I take readings ...
queen cradle
quasi sparrow
How reliable is synthetic data created from a real dataset? Can I take readings ...
There is a rigorous statistical technique for doing this called "bootstrapping." See, for example, Efron and Tibshirani, An Introduction to the Bootstrap. One of the difficulties with bootstrapping is that you have to assume that the data you have is representative. So, for example, suppose you take measurements on a couple of days. Maybe you're measuring something that depends on the temperature, but later in the month the temperature changes. Or maybe you're measuring something that depends on the day of the week but all your measurements were made on Mondays. This sort of phenomenon makes bootstrapping time series data very difficult.
 cinder schooner
Hello, i have a question on the unpooling in the transposed convolutions. When we use bed of nails, why do we fill the values with zeros and why don't we put random numbers that are just inferior to the max we initially had. Why filling with zeros exactly
untold cliff
quasi sparrow
I just read the page and yes, it is confusing, lol.
I don't know why that is rel...
Hey, in the part where he explains how to use a hash function to make sure you get the same train and test sets on different runs, do you know why he used crc32 instead of python's built-in hash ? (Maybe except for the fact that it returns a python int?)
 zealous badger
hey guys i have a .tar file that has this structure:
->data
    -files (about 500)
->data.pkl
->version
how do i make it so that i can load the model in keras.
its weights for a pretrained MobileNet model.
untold cliff
Yeah that makes sense but i thought that the purpose of a model is to generalize, and so its performance is jist an approximation and it shouldnt change much, even though we would be training the model on a different set
zealous badger
untold cliff
Yeah that makes sense but i thought that the purpose of a model is to generalize...
well but it does change. imagine you keep seeing green parrots all the time. when shown a red one , you wouldnt know/believe that its a parrot
untold cliff
Yeah, thanks!
untold cliff
zealous badger
well but it does change. imagine you keep seeing green parrots all the time. whe...
Exactly, and i i understood you well, this means that your dataset is bad and is not equally distributed (or something like this) which means that we shouldnt rely on its accuracy in the first place right ?
zealous badger
yes that's what cross validation is.
- you split the dataset
- train your model
- save your test score
- repeat it n times
untold cliff
I see. Thanks guys! He'll definitely explain cross validation later on in the book.
 mighty orchid
anyone here ever tried sklearn with pypy3? my laptop is 🐌 and I got 4gb of text to chew
zealous badger
try google colab maybe
 hearty sun
Hello
mighty orchid
zealous badger
try google colab maybe
colab? what about it? i assume you are talking to me 
hearty sun
Does anyone know how to import an nlg model into your chatbot project
zealous badger
mighty orchid
colab? what about it? i assume you are talking to me <:pithink:65224755990927770...
you said you wanted to use sklearn, but your laptop is kinda slow. colab is kinda neat, it gives you compute resources for free, and should be (maybe) enough for whatever you're trying to do
mighty orchid
im using kaggle rn, but i was curious if i could run it locally if i used pypy to boost it a bit, when i tried to install sklearn for it, it asked me to install MSVC++, which is 8gb, so i figured its too much of hassle, but im still curious about pypy+sklearn, sry should have made that clear
hearty sun
Can somone help to import my nlg model project i am working for chatbot inot my chatbot project i am new to nlg models still.
zealous badger
mighty orchid
im using kaggle rn, but i was curious if i could run it locally if i used pypy t...
ah my bad.
 next narwhal
Is it true that among data scientist the most popular IDE is VSCode?
I'm working on my first serous project (first job as a data scientist) and I'm trying to decide between the various IDEs (well mainly between VSCode ana Pycharm). Unfortunately I don't have much time to wonder and experience both as I a project on my hand which I should be working on 🙂
Any advice?
For the initial phase I'm in I'm using Jupyter Lab, But later on, the results of this step should become code for production and then Jupyter will not be suitable.
 wooden sail
whichever you prefer is fine. even if it were true that vscode is the most popular in data science, it still doesn't mean much 😛 it's a tool that's supposed to help you, so pick the one that makes your job easier
hasty mountain
I'll just say that VS Code is quite convenient...even in relation to Pycharm 
Besides...it has the advantage of being a bit generalist...you can code Python, C++, Rust in there without having to download different IDEs
wooden sail
it's normally a combination of sublime, notepad++, spyder, micro, and vim for me
depending on which machine is at hand and what it has installed
queen cradle
I think the most important thing to do is find an editor that you like. If you like VSCode, use it. If you prefer PyCharm, use that. I'm happy with vim. But I also know people who like Emacs, and once I met someone who was fond of nano. Pick the thing that makes you most productive.
 serene scaffold
next narwhal
I'm working on my first serous project (first job as a data scientist) and I'm t...
serene scaffold
next narwhal
I'm working on my first serous project (first job as a data scientist) and I'm t...
PyCharm is a jetbrains IDE, but they have a separate IDE, DataSpell, for data scientists
hasty mountain
serene scaffold
PyCharm is a jetbrains IDE, but they have a separate IDE, DataSpell, for data sc...
Does it allow working on multiple projects at once?
I stopped using Pycharm exactly because of that
serene scaffold
hasty mountain
Does it allow working on multiple projects at once?
you can open different projects in different windows with pycharm 
hasty mountain
Booo.
I prefer opening thousands of tabs in VS Code
next narwhal
serene scaffold
PyCharm is a jetbrains IDE, but they have a separate IDE, DataSpell, for data sc...
Oh I didn't know that. So now it's Data spell vs Vscode 😄
wooden sail
spyder 😌
next narwhal
hasty mountain
Besides...it has the advantage of being a bit generalist...you can code Python, ...
For now it's only python for me but I agree that if I'd want to try a bit of other things it is something to consider
next narwhal
wooden sail
it's normally a combination of sublime, notepad++, spyder, micro, and vim for me
I've actually started learning how to use vim
serene scaffold
next narwhal
Oh I didn't know that. So now it's Data spell vs Vscode 😄
idk anyone who uses data spell, but the point is that it's a Python editor for people who specifically aren't trying to build software
it might be that you do build software as part of your job, though
wooden sail
if you've ever used matlab, spyder is a lot like its IDE. it stores all variables, so it makes debugging your maths easier
serene scaffold
wooden sail
if you've ever used matlab, spyder is a lot like its IDE. it stores all variable...
I use the pycharm debugger for that 🙈
next narwhal
serene scaffold
it might be that you do build software as part of your job, though
I think that my project is supposed to become a part of the software at the end (although the final merge in the software won't be my responsibility)
wooden sail
i've never used a debugger so i can't comment on how good they are 😛
serene scaffold
wooden sail
i've never used a debugger so i can't comment on how good they are 😛
jetbrains debuggers are really nice, and easier to figure out than the eclipse one.
 hidden mist
I have a paid DataSpell license and I've really been struggling to identify use cases that I don't think PyCharm can accomplish pretty effectively anyway.
The main one I think I've run into is Jupyter integration.
 spice mountain
Say I have a Pandas dataframe with a column called "AuthorIds" which is a list of IDs.
How do I select all the rows in the dataframe, where the AuthorIds contains a certain ID?
serene scaffold
spice mountain
Say I have a Pandas dataframe with a column called "AuthorIds" which is a list o...
you'd probably have to use a lambda and apply for that tbh
spice mountain
😠
serene scaffold
why angry
spice mountain
At Pandas
serene scaffold
pandas has limited support for lists as elements, unfortunately
hidden mist
 I don't have the products package for JetBrains. Was trying to figure out why I couldn't interact with my Jupyter Notebooks but I guess it's read only under PyCharm Community. Not sure I can make an intelligent comparison, but DataSpell's UI isn't... offensive?
Google would indicate they're very similar however.
next narwhal
hidden mist
I have a paid DataSpell license and I've really been struggling to identify use ...
Jupyter integration sounds nice. The vscode integration is a bit buggy from my short experience
hidden mist
To be clear, now that Stelercus has brought it up, I don't see any striking differences between DataSpell and PyCharm Professional in regards to Jupyter integration.
spice mountain
serene scaffold
pandas has limited support for lists as elements, unfortunately
So, how exactly would I get the rows out of the original dataframe?
Right now I am just applying this simple function
    AuthorIds = row["author_ids"]
    if str(authorID) in AuthorIds:
        return row
we use snake_case in python, not lowerCamelCase.
you can do something like df['author_ids'].apply(lambda v: author_id in v)
queen cradle
next narwhal
I've actually started learning how to use vim
vimtutor is the best way I know to get started in vim. The learning curve may feel steep, but that's mostly because it's unfamiliar, and vimtutor helps you get over that.
Personally, I like vim because it matches the way I like to think about editing text (and I almost always feel like I'm editing text). When working with prose, for example, I feel like it's easy for me to get to and modify words, sentences, and paragraphs (using command sequences like ciw, das, and so on). I have a similar feeling when working with code. Switching in and out of command mode happens automatically once you get used to it. (Two tips: Turn your Caps Lock into an extra Ctrl key, and use ^] to get out of insert mode.)
next narwhal
queen cradle
`vimtutor` is the best way I know to get started in vim. The learning curve may ...
Cool thanks
 crude anvil
How to get started with data engineering/machine learning?
Any helpful YT resources for beginners?
Thanks in advance 🙂
mild dirge
I watched this video the other day, seems great for beginners to just see the general outline of a neural network
https://www.youtube.com/watch?v=hfMk-kjRv4c&t=33s

Exploring how neural networks learn by programming one from scratch in C#, and then attempting to teach it to recognize various doodles and images.
Source code: https://github.com/SebLague/Neural-Network-Experiments
Demo: https://sebastian.itch.io/neural-network-experiment
If you'd like to support me in creating more videos (and get early acce...
@crude anvil
Though if you really want to get into it, you would eventually need to read up on it too, yt videos are great for intuition, but I'm not sure if you can truly learn the technical stuff from just yt videos.
crude anvil
mild dirge
I watched this video the other day, seems great for beginners to just see the ge...
Just getting started
Will work and read more eventually if time and career permits
crude anvil
mild dirge
I watched this video the other day, seems great for beginners to just see the ge...
Can you attach a playlist/channel that is specifically dedicated to data engineer/machine learning?
mild dirge
There is just so much to machine learning data engineering, I can send you a playlist that goes more into the basic mathematics, but they mostly go over the same stuff

What are the neurons, why are there layers, and what is the math underlying it?
Help fund future projects: https://www.patreon.com/3blue1brown
Written/interactive form of this series: https://www.3blue1brown.com/topics/neural-networks
Additional funding for this project provided by Amplify Partners
Typo correction: At 14 minutes 45 seconds, th...
quasi sparrow
Does anyone know of a good book or resource to automate data processing?
I am trying to build a tool that takes a dataset and separates the data into two categories: categorical and continuous.
After separating, it transforms the categorical data to one hot encoding and normalizes the continuous data.
Later, the data will be merged into a single dataset using a unique identifier so my rows are not mixed up.
I am using Polars with Python
 young granite
quasi sparrow
Does anyone know of a good book or resource to automate data processing?
I am t...
young granite
quasi sparrow
Does anyone know of a good book or resource to automate data processing?
I am t...
a sklearn pipeline could be just what u looking for?
 median quail
Hey guys, I've been recently selected as an intern in a market intelligence team in a company. I'm specifically working upon sales forecasting. What are the best sales forecasting models out there according to you guys which I should look into? I've also reas about ARIMA being the best but if there is some as strong alternatives to that?
 nocturne eagle
mild dirge
I watched this video the other day, seems great for beginners to just see the ge...
nocturne eagle
mild dirge
I watched this video the other day, seems great for beginners to just see the ge...
is that the hot dog v not hot dog AI?
nocturne eagle
🙂
queen cradle
median quail
Hey guys, I've been recently selected as an intern in a market intelligence team...
These kinds of questions are usually hard. Models can be great when they reflect reality, but the real world is a complicated place, and models don't always reflect that complexity.
My recommendation is to start by fitting very simple models. Look at an MA(p) model, first for small p like 1, 2, 3, and so on. See where it fits the data. Then look at where it doesn't fit the data. Can you identify the market factors that caused that lack of fit? That's important: In order to provide useful market intelligence, you need to say more than "sales will go up" or even "sales will go up this much." (As Richard Hamming once said, "The purpose of computation is insight, not numbers.") It's okay if you can't identify all the market factors, but you should try. There will be things an MA(p) model can't do (honestly that's most things; they're very simple), so when you think you've learned what you can from it, try a different model, like AR(p). Again, look where it matches and where it doesn't. Try to determine why it doesn't match. For example, AR(p) models can't capture seasonality; can you observe that feature? Work your way up until you either have a really good model or you've either exhausted your modeling ideas. If you can find a simple model that explains your data, that's usually better than jumping straight to something fancy; fancy models tend to be brittle.
quasi sparrow
young granite
a sklearn pipeline could be just what u looking for?
Yes, that is what I need; thank you!
queen cradle
@median quail Also, it's worth saying that from a statistical perspective, time series are quite difficult to work with. For example, what does "average number of sales" mean over a 12-month period? For many US retailers, sales in December are often a lot higher than at other times of year. A single number like the mean can't capture that. Or, say you want to determine the average amount of inventory on hand. That's hard because the available data isn't independent: The amount of inventory you have one month obviously depends on the amount you had the previous month. Even an apparently simple number like "number of sales in month X" is quite confusing: The number of sales is noisy, so you wish you had a lot of monthly data you could average; but there's only one month X ever. Other months could have seasonal effects; other years could have effects from changing market conditions or global economic changes.
 mint palm
hi, need help in getting the dimensions right in attention module. Its overwhelming
i have to implement cross attention by taking "query" from video with tensor shape (32, 12, 512) where 32 is batch size, 12 is number of frames and 512 is embedding size, and "key" and "value" from text with tensor shape (32, 512) where 32 is batch size and 512 is embedding size.
if someone can tell me how to easily write reshapes, that would be great too
I know how multiplication works but its too difficult to understand this one.
 warm goblet
Hey guys can someone help me with writing a function to calculate the heat capacities for certain chemicals
I have the constant in the panda table already
serene scaffold
@warm goblet can you show print(df.head().to_dict('list'))
 meager fulcrum
i just had an idea and i was wondering what sort of data i would need to train for it to work
so a natural language model that can take in plain english afterwards and remember it
so its trained on whatever it gets trained on
and then you can say something like "strawberry pie is good"
one time and it will remember that, i am aware it sounds very very complicated and very GPU intensive, i can cover all that
i just want to know what sort of style i'd need to approach this with
like so it knows a lot of things but then after it can take plain english context as a second level of modelling
 edgy falcon
Hi! if somebody can help me, im trying to make a TransformerXL layer:
...
**kwargs
)(GRU_layer)```
But with argument kwargs, it tolds me that is not defined, how can i fix that? serene silo
Hello; I’m new. Question: Linux or Mac OS or Windows latest version for AI development?
serene scaffold
serene silo
Hello; I’m new. Question: Linux or Mac OS or Windows latest version for AI devel...
pretty much all development is "linux first"
 tacit basin
serene silo
Hello; I’m new. Question: Linux or Mac OS or Windows latest version for AI devel...
tacit basin
serene silo
Hello; I’m new. Question: Linux or Mac OS or Windows latest version for AI devel...
Linux, but with Nvidia GPU for deep learning especially. Common scenario is connecting to remote server with beefy GPU for training. Then your local computer doesn't really matter that much. Mostly OS preference.
 ember trench
I have a data set that I'm trying to make two different scatter plots for (using matplotlib), side by side, with two different sets of colors (one representing original data, one representing the cluster centers). However, both plots end up using the colors from the second one. How should I do this? Here's what I have now: ```py
fig = plt.figure()
colors = np.array(image_data_clusters["color"].to_list())
fig.add_subplot(projection='3d').scatter(*zip(*colors), c=colors / 255)
fig.add_subplot(projection='3d').scatter(*zip(*colors), c=np.array(image_data_clusters["cluster_color"].to_list()) / 255)
fig.show()
Never mind. It was plotting them on top of each other, and showing the same figure twice because of the plt.show(). Added position args to add_subplot() and it works now.
serene silo
tacit basin
Linux, but with Nvidia GPU for deep learning especially. Common scenario is conn...
Thanks
hearty sun
Does anyone know a good nlp turotel for Pytorch on chatbot that does not use nltk
 willow pumice
hey guys
I followed a tutorial on making a fake news detector. Im new to machine learning(started and completed the project yesterday) and i successfully trained and tested the model. I want to make my model to accept any news header for it to predict whether its real or fake. However i am getting an error
Error:
AttributeError: append not found
Code:
I had seperated the code into two files
interface.py (main interface)
 import main


author = input("Enter author of the article: ")

title = input("Enter title of the article")

content = author + ' ' + title

content = [main.stemming(content)]

vectorizer = main.vectorizer

vectorizer.fit(content)

content = vectorizer.transform(content)


p = main.calculate(content)

if(p):
    print("Real news")
else:
    print("Fake news")
import numpy as np
import pandas as pd
import re
from nltk.corpus import stopwords
from nltk.stem.porter import PorterStemmer
from sklearn.feature_extraction.text import TfidfVectorizer
from sklearn.model_selection import train_test_split
from sklearn.linear_model import LogisticRegression
from sklearn.metrics import accuracy_score


import nltk
nltk.download('stopwords')
vectorizer = TfidfVectorizer()
port_stem = PorterStemmer();
model = LogisticRegression()
def stemming(content):
    stemmed_content = re.sub('[^a-zA-Z]', ' ', content)
    stemmed_content = stemmed_content.lower()
    stemmed_content = stemmed_content.split()
    stemmed_content = [port_stem.stem(
        word) for word in stemmed_content if not word in stopwords.words('english')]
    stemmed_content = ' '.join(stemmed_content)
    return stemmed_content


def calculate(a):
    news_dataset = pd.read_csv(
    'E:\Documents\coding stuff\python stuff\Fake news detector\\train.csv')

    news_dataset = news_dataset.fillna('')

    news_dataset['content'] = news_dataset['author']+' '+news_dataset['title']

    X = news_dataset.drop(columns='label', axis=1)
    Y = news_dataset['label']


    news_dataset['content'] = news_dataset['content'].apply(stemming)

    X = news_dataset['content'].values
    Y = news_dataset['label'].values

    vectorizer = TfidfVectorizer()
    vectorizer.fit(X)

    X = vectorizer.transform(X)

    X_train, X_test, Y_train, Y_test = train_test_split(
        X, Y, test_size=0.2, stratify=Y, random_state=2)

    model = LogisticRegression()

    model.fit(X_train, Y_train)

    X_train_prediction = model.predict(X_train)
    training_data_accuracy = accuracy_score(X_train_prediction, Y_train)
    print('Accuracy score of the training data : ', training_data_accuracy)


    X_test_prediction = model.predict(X_test)
    test_data_accuracy = accuracy_score(X_test_prediction, Y_test)

    print('Accuracy score of the test data : ', test_data_accuracy)
    X_test.append(a)

    X_new = X_test[-1]

    prediction = model.predict(X_new)

    if(prediction[0] == 0):
        return True
    else:
        return False
<class 'scipy.sparse._csr.csr_matrix'> this is the datatype
i rlly don't know how to add or remove elements to a matrix
wooden sail
x_test is a csr matrix?
willow pumice
wooden sail
x_test is a csr matrix?
oh
then i can't figure out how to add and remove things from a matrix
willow pumice
x_test
wooden sail
yeah matrices don't have an append method. you shouldn't be modifying their size
willow pumice
wooden sail
yeah matrices don't have an append method. you shouldn't be modifying their size
oh
so is there anyway that i can feed it a specific data so that it can be good for practical use
i tried converting it into a coreml format but it doesn't support windows
there was ml.net but i had to code everything into c#
any alternative?
wooden sail
if you want to keep using csr_matrix, one solution is to create the matrix with the final size and then assign it values afterwards
willow pumice
wooden sail
if you want to keep using csr_matrix, one solution is to create the matrix with ...
alright
ill figure that out somehow ty
royal hound
how do i make fastai use atleast 80% of my gpu
its only using 20%
oop i figured it out
when i use 0 workers my accuracy and error rate is 50/50
but when i was for example 4
my a/e is 10/90
wtf?
 tardy jackal
I found this pretty cool as a beginner https://youtu.be/8z8Cobsvc9k

In this tutorial, we will guide you through the process of creating your very own GPT-3 powered voice assistant with Python. Say goodbye to asking Siri questions she can't answer and hello to a smarter personal assistant.
We'll take you through the process step by step, explaining each line of code, so you can follow along even if you're new to...
tacit basin
royal hound
wtf?
Use -10 workers 😜
mint palm
i my accuracy increase by 0.3 % on using 8 heads instead of 1, is it justified?
royal hound

could it possibly be my data is bad?

    dls = ImageDataLoaders.from_path_func(path, fnames, label_func, bs=128, item_tfms=Resize(300), num_workers=0, device=torch.device('cuda:0'))
    learn = vision_learner(
        dls,
        resnet18,
        metrics=[accuracy, error_rate])


    print('Training...')
    learn.fine_tune(50)
 dull flare
Well I'm struggling with something and hope this community will help me pick a wise path.
I'm currently a sophomore student 2nd year(India)
I am interested in ML and stuff but I thought learning Android development along with ML won't be a bad idea so in my holidays i planned to study Android development and then move on to ML and stuff , now can I be ready for ML so that I can have a good grasp at it ,or i should concentrate at Android alone and leave ML ,or can I focus on both
I'm so confused for days now
As a tier 3 student (didn't study in COVID and hence bad college well that doesn't matter as I work hard , in an average i study like 10 hours a day in holidays) my college doesn't have a proper guidance or a good environment
And because of that i don't have anyone to give me a proper guidance sadly
This question might be immature but please bare with it and be kind to explain me
Thanks a lot
royal hound
dull flare
Well I'm struggling with something and hope this community will help me pick a w...
royal hound
    path = Path('createData/Inputs/')
    print(f"Total Folders:{len(os.listdir(path))}")
    fnames = get_image_files(path)
    print(f"Total Images:{len(fnames)}")

    dls = ImageDataLoaders.from_path_func(path, fnames, label_func, bs=128, item_tfms=Resize(300), num_workers=0, device=torch.device('cuda:0'))
    learn = vision_learner(
        dls,
        resnet18,
        metrics=[accuracy, error_rate])


    print('Training...')
    learn.fine_tune(50)

    print('Saving...')
    learn.export()
each image is in it's own respective folder
 lyric dew
Hi, I don't know where to ask this question, hopefully, someone can help me 😬
what is .A at the end of onehotencoded transformed pd.dataframe?
ohe = OneHotEncoder()
df[list(df["Sex"].unique())] = ohe.fit_transform(df[["Sex"]]).A
from: https://www.kaggle.com/code/shaumilsahariya/case-study-of-titanic#Feature-Engineering

Explore and run machine learning code with Kaggle Notebooks | Using data from Titanic - Machine Learning from Disaster
tacit basin
royal hound
```py
dls = ImageDataLoaders.from_path_func(path, fnames, label_func, bs=128...
What's your question specifically?
mild dirge
is A a column name?
 limber kiln
Pandas: How do I select a subset of rows starting at a point and going till the end of dataframe?
Would this work -
df = df.iloc[n:]
wooden sail
try it and see! that looks about right
limber kiln
wooden sail
try it and see! that looks about right
Yes, I ran an example and it worked!
wooden sail
!e
import pandas as pd
d = {"beep":[1,2,3,4], "boop":[5,6,7,8]}
d = pd.DataFrame(d)
print(d)
print(d.iloc[2:])
 arctic wedgeBOT
@wooden sail :white_check_mark: Your 3.11 eval job has completed with return code 0.
001 |    beep  boop
002 | 0     1     5
003 | 1     2     6
004 | 2     3     7
005 | 3     4     8
006 |    beep  boop
007 | 2     3     7
008 | 3     4     8
Awesome!
I have one more question please
I have a question regarding pandas for which I need to show a csv. How/where do I upload my sample csv. For instance, if I wanted to show code, I would use pastebin.
wooden sail
you could also paste the csv contents in pastebin
limber kiln
It doesn't work 😦
!e
import pandas as pd
df = pd.read_csv("https://pastebin.com/e2uWzVu5")
@limber kiln :x: Your 3.11 eval job has completed with return code 1.
001 | Traceback (most recent call last):
002 |   File "/usr/local/lib/python3.11/urllib/request.py", line 1348, in do_open
003 |     h.request(req.get_method(), req.selector, req.data, headers,
004 |   File "/usr/local/lib/python3.11/http/client.py", line 1282, in request
005 |     self._send_request(method, url, body, headers, encode_chunked)
006 |   File "/usr/local/lib/python3.11/http/client.py", line 1328, in _send_request
007 |     self.endheaders(body, encode_chunked=encode_chunked)
008 |   File "/usr/local/lib/python3.11/http/client.py", line 1277, in endheaders
009 |     self._send_output(message_body, encode_chunked=encode_chunked)
010 |   File "/usr/local/lib/python3.11/http/client.py", line 1037, in _send_output
011 |     self.send(msg)
... (truncated - too many lines)
Full output: https://paste.pythondiscord.com/efufuxiqer.txt?noredirect
wooden sail
ah yeah, THAT won't work 😛
do you mean you have to share the CSV with me so that i understand the problem, or your problem is that you want to be able to load the csv contents when the csv is hosted elsewhere?
limber kiln
wooden sail
do you mean you have to share the CSV with me so that i understand the problem, ...
The latter for now. Once I know I can easily load a .csv I can quickly clarify my doubts by asking people
wooden sail
i'm not sure there's an easy way to do that. you can share your code as is, and separately share a pastebin with the csv contents. the other person will have to copy paste the pastebin contents into a csv first. alternatively, you can put the code and csv into a github repo and share the link to that
limber kiln
wooden sail
i'm not sure there's an easy way to do that. you can share your code as is, and ...
But I am not able to even paste the pastebin contents here
I suggest you try it. The message won't send
wooden sail
you just share the pastebin link
limber kiln
 wooden sail
then the other person will have to copy and paste stuff by hand from pastebin
limber kiln
wooden sail
then the other person will have to copy and paste stuff by hand from pastebin
Sounds good! Thanks so much for your help 🙂
royal hound
tacit basin
What's your question specifically?
could my data be bad
as in not right or not proper
 tidal bough
wdym? like, running entirely on it? I wouldn't guess that whatever chips are in webcams have enough compute to run anything nontrivial.
 brave sand
tidal bough
wdym? like, running entirely on it? I wouldn't guess that whatever chips are in ...
brave sand
tidal bough
wdym? like, running entirely on it? I wouldn't guess that whatever chips are in ...
I trained a model to detect a thumbs up. I have the .pt file. How can I run this model on another webcam? Like a webcam connected to a pc
tidal bough
You need torch installed on the other computer, too. You pretty much run the same script as you trained the model with, just instead of training, you load the weights from the file and evaluate the model on whatever inputs you want.
It's also possible to do it more fancily - compile the model to an intermediate representation that can then be used from e.g. C++: https://pytorch.org/tutorials/beginner/Intro_to_TorchScript_tutorial.html
brave sand
tidal bough
You need torch installed on the other computer, too. You pretty much run the sam...
So that’s the thing, I didn’t train it on my computer, I used an app
So I want to run this .pt file on my computer, how can I do that?
tidal bough
Something like model = torch.load(the_file_path)
brave sand
tidal bough
Something like `model = torch.load(the_file_path)`
and I run it on a webcam?
tidal bough
You can run it on frames you get from the webcam, sure
brave sand
tidal bough
You can run it on frames you get from the webcam, sure
how would one do that?
tidal bough
For getting the frames from the camera, I think opencv can do that
tacit basin
royal hound
could my data be bad
data can always be bad. but why do you suspect your data is bad?
 tacit basin
royal hound
tacit basin
royal hound
about right to me
tacit basin
how many training images you have?
royal hound
so i will regenerate the data and try again
royal hound
tacit basin
how many training images you have?
20k
tacit basin
that should be plenty
royal hound
but 10 labels
tacit basin
that's fine
royal hound
gonna try again
tacit basin
how about label frequency/distribution?
like is it balanced?
about the same number of samples for each class?
also how you select your validation set? random?
as usual can play with learning rate and other hyperparams, differnet model arch etc
add image augmentation
that's image classification right?
royal hound
tacit basin
that's image classification right?
yep
royal hound
tacit basin
as usual can play with learning rate and other hyperparams, differnet model arch...
im not sure how to find the optimal learning rate tbh
untold cliff
In numpy, is it a good idea to creat a generator with a seed and then call seed seed sequence on it and spawn a new seed to actually use ? (Since as far as i understood seed sequence would give you a better seed if yours isnt that good i guess)
tacit basin
royal hound
im not sure how to find the optimal learning rate tbh
there is learning rate finder in fastai. learn.lr_find()
royal hound
tacit basin
there is learning rate finder in fastai. learn.lr_find()
im not using notebook so it doesnt show da graph
tacit basin
print it?.
royal hound
prints object
tacit basin
arctic wedgeBOT
fastai/callback/schedule.py line 268
def plot_lr_find(self:Recorder, skip_end=5, return_fig=True, suggestions=None, nms=None, **kwargs):```does it return any suggested learning rate even without graph i think it should
royal hound
ya it gives me 0.0017
but i tried that and it was worse
damn
i put new training images and its worse
wtf did i do 😭
tacit basin
you can try all suggestions: steep, valley, minimum, etc
tacit basin
royal hound
i put new training images and its worse
i guess every time you do random validation split? i guess you have imbalance in your labels right?
tacit basin
you could set seed so its always the same validation set, at least you will see repeatable resutls
but imbalanced labels is a problem
royal hound
should i just put in more training data then
tacit basin
how much imbalanced they are, what are the counts of each 10 labels?
royal hound
they are very imbalanced
tacit basin
royal hound
should i just put in more training data then
ideally you want labels to be balanced, if they are not you can try upsample some classes, downsample some classes, use weights for trainign, etc
tacit basin
royal hound
they are very imbalanced
whats very?
royal hound
each folder can varry from 200 to 6000 images
i can add more data then just manually level them?
or right a script to level them
tacit basin
so then if you get more images from the 200 class in validation it will get worse result if you get more images from 6000 class in your validation you get better result.
royal hound
.
tacit basin
when imbalanced labels then accuracy not the best measure
tacit basin
all depends on your validation set 🙂
it's just a number 🙂
you can manually select your validation set and keep it the same across the experiment runs so you can compare results.
tacit basin
you have resnet18 model, try larger model maybe
royal hound
tacit basin
you have resnet18 model, try larger model maybe
yeah might be that
the model kinda works but also doesnt
kinda freaky wtf
tacit basin
probably imbalanced labels... if i had to guess
royal hound
ya
keeps giving out 1 input and occasionaly different inputs
but thise occasional inputs are right
royal hound
nice invis ping
tacit basin
Bot removed my message
royal hound
damn
tacit basin
I can't understand why i can paste discord invite to fastsi server
royal hound
tacit basin
I can't understand why i can paste discord invite to fastsi server
i am already there
tacit basin
Just wanted to let you know for your fastsi journey:)
 wheat ice
royal hound
tacit basin
Just wanted to let you know for your fastsi journey:)
wheat ice
royal hound
tacit basin
Just wanted to let you know for your fastsi journey:)
asked a question there earlier no response yet
tacit basin
royal hound
asked a question there earlier no response yet
It's probably the way the question was asked if i have to guess. Just looked there
limber kiln
Can someone please help with this - #1082025065492787311 message
Thanks so much!

 versed flame
This might be an incredibly stupid question, but how much data is needed for 'ai' to learn?
meager fulcrum
versed flame
This might be an incredibly stupid question, but how much data is needed for 'ai...
depends what you're trying to do
usually a lot
versed flame
Then there's probably not enaugh.
If I have a bunch of incident/tickets.
Could somwhow have an AI go through them all and check answers.
And basically solve new tickets goingforward.
Or would I need millions of tickets to train it?
meager fulcrum
i wouldn't bother trying to train it from that
you can get ai text recognition models
which can then interface with another model like GPT Neo or something with the correct pre prompt you could get it to solve your problem
versed flame
My thought is that AI could solve 'easy' issues passing issues it cannot solve onto the team that usually solves them.
meager fulcrum
versed flame
My thought is that AI could solve 'easy' issues passing issues it cannot solve o...
what kind of incident reports would they be
versed flame
Well a big mix, which is probably a problem.
meager fulcrum
versed flame
Well a big mix, which is probably a problem.
i mean like what catagory
versed flame
I realize that its probably getting complicated.
Cause I'd have to have the AI check other systems. Mostly it would be application issues.
User created tickets, Ie. this button does not work.
meager fulcrum
versed flame
Cause I'd have to have the AI check other systems. Mostly it would be applicatio...
oh then thats actually quite simple, you can feed a question answering model a bunch of your previous questions and solutions
so if you have your old tickets saved
write them out and you can fine tune a question answering model to answer your questions and if it fails and the user doesn't accept their problem has been fixed then push it through to your team

there are some pre trained question answering models there
versed flame
I cannot access the tickets myself currently, its more of an idea at work.
The data is semisensitive aswell, so I coulnt do it myself.
meager fulcrum
yeah that's no problem, the link i sent here is a list of different language models that can be fine tuned to your needs
there are over 3700 models just for question answering alone
im sure there will be one, you or whoever else can use
versed flame
As a 'test' I assume I could have it answer certain tickets first, and monitor the reponses etc.
meager fulcrum
versed flame
As a 'test' I assume I could have it answer certain tickets first, and monitor t...
so this is kinda how it works here

you give the model some context that would be like some old messages, then you would pass through the question
it will go through all the data you have put in the context and it will calculate the correct or best resolution to that question
and if you're super smart and protective of course you can pass through conversations in real time that have been approved by the user that have resolved the issue so it learns as its in production
or you could have it as an internal training system where you give it a question, if it answers wrong you can tell it the answer through another input
and it will slowly get it right
there are a few ways you can get it done but to make it good it will take time
versed flame
It would be a fun experiement, but I recon Im way to green to do it myself. But I really appriciate the advice, it sounds like the plan is not totally sci-fi.
simple tapir
hey
meager fulcrum
versed flame
It would be a fun experiement, but I recon Im way to green to do it myself. But ...
trust me, every idea anyone ever had to do with AI sounded sci fi at one point or another
just gotta have the intent to create it
meager fulcrum
simple tapir
hey
sup
simple tapir
def showImg(data:torchvision.datasets, name:str,gray_scale:bool):
    classes = data.classes
    index_no = 0
    for i in range(len(classes)):
        if classes[i].lower() == name.lower():
            index_no = i
        else:
            print("Such an image doesn't exist in this dataset.")
    if gray_scale:
        plt.imshow(data[0][index_no].squeeze(), cmap="gray")
        plt.axis(False)
        plt.title("Image of ", name)
        plt.show()
    plt.imshow(data[0][index_no].squeeze())
    plt.axis(False)
    plt.title("Image of ", name)
    plt.show()
I get out of range error. I double checked and still couldnt find the mistake in the code
versed flame
meager fulcrum
trust me, every idea anyone ever had to do with AI sounded sci fi at one point o...
I also hear alot that its 'unreliable' but still I feel like if it'd be 90% reliable, that would still be worth it.
meager fulcrum
simple tapir
```py
def showImg(data:torchvision.datasets, name:str,gray_scale:bool):
clas...
can you show me what data.classes looks like
meager fulcrum
versed flame
I also hear alot that its 'unreliable' but still I feel like if it'd be 90% reli...
well its like with anything, if you put shit in you get shit out
good, reliable data
is always the key to a great AI
simple tapir
meager fulcrum
can you show me what data.classes looks like
['T-shirt/top', 'Trouser', 'Pullover', 'Dress', 'Coat', 'Sandal', 'Shirt', 'Sneaker', 'Bag', 'Ankle boot']
meager fulcrum
simple tapir
```['T-shirt/top', 'Trouser', 'Pullover', 'Dress', 'Coat', 'Sandal', 'Shirt', 'S...
do this ```py
def showImg(data:torchvision.datasets, name:str,gray_scale:bool):
classes = data.classes
index_no = 0
for i in classes:
if classes[i].lower() == name.lower():
index_no = i
else:
print("Such an image doesn't exist in this dataset.")
if gray_scale:
plt.imshow(data[0][index_no].squeeze(), cmap="gray")
plt.axis(False)
plt.title("Image of ", name)
plt.show()
plt.imshow(data[0][index_no].squeeze())
plt.axis(False)
plt.title("Image of ", name)
plt.show()
that should work
simple tapir
list indices must be integers or slices, not str
i is an integer here, and we are putting a string as an index num
meager fulcrum
simple tapir
list indices must be integers or slices, not str
do this ```py
def showImg(data:torchvision.datasets, name:str,gray_scale:bool):
classes = data.classes
index_no = 0
for i in classes:
if i.lower() == name.lower():
index_no = i
else:
print("Such an image doesn't exist in this dataset.")
if gray_scale:
plt.imshow(data[0][index_no].squeeze(), cmap="gray")
plt.axis(False)
plt.title("Image of ", name)
plt.show()
plt.imshow(data[0][index_no].squeeze())
plt.axis(False)
plt.title("Image of ", name)
plt.show()
i got lost then, i was thinking of JS 
simple tapir
Nope it doesn't work
But I saw my mistake
for i in range(len(classes)):
here it should be len(classes)-1, since arrays start at 0
But now, I have a different problem 
the current code is:
def showImg(data:torchvision.datasets, name:str,gray_scale:bool):
    classes = data.classes
    index_no = 0
    for i in range(len(classes)-1):
        if classes[i].lower() == name.lower():
            index_no = i
        else:
            print("Such an image doesn't exist in ", data.__class__.__name__)
            break
    if gray_scale:
        plt.imshow(data[0][index_no].squeeze(), cmap="gray")
        plt.axis(False)
        plt.title(name)
        plt.show()
    else:
        plt.imshow(data[0][index_no].squeeze())
        plt.axis(False)
        plt.title(name)
        plt.show()
When i enter a fashion mnist dataset as a param, it says
Such an image doesn't exist in FashionMNIST
But ironically, it also works and shows the image
Why does that happen?
oh, it increases i then the else block catches it
Dang, got it now
meager fulcrum
my internet cut out before i could edit my message
but you got it so thats good

simple tapir
Thanks man
meager fulcrum
np
queen cradle
untold cliff
In numpy, is it a good idea to creat a generator with a seed and then call seed ...
No, there's never any need to do this. The quality of NumPy's RNG doesn't depend on the seed, and re-seeding using RNG output can't increase the amount of randomness.
untold cliff
queen cradle
No, there's never any need to do this. The quality of NumPy's RNG doesn't depend...
Ok, thanks!
 queen cradle
 clear basalt
!codeblock
arctic wedgeBOT
clear basalt
queen cradle
clear basalt
https://paste.pythondiscord.com/eraqegadus
The comma at the end of the 'Latitude' line is missing.
Also, it's spelled "Longitude". (You probably knew that, but there's a typo.)
meager fulcrum
i have the strangest issue
how do i stop my text generation bot from making spelling mistakes

programing 
 solar gazelle
Hey I have an excel sheet containing nutritional breakdowns of over 2700 foods. Each food has 40 components tracked. What would be the best way to store and interact with this in python?

My end goal is to build a personal nutrition tracker so the user needs to be able to search for foods, see a breakdown of it, set the amount of it they ate if applicable, and have it summed up in a daily total
I'll most likely use Tkinter for UI
meager fulcrum
can someone guide me to a resource i can use to fine tune this model to converse properly it kinda does this
also the Robot: is generated by the model its not supposed to say Robot:
 brave sand
import torch
import torchvision.transforms as transforms
from PIL import Image
from torchvision import models
from torch import nn


# Load the model
model = models.mobilenet_v2(weights=models.MobileNet_V2_Weights.DEFAULT)
num_ftrs = model.classifier[1].in_features
model.classifier[1] = nn.Linear(num_ftrs, 2)
model_with_softmax = torch.nn.Sequential(model, torch.nn.Softmax(dim=1))

model_with_softmax.load_state_dict(torch.load("model.pt"))
model_with_softmax.eval()

# Load and transform the image
transform = transforms.Compose([
    transforms.Resize((224, 224)),
    transforms.ToTensor(),
    transforms.Normalize([0.485, 0.456, 0.406], [0.229, 0.224, 0.225])
])
image = Image.open("no_thumbs_up_image.jpg")
image = transform(image)
image = image.unsqueeze(0)

# Use the model to make predictions
with torch.no_grad():
    outputs = model(image)
    _, predicted = torch.max(outputs, 1)

# Print if a thumbs up is found in the image
if predicted.item() == 1:
    print("Thumbs up found in the image!")
else:
print("Thumbs up not found in the image.")```how come this always evaluates to thumbs up in the image?
brave sand
so I didn't really "train" this model
I used an app that trained it for me in real time
 nova pollen
o
nova pollen
mm
try printing the outputs
if they look odd there could be something going on there
brave sand
tensor([[-0.4611, 0.5615]]) Thumbs up found in the image!
brave sand
nova pollen
if they look odd there could be something going on there
does it look odd?
nova pollen
mm
well minor point but you've actually called model, not model_with_softmax which i've just noticed because softmax would never output a negative
but the weights would have been loaded into model anyway so that shouldn't cause an issue
the numbers look reasonable too
brave sand
I can't think of a way to verify this unless I show the bounding boxes right?
nova pollen
I don't think mobilenet (by itself) has bounding boxes?
brave sand
like manually using OpenCV or Pillow to draw the bounding boxes
nova pollen
right, but it doesn't produce bounding box outputs
mm that might be something
what kind of image is no_thumbs_up_image?
brave sand
just an image of my face with no thumbs up
nova pollen
mm
brave sand
thumbs_up_image is a picture of my face with a thumbs up
should I try other images too?
just to see it isnt a one time thing
nova pollen
what kind of images were used to train the model? you said it was done in real time?
brave sand
nova pollen
what kind of images were used to train the model? you said it was done in real t...
yeah so I used my camera to see multiple angles of a thumbs up, and a background
one continuous video for each
brave sand
so maybe it's too good to be true?
brave sand
nova pollen
could you try using a frame from those videos perhaps
sure, if Im able to get it to my desktop
nova pollen
brave sand
so maybe it's too good to be true?
it's not impossible, but there are many ways that things could go wrong
its a little harder to figure out without knowing the training procedure
brave sand
nova pollen
it's not impossible, but there are many ways that things could go wrong
so with a similar "white door" background like in training, it works
that's a relief
so it's impossible to draw a bounding box?
nova pollen
well, if it wasn't trained with bounding boxes, there's no way to know what the draw boxes around
nova pollen
brave sand
so with a similar "white door" background like in training, it works
perhaps your thumbs up detector actually learnt how to be a white door detector 😅
brave sand
nova pollen
perhaps your thumbs up detector actually learnt how to be a white door detector ...
yeah LOL, perhaps
nova pollen
if your images are all (thumbs + white door) or (no thumb + no white door) then there's not really a way to "know" it should be a thumb detector
brave sand
maybe there is a drawback to this I guess
meager fulcrum
bitch ass robot
 brave sand
nova pollen
if your images are all (thumbs + white door) or (no thumb + no white door) then ...
brave sand
nova pollen
if your images are all (thumbs + white door) or (no thumb + no white door) then ...
would doing it on multiple backgrounds be better?
thumbs and no thumbs?
nova pollen
yep, the more variations you give the better
brave sand
that is very cool. I am going to try that. does zoom matter?
this was just a test of the app, I wanted to use a detector on a drone
can I train it on images close up or does it have to be 50 feet in the air?
nova pollen
you can think of the model as being as lazy as possible. the simplest way to achieve the objective could be the one it lands on. much easier to detect when a big chunk of the image is white, rather than figure out if your thumb is out or not
meager fulcrum
meager fulcrum
bitch ass robot
can someone help me with these deprecation things here they're driving me nuts
along with the setting pad_token_id thing
nova pollen
brave sand
can I train it on images close up or does it have to be 50 feet in the air?
if you want to detect drones in the air, you'll need pictures of drones in the air vs no drone in the air
brave sand
nova pollen
you can think of the model as being as lazy as possible. the simplest way to ach...
that makes sense
brave sand
nova pollen
if you want to detect drones in the air, you'll need pictures of drones in the a...
I want to detect a landing pad on the ground from a drones perspective
would I have to collect data via a drone or can I just take pictures of the landing pads from my phone?
nova pollen
meager fulcrum
can someone help me with these deprecation things here they're driving me nuts
https://huggingface.co/docs/transformers/main_classes/logging
these seem to be logging messages, maybe you can decrease the verbosity (ERROR level would be the lowest, only outputting something when there's an error)
nova pollen
brave sand
would I have to collect data via a drone or can I just take pictures of the land...
first one would be preferable
meager fulcrum
nova pollen
<https://huggingface.co/docs/transformers/main_classes/logging>
these seem to be...
i dont wanna hide them i want to fix them but for now i will just do that
brave sand
got it, makes sense
meager fulcrum
to begin with im just fine tuning
and im also concerned because the ai keeps calling saying "your human"
and stuff
brave sand
there's no way to get the coordinates of the detection either right?
meager fulcrum
idk if its just bad at grammar or it thinks it owns me or something 
brave sand
without the bounding boxes
nova pollen
meager fulcrum
i dont wanna hide them i want to fix them but for now i will just do that
the pad_token_id seems to be informational messages, so they're safe to ignore
the deprecation warnings are telling you that the code you're using is old, and shouldn't be used anymore
nova pollen
brave sand
there's no way to get the coordinates of the detection either right?
mobilenet by itself just processes the whole image, so there's not going to be a bounding box output
there are variations to it (mobilenet ssd), but that would require you to have training data with the bounding box
meager fulcrum
nova pollen
the pad_token_id seems to be informational messages, so they're safe to ignore
t...
i mean im going to change it later anyways because its using the same end of sentence id which isn't good
but for now it should be just fine
brave sand
nova pollen
mobilenet by itself just processes the whole image, so there's not going to be a...
ah that sucks then. thanks anyways

 serene silo
How to get into developer mode on a chromebook when Ctrl + D then Enter won’t work?
meager fulcrum
lmao
serene silo
serene silo
How to get into developer mode on a chromebook when Ctrl + D then Enter won’t wo...
Anybody?
 marsh coral
serene silo
How to get into developer mode on a chromebook when Ctrl + D then Enter won’t wo...
marsh coral
serene silo
How to get into developer mode on a chromebook when Ctrl + D then Enter won’t wo...
i think you're in the wrong channel
ask in off-topic
 wispy brook
I have a pd.DataFrame. For a certain column, I would like to set all values after a date to another value, regardless of whether or not there was a value previously there.
Example:
Turn this:
            'A'  'B'
2001-01-01  NaN   0
2001-01-02  2     0
2001-01-03  NaN   0
2001-01-04  5     0
2001-01-05  NaN   0

Into this:
            'A'  'B'
2001-01-01  NaN   0
2001-01-02  2     0
2001-01-03  10    0
2001-01-04  10    0
2001-01-05  10    0
Does anyone know how to do this? I know how to do it in Numpy but Pandas is being a jerk 😦
serene scaffold
wispy brook
I have a pd.DataFrame. For a certain column, I would like to set all values afte...
df.loc[pd.Timestamp('2001-01-03'):, "'A'"] = 10
something like that
 lament dome
hey everyone, do you guys know of any good websites that are free or maybe payable for datasets.... has to have a massive library
im using huggingface but wanting to know if theirs any more websites out there
 agile cobalt
lament dome
hey everyone, do you guys know of any good websites that are free or maybe payab...
agile cobalt
lament dome
hey everyone, do you guys know of any good websites that are free or maybe payab...
which kind of dataset?
there's https://datasetsearch.research.google.com/
 lucid summit
I have a pandas series like
datetime word
2022-01-31 a 0.500000
b 0.583333
2022-02-28 a 0.562500
b 0.560000
2022-03-31 a 0.631579
b 0.380952```
How would I plot 2 lines, one for a and one for b? sinful scaffold
lucid summit
I have a pandas series like
```py
datetime word
2022-01-31 a 0.500000
...
sinful scaffold
lucid summit
I have a pandas series like
```py
datetime word
2022-01-31 a 0.500000
...
you can use the groupby() function
grouped = df.groupby('word')
Plot the data for each word
fig, ax = plt.subplots()
for name, group in grouped:
ax.plot(group['datetime'], group['score'], label=name)
new on discord sorry dunno how to format code
lucid summit
sinful scaffold
you can use the groupby() function
I've solved it thank you
lucid summit
sinful scaffold
new on discord sorry dunno how to format code
!code
arctic wedgeBOT
sinful scaffold
lucid summit
!code
Thanks
 odd path
I am looking for fast api chennels. Where I find them please ?
 long locust
odd path
I am looking for fast api chennels. Where I find them please ?
long locust
odd path
I am looking for fast api chennels. Where I find them please ?
Maybe #web-development , or #❓|how-to-get-help
odd path
thanks @long locust
 bleak zealot
[0.5560045 ]
[0.5547551 ]
[0.5546342 ]
[0.55464 ]
If datasets have different decimals after 0. does that mean anything when doing predictions in LSTM, or should i change my dataset (from Y.finance) to have same decimals after 0 ?
Im thinking the data would be more precise if it was cleaned up in to same length decimals? But again wouldnt that also destroy the data since its now missing decimals to calculate on?
Btw it works even with different decimals, im just trying to learn sorry if my question is dumb or stupid.
tidal bough
I don't see why you'd want to round the data to some number of decimals - that'd lose (a small) part of information.
bleak zealot
tidal bough
I don't see why you'd want to round the data to some number of decimals - that'd...
Right thanks, as said im still pretty new so just wanted to hear others opinion's about cleaning up data that way, but my logic was also that i would lose a small part of the data. Thanks
bleak zealot
tidal bough
I don't see why you'd want to round the data to some number of decimals - that'd...
Just one more question, wouldnt filling out the last with 0 in the dataset give more precision?
[0.5546342 ]
[0.55464 ]
What i mean is these 2 datasets how would they be calculated with different decimals? (yes i get how they are calculated) but my point is more wouldnt the dataset be more precise if the last was [0.5546400] Rather then just [0.55464 ]
(maybe im missing something or im looking my self blind on this sorry)
mild dirge
How it prints the numbers does not reflect the number of bits used to represent the value
They are the same precision
bleak zealot
Okay thanks that makes sense then
 grizzled hill
If my model has 5 layers : 1-embedding layer 2-conv1d layer 3-maxpooling layer 4- rnn layer 5- dense layer Does my model considered deep ?
limber kiln
grizzled hill
If my model has 5 layers : 1-embedding layer 2-conv1d layer 3-maxpooling layer 4...
I can be wrong here, but if I remember correctly, there's a proof that any model can be represented with a single layer.
Sorry, I know this doesn't directly answer your question
grizzled hill
Idk maybe you are right
mild dirge
grizzled hill
If my model has 5 layers : 1-embedding layer 2-conv1d layer 3-maxpooling layer 4...
Deep is pretty subjective, but I think that that model is pretty shallow still
grizzled hill
As i see on the internet if the neural network has more than 1 hidden layer it’s called deep model
mild dirge
grizzled hill
As i see on the internet if the neural network has more than 1 hidden layer it’s...
Hmm, yeah maybe it is just classified as deep then
meager fulcrum
alright so i seem to have an alright response now for my bot but it adds lots of extra information that does not need to be there and it sounds sarcastic as fuck
any suggestions on how i can refine the output
Please answer the following question: what is the capital of france
Answer: It is no surprise to receive the answer: "Paris" in this answer. Yes, you can read the answer on the internet, but the most helpful part is
 misty lava
Anyone familiar with creating a Twitter Streaming app with Kafka and Python?
 vestal flint
Hi guys!! Anyone aware of tic tac toe with 6x6 board with 3 player and 4 winning strike with ai python script?
 violet gull
https://www.kaggle.com/datasets/iamsouravbanerjee/animal-image-dataset-90-different-animals
why are some images over 2500 pixels and some under 100?

This Dataset Consist of 5400 Animal Images in 90 Different Classes
thats way too inconsistent
violet gull
@mild dirge how am i suppose to train on 10x10 data
cause i have to resize everything to the size of the smallest
mild dirge
says who?
You can resize them to any arbitrary size
There are even networks that can take multiple different sizes
violet gull
mild dirge
You can resize them to any arbitrary size
if i resize something bigger it loses its value
mild dirge
?
If you resize to smaller you lose information
To bigger you can maintain the information
violet gull
@mild dirge how does it fill in the missing data when upscale
mild dirge
There's multiple ways
wooden sail
whether you lose info on resizing to a smaller size depends on the original spectrum of the image
wooden sail
violet gull
<@309775277720993792> how does it fill in the missing data when upscale
the most common way is through fourier interpolation
violet gull
so im suppose to resize a 10x10 image into a 600x600 ish?
violet gull
so why is it in the data set
wooden sail
interleave zeros into the image in a regular pattern, which produces an aliased spectrum. then lowpass filter this to produce a clean interpolated image
mild dirge
violet gull
so why is it in the data set
Is it 10x10, or did you mean 100x100 when you said 100 pixels
violet gull
nvm im a moron
this is pretty big though

so i resize a 100x100 into a 600x600
that doesnt sound that much better
wooden sail
what are you doing
violet gull
wooden sail
what are you doing
wym
wooden sail
100x100 is probably already good enough
violet gull
wooden sail
100x100 is probably already good enough
alex net uses 600 ish
wooden sail
do you have enough memory for that?
violet gull
wooden sail
do you have enough memory for that?
probably
but 100 -> 600 seems bad
that means it has to fill in a lot of data
wooden sail
it's not gonna make it any worse. not any better either though, unless you use something fancy to upscale (you probably don't want to do that, as it'll be slow)
if you satisfy the nyquist criterion, images of any size will contain the same amount of info. you usually don't satisfy this condition when subsampling heavily, as when making very small images out of large ones
violet gull
wooden sail
it's not gonna make it any worse. not any better either though, unless you use s...

it looks pixelated
wooden sail
well yeah, it's not gonna create new info
it's the same info as in the one with a lower pixel count
wooden sail
because downsizing an image loses less info if you downsize it less
the smaller you make an image, the more info is lost
then when you try to make it large again, it looks pixelated. you can only avoid this by not making it small in the first place
agile cobalt
there is also the option of just filtering out images with shape way too small/large
violet gull
i tried 6000x6000
 agile cobalt
violet gull
https://www.kaggle.com/datasets/iamsouravbanerjee/animal-image-dataset-90-differ...
agile cobalt
violet gull
https://www.kaggle.com/datasets/iamsouravbanerjee/animal-image-dataset-90-differ...
in case you missed the 'Acknowledgment':
This Dataset is created from Google Images: https://images.google.com/. If you want to learn more, you can visit the Website.
Google Images. The most comprehensive image search on the web.
violet gull
201
466
1126
183
183
215
2595
1080
1199
163
630
169
1500
201
168
2400
960
1663
540
168
225
136
330
1282
1067
225
168
1066
632
438
1380
184
174
183
445
177
168
194
549
615
183
720
1707
183
188``` this is a sample of the data sizes. Will any issues be caused if i resize everything to 224x224the data quality will be all over the place, but it should™️ work
depending on what exactly you are trying to do, it might be better to just look for another dataset though
violet gull
@agile cobalt this dataset has a lot of images though
agile cobalt
you call 5400 a lot?
violet gull
do u know of a better set for aminal training?
agile cobalt
the first thing that comes to mind when talking about images for me is image-net
if you just take an existing model trained on it, it should already know a lot of animals
if you have a real use case, you can probably grab a dozen or so of pictures for each class you want to predict manually and fine-tune an existing model
violet gull
agile cobalt
if you just take an existing model trained on it, it should already know a lot o...
im not using an existing model
im training mine
agile cobalt
just to make sure: for any specific purpose or just experience / practice?
violet gull
i want it tell me dolphin is dolphin
agile cobalt
well, feel free to try to use the one you found earlier then
violet gull
ok yeah this dataset is terrible
wooden sail
it's realistic though
some amount of preprocessing, or a reparametrization of the input, is often required
violet gull
wooden sail
it's realistic though
there is duplicate images
and a dolphin emoji
A FRICKING EMOJI
wooden sail
right, so it's representative of how you find data in real life
you have to clean it up yourself
if that's not what you wanna do, look for a neat data set. this is pretty realistic though
wooden sail
probably not as well
violet gull
and emojis
 elder adder
Hello, I am new to python and trying to figure something out and unsure where to post it. So I am using Pandas in Jupyter to try manipulate a data frame and I need to clean a single column so it only holds the first value in each field, some only hold 1 value while others hold 3. This is for learning purposes and I have been told to use split in this scenario, I have got it working when I overwrite the current data frame but another condition is that I need to preserve the original and apply the new data to a new data frame which is where I am having trouble. My code is as follows...
albums['Genre'] = albums['Genre'].str.split(',', 1).str[0]

albums
How can I apply the outcome to a new data frame without overwriting the original? Thanks in advance
serene scaffold
elder adder
Hello, I am new to python and trying to figure something out and unsure where to...
you can just pick a name you're not already using for the left side of the assignment. so, not Genre
elder adder
Would that not make a new column within the data frame vs creating a whole new one?
serene scaffold
oh, sorry. you want to make a separate dataframe.
albums['Genre'].str.split(',', 1).str[0] will already give you a Series that is separate from albums. you can put .to_frame() on the end to make it into a DataFrame with one column.
elder adder
Sorry if I wasn't clear, but I need the whole data set modified and saved in a different dataframe
agile cobalt
first: why?
second: you could copy the original dataframe (new_df = df.copy()) and just overwrite/add the column on the copy
elder adder
Its for learning purposes I am doing a course, just the way i have been told to do it
 tight ice
Hey,
I'm looking for a way to remove a column that is generated when using json_normalize (pandas) on a column that could be null. I've created this json to try and find a way and so far I'm unsuccessful.
Source file:
[
{"_id":"1","updated":{"date": 1678135259}},
{"_id":"2"}
]
Result after pd.read_json (expected):
   _id               updated
0    1  {'date': 1678135259}
1    2                   NaN
Result after pd.json_normalize:
   _id  updated.date  updated
0    1  1.678135e+09      NaN
1    2           NaN      NaN
I'm looking for a way to prevent the updated column for being generated. It is the expected result of course as I did not provide a date value for id = 2.
elder adder
agile cobalt
first: why?
second: you _could_ copy the original dataframe (`new_df = df.copy()...
that works, thanks.
agile cobalt
tight ice
Hey,
I'm looking for a way to remove a column that is generated when using json...
you could just dropna()?
either before normalising if you want to get rid of columns that lack all fields,
or after normalising with axis = columns & how = all to get rid of unused columns
tight ice
Doesn't dropna work with values only
nvm, thanks! forgot to inplace when I was testing this
 agile cobalt
tight ice
nvm, thanks! forgot to inplace when I was testing this
agile cobalt
tight ice
nvm, thanks! forgot to inplace when I was testing this
you may want to avoid using in-place
just do df = df.operation() or df[col] = df[col].operation() instead of ....operation(inplace=True)
tight ice
Thanks! I'll have a look.
 old flax
Hello guys is there a reason to choose querying csvs directly over uploading the csvs into a db and then querying the db instead?
 unkempt reef
Looking for feedback/suggestions on my first Python Data Analysis project :
https://www.kaggle.com/code/mahmoudmagdy211212/analysis-of-college-majors

Explore and run machine learning code with Kaggle Notebooks | Using data from College Majors
old flax
i'm making use of sqlite3 in this case for the database and i don't have issues with sql and the programming language. If this is the case, which would you advice i go for?
old flax
okay...i haven't tried csv queries before which was the main reason i had to ask
this is really the points my choice would hinge on; For the queries i need to make, i need to link two different datasets together. I know with sql, i can make a foreign_link with another table and then get access to other values of that table. The datasets are more or less around 60000 rows of data. I don't know how csv queries would perform in this regard?
18 columns
okay, thanks with this. I would go with the db then
 rocky ore
asking for some help
with elif statements
import secrets

bankroll = 0

def random_game(local_bankroll):
    seed = 1 + secrets.randbelow(74)
    if seed < 6:
        local_bankroll += 200
    elif seed < 11:
        local_bankroll += 150
    elif seed < 34:
        local_bankroll += 100
    elif seed < 44:
        local_bankroll -= 200
    elif seed < 64:
        local_bankroll -= 100
    return local_bankroll

def random_games(num):
    global bankroll
    internal = 0
    for foo in range(0,num):
        internal += random_game(internal)
    print(internal)
    bankroll += internal
    internal = 0
    print(bankroll)
on random_games(3), this returns -800, which shouldn't be possible
ah, i think i know the problem
old flax
you might want to use return within the if and elif instead of at the end of the conditionals, as its possible its traversing through all the conditionals
rocky ore
the actual issue is that the internal variable is preserved
so it's looping through num^2 times, or something like that
old flax
rocky ore
so it's looping through num^2 times, or something like that
i don't get how you're calling it so might not be able to get the context of what you mean
rocky ore
the idea is to trial a game with around 2 variance, and 0.005 EV
i found out the problem, because it's passing internal to random_game, you have internal being a base
better way to do it is via direct assignment, or by turning the internal += to internal =
meager fulcrum
anyone know why trying to install deepspeed is giving me all these errors?
PS F:\Github Repos\Train\DeepSpeed> python3 setup.py egg_info
DS_BUILD_OPS=1
 [WARNING]  async_io requires the dev libaio .so object and headers but these were not found.
 [WARNING]  If libaio is already installed (perhaps from source), try setting the CFLAGS and LDFLAGS environment variables to where it can be found.
 [WARNING]  One can disable async_io with DS_BUILD_AIO=0
 [ERROR]  Unable to pre-compile async_io
Traceback (most recent call last):
  File "F:\Github Repos\gpt\DeepSpeed\setup.py", line 156, in <module>
    abort(f"Unable to pre-compile {op_name}")
  File "F:\Github Repos\gpt\DeepSpeed\setup.py", line 48, in abort
    assert False, msg
AssertionError: Unable to pre-compile async_io```i cloned the repo and ran the command it said
i also tried pip installing it
PS F:\Github Repos\Train\DeepSpeed> pip install deepspeed
Collecting deepspeed
  Using cached deepspeed-0.8.1.tar.gz (759 kB)
  Preparing metadata (setup.py) ... error
  error: subprocess-exited-with-error

  × python setup.py egg_info did not run successfully.
  │ exit code: 1
  ╰─> [13 lines of output]
      Traceback (most recent call last):
        File "<string>", line 2, in <module>
        File "<pip-setuptools-caller>", line 34, in <module>
        File "C:\Users\user\AppData\Local\Temp\pip-install-d7bee7l7\deepspeed_cb15ee1104c449f8890f1d59b2adce28\setup.py", line 156, in <module>
          abort(f"Unable to pre-compile {op_name}")
        File "C:\Users\user\AppData\Local\Temp\pip-install-d7bee7l7\deepspeed_cb15ee1104c449f8890f1d59b2adce28\setup.py", line 48, in abort
          assert False, msg
      AssertionError: Unable to pre-compile async_io
      DS_BUILD_OPS=1
       [WARNING]  async_io requires the dev libaio .so object and headers but these were not found.
       [WARNING]  If libaio is already installed (perhaps from source), try setting the CFLAGS and LDFLAGS environment variables to where it can be found.
       [WARNING]  One can disable async_io with DS_BUILD_AIO=0
       [ERROR]  Unable to pre-compile async_io
      [end of output]

  note: This error originates from a subprocess, and is likely not a problem with pip.
error: metadata-generation-failed

× Encountered error while generating package metadata.
╰─> See above for output.

note: This is an issue with the package mentioned above, not pip.
hint: See above for details.```
 patent lynx
I'm making a nba betting regression. Where I predict points scored using the team statistics (3pt%, steals, etc..). What should be my baseline model be?
A multivariate linear regression? Or a quantile regression?
rocky ore
by the way, what's standard good practices with globals in Python?
wooden sail
not using globals :p
 untold bloom
globals as "constant"s are fine to use, they are written conventionally with all capital letters in snake_case
you can find examples in, e.g., standard library, e.g., the zipfile module
though, if you have a lot of related enumerable constants, you might be better off with an enum, e.g., see the standard library's re module for the flags it exposes (re.IGNORECASE etc.)
 stone pecan
I have a question so ... extracting data from a spread sheet are you using sql and python together or one or the other by themselves or does it just depend case by case ?
 mossy lance
stone pecan
I have a question so ... extracting data from a spread sheet are you using sql a...
mossy lance
stone pecan
I have a question so ... extracting data from a spread sheet are you using sql a...
sql is for databases - if you're just parsing a spreadsheet then you won't need it, so python should be enough
mossy lance
rocky ore
by the way, what's standard good practices with globals in Python?
if you're doing stuff with hyperparameters or anything like that then this might be interesting https://github.com/rbgirshick/yacs
GitHub
YACS -- Yet Another Configuration System. Contribute to rbgirshick/yacs development by creating an account on GitHub.
rocky ore
eh, i'm using globals to control hard-coded literals
mossy lance
yeah fairs that'd be way overengineering it then lol
mossy lance
patent lynx
I'm making a nba betting regression. Where I predict points scored using the tea...
that is the entire process
patent lynx
Alright what i dont get is
When using quantile regression what score are we using?
Although we can use r2 on the median quantile 0.5 when we are evaluating lower and upper quantile lets say 0.025 and 0.975 r2 kinda makes no sense
 jagged moon
Hey guys, I'm using pandas to drop duplicates from Dataframe. However, yes he is dropping the duplicates rows and leave only the first occurance, but it is also dropping the rows that don't have duplicates.
Does someone know why is this happening
 boreal gale
jagged moon
Hey guys, I'm using pandas to drop duplicates from Dataframe. However, yes he is...
boreal gale
jagged moon
Hey guys, I'm using pandas to drop duplicates from Dataframe. However, yes he is...
could you provide any examples to illustrate this behaviour you are seeing?
jagged moon
not really, I am just making csv to test some data and make absolute copy of three of the rows, and the others i am leaving without copy
patent lynx
I'm still developing it
Sorry i cant help ya that much but currently I'm doing streamlit as the web interface
I containerize my model on the cloud and use google cloud as the container storage
Yeah we need to use a docker and create an environment with the necessary packages.
Then use something like fast api so the model returns a json file which essentially returns an API
This is taking me too long i guess, my peers helped me out haha
Dont use it too much tho
mint palm
i am mainly looking for ML role
what skills do i lack?

i notice AWS, CUDA optimisation as constantly something thats listed and i dont know, should these be high priority?
what other things should i learn?
 austere swift
ai detection software is tailored to detecting text written by language models, so if you rewrite it in your own words then it likely wouldn't get detected by that software
nonetheless, don't cheat, its bad, and if you get in trouble I take no responsibility
 hoary jay
so for image recognition, when you do object localization with bounding boxes, and say all images have different sizes, what should be done? like can you just create bounding boxes of same sizes and then pass the image matrix within the bounding box into the CNN?
that should be better than just resizing every image to (say 28x28) right?
mint palm
hoary jay
so for image recognition, when you do object localization with bounding boxes, a...
you can do padding
if input image size is issue
hoary jay
mint palm
you can do padding
can u elaborate?
oh i see like just make every image the same size by padding white pixels?
or something like that?
mint palm
hoary jay
oh i see like just make every image the same size by padding white pixels?
yeah something like that
basically cropping/resize/ padding any would work
but resize can change aspect
cropping might loose info
there are pros and cons, just go through it ones
hoary jay
mint palm
yeah something like that
basically cropping/resize/ padding any would work
but r...
but like most images also contains useless background that i don't want, so is it ok to just put bounding boxes and then only train the model in the image within that?
something like that, so for every image irrespective of it's dimensions, the object will have the same bounding box and so is it ok to only use the image within the bounding box to train the network..?
 mint palm
hoary jay
something like that, so for every image irrespective of it's dimensions, the obj...
mint palm
hoary jay
something like that, so for every image irrespective of it's dimensions, the obj...
do you mean first crop cars, then use cropeed image(of only cars) to train algo for identifying cars in image?
 fierce patio
hello ho can i fix the runtimeerror: unable to find a valid cudnn algorithm to run convolution
mint palm
fierce patio
hello ho can i fix the runtimeerror: unable to find a valid cudnn algorithm to ...
torch not compatible/ installed properly
hoary jay
mint palm
do you mean first crop cars, then use cropeed image(of only cars) to train algo ...
yeah kind of, actually it's not cars i Just used it as an example, actually i have photos of 3 different feet types, low arch, normal arch and flat feet so i need to classify them, but the images have varying sizes
mint palm
is test set has minimal surrounding, then you can do that,
but if surrounding is there, than you should something like YOLO or something
hoary jay
mint palm
is test set has minimal surrounding, then you can do that,
but if surrounding is...
it has alot of objects in surrounding and other feet as well that may not belong to the patient who sent it (someone standing in background)
mint palm
hoary jay
it has alot of objects in surrounding and other feet as well that may not belong...
then probably identify all foots in image, classify each of them
is what a good model should do
YOLO could do that, but for train set, you will have to annotate all foots(lmao) in image
hoary jay
mint palm
YOLO could do that, but for train set, you will have to annotate all foots(lmao)...
yeh it's annotated/ labelled i just need to build bounding boxes
mint palm
hoary jay
yeh it's annotated/ labelled i just need to build bounding boxes
annotated? means you already have x and y co-ordinate?
of all foot in image?
and their labelsss
hoary jay
mint palm
annotated? means you already have x and y co-ordinate?
no i think I'm mistaken.. the images are already classified as flat/normal etc... but idk what u mean by annotations
hoary jay
their dimension?
hoary jay
mint palm
show me X and Y for one image
right?
mint palm
everything thsts provided
hoary jay
i just have images... taken from phones
that's it, and they are in seperate folders so i know their classification type
i still have to use cv2 to create bounding boxes around the feet area (which i think what you meant by annotations??)
hoary jay
mint palm
<@685053757767024712>
i have 3 different folders contains thousands of images of 3 different feets....flat, normal and low arch
(that sounds so wrong 😭)
mint palm
so one folder has only flat foot
one only low arch
etc
hoary jay
yes so you get what im saying right
mint palm
hoary jay
yes so you get what im saying right
ok and even when image is in flat foot folder, it has other foots in background which are normal?
hoary jay
mint palm
ok and even when image is in flat foot folder, it has other foots in background ...
yeah some of them do...
most of them only have like the floor and furniture in the surrounding
mint palm
hoary jay
yeah some of them do...
if they are fairly scarse, leave them be
hoary jay
hmm ok
hoary jay
mint palm
no need to crop also
alright then although i can try cropping with bounding boxes right? like it's not a wrong approach right if its not losing information (like if arch of the feet is clearly visible)
mint palm
hoary jay
alright then although i can try cropping with bounding boxes right? like it's no...
basically depend on test set, if train set has too easy examples, that is easy to classify(which cropping will cause), then test set might be harder for it to deal with
try keeping test set as close as possible to target set
target -testset
mint palm
hoary jay
also what to do about images of varying sizes?
maybe you can try cropping as well as padding, i am not sure
resizing might be bad as aspect is important in this use case, what do you think?
hoary jay
yep resizing would be bad it could mess up how the feet arch looks
well i think I know what to do tho thanks for your help
mint palm
np
fierce patio
can phd student use Azure for free ? if yes is it available for all country ?
 austere swift
fierce patio
can phd student use Azure for free ? if yes is it available for all country ?
austere swift
fierce patio
can phd student use Azure for free ? if yes is it available for all country ?
I don't think you can use azure free unless theres some deal with your university, but colab is free for everyone worldwide
 sweet river
Hey, I want some help in my project, is any one aware about firebase and is interested to do the project?
edgy falcon
Somebody can help me with this error: ValueError: Shapes (None, None) and (None, None, None, 131) are incompatible
Here is my model:
def __init__(self):
super(HyA_Model, self).__init__()
self.conv2D_1 = tf.keras.layers.Conv2D(131, kernel_size=10)
self.conv2D_2 = tf.keras.layers.Conv2D(131, kernel_size=10)
self.output_1 = tf.keras.layers.Dense(131, activation="softmax")
def call(self, images):
x = self.conv2D_1(images)
x = self.conv2D_2(x)
return self.output_1(x)
modelo = HyA_Model()
modelo.build(input_shape=(None, 320, 320, 3))``` lean jacinth
Anybody worked with the Roboflow YOLO platform?
lean jacinth
edgy falcon
Somebody can help me with this error: **ValueError: Shapes (None, None) and (Non...
Looks like either your input shape for the model is wrong or the shape of your training data is wrong
Might wanna put in an input layer to define it
edgy falcon
Thank u bro, i'll check it out
lament dome
if i had a model thats like chatgpt, how would one go about integrating that ai into a customer service like discord bot ??
 kindred raven
Hello! Anyone that can help with Machine Learning in Python? I am trying to do a sentiment analysis with Multinomial NB.
 somber bison
can someone help me here https://stackoverflow.com/questions/75672213/crop-image-into-multiple-parts-python

Stack Overflow
I'm doing the break captcha problem and my images are 150*35 and this is part of my problem
Part of problem
I tried using pillow but since i hadded to stride I Could not
mild dirge
somber bison
can someone help me here https://stackoverflow.com/questions/75672213/crop-image...
There's already an answer
somber bison
That's not good bro look at the comment
mild dirge
You can literally just change two values that fix that
Change the stride
Change the width and height of the crop
bro
old flax
hello guys, i'm currently working with a an .xlsx file. I need to convert it to csv and extract a column from it, the image of the content would be attached. How do i do it for a complicated file as this.
 versed flame
Im looking to build a personal project where I need to read either a screenshot or using phone camera a grid 'images' and figure out what is what. Would it be easier to match image to image or should I go by text as there's text on the images aswell?
https://i.imgur.com/QqHOVyg.png Example of image scanned for.
Should I track text or the acutal picture.
tidal bough
why do boxplots default to showing outliers even though of course any decently-sized dataset will have hundreds 😔
 mild dirge
Why does matplotlib require you to use plt.title() but ax.set_title(), so many questions ...
tidal bough
genre_counts = (
    df.select(pl.col("pub_year"), pl.col("genre"))
    .explode("genre")
    .groupby(pl.col("pub_year").sort())
    .agg(pl.col("genre").value_counts())
    .explode("genre")
    .unnest("genre")
)
per_year_counts = genre_counts.groupby("pub_year").agg(pl.col("counts").sum())
(
    genre_counts.with_columns(
        genre_counts.join(per_year_counts, on="pub_year").select(pl.col("counts") / pl.col("counts_right"))
    )
    .rename({"counts": "proportion"})
    .pivot(values="proportion", columns="genre", index="pub_year")
    .fill_null(0)
    .to_pandas()
    .set_index("pub_year")
    .plot.bar(stacked=True)
)
i'm at this point not at all sure I'm using polars right 🥴
mint palm
generally how much work is expected to be done daily on work?
i feel like i am slow to finish tasks? as a fresher
 vapid yoke
@mild dirge I opened the tensor model help thread if you remember, you suggested to increase maxpooling layers.
But wouldn't it would overfit the model? I already have so many layers
mild dirge
80 million parameters would make your model overfit
Pooling layers have zero parameters
Convolutional layers have maybe a few hundred in your case
vapid yoke
so I needd to remove the useless parameters (i my case rotation and zooming) and increase convolutional and maxpooling layers
mild dirge
I didn't say anything about image augmentation
Just strictly talking about your model architecture
Augmentation would not increase overfitting, in the contrary
 lavish swift
tidal bough
```py
genre_counts = (
df.select(pl.col("pub_year"), pl.col("genre"))
.e...
lavish swift
tidal bough
```py
genre_counts = (
df.select(pl.col("pub_year"), pl.col("genre"))
.e...
if you have any polars questions, I'd suggest joining the Polars discord. I'm a member over there (mostly learning) but lots of the devs and other smart polars people are over there. Ideally, they prefer questions are asked on SO and then linked so answers are findable, but quick questions are fine. Plus I learn a lot just by reading other questions and answers.
vapid yoke
mild dirge
Augmentation would not increase overfitting, in the contrary
then what does? I want to use least possible GPU and System RAM usage
and also increase accuracy
mild dirge
So listen to the suggestion I made, add more convolutional and pooling layers before flattening the feature map
vapid yoke
mild dirge
So listen to the suggestion I made, add more convolutional and pooling layers be...
The images i am gonna provide to my model for testing will not be rotated.
So do I really need rotation_range parameter
i used it thinking the model will remember the image from every angle
mild dirge
model = tf.keras.Sequential([
        tf.keras.layers.Conv2D(32, (3, 3), activation='relu', input_shape=(250, 400, 3)),
        tf.keras.layers.Conv2D(32, (3, 3), activation='relu', strides=(2, 2)),
        tf.keras.layers.MaxPooling2D((2, 2)),
        tf.keras.layers.Dropout(0.25),
        tf.keras.layers.Conv2D(64, (3, 3), activation='relu'),
        tf.keras.layers.Conv2D(64, (3, 3), activation='relu', strides=(2, 2)),
        tf.keras.layers.MaxPooling2D((2, 2)),
        tf.keras.layers.Dropout(0.25),
        tf.keras.layers.Conv2D(128, (3, 3), activation='relu'),
        tf.keras.layers.Conv2D(128, (3, 3), activation='relu', strides=(2, 2)),
        tf.keras.layers.MaxPooling2D((2, 2)),
        tf.keras.layers.Dropout(0.25),
        tf.keras.layers.Flatten(),
        tf.keras.layers.Dense(512, activation='relu'),
        tf.keras.layers.Dropout(0.5),
        tf.keras.layers.Dense(256, activation='relu'),
        tf.keras.layers.Dropout(0.5),
        tf.keras.layers.Dense(len(train_generator.class_indices), activation='softmax')
])
Try this model, I made the stride larger for some conv layers, which also decrease the size of the resulting feature maps from those layers.
See if this gives better result
vapid yoke
mild dirge
See if this gives better result
how many Epoch should i set. currently have 50 but thinking to change it to 20-25
mild dirge
Just make it show accuracy per epoch, you can tell when to stop from that
You should try multiple architectures
vapid yoke
i could if the program took 4-5min to complete
mild dirge
It will take less long now
mild dirge
That's not normal, you don't have that much data
But you did have many params
It should be about 8 times less now
Just see how long it takes
vapid yoke
ohk, but honestly not to mention I didn't thought someone would actually give a fk about my model
thnks ahead of time
vapid yoke
mild dirge
Just see how long it takes
Ty it's taking about 1 hr for first epoch and from my understanding it will take 20-30sec afterwards
Also I removed rotation and shear range as they do not apply in my case and increased width and height range to 0.9
Now my time and accuracy have improved significantly
although currently i am at
Epoch 1/50
38/315 [==>...........................] - ETA: 46:19 - loss: 6.9194 - accuracy: 0.0016
but it's way better than earlier which was 2*10^-4
mild dirge
Alright, well just wait it out and see if it's better
You may want to add more conv/maxpool layers still
Because a single layer with about 10 mil params still seems like overkill
 lavish kraken
old flax
hello guys, i'm currently working with a an .xlsx file. I need to convert it to ...
lavish kraken
old flax
hello guys, i'm currently working with a an .xlsx file. I need to convert it to ...
@ShaunSenpai#3568 you want to convert from image to Excel file?
lavish kraken
kindred raven
Hello! Anyone that can help with Machine Learning in Python? I am trying to do a...
I can help
old flax
lavish kraken
@ShaunSenpai#3568 you want to convert from image to Excel file?
no, i just needed to extract from the excel file. I was able to get it done so it really isn't needed again
lavish kraken
old flax
no, i just needed to extract from the excel file. I was able to get it done so i...
Okay good
vapid yoke
mild dirge
Alright, well just wait it out and see if it's better
no luck currently at 6th epoch
and accuracy is going 3*10-4
is there anything wrong with my directory hierarchy, sometime i feel like its fetching images with wrong names
vapid yoke
11th epoch
acc 2.98*10^-4
🗿
hasty mountain
Scatterplot?
I don't know how to connect the dots with curved lines, though
Perhaps matplotlib has a tutorial for this. It has a lot of tutorials in its docs
Maybe scikit-learn might also give you some help with some utility functions
 plush jungle
let's say I have a neural net like this
        self.layer1 = nn.Linear(4096, 7)
self.layer2 = nn.Linear(7, 1)```do I have to do anything special if I pass it a batch?
because instead of the input shape being 4096, it'll be 4096*batch_size, right?
serene scaffold
plush jungle
let's say I have a neural net like this
```py
self.layer1 = nn.Linear(40...
The batch is an extra dimension. Not a multiplier on a dimension.
plush jungle
so the way nn.Linear is written it accepts any Nx4096 matrix?
serene scaffold
I think it will accept (7, 4069) or (b, 7, 4069), where b is the number of instances in the batch
Try it and see.
plush jungle
I thought 7 was the output feature size
help me understand this, so layer1 has 7 neurons, which each have 4096 weights and one bias, right?
so 7 shouldn't have anything to do with the input vector that gets passed to those neurons?
serene scaffold
@plush jungle
In [14]: lin = nn.Linear(4069, 7)

In [16]: lin.weight.shape
Out[16]: torch.Size([7, 4069])

In [17]: lin.bias.shape
Out[17]: torch.Size([7])

In [18]: lin.bias
Out[18]:
Parameter containing:
tensor([0.0060, 0.0048, 0.0152, 0.0100, 0.0147, 0.0131, 0.0062],
       requires_grad=True)

In [20]: lin(torch.rand((4, 7, 4069))).shape
Out[20]: torch.Size([4, 7, 7])
ok so it seems like I understood correctly, that there are 7 neurons
and if I passed the layer a 4069 vector it would send that input to all neurons
but how do batches work then?
hasty mountain
serene scaffold
The batch is an extra dimension. Not a multiplier on a dimension.
Isn't the Linear layer in Pytorch like, (Batch, 4096)?
nn.Linear(4096, 7) ---> (Batch, 4096) @ (4096, 7), or something like that?
lament dome
if i had a model thats like chatgpt, how would one go about integrating that ai into a customer service like discord bot ??
 silent mesa
anyone knows of any good modules to cluster faces?
or similar tasks?
or good image processing ones except cv2 lmao?
silent mesa
lament dome
if i had a model thats like chatgpt, how would one go about integrating that ai ...
make an API that feeds queries to the model and retrieves them
 cold minnow
Heya, can you anyone explain to me what's wrong here?


Apparently it's because the dataset doesn't have a consistent number of images across all folders
mild dirge
You give it two tensors?
Your input should be shape (batch_size, 192, 192, 3) @cold minnow
But you then also give some other tensor
untold cliff
When should we split the data? Is it before applying any transformations like minmax scaling ?
mild dirge
Yes
minmax scaling on the test set should also be done on basis of min and max of the training set
untold cliff
mild dirge
Yes
So i should split my data before applying any transofrmations but after cleaning ?
mild dirge
Yes
Well sortof
The main risk of doing stuff to both training and testing data is that you might use information about the test data for designing/training the model
So if you have missing values, you should, f.e. fill them with the average of the column of only the training data, and not all data
So you need to be careful with that
@untold cliff
untold cliff
Got it. Thanks!
 junior schooner
I'm writing a python program that uses sqlite3 to allow users to create, update and view databases. Users can add data from CSV or from the web. I want to add a module for data visualisation (maybe using plotly) but am unsure how or what i can implement without knowing what the data is. For example, if the data is categorical I could use a bar chart or heat map, if it's numerical I could use a line chart or scatter plot. Can anyone give me some suggestions of what I could implement without this information?
P.S I am very new to working with data, this is my first attempt.
 dry cosmos
Hi everyone, i am sorta new to this whole data science thing but am trying to apply a SHAP explainer to an LSTM predictor with the intent of feature extraction. I have being struggling for a while now to put it to work, and at this point i am completely out of ideas.
i am using an adaptation of the code present in this tutorial (https://youtu.be/ODEGJ_kh2aA) applied to the Rossmann sales dataset on Kaggle and trying to use the shap library (https://shap-lrjball.readthedocs.io/en/latest/index.html) with a DeepExplainer, but i've being failing miserably
if anyone could lend me a hand, i would be super thankful
 half pilot
Any good resources to learn data strucutres and algorithms ?
I found this from reddit: https://www.amazon.com/Structures-Algorithms-Python-Michael-Goodrich/dp/1118290275

Data Structures and Algorithms in Python
Anyhow, i will highly appreciate ya help for telling me a good resource
basically i wanted to learn ML then i realized, i still have so much to learn until i start ML
... so... if someone can also tell a roadmap 😐
 foggy yarrow
Anyone have any experience with PaddleOCR and training data they provide? Are packages that are installed through pycharm pretrained, do I need to train them to get better result? And if I do how do I do it, I'm confused by the docs
 copper umbra
PSA to job seekers, DONT USE A CHAT BOT to write to cover letter and answers to pre-interview quetions. WE CAN TELL
Context: my employer posted a remote data science position and over 15 answers to a complex question are virtually IDENTICAL on what should be an experience/opinion piece.
UGH, that people think this is a good idea is scary to me
 feral sable
Can someone help me optimize this code snippet
scores_train_numpy= np.zeros(100,3,9)
scores_test_numpy= np.zeros(100,3,9)
score_matrix1= np.zeros(100,100)
for s1 in scores_train_numpy:
for j,s2 in enumerate(scores_test_numpy):
grad_sum=0
for c in range(3):
grad_sum += LR * np.dot(s1[c], s2[c])
score_matrix1[i][j]=grad_sum
i+=1
print(time.time()-t)
mild dirge
copper umbra
PSA to job seekers, DONT USE A CHAT BOT to write to cover letter and answers to ...
I agree that you most of the time can easily tell, but giving the same question often gives very ranging answers when asking chatgpt
feral sable
I am trying to get rid of the inner loop using a numpy magic, but i am hitting lots of walls
copper umbra
mild dirge
I agree that you most of the time can easily tell, but giving the same question ...
ChatGPt has obviously markers. and the points end up being the same. in the end it isnt the way a human would answer these questions
mild dirge
Yeah, would not recommend haha
But its a good source of inspiration I think, but nothing more in it's current state
copper umbra
Inspiration i could handle but right it from scratch on your own
mild dirge
feral sable
scores_train_numpy= np.zeros(100,3,9)
scores_test_numpy= np.zeros(100,3,9)
score...
There's no i in here at all
The code just gives error
mild dirge
feral sable
For i,s1 in enumerate(..)
I'll take a look at it
feral sable
This is the desired behaviour
 kindred raven
lavish kraken
I can help
kindred raven
lavish kraken
I can help
So I have this dataset which we got already splitted up into dev, test and train. After sentiment analysis, we made countervectors for the frequency of words in the texts-column. So the countervectors will have different number of features due to different words. And I get this error when trying to predict...
 mild dirge
Does this code give the desired behaviour?
import numpy as np


def func1(scores_train_numpy, scores_test_numpy, LR):
    score_matrix1 = np.zeros((100,100))
    for i, s1 in enumerate(scores_train_numpy):
        for j,s2 in enumerate(scores_test_numpy):
            grad_sum=0
            for c in range(3):
                grad_sum += LR * np.dot(s1[c], s2[c])
            score_matrix1[i][j] = grad_sum
        i+=1

    return score_matrix1


LR = 1
scores_train_numpy = np.random.randint(0, 100, (100, 3, 9))
scores_test_numpy = np.random.randint(0, 100, (100, 3, 9))

print(func1(scores_train_numpy, scores_test_numpy, 1))
I'll try and see if I can vectorize it if so
@feral sable
feral sable
Yes
mild dirge
!e
import numpy as np


def func1(scores_train_numpy, scores_test_numpy, LR):
    score_matrix1 = np.zeros((100,100))
    for i, s1 in enumerate(scores_train_numpy):
        for j,s2 in enumerate(scores_test_numpy):
            grad_sum=0
            for c in range(3):
                grad_sum += LR * np.dot(s1[c], s2[c])
            score_matrix1[i][j] = grad_sum
        i+=1

    return score_matrix1


def func2(scores_train_numpy, scores_test_numpy, LR):
    arr_train = scores_train_numpy.reshape(100, -1)
    arr_test = scores_test_numpy.reshape(100, -1)
    res = LR * np.inner(arr_train, arr_test)

    return res


LR = 1
scores_train_numpy = np.random.randint(0, 100, (100, 3, 9))
scores_test_numpy = np.random.randint(0, 100, (100, 3, 9))

res1 = func1(scores_train_numpy, scores_test_numpy, 1)
res2 = func2(scores_train_numpy, scores_test_numpy, 1)
print(np.all(res1 == res2))
@mild dirge :white_check_mark: Your 3.11 eval job has completed with return code 0.
True
Damn! Thank you so much, will give it a try rn
That’s a life saver
Thanks! Ran some regressions and it works! Will try it on the real case and report the speed up! Thanks!
Can you please tell me how did you think about it
I tried using inner too, but couldn’t think at all of the reshape!
mild dirge
Well yeah, summing the dot products of the 3 rows is basically the same as taking a dot product of the flattened matrix
So that is why I reshape it to begin with
And np.inner just takes the dot product of every pair of cols* and returns the 100x100 matrix
But to be completely honest, I just tried np.inner after flattening and it magically worked, so I didn't put that much thought into why it worked
 wooden sail
it does the sum of the products of the last axis
so it's multiplying the columns and adding that up
that's the same as Trace(M^T M), but due to the properties of the trace, the arguments commute. so that's the same as Trace(M M^T)
half pilot
copper umbra
PSA to job seekers, DONT USE A CHAT BOT to write to cover letter and answers to ...
maybe a better thing is type something by urself first then ask chatgpt if there is any problem in ur text
half pilot
lol my problem is to "miss" some words typing
while typing*
idk i just read them in my brain but forget to type
 inland sky
hihi!
is there someone willing to help me set up and train a model? I am kinda stuck and I don't really know how to fix some stuffs
(I bet I'm totally wrong about what I wrote)
 crisp prawn
!e
print("Hello")
@crisp prawn :warning: Your 3.10 eval job has completed with return code 0.
[No output]
!e
print("Hello")
@crisp prawn :white_check_mark: Your 3.11 eval job has completed with return code 0.
Hello
 flat cobalt
Hey has anyone worked with Temporal Relation Extraction?
junior schooner
Can anyone help me with data visualisation? I have a help topic here:
https://discord.com/channels/267624335836053506/1083447147330031637
 charred light
copper umbra
PSA to job seekers, DONT USE A CHAT BOT to write to cover letter and answers to ...
charred light
copper umbra
PSA to job seekers, DONT USE A CHAT BOT to write to cover letter and answers to ...
More like stop requiring cover letters and pre-interview questions for your position.
Waste of everyone's time.
copper umbra
At our company we read them so.... Especially to determine who to interview when you have 30 applications and you can only interview five people that information matters a lot
versed flame
I need to get some help to get pointed in the right direction.
Im trying to do an application that will look for a certain set of images, inside of a game.
For example;
https://i.imgur.com/QqHOVyg.png
Id like to find something like this on this:
https://i.imgur.com/SsX2CIY.jpeg
What routes are valid ones for this?
 amber goblet
Hello! I was hoping to get your guy's opinion on something. Is it a coding convention to make all of my column in pandas lowercase? https://i.imgur.com/YUUf33v.png
https://i.imgur.com/l9V9B0S.png
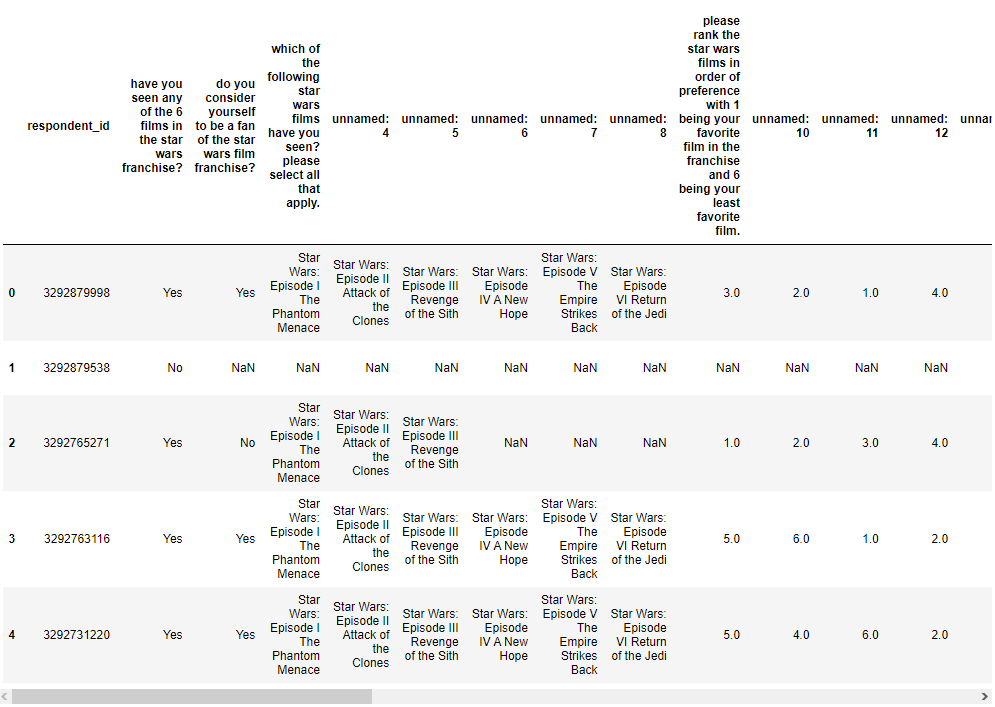


 nocturne eagle
amber goblet
Hello! I was hoping to get your guy's opinion on something. Is it a coding conve...
nocturne eagle
amber goblet
Hello! I was hoping to get your guy's opinion on something. Is it a coding conve...
no, but it is a convention to not have unnamed columns 🙂
amber goblet
nocturne eagle
no, but it is a convention to not have unnamed columns 🙂
Thank you very much.
serene scaffold
amber goblet
Hello! I was hoping to get your guy's opinion on something. Is it a coding conve...
I try to make all the column name brief, in lower case, with underscores
nocturne eagle
I try to not user lowercase so they don't clash with method names as I like to use object notation when referring to columns. but that's just me.
amber goblet
Mhm, I see. Thank you for your input. I will restructure my projects.
 lapis sequoia
anyone free to help with a pandas problem?
hasty mountain
Hey guys, does the ResNet included in Pytorch's builtin models includes dropout layers?
mild dirge
I don't think that original model does have dropout layers, could be wrong
hasty mountain
I see. Then I may have been testing a model wrongly 
The paper uses a ResNet included in Pytorch, but I'm using dropout layers with 50% probability
lapis sequoia
I have a pandas dataframe and want to group the rows up if there are any matches in the 2 columns. So here I'd want group 1 to be AZ, AY, BZ, B Null; group 2 to be CX, C Null, group 3 to be DW, group 4 E null, group 5 Null V. So if anything matches, they'd be in the same group
 serene scaffold
lapis sequoia
I have a pandas dataframe and want to group the rows up if there are any matches...
serene scaffold
lapis sequoia
I have a pandas dataframe and want to group the rows up if there are any matches...
so you want each group to be adjacent rows until you get to a null?
lapis sequoia
serene scaffold
so you want each group to be adjacent rows until you get to a null?
this is just a toy example really, so the row order isn't representative, so I dont think so
serene scaffold
also is null an actual null value, or is it the string 'null'?
lapis sequoia
it can be either, it's easily changed 🙂
serene scaffold
lapis sequoia
it can be either, it's easily changed 🙂
you should always use None, float('nan'), etc. to represent missing values--never strings of any kind.
lapis sequoia
ya I know, this is just an example to try to explain what I'm trying to achieve
serene scaffold
lapis sequoia
this is just a toy example really, so the row order isn't representative, so I d...
based on your example, I can't infer what the rule is, without using row order.
lapis sequoia
i'll try to explain better
serene scaffold
but I'm getting the impression that there isn't an idiomatic pandas solution to your problem
lapis sequoia
yeah me too lol
serene scaffold
so you might have to write a loop and encode the grouping logic in pure python.
lapis sequoia
I was hoping to find some sort of merge/group by work around but it's not looking easy
serene scaffold
in general, pandas doesn't support iterative operations that requires awareness of a variable number of previous rows.
you can do things that involve sliding windows, but the size of the window is fixed as it slides down the dataframe.
lapis sequoia
I basically want to label the rows into categories/groups. So row 1 contains A and Y and would be group 1, then row 2 contains A also, so will also be in group 1. Row 3 contains B and Z, Z also appears in the group 1, so would also go into group 1, row 4 contains C and X which are both new, so is group 2. Does that make sense?
I tried to explain better there
serene scaffold
I think I sort of understand it, but I'm quite sure that there's no idiomatic pandas solution
you'll have to write a loop that assigns group IDs one-by-one
lapis sequoia
yeah that would do it
it's pretty large data is all
I could write a vectorised solution actually
serene scaffold
you can probably write an O(n) solution, and unless you plan to use it many many times, having it vectorized won't be worth the extra development time or risk of error.
and keep in mind that .apply is only vectorized in the syntactic sense. it's only marginally better than a for loop.
lapis sequoia
apply has performed way better than loops in test I've done?
agile cobalt
lapis sequoia
I basically want to label the rows into categories/groups. So row 1 contains A a...
that sounds like it would give different results based on the order of the rows? ```
A B
C D -- "new group"
A C -- which?
A B
A C
C D
yeah merge them as and when theres a connecting piece
agile cobalt
that's starting to sound like something you should consider using graph tools like networkx over pandas
not sure though
boreal gale
definitely one for networkx 👍
you are likely looking for connected components
though the null might need some special attention. (probably just by adding nodes for rows with nulls first, then ignoring the rows when adding edges)
 drifting monolith
I'm trying to select a few columns on each row of a Pandas dataframe according the value of another column, but I also need to clamp the result:
my_df = my_df.loc[ : , max(0, my_df['start_index']) : 100]
if my start index is for example < 0
agile cobalt
drifting monolith
I'm trying to select a few columns on each row of a Pandas dataframe according t...
a few columns on each row of a Pandas dataframe according the value of another column
what?.... that does not sounds like something that will work at all
you can use numpy.maximum to clamp a pandas series, but what you are trying to do in first place sounds pretty weird even without the clamping part
drifting monolith
I have a df with 1 column index that gives me an index, followed by columns labeled 1-16000.
I want for each row to take the value of the column index and take the columns from index - 100 to index + 100
agile cobalt
ok so yeah that is not gonna work very well
that is to say, you'll most likely have to iterate - .loc is not meant to support operations of "select a few different columns per row"
drifting monolith
As in the rows have to be the same size or?
agile cobalt
.loc retrieves rectangle-like parts of the dataframe
eh, not sure how to explain it in a way that makes sense - just try to do it and you'll see what I mean
drifting monolith
Ah, right, I see what you mean
I've done it with loops already but takes a couple of seconds, which is too much as it's only a subset of what I want to use
agile cobalt
transform it into a format more fit for pandas and/or databases then
if the data is in a weird format, tools will not be able to efficiently query it
once it's well formatted, you can worry about doing things efficiently
(or learn C, C++ or Rust instead and build a custom extension that works there, up to you)
there's also a chance that another library could work efficiently with the format you already have, though I cannot say for sure
drifting monolith
Hmm, it's definitely a format issue but I'm not entirely sure how I'd go about reformatting it.
The 1-16k columns are timeseries data, and I want to extract 200 samples around a particular point, given by another column.