#data-science-and-ml
1 messages · Page 34 of 1
 iron basalt
 plush jungle
def sigmoid(z):
    return 1/(1+np.exp(-z))

def forward(self,x):
return sigmoid(np.sum(self.weights * x) + self.biases)```Great, now do the forward without numpy's functions / operators. Just plain old loops. You can still use numpy to hold the values and indexing, since Python lists are not as nice for that.
plush jungle
iron basalt
Great, now do the forward without numpy's functions / operators. Just plain old ...
now it looks like this
    def forward(self,x):
        output_sum = 0

        for i in range(len(x)):
            x[0][i] += self.weights[0][i]*x[0][i]

return sigmoid(output_sum + self.biases[0])```oh wait
I added the bias every time
there we go
iron basalt
plush jungle
now it looks like this
```py
def forward(self,x):
output_sum = 0
...
Is x is a vector? Is self.weights a vector?
plush jungle
iron basalt
Is x is a vector? Is self.weights a vector?
sorry about all the [0]'s I cannibalized my old code, so everything is still packaged in another layer of numpy arrays
but yes
x and weights are vectors the length of the image input
bias is a scalar
iron basalt
Ok, so now try writing this forward pass mathematically, in a way that mimics this code. Ignoring all the [0]'s because there should only be 1 x and 1 weights and 1 biases (bias*) for now.
Maybe with some latex if you got it.
plush jungle
iron basalt
Ok, so now try writing this forward pass mathematically, in a way that mimics th...
the only thing different about the math version would be that the for loop and the sum would be written with a big sigma
and sigmoid() would be written with a little sigma
iron basalt
.latex $$o = a(\sum_i{x_iw_i}+b)$$
 strange elbowBOT
 iron basalt
(b is outside the sum)
plush jungle
plush jungle
now it looks like this
```py
def forward(self,x):
output_sum = 0
...
yeah I fixed it
iron basalt
So the for loop comes from having to do this sum, and it is visually indicted by there being an index subscript in the math (hinted that one is needed).
Next step is seeing that the sum of the products is just the definition of the vector dot product.
In mathematics, the dot product or scalar product is an algebraic operation that takes two equal-length sequences of numbers (usually coordinate vectors), and returns a single number. In Euclidean geometry, the dot product of the Cartesian coordinates of two vectors is widely used. It is often called the inner product (or rarely projection prod...
So we can rewrite this equation.
.latex $$o = a(\textbf{x}\cdot\textbf{w}+b)$$
strange elbowBOT
 iron basalt
Notice how in this linear algebra notation the indices vanish, they get absorbed by use writing it in terms of vectors.
plush jungle
yeah that makes sense
iron basalt
But really all it's saying is what we had before.
So there is actually still a loop happening, we just wrote it more concisely.
plush jungle
iron basalt
So there is actually still a loop happening, we just wrote it more concisely.
ok but I meant in the back propagation
iron basalt
Yeah so now, let's first rewrite the forward with that linear algebra way.
And numpy already has the dot product implemented for us.
plush jungle
consider the hidden layer, which takes 10,000 pixels and passes that to 3 neurons, each with 10,000 weights
this layer outputs a vector of length 3 to the final neuron
iron basalt
We are getting there, first we need to deal with the weight update for this single neuron.
So since we are only dealing with a single neuron and a single sample for now, we can drop the sum, since the sum of 1 thing is just that 1 thing.
plush jungle
yeah
iron basalt
.latex $$\frac{\partial{E}}{\partial{w_i}} = (y-o)o(1-o)x_i$$
strange elbowBOT
 iron basalt
Also ignoring the minus for now.
Now since there is an index it should hint at a loop. Can you write this with a plain old loop?
 valid wind
I'm trying to write the reinforce function for a policy gradient algorithm
I'm struggling on how to initialize policy parameterization
how would I do this
 verbal venture
does anyone know what type of algo would be best for classifying audio data? and why?
 rugged lance
Hey everyone. Anyone have any good recommendations for intro to AI or Machine learning courses? I've got a solid foundation in python but know nothing abt AI or machine learning
 hasty mountain
I should say that...this looks promising...at least for now.
I'm using a Neural Network with 5 conv layers followed by PReLUS and all but the last one is followed by batchnorm, and I'm adding noises through a for loop. Each iteration = 1 pixel noise in a random RGB channel.
And it seems to be going fine until now(100 iterations). It isn't perfect, some images are better recomposed than others, but it's better than I thought.
I'll see how this goes when I add more and more noise.
Of course optimization is the last of my concerns for now. I just want to see where this goes. If everything goes right, the model will start simply as a generic decomposed-recomposer image model, and, as I the images gets more noisy, the model shall learn how to recreate them entirely
 tribal bloom
hasty mountain
I should say that...this looks promising...at least for now.
I'm using a Neural ...
tribal bloom
hasty mountain
I should say that...this looks promising...at least for now.
I'm using a Neural ...
It doesn't sound like you're using the optimal architecture for image reconstruction. To achieve the best results, you should use a fully convolutional neural network (FCN) with upsampling and skip connections between layers, which would help in producing better results. Also, why use a for loop to add noise? It's a much more efficient process to apply noise through a function call directly to the image data.
hasty mountain
But I guess this is going to fail somewhere...otherwise, someone else would have tought about this before...well...making a model based on crazy thermodynamics equations
hasty mountain
tribal bloom
It doesn't sound like you're using the optimal architecture for image reconstruc...
The idea isn't make some kind of UNet model, the idea is just to play with the idea of diffusion models
tribal bloom
hasty mountain
The idea isn't make some kind of UNet model, the idea is just to play with the i...
Ah, I see. Well, in that case, using a noise loop may be appropriate. However, you may still want to consider making changes to the architecture, such as increasing the number of convolutional layers and adding skip connections between them to further improve your results.
hasty mountain
Diffusion Models basically receive a noisy image and try to recompose them.
The difference is... Diffusion models has quite a mathematical logic behind it, while I'm just doing this randomly and progressively with a simple network
hasty mountain
tribal bloom
Ah, I see. Well, in that case, using a noise loop may be appropriate. However, y...
Yeah, I thought about that. It's just that, like I said, I wasn't expecting much, and still I got some result.
iron basalt
hasty mountain
Diffusion Models basically receive a noisy image and try to recompose them.
The ...
Do you know VAEs?
hasty mountain
I'm trying an alternative version in Google Colab that uses 13 conv layers
hasty mountain
iron basalt
Do you know VAEs?
Yep, but their idea is slightly different, isn't it?
hasty mountain
They get a complete image, encode it into a vector, and from that vector the decoder must create an entire image that will be sent to a discriminator
iron basalt
They are different, but have similarities that might make it make more sense.
tribal bloom
hasty mountain
Yeah, I thought about that. It's just that, like I said, I wasn't expecting much...
Still, it would be smarter to just use an FCN or U-Net architecture. The number of layers isn't necessarily what gives you the best results. It's more the combination of convolution layers, pooling layers, and skip connections that make the difference in image reconstruction. With FCN or U-Net, you will get much better results.
hasty mountain
tribal bloom
Still, it would be smarter to just use an FCN or U-Net architecture. The number ...
Ok, I'll give it a try.
Indeed I thought in the beginning about using something like that, but...I didn't see exactly why I would want my model to decompose my image into features with shapes like 4x4
*And I also thought that I had got vanishing gradients...which was just me in a hurry to see if that would give results or failure *
iron basalt
hasty mountain
Diffusion Models basically receive a noisy image and try to recompose them.
The ...
*Also while diffusion papers have a bunch of math, at the way bottom is just intuition and empirical results.
(That doing it in steps rather than all at once is better)
hasty mountain
iron basalt
*Also while diffusion papers have a bunch of math, at the way bottom is just int...
Yeah, but the code itself has quite some math
The EMA thing, the betas...the thing about predicting the gradients rather than the actual pixel value...
iron basalt
hasty mountain
Yeah, but the code itself has quite some math
Yes like VAEs they have this nice probabilistic view.
Which means there is much to be explored with them and they can be used for many things (in a way that is grounded, not just random intuitions, although the way bottom is just intuition).
hasty mountain
Eeeh...
I just like them for customizing outputs in a GAN 
iron basalt
hasty mountain
Eeeh...
I just like them for customizing outputs in a GAN <:py_guido:58580823814...
They can be used to upgrade models such as GANs, which is something pretty cool about them.
hasty mountain
I don't know if they can also be used for conditioning outputs in a Diffusion Model...
iron basalt
Can stick them in various places.
hasty mountain
Curious...then I think I'll give them a try for my Reinforcement Learning project
My pc is gonna cry
 hasty mountain
I was already trying to use a vector encoder which uses images to assign a vector to a word.
hasty mountain
iron basalt
https://arxiv.org/pdf/2209.00796.pdf
Thanks!
hasty mountain
iron basalt
Uh... GAN + Diffusion model? 
iron basalt
One of the issues of GAN is the instability in the training process, which is mainly caused by the non-overlapping
between the distribution of input data and that of the generated data. One solution is to inject noise into the discriminator
input for widening the support of both the generator and discriminator distributions. Taking advantage of the flexible
diffusion model, Wang et al. (2022) [241] inject noise to the discriminator with an adaptive noise schedule determined
by a diffusion model. On the other hand, GAN can facilitate sampling speed of diffusion models. Xiao et al. (2021) [253]
show that slow sampling is caused by the Gaussian assumption in the denoising step, which is justified only for small
step sizes. As such, each denoising step is modeled by a conditional GAN, allowing larger step size.
Like VAEs there is so much to explore with them.
(Including the connection between the two (which as a mathematician really excites me))
hasty mountain
So there's still salvation for my GANs from the ghost of obsolescence for now? 
iron basalt
hasty mountain
So there's still salvation for my GANs from the ghost of obsolescence for now? <...
ML tends to have many things sit on a shelf until someone finds a way to make it work, I would not really think about it in terms of obsolescence.
Diffusion models was one such thing.
hasty mountain
iron basalt
Diffusion models was one such thing.
Now this is news to me
Interesting
iron basalt
A lot of ML stuff is old, and in many cases can exist prior to "ML" (e.g. come from physics models).
I wrote this before, but a lot of ML is really about making things practical, breaking through things like difficulty of training.
A lot of things "just work" in theory.
(e.g. LSTM)
(From this POV there may be many valid solutions to AGI, but it's about making it feasible in practice (How much compute? How am I going to get all that data and make sure it's of good quality? etc))
hasty mountain
Wonderful, because I love to test things in Deep Learning
Of course I use consolidated models, too... but they're such a good inspiration for creating new things
iron basalt
plush jungle
yeah
When you get the looping version done for the backwards part it will start to make sense. You can then follow the same as with the forward and write it mathematically, then with linear algebra.
hasty mountain
Damn bro. I love you. This paper is wonderful.
Isn't as dense as a book but it seems to give quite interesting introductions, even with some images, which is excellent.
 oak tangle
What are some python integration to stream JSON data? JSON inherently dumps all of its data to memory, and parse it at once, which clearly is a problem for large JSON data. What can python do to mitigate the amount of data a single memory can process at once into a multiple processes?
 serene scaffold
oak tangle
What are some python integration to stream JSON data? JSON inherently dumps all ...
serene scaffold
oak tangle
What are some python integration to stream JSON data? JSON inherently dumps all ...
you can read JSONL data into memory one line at a time
 brave sand
 worldly dawn
It's missing some details, but I am strongly suspicious of any fitness function always returning 0
I would write some tests for it or manually validate it on well known cases
 bold timber
Hello guys, can you explain to me the difference between pooling processes for images and pooling processes for text data problems based on the output_shape?
 tribal bloom
Pooling processes for images involve reducing the spatial size of an image while preserving important features. This is done by taking a kernel (usually a small window) and moving it over the image. The output shape is a reduced version of the original image with a smaller resolution but the same features.
Pooling processes for text data problems involve reducing the complexity of the data by summarizing or extracting important features or patterns from the data. This is usually done by taking a window of words or characters and extracting the most important ones. The output shape is a reduced version of the original text with only the important information extracted.
bold timber
tribal bloom
Pooling processes for images involve reducing the spatial size of an image while...
Whether original text means a whole text within a dataset?
In this case, I convert the text into a number with max_length = 15. But what does the means of embedding (Embedding) (None, 15, 128) can being global_average_pooling1d (GlobalAveragePooling1D (None, 128))?
please enlighten me🙏
@tribal bloom
tribal bloom
The embedding (Embedding) (None, 15, 128) is a layer that takes the input text of size 15 and converts it into a 128-dimensional vector representation. The global_average_pooling1d (GlobalAveragePooling1D (None, 128)) layer takes this 128-dimensional vector representation and performs global average pooling on it, resulting in a single 128-dimensional vector. This vector is the output of the model and can be used for further analysis or classification.
@bold timber
bold timber
tribal bloom
The embedding `(Embedding) (None, 15, 128)` is a layer that takes the input text...
so does it mean when we use GlobalAveragePooling1D a whole token in the dataset will be averaging and then represented by 128 vectors?
 fierce condor
does anyone know a similar implementation to this paper

SpringerLink
Machine Learning - We propose a supervised anomaly detection method for data with inexact anomaly labels, where each label, which is assigned to a set of instances, indicates that at least one...
i want to detect multiple clusters of anomalies in my dataset
verbal venture
hey, does anyone know the best ML algo to learn for classifying images from an iphone cameras vs other images? I literally just started learning ML today lmao
 unreal vine
hi I am data scientist by profession. I also know various languages like java, c, c++, kotlin and python. From last few days, I am creating apps with kivy as my hobby. As data visualization is a very hot topic in the market, right now but apps like power bi and tableau are used mostly at professional level. School and college students are stuck at excel. I got an idea of developing a tool in kivy and kivymd for data visualization. I am good in playing with data but for students its not really important. What they need is a user-friendly UI which can show different graphs on single tap. With library like matplotlib its very easy to plot a graph but I am failing in creating a UI which is attractive. I am looking for someone to collaborate with me in creating GUI for data visualization in kivy & kivymd. Since, the demand is very high we can make code available on github and can earn money through ads i.e will also launch apps for playstore and appstore
Even if you don't have basic knowledge of kivy but you have used libraries like numpy, pandas, seaborn and matplotlib. You can join me
 ripe onyx
verbal venture
hey, does anyone know the best ML algo to learn for classifying images from an i...
ripe onyx
verbal venture
hey, does anyone know the best ML algo to learn for classifying images from an i...
Convolutional neural network
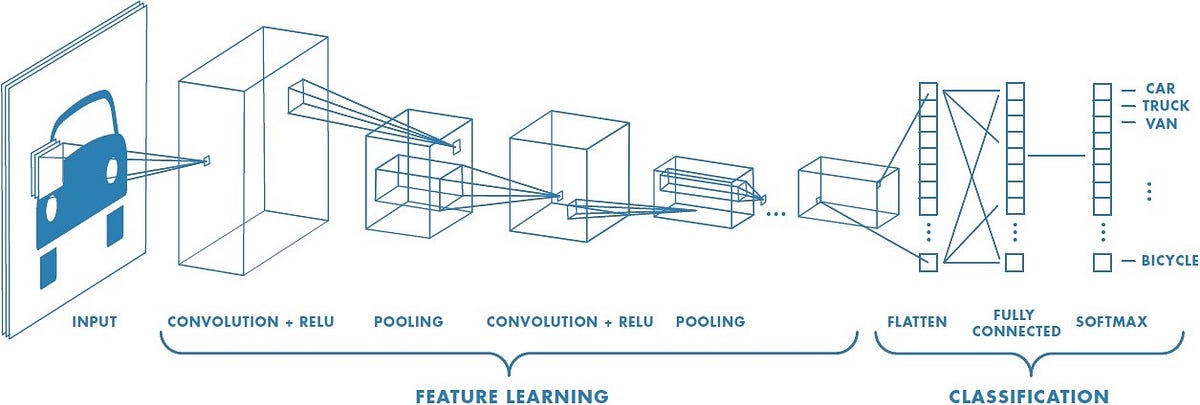
Medium
Artificial Intelligence has been witnessing a monumental growth in bridging the gap between the capabilities of humans and machines…
 fossil ivy
Hey there. I have made graphs using data generated from my python simulation model, but the graphs were made in excel
My supervisors are ||assholes||. They literally wants to reduce my grade because he doesn't like excel graphs and expects me to do them in python
How hard would it be to make this graph? I haven't coded much graphs in Python yet

 arctic wedgeBOT

Statistical data visualization
fossil ivy
its a table
tribal bloom
fossil ivy
How hard would it be to make this graph? I haven't coded much graphs in Python y...
very easy
you have the dataset
fossil ivy

no its after some computations
Raw data is 365 entries per experiment (column labels in data I sent before)
 tribal bloom
is that a csv?
fossil ivy
excel file
wait, let me double check, I might save it as a csv though
I do pd.DataFrame.to_excel()
I do understand, but then every change I still want to make to the graph would require me to re-run my model
and that takes like 20 minutes
so you reckon I should just re-read that excel back into a df and the graphs would be easy to do then
tribal bloom
just use matplotlib
worldly dawn
fossil ivy
I do understand, but then every change I still want to make to the graph would r...
your graph could be computed from the results you got from the model. These are two separate steps
 tacit acorn
Hi all. Quick question for those who have been data scientist for awhile and are using Python.
What exactly do Data Scientist used Python for?
 weary sinew
tkinter.OptionMenu(master, variable, value, *values, **kwargs)
tacit acorn
Uhh, okay. Thanks 👍
 hollow citrus
Hey! Can anyone suggest a book for Neural Networks that explains various graphs, algorithms, optimizers, loss functions, gradient descent, etc?
Preferably based on Python or R
serene scaffold
hollow citrus
Hey! Can anyone suggest a book for Neural Networks that explains various graphs,...
there's "deep learning with pytorch"
if you're a student or professional, you might be able to read it for free through your organization
hollow citrus
serene scaffold
there's "deep learning with pytorch"

Manning Publications
Create neural networks and deep learning systems with PyTorch. Discover best practices for the entire DL pipeline, including the PyTorch Tensor API and loading data in Python.
serene scaffold
hollow citrus
This one? https://www.manning.com/books/deep-learning-with-pytorch
Ya
hollow citrus
Okay, thank you!
 mild dirge
hollow citrus
This one? https://www.manning.com/books/deep-learning-with-pytorch
mild dirge
hollow citrus
This one? https://www.manning.com/books/deep-learning-with-pytorch
That one is pretty good and also introduces pretty basic concepts, I really liked that one
hollow citrus
Okay I'll try it out then! I started with the O'Reilly books because I saw them being recommended a lot in a few subreddits. Wanted to find something more in-depth.
mild dirge
The book doesn't go too hard on the mathematics though iirc, so you might want some linear algebra book if you want to understand it low-level too
serene scaffold
mild dirge
The book doesn't go too hard on the mathematics though iirc, so you might want s...
I agree. the "mechanics of learning" chapter goes over the theoretical math in medium depth, but I think it's good enough for establishing a foundation for learning the rest.
but then, books that go in-depth about the math will use math notation, not Python
serene scaffold
serene scaffold
but then, books that go in-depth about the math will use math notation, not Pyth...
which is something you'll want to take note of, @hollow citrus
hollow citrus
Oh, I would love some suggestions for those as well, I just thought there would be explanation for the functions/algorithms used in Python
 maiden merlin

any ideas for how I can get view all 50 points in this plot?
I adjusted the size of the graph using
plt.rcParams["figure.figsize"]=15,15
verbal venture
what's the difference between implementing ML algos vs having a deep understanding of the math behind it? cuz I can go implement an ML algo right now, but I'm also seeing threads where you need a masters/phd to truly understand ML.. what's going on w/ that
 agile cobalt
using an existing model or architecture is relatively simple
creating a new architecture should be a real challenge
verbal venture
I believe the former
for example classifying dental X rays, I wanted to use image classification. What are the odds I create a very accurate image classification program with just knowing how to implement the libraries?
plush jungle
iron basalt
When you get the looping version done for the backwards part it will start to ma...
ok so I took your advice and got it working entirely with loops, updating every weight individually. I'm still confused about how to update the bias though. my professor said something like you can just treat it like a weight and use the same sum?
 tacit galleon
Hi everyone!
Someone can help my with my post?
https://discord.com/channels/267624335836053506/1047942394613600386
I want to divide some data in smalls groups but I don't know how can I do this
I have this differents scenarios


 empty urchin
Anyone have advice on where to start w doing beginner data science project?
iron basalt
plush jungle
ok so I took your advice and got it working entirely with loops, updating every ...
When you take dE/db you get a value just like with other weights and update it in the same way. You can think of the bias as another input always set to 1 (so the * x in the dE/dw_i part becomes * 1).
plush jungle
iron basalt
When you take dE/db you get a value just like with other weights and update it i...
so to calculate the gradient for a bias, the only thing you have to change is remove the *x at the end?
iron basalt
plush jungle
so to calculate the gradient for a bias, the only thing you have to change is re...
Try taking dE/db and you will see what happens.
 slender sand
empty urchin
Anyone have advice on where to start w doing beginner data science project?
slender sand
empty urchin
Anyone have advice on where to start w doing beginner data science project?
Try Kaggle
How can a newbie retrieve, as a prediction of a binary (sale/no sale) variable, a representation of 0-10 based on the likeliness of the new record being a sale? For example, given this record of customer data, I identify the likelihood of a sale as an "8.5". I can do basic pred, just don't how how to get it as a score.
ripe onyx
Create a pdf and just multiply scale it by 10
ripe onyx
plush jungle
so to calculate the gradient for a bias, the only thing you have to change is re...
Try writing out ur neural net as one equation. Then take various derivatives with respect to various variables. You'll see what happens. If the structure of the neural network is of traditional type where x is input, o is output, w is weight, and b is bias; and O = activation_function(w*x + b). U can build smaller nets of toy examples to see what happens inside during backdrop.
slender sand
ripe onyx
Create a pdf and just multiply scale it by 10
Can you elaborate on pdf? I'm over here wondering if I have enough ink in the printer for that 😄
ripe onyx
Probability Density Function
U mentioned u can get prediction. So u can do a softmax or sigmoid type then just scale it up
slender sand
ok, I've mostly been using linear, rf and arima/sarima
arctic wedgeBOT
Hey @wintry gyro!
It looks like you tried to attach file type(s) that we do not allow (.pdf). We currently allow the following file types: .gif, .jpg, .jpeg, .mov, .mp4, .mpg, .png, .mp3, .wav, .ogg, .webm, .webp, .flac, .m4a, .csv, .json.
Feel free to ask in #community-meta if you think this is a mistake.
 wintry gyro
Does anyone knows principal regression analysis ? Can anyone help me with this?

 ripe onyx
slender sand
ok, I've mostly been using linear, rf and arima/sarima
ripe onyx
slender sand
ok, I've mostly been using linear, rf and arima/sarima
U can think in that way. "My toolbox is : linear, rf, and arima/sarima". What tool do I use? I need probability type outout. Maybe random forest. I can separate the features data and get a count of what separates into what leafs(end node). Then figure out how many things went into each leaf compared to sum of all sale possibilities. That's a probability. Do that for all until u get a good sense of probability for the problem. Then u can just take ur probability numbers here and scale them up by 10.
 fallen crown
Hi, i don't know how to surface plot of my cost function with a eshgrid
meshgrid
Does somebody already did it once ?
 young granite
create a repository and add it in ur CV thats the best thing to do i guess
slender sand
ripe onyx
U can think in that way. "My toolbox is : linear, rf, and arima/sarima". What to...
Can this not be accomplished with ```py
rf.predict_proba(X_test)
 magic forge
Hello my question is how connected influx db data to tensorflow model.
ripe onyx
slender sand
Can this not be accomplished with ```py
rf.predict_proba(X_test)
```
ye i was just talking about it from the model pov
 lapis sequoia


can someone help
syntax error for :
lambda str: ''.join[c.upper() if str[i-1] == ' ' else c for i, c in enumerate(str)]
anyone?
unreal vine
maiden merlin
send the code i might able to help you out
 tranquil sand
guys, is keras written in python or c++?
 austere swift
well yes and no
yes, its api is written in python
but the actual go-fast functions underlying it in tensorflow are all C/C++ and some cuda programming
keras is just an api for tensorflow, so keras itself is all python
but tensorflow has the underlying math functions and is mostly c/c++
thats the github language composition for keras (https://github.com/keras-team/keras)

and this is tensorflow (https://github.com/tensorflow/tensorflow)

 grand swan
I wanted to start with learning data science but I am literally confused where to start with. Note that Idk python
 sweet crypt
I was just wondering should we save optimizer states. I understand we should save it while if we are resuming training, but I don't understand how much would it affect?
 lone blaze
has anyone here messed with using TF_Agents and Gym?
 river sapphire
why do we need to divide (N * p(j))^-B by the maximum weight? it said to normalize it between the range of 0-1 but that didn't quite make sense to me
also what is the use of calculating the maximum priority?

i'm very confused, what does the triple equal sign mean?
hasty mountain
river sapphire
i'm very confused, what does the triple equal sign mean?
Ugh, math notations. I think it means something like "similarity", in practice it's almost the same as equal.
My teacher in school only explained this once while teaching about polynomials, so I don't recall quite well...
river sapphire
hasty mountain
Ugh, math notations. I think it means something like "similarity", in practice i...
yeah I tried to find somewhere where I could learn the notation but I couldn't find any
so what is it saying then
if t is similar to 0? what does this do
hasty mountain
river sapphire
if t is similar to 0? what does this do
If t value is 0 * mod K, then...
for 1 <= j < k:
I think it's something like this
I suppose t is a timestep, since it's a Reinforcement Learning algorithm
river sapphire
yea it is
so is this supposed to be a way to sample from the environment for say x time steps then go into the next phase which is learning?
and then repeat
iron basalt
river sapphire
yeah I tried to find somewhere where I could learn the notation but I couldn't f...
In abstract algebra, a congruence relation (or simply congruence) is an equivalence relation on an algebraic structure (such as a group, ring, or vector space) that is compatible with the structure in the sense that algebraic operations done with equivalent elements will yield equivalent elements. Every congruence relation has a corresponding q...
river sapphire
iron basalt
https://en.wikipedia.org/wiki/Congruence_relation
ah I see
hasty mountain
river sapphire
so is this supposed to be a way to sample from the environment for say x time st...
From what I can understand, it's describing how the model works with the proportional prioritization.
It takes a state St, Rt(which I suppose is the reward), and gamma, then it passes the input described through the model, sample a transition, compute importance sampling weight, TD-Error and then updates transition priority and changes weights
river sapphire
it doesn't have the small value to prevent a priority of 0 which is a bit odd
river sapphire
hasty mountain
From what I can understand, it's describing how the model works with the proport...
so my question was though why normalize it
why normalize the importance sampling weight
hasty mountain
Maybe it limits the values within range [0,1] to avoid dealing with numbers which have sizes too different, which could make it deal with...something that in practice would be dealing with inf
Suppose that in that sampling weight, without normalizing it, you would get a value that is 0.002 and another value that is 1523
river sapphire
in practice though N is usually a very large number so (1/N * 1/Probability)^B should be a small value?
hasty mountain
I don't know the answer either, but I suppose that it would be easier to simply deal with numbers within that range. It's widely known that normalizing datasets to values within [0,1] or [-1,1] can improve a model performance
hasty mountain
river sapphire
in practice though N is usually a very large number so (1/N * 1/Probability)^B s...
Perhaps
river sapphire
does that mean there could be a case where the importance sampling weight is a huge number causing it to actually overshoot the gradient?
and plus it's being multiplied by the learning rate as well so it's essentially taking a fraction of a fraction which should make the gradient smaller
hasty mountain
river sapphire
and plus it's being multiplied by the learning rate as well so it's essentially ...
That is probably the problem in fact
river sapphire
hasty mountain
That is probably the problem in fact
ooooh I see
 dusty valve
i was trying to use qtables and the the bellman equation to play snake
hasty mountain
Also...you might be interested in looking at some code
https://github.com/Kaixhin/Rainbow
This isn't the Double DQN that you're looking, but it's its successor, RainbowDQN, which uses some techinques from both DQN, DDQN, etc.
dusty valve
but this happened
river sapphire
hasty mountain
Also...you might be interested in looking at some code
https://github.com/Kaixhi...
a bit unfortunate that I don't know much python though so I would have to learn python first before I would be able to understand that
hasty mountain
I see
river sapphire
see I didn't exactly start in python I started in luau lol
dusty valve
this is an older one
river sapphire
hasty mountain
That is probably the problem in fact
ok after doing some calculations it looks like the lower the probability of an experience being selected (e.g it had lower priority) the higher the importance sampling weight which means higher priority experiences will constantly be selected so it will require more learning
and lower priority experiences well the network doesn't have much to learn from them so the error gradient should be small anyways correct?
because I saw that for lower priority experiences the importance sampling weight was magnifying the gradient by say 3 times
hasty mountain
river sapphire
and lower priority experiences well the network doesn't have much to learn from ...
Yep.
The idea is to make the model learn from bad experiences so it can make them become good experiences when that state repeats
river sapphire
then my second question what is the maximum priority used for?
hasty mountain
river sapphire
then my second question what is the maximum priority used for?
If your gradients get multiplied by a number that is too great, your model goes wild
Personal experience
river sapphire
I would be careful because that looks like it has a school name in it
hasty mountain
The only sad thing in those RL papers is that they usually rely on extremely well-controled environments, with everything under control and with you being able to store and repeat states as you wish...which, in practice, doesn't happen.
river sapphire
hasty mountain
If your gradients get multiplied by a number that is too great, your model goes ...
yeah but where does the maximum priority actually get used
hasty mountain
I think it won't at all. Maybe you can suppose that the maximum priority would be with reward = 0, when the model predicted everything it could as the opposite of the right thing.
But it's a bit hard for that to happen. Imagine that the reward for the state 1 is 10 points, and the model, in the state 0, predicted its reward would be 0. The loss would be something like (0-10)² = 100
However, the model could've predicted -10 --> (-10-10)² = 400
Or it could predict -100.
But it could never predict something that would make the loss be, like inf
And, if it does, it's because you did something really wrong
river sapphire
oh so you're saying maybe the maximum priority is for debugging purposes?
hasty mountain
Yes.
But then...maybe it would be better if you try learning Python so you can check some codes. Maybe seeing the code might give you a better idea on how things work
river sapphire
hasty mountain
Yes.
But then...maybe it would be better if you try learning Python so you can ...
I should but I have trouble focusing on learning it
river sapphire
hasty mountain
Yes.
But then...maybe it would be better if you try learning Python so you can ...
ok now I'm confused because in this stack overflow answer it says that setting it to the max priority is to ensure that it gets replayed at least once

wouldn't this make multiple transitions have infinite priority?
wouldn't this essentially be the same as picking from random?
I mean like after the first phase of sampling it would essentially be the same as picking from random if you set all the priority values to infinity
is this what it's supposed to do?
dusty valve
made a computer play snake with an RL algorithm (repost without path)
river sapphire
hasty mountain
If t value is 0 * mod K, then...
`for 1 <= j < k:`
hmm I understand that part now it's just like I said, K is supposed to determine the number of steps to sample from the environment before entering the learning phase and repeat
wintry gyro
Does anyone knows principal regression analysis ?
 shell sequoia
wintry gyro
Does anyone knows principal regression analysis ?
shell sequoia
wintry gyro
Does anyone knows principal regression analysis ?
Yup
 limber tangle
Built a model that can translate English to Spanish, in short implemented the transformer architecture in TensorFlow 2.x 🚀
The transformer architecture is the state of the art in both computer vision and NLP, this implementation of the transform architecture provides a easy-to-read code base and training pipeline.
Here's the implementation
https://github.com/TheTensorDude/Transformer-TF2.x

GitHub
This repository contains the code for the paper "Attention Is All You Need" i.e The Transformer. - GitHub - TheTensorDude/Transformer-TF2.x: This repository contains the code for ...
 lament dragon
Do we have a newbees channel for machine learning?
hollow citrus
You can just ask questions here
 upbeat lake
Can someone help me understand this confusion matrix result I got from my prediction label vs actual label?

🙂 I'm confused on what to make of this and what does this tell me about the accuracy of my prediction
 cedar quest
i need this code to give out a list eg. ["2017-07-31","2017-08-01"........]

Can someone help
young granite
cedar quest
i need this code to give out a list eg. ["2017-07-31","2017-08-01"........]
.tolist()?
if i create a df_dublicate with pd.DataFrame().reindex_like(df) can i use user input to fill it by not using many for loops?
cedar quest
young granite
```.tolist()```?
i have tried that
 young granite
cedar quest
i have tried that
young granite
cedar quest
i have tried that
should be due to ur dtype
len(us_b.tolist()) should be 628 correct?
cedar quest
Yes
young granite
cedar quest
Yes
u got it?
cedar quest
no i need help in changing it to list
young granite
.tolist() works as i said and u proofed, so u need to convert the export u do .tolist() on
check dtypes i gotta go now, but u should be fine
cedar quest
ok thanks
 warm dove
Does anyone have any clue on why despite the index being the same - they are put into this odd position?


these are what the two the variables used mean

and speaking of which, the additionBurgerData represents the difference column that is shown
the issue might be from there but just ping me in case it is
thanks a lot for those taking their time for this 👍
 warm verge
warm dove
Does anyone have any clue on why despite the index being the same - they are put...
warm verge
warm dove
Does anyone have any clue on why despite the index being the same - they are put...
Do you mean the big space on items 8 and 9?
warm dove
warm verge
Do you mean the big space on items 8 and 9?
no
that was intentional
I was talking about the whole row of null values
and how the Index is basically repeating itself
cause it goes from 0-10 then 0-10 again
warm verge
Could you include some code? And a description of the data set?
warm dove
this is the excel file
young granite
!code
arctic wedgeBOT
Here's how to format Python code on Discord:
```py
print('Hello world!')
```
These are backticks, not quotes. Check this out if you can't find the backtick key.
young granite
arctic wedge
read
warm dove
burgerPrice = df.fillna({'Price':'str'})

burgerPrice = burgerPrice['Price'].tolist()

def strWithInList(list):
    positionList = []
    for i in range(len(list)):
        if type(list[i]) == str:
            positionList.append(i)
    return positionList
print(strWithInList(burgerPrice))
#It simply sends out a list telling me the positions of the strings on the inputted list
def convertList(list):
    positionList = []
    for i in range(len(list)):
        if type(list[i]) == int or type(list[i]) == float:
            positionList.append(list[i])
    return positionList
#It returns a list without any string from the inputted list

df = pd.read_excel("C:\\Users\\cleyc\\Downloads\Book1.xlsx")


betterBurgerList = convertList(burgerPrice)
difference_data = []
for i in strWithInList(burgerPrice):
    betterBurgerList.insert(i,0)
for i in range(len(betterBurgerList)):
    if i != len(betterBurgerList) - 1:
        burgerDif = round(betterBurgerList[i] - betterBurgerList[i+1],2)
        difference_data.append(burgerDif)
    else:
        difference_data.append(0)

additionBurgerData = {
    'Differences': difference_data
}
new_df = df.append(pd.DataFrame(additionBurgerData))
print(new_df)
thanks
young granite
warm dove
thanks
try to write py at the beginning so we get it in colors
as seen in the !code
young granite
ppl dont wanna see screens so if u define a good question and share code u will more likely get help 😄
warm dove
yeah I didn't know
young granite
and u also can use #❓|how-to-get-help and read how to create a help channel
cause if u got large code and ppl write in chat its not pinned and its harder to moderate
warm dove
ah ok
young granite
after u created a help channel u can ping the help-channel here
 uneven totem
um
 zenith hawk
Hey, just logics question. I have 25k dates and value df and 50k dates df. I want to add that value to bigger df IF dates are the same, how I should do it ? I tried just with writing df.loc condition but that didn’t work at all.
serene scaffold
zenith hawk
Hey, just logics question. I have 25k dates and value df and 50k dates df. I wan...
merge?
by add, do you mean actual addition, or concatenation, or what?
 pure sable
zenith hawk
Hey, just logics question. I have 25k dates and value df and 50k dates df. I wan...
pure sable
zenith hawk
Hey, just logics question. I have 25k dates and value df and 50k dates df. I wan...
You can do pd.merge() but this will require some common column in both df. If you want to add or append then you can use pd.concat() by doing this your data shape would be of 75k observation
lapis sequoia
Not sure if this is right place but why doesnt pillow library open the image even its in same folder? Do i need to put like Image.open(”Whole path”)
serene scaffold
lapis sequoia
Not sure if this is right place but why doesnt pillow library open the image eve...
it depends on what Python thinks your current directory is, which you can find out with print(os.getcwd()). but doing the whole path would also work
lapis sequoia
serene scaffold
it depends on what Python thinks your current directory is, which you can find o...
Thanks im just trying to avoid extra text.
zenith hawk
pure sable
You can do pd.merge() but this will require some common column in both df. If yo...
Thanks, merge will do
 fading wigeon
@warm verge Out of curiosity, how do you handle the drawbacks of juptyer notebooks? I'll start with an easy one. With scripts when you run them they execute their commands in order. Notebooks give the ability to run commands out of order or across multiple notebooks which can have unintended consequences and be hard to debug, due to hidden state issues.
Huh, interesting.
So it looks like that's a tool that obfuscates the notebook code from the end user?
 misty flint
this is cool. im gonna show my friend this
starred it
maybe itll make his job easier
 proven pier
This is more of a signal processing question than python. What sort of knowhow would it take to interpret a linear signal (like an audio one) and break it down into all of its basic summed components (basic waveforms with transient components). Think square waves, triangle waves, noise waves (for percussion and such). I mean there could be millions of different ways to get the same output signal with different components right? So I don't know how possible it could be
fading wigeon
proven pier
This is more of a signal processing question than python. What sort of knowhow w...
So, there's two ways to do this. I like method 1) but it's not always possible.
It's a source separation problem. For X sources of the signal you need X different sources in order to break it down into components. (Or is it X+1 I can't always remember, lol). Thankfully there are algorithms that do this, but you need the sources.
- I believe you can also use AI/PCA to break down a signal into different components from a single source. I've always found this a lot iffier. You have to know something about the signal, you can't go into it blind. (I believe this works when you know all the components are periodic sin waves, may work for other types but I don't have experience with that
Sorry not PCA, ICA
proven pier
I mean, thinking about a frequency spectrum, aren't all signals a sum of arbitrary strength and period length sine waves?
Just in regards to the comment at the end
fading wigeon
In the frequency spectrum, sure. But if you're looking at the time series, you may have to account for different waveforms, such as pulses or beats
proven pier
So you mean you just need to know the components characteristics in a population of "categories" that somehow an AI could pick out. But that's the thing - it needs to be targeting specific "timbres" as they say in audio
What was method 1, I didn't really understand
 wooden sail
these two methods don't seem to be what you're interested in though
proven pier
I don't know what I'm interested in, that's why I asked lol. I mean, I don't think I'd be able to implement it (some intense DSP). But I'm listening to music that I want to recreate and it has me thinking about it in the scientific sense vs me just breaking it all down manually
warm verge
fading wigeon
So it looks like that's a tool that obfuscates the notebook code from the end us...
Yes, so portfolio managers (who historically don't want to spend time learning python) can do research, backtesting, general analysis etc without much help from a tech team
wooden sail
well, what you said earlier is about right. if you take samples of a signal and put them in a vector, this vector lives in a vector space R^n. there are infinitely many bases for this vector space
a particularly nice one is the one used for fourier analysis: complex exponentials
warm verge
misty flint
maybe itll make his job easier
If they use notebooks then yeah hopefully
proven pier
wooden sail
a particularly nice one is the one used for fourier analysis: complex exponentia...
so sinusoids
wooden sail
you could instead use others. in multiscale analysis one does a wavelet decomposition, for instance
warm verge
wooden sail
a particularly nice one is the one used for fourier analysis: complex exponentia...
Was gonna say fourier
wooden sail
proven pier
so sinusoids
sure
proven pier
Idk it's been a while since I did fourier stuff lol I may sound ignorant
fading wigeon
proven pier
What was method 1, I didn't really understand
Think of a band where you have someone playing on the guitar and someone playing on the drums. If you have one person listening, you can't tell anything about how far away one is from where they are. But if you have two people listening, the aspect of the drums will be of a different volume than the aspect of the guitar, so you would be able to solve for each individual component. That's the source separation problem in a nutshell
wooden sail
when talking about timbre, as you said, one does two things. first, you find the fundamental frequency or loudest tone in your signal. second, you study all the OTHER spectral coefficients. then you can have several signals with the same fundamental tone, but different timbre
source separation, PCA and ICA are based on the idea of building a basis that takes into account (orthonormal) vectors that maximize the variance of the data's projection onto them, so it's more of this same idea
proven pier
fading wigeon
Think of a band where you have someone playing on the guitar and someone playing...
wow that's crazy, it kinda makes sense though. So some components would be louder than others and that's an easy way to separate them
fading wigeon
I will preface this conversation with saying that I don't do signal processing on audio, I do it on biological signals like muscle movement, brain waves, and heartbeats.
wooden sail
so a crucial tool in them is the singular value decomposition (or eigenvalue decomp if you look at the covariance matrix)
proven pier
I don't do signal processing ever, so I take yalls word for it..
fading wigeon
I'm actually procrastiinating solving a source localization problem right now, hah.
proven pier
wooden sail
when talking about timbre, as you said, one does two things. first, you find the...
This is for a single windowed FFT? Because attack, decay, sustain, and release are all extra components when it comes to "Transient" piece
I mean, technically you can add in things like pitch modulation, and a list of other audio transformations. But right now trying to talk about at least basic sound (linear signal) construction
wooden sail
my 2 cents is: the way you do the analysis and decompose the signal depends entirely on what you want to do with it. and you can also always black box deep learning the task, which will learn a nice basis on its own and save you the trouble (if you have enough data)
idk what you mean with "linear signal" here tbh
wooden sail
proven pier
This is for a single windowed FFT? Because attack, decay, sustain, and release a...
this would require a time-frequency approach, like several windowed decompositions. kinda like the short-time fourier transform
proven pier
Scrap that term. I'm the kid at a big boy table
wooden sail
wooden sail
this would require a time-frequency approach, like several windowed decompositio...
though on the other hand, most useful decompositions are anyway invertible and ideally unitary, so all the information is in whatever domain you pick. it's just a question of which domain makes the task easier
lapis sequoia
CV2 appears broken on windows. Sad
wooden sail
if you must use windows, consider wsl2 to save your soul
lapis sequoia
wooden sail
if you must use windows, consider wsl2 to save your soul
I’m good lol, I have what I need on it
proven pier
wooden sail
though on the other hand, most useful decompositions are anyway invertible and i...
Invertible, unitary, these are qualities I do not grasp
fading wigeon
wooden sail
idk what you mean with "linear signal" here tbh
I assumed they just meant like... time series. Maybe multiple (or single?) sinusoidal signals
wooden sail
the thing is sinusoids are not linear 😛 when i hear linear i imagine they come from a linear physical process. very few signals are actually like this
proven pier
fading wigeon
I assumed they just meant like... time series. Maybe multiple (or single?) sinu...
Essentially my understanding is there are linear and non linear signals. Linear is a sum of its parts
LTI system - linear, time invariant
fading wigeon
proven pier
Essentially my understanding is there are linear and non linear signals. Linear ...
Got it.
wooden sail
proven pier
LTI system - linear, time invariant
that's a completely different thing
proven pier
That has to do with a system not a signal then eh? Woopsies
wooden sail
indeed
the signal can be a nonlinear function, but if it satisfies some mild conditions, it can anyway be decomposed via fourier
and in finite dimensional vector spaces, all vector spaces have a basis. in R^n and C^n, infinitely many of them, too
so any vector of these kinds can be expressed as a linear combination of other stuff
these two ideas DO fit together though
and it's that for LTI systems, complex exponentials are eigenfunctions. you put in a complex exp as input signal for an LTI system, you get a complex exponential of the same frequency as an output, but with different amplitude and phase
then decomposing the signal into fourier components lets you analyze the effect of the LTI system by studying one fourier component at a time and re synthesizing on the other side
proven pier
wooden sail
the signal can be a nonlinear function, but if it satisfies some mild conditions...
I guess something like a sawtooth signal comes to mind here
wooden sail
indeed
wooden sail
give or take periodicity conditions. the signal needs to be square integrable, which can mean finite energy if the signal has a finite duration, or finite power if it's periodic
proven pier
proven pier
I don't know what I'm interested in, that's why I asked lol. I mean, I don't thi...
This is what sparked the curiosity, but you know I'm interested in signals in general. Well, technically audio or electrical doesn't matter in this case. In fact I'm viewing it electrically speaking (1.0 -> -1.0) values that go to the DAC and then to my headphones
wooden sail
it's aight, the techniques generalize anyway
but the origin of the signal does usually determine what you want to do with it and how well certain methods work
proven pier
fading wigeon
Out of curiosity, are you working with an audio signal here?
Just in case you're curious. It's audio, but you know all 1's and 0's
fading wigeon
Gotcha.
wooden sail
proven pier
Just in case you're curious. It's audio, but you know all 1's and 0's
that's a good bop, ngl
proven pier
I mean, it's an old game so I'm sure another way could be to just go to the emulator's game data and somehow figure out where they send their audio synthesizer info
fading wigeon
I trend towards source separation methods because it's generally easier to stick additional electrodes/wires on to get additional sources/listeners
fading wigeon
proven pier
Just in case you're curious. It's audio, but you know all 1's and 0's
catchy!
proven pier
I suppose you wanted to know if it was live music recording which would allow for source separation, which won't apply to my use unfortunately
wooden sail
you could certainly try to split it into channels
fading wigeon
Yeah, probably not
proven pier
The whole 50 seconds of the bop are very good, I sampled it from here https://www.youtube.com/watch?v=AdDbbzuq1vY
fading wigeon
Ah, I was wondering if it was Megaman 🙂
proven pier
Yeah that whole franchise, maybe just capcom, they got some good composers
This software has some good features in it, and you can view a spectrogram simultaneously. Looking at the logarithmic scale of the frequency spectrum - the left side actually gets matched up to a piano for a few octaves. You can normalize the spectrum and change windowing and I actually filtered out some "Bins" as they put it

 violet gull
github.com/Saratii/MLStuff
Why does the loss not go down very much? When I use a much smaller data set it gets to 0.001 average loss but with bigger data it stops in the 0.20s
 north reef

Stack Overflow
I am solving a multiclass classification problem using LinearSVC() where each class has the following samples (training data)
Counter({7: 4799, 6: 4713, 4: 4448, 3: 419, 2: 405, 5: 324, 0: 214, 1: ...
Can someone help me with this?
 snow helm
would someone be able to help with a relatively simple data science pandas question?
wooden sail
depends on what the question is, so just go ahead and ask
serene scaffold
snow helm
would someone be able to help with a relatively simple data science pandas quest...
don't ask to ask. if it's really a simple question, and your whole question was present in your first message, we'd have answered it by now 😛
 mellow wraith
Having an issue that I completely do not understand why it's an issue, my tensor is going out of bounds.
        print(weights.shape)
            if(len(tokenstack) > 0):
                val = sum(tokenstack)
                weights[:][index+1] *= 1.0 + val
An example output of the weights tensor shape output from the above print:
torch.Size([1, 77, 1024])
But my select all for the weights is going out of bounds? This is very confusing. the error:
weights[:][index+1] *= 1.0 + val
IndexError: index 2 is out of bounds for dimension 0 with size 1
Why is this indexing past the valid indexs into out of bounds? It has the same issues if I exchange [:] for [...]
serene scaffold
mellow wraith
Having an issue that I completely do not understand why it's an issue, my tensor...
try this instead
print(weights.shape)
if len(tokenstack) > 0:
    val = sum(tokenstack)
    weights[:, index+1] *= 1.0 + val
if isn't a function, for one thing. but also, arrays and tensors are one object, no matter how many dimensions they have, so you index them as one object.
mellow wraith
ah the dreaded list tensor mismatch got me again 😢 thank you
serene scaffold
mellow wraith
ah the dreaded list tensor mismatch got me again 😢 thank you
no problem. did that fix it?
mellow wraith
what do you mean by if isin't a function by the way? And yes it did, thanks =]
serene scaffold
you wrote if(len(tokenstack) > 0), as if if was a function, or something
mellow wraith
ah, yeah probably habbit from other languages. I've only been writing python for a few days so my usage is probably not very pythonic xD
didin't know I could omit them
serene scaffold
this question is pretty abstract. you can't wrap your head around certain functions that are being called in some code. what code?
though even if I knew, I'm not entirely sure what you're asking. unless you just wanted to vent your frustration with the lecture.
!paste
arctic wedgeBOT
Pasting large amounts of code
If your code is too long to fit in a codeblock in Discord, you can paste your code here:
https://paste.pythondiscord.com/
After pasting your code, save it by clicking the floppy disk icon in the top right, or by typing ctrl + S. After doing that, the URL should change. Copy the URL and post it here so others can see it.
 fringe anvil
how would i translate that code to a dataframe? im trying to use polynomial features for my model
serene scaffold
well, you can always do arr = df.to_array()
 deep bloom
I have a set of json objects I'd like to rank, based on the field data. For example
{
  duration: "1 month",
  budget: "1000",
}
Assume I've defined the rankings for each field...is there a python lib that would do this /help me or am I better off doing it from scratch?
river sapphire
if we always store new experiences with maximum priority wouldn't that make the agent always select the newest experiences? wouldn't this ruin the whole purpose of stochastic prioritization?
 river sapphire
if we always store new experiences with maximum priority wouldn't that make the ...
river sapphire
river sapphire
if we always store new experiences with maximum priority wouldn't that make the ...
ok so I just read someone else's implementation of prioritized experience replay and it seems like it defaults to a priority value of 1 if there is no priority values in the replay buffer otherwise it runs the max function which just returns the highest value in an iterable which seems reasonable, I was reading somewhere that the default priority should be a really high number and I was a bit skeptical
iron basalt
river sapphire
ok so I just read someone else's implementation of prioritized experience replay...

 river sapphire
oh
verbal venture
what's the suggested algorithm for classifying whether or not a property should be sold, based off previous sold properties in the area? The data set is 200k previous listings, and features are ~ 200
Or what would be the top 3 algorithms for that
austere swift
in order for a machine learning algorithm to work you need data representing each of the classes (in your case, sold and not sold)
if you just have data on sold properties and nothing on what properties shouldn't be sold, you will probably have a bad time
 charred light
verbal venture
what's the suggested algorithm for classifying whether or not a property should ...
charred light
verbal venture
what's the suggested algorithm for classifying whether or not a property should ...
Generally you're looking at a classification problem (Sold/Not Sold) Easiest model would be random forest - Classification or regression both works as this is a binary classification problem. Another would be logistic regression (Based on linear regression), or K-NN (K-nearest neighbor)
violet gull
lapis sequoia
is ai possible for discord???
Yeah use tensorflow or PyTorch
Python is the easiest language for ML
lapis sequoia
😮
 meager mural
What should I choose between standardisation or normalisation for knnearest algorithm on a data set
lapis sequoia
meager mural
What should I choose between standardisation or normalisation for knnearest algo...
standardisation
verbal venture
charred light
Generally you're looking at a classification problem (Sold/Not Sold) Easiest mod...
would you use gradient descent? why or why not?
charred light
verbal venture
would you use gradient descent? why or why not?
You should do some research on what gradient descent actually is. https://builtin.com/data-science/gradient-descent , https://www.ibm.com/cloud/learn/gradient-descent
It can be used in some models where applicable as it is a algorithm to find the minimum loss. However, it doesn't apply to models like Random Forest which is discrete. https://stats.stackexchange.com/questions/226230/random-forest-hyperparmeter-tuning-using-gradient-descent
verbal venture
charred light
You should do some research on what gradient descent actually is. <https://built...
Okay so only logistic regresion and KNN for algos?
meager mural
Is r2 score highly important in context of knn. I got a 0.01(r2score) but I got a score of 0.75(classifier score) and mean squared error of 0.25
charred light
meager mural
Is r2 score highly important in context of knn. I got a 0.01(r2score) but I got ...
R^2, Mean Squared errors are for Regression analysis and is not relevant for KNN in the context of classification. For classification, you want to look at F1, precision and recall.
charred light
verbal venture
Okay so only logistic regresion and KNN for algos?
Not sure what you mean by this. If you're talking about logistic regression and KNN for binary classification, those are a few models out of many others that can do binary classification.
verbal venture
charred light
Not sure what you mean by this. If you're talking about logistic regression and ...
As in those are the only 2 models you’d recommend? There’s also SVM
charred light
verbal venture
As in those are the only 2 models you’d recommend? There’s also SVM
Yes, SVM is a classic classification model too. (https://analyticsindiamag.com/7-types-classification-algorithms/) There's a chart at the very end.

Classification in machine learning - types of classification methods in machine learning and data science - classification techniques
bold timber
Hello guys, now I'm studying RNN models. But, I have a question: whether RNN layers doing for fully connected to get a new sequence?
 spring basalt
Hello guys I have just started learning machine learning
First algorithm that i am going to learn is KNN
Any suggestions
charred light
spring basalt
Hello guys I have just started learning machine learning
First algorithm that i...
https://www.youtube.com/watch?v=HVXime0nQeI is a good start. Then go from there. Read articles on towardsdatascientist, etc

Machine learning and Data Mining sure sound like complicated things, but that isn't always the case. Here we talk about the surprisingly simple and surprisingly effective K-nearest neighbors algorithm.
For a complete index of all the StatQuest videos, check out:
https://statquest.org/video-index/
If you'd like to support StatQuest, please cons...
spring basalt
charred light
https://www.youtube.com/watch?v=HVXime0nQeI is a good start. Then go from there....
Thank you
lapis sequoia
charred light
https://www.youtube.com/watch?v=HVXime0nQeI is a good start. Then go from there....
how to know what algo should we apply on a particular dataset
 young ridge
Hi guys, im currently doing a project on machine learning which emphasises on feature engineering. I am trying to conduct feature engineering on this column below that states the Company Industry, any suggestions on how should feature engineering be done on this column?
 serene scaffold
@young ridge there's too many. You might try grouping them into larger categories
young ridge
Any suggestions on the type of categories?
Method wise I realised it’s going to be difficult because there’s so many options
hasty mountain
young ridge
Any suggestions on the type of categories?
Education, Finances, Engineering, Technology, Logistics...
young ridge
hasty mountain
Education, Finances, Engineering, Technology, Logistics...
alright thank you
will try to implement that type of categorisation
hasty mountain
Hey @serene scaffold just to confirm one thing...
In NLP, an Embedding layer, or simply a vectorizer model, takes an input which is the index of a list of words/n-grams/sentences properly one-hot/index encoded, tries to extract the context, and outputs a vector, right?
If encoding a single word, it'll output a single vector. If multiple words(n-gram/sentence), multiple vectors, right?
But how would I determine how many dimensions my vector would have? I know that, if I want to make a sentiment analysis, I could use a single dimension(I'm thinking about an x-axis where the left is "negative" and the right is "positive" sentiment), but what if I want to vectorize a book, for example? Or make a translator model?
serene scaffold
hasty mountain
Hey <@253696366952316929> just to confirm one thing...
In NLP, an Embedding laye...
are you using keras?
hasty mountain
serene scaffold
are you using keras?
Pytorch
serene scaffold
hasty mountain
Pytorch
in either case, I think an "embedding layer" is an abstraction used by deep learning libraries, rather than a widely-used concept in ML theory.
in NLP, the idea with embeddings is that a word or sequence of words can be represented as a vector, and vectors for two semantically similar word sequences will be closer together than word sequences that are not.
there are different ways of creating the embeddings. all that ultimately matters is that they have that property I just said. and then how you use them depends on your network architecture.
If multiple words(n-gram/sentence), multiple vectors, right?
there are different techniques. some have separate vectors for each token, and sequences of tokens might be represented as the average of each token
hasty mountain
serene scaffold
> If multiple words(n-gram/sentence), multiple vectors, right?
there are differe...
I see...so, the dimensionality of my output vector kinda depends on what I'm doing and on trial and error?
serene scaffold
not necessarily trial and error. it should be possible to know the length of the output before running something through the network.
but it does depend on what kind of embeddings you use
hasty mountain
serene scaffold
but it does depend on what kind of embeddings you use
Hm... But the general idea is what I said? The input would be the one-hot encoded token and the output will be a vector? Where the idea is to make the model be able to extract the context of the input and return a vector based on that?
So, If I want to make a model relate certain words to an image, I would need to extract features from an image, extract features from the encoded token, concatenate both features and then output a vector?
(I'm actually trying to make a vectorizer for a Reinforcement Learning model, but this subject is usually more associated to NLP)
 delicate bay
Hi, I'm looking for a dataset which includes cars that weave through the traffic. If you can help me in any way please tell to me.
 tulip swift
hi
 copper mica
is there any way i cna use like
My local IDE, and use some GPU on the cloud like google colab
i really don't like having to use google colabs web IDE. I use IntelliJ and would like to stick to that
serene scaffold
copper mica
My local IDE, and use some GPU on the cloud like google colab
in general yes, but probably not with google colab.
I do a lot of work on an AWS VM, and the experience with Jetbrains Gateway is pretty good
copper mica
what would you suggest?
jetbrains gateway
i've literally somehow never heard of that
serene scaffold
omg, is the dev of jetbrains discord integration typing?
copper mica
serene scaffold
I do a lot of work on an AWS VM, and the experience with Jetbrains Gateway is pr...
anyways how practical is this for a hobbyist?
over just buying a machine with like a couple of 3080s in it
serene scaffold
copper mica
anyways how practical is this for a hobbyist?
very not practical. AWS compute is expensive.
 fresh tiger
Hi, I have a question regarding GKE, CloudSQL and AI platform related to deploying an AI system that includes: a UI, an ai model that makes predictions based on user input, the option to add more data and retrain from the ui, and the model being able to retrain itself from the new data that a user can input.
I wanted to confirm if the approach for deplyoing an AI system is correct:
- Use GKE for a kubernetes cluster that has a python django app
- Use cloudSQL to run a postgresql database that stores new training data that users can input from the django app website.
- Use AI platform to train and version the AI model. The django app can send a request to the AI platform to trigger retraining. The AI platform can access the cloudSQL database for the data retraining
I am not sure if this is generally the correct way, as I have recently started reading that the AI platform can't actually access the cloudSQL database?
serene scaffold
copper mica
do you have any suggestions then? <@253696366952316929>
keep in mind that services that let you do GPU computation for free are, tautologically, giving you a free thing. google colab is already pretty generous. if you really dislike the colab UI, your best option is probably to make the notebook locally and upload it when you're ready to run.
copper mica
im paying for it
im willing to use a paid service
that's what i want, actually but i am just a hobbyist
serene scaffold
interesting. apologies--most of the users here do not.
copper mica
i mean it's just $13 a month
for google colab. I work as a software dev so i'm not a student
in university that is anyway
serene scaffold
do they expose the jupyter server? if so, you might be able to connect to it from pycharm
copper mica
I'm not sure how i would navigate to find the answer to that question. I know you can use google colab with your local hardware
serene scaffold
with your local hardware? isn't that the opposite of the point?
copper mica
yeah, exactly
serene scaffold
one of the answerers here says that colab simply can't be used as a remote environment https://stackoverflow.com/questions/48860709/how-to-use-google-colaboratory-server-as-python-interpreter-in-python-ide
Stack Overflow
Google Colaboratory currently by default provides Jupyter notebook like interface for code development. But I feel that code development on this interface without advanced IDE features is constrain...
serene scaffold
how much are you willing to spend? at work, we rent an EC2 instance with a GPU that costs a few dollars per hour
but you can just ssh to it and do anything that you can do with an ssh connection
copper mica
I don't really have a perspective of how much it'll cost honestly
the $13 a month is a great deal
as for how much im willing to spend, i can't really say without getting a perspective of how much bang for my buck im getting
there always is the alternative of just building my own machine with a couple of 3080s
but that'll be expensive too 😅
copper mica
serene scaffold
how much are you willing to spend? at work, we rent an EC2 instance with a GPU t...
if i go by a per hour basis i'd see myself being very conservative. Ideally i'd just subcsribe to some monthly deal...
but now that i think about it those monthly deals are capped anyways
 stoic echo
Hello everyone, I'm new to python. I created a complex application application with kivymd, kivy and pyttsx3. Everything works well in development but when I generate my exe file sometimes it opens the console and after that it hangs and sometimes it loads but nothing happens. It's been 2 days now I'm on it.
I watched a lot of tutorials on youtube and I checked a lot of documentation but I still encounter the same problem. however I created a demo application for testing but nothing has changed. I uninstalled and installed many versions of python and pyinstaler and auto-py-to-exe and kivymd, I modified the spec file several times but still the same problems. please help me please, i have been unable to do anything for 2 days now.
I send you the little demo project.
I am using windows 10 pro.
arctic wedgeBOT
Hey @stoic echo!
It looks like you tried to attach file type(s) that we do not allow (.zip). We currently allow the following file types: .gif, .jpg, .jpeg, .mov, .mp4, .mpg, .png, .mp3, .wav, .ogg, .webm, .webp, .flac, .m4a, .csv, .json.
Feel free to ask in #community-meta if you think this is a mistake.
stoic echo
please help me to generate exe file. by sending me this exe file. and give me your instructions and config of the file.spec . code in down
arctic wedgeBOT
Hey @stoic echo!
It looks like you tried to attach a Python file - please use a code-pasting service such as https://paste.pythondiscord.com
Hey @stoic echo!
You either uploaded a .txt file or entered a message that was too long. Please use our paste bin instead.
 visual heron
So, does anyone know an easy to use python library for AI upscaling?
Because those online services which offer such services all are either pretty bad or cost money (due to the cokputation resources needed)
So i thought maybe its possible to easily run an upscaler locally with the help of a python library
 tidal bough
visual heron
So, does anyone know an easy to use python library for AI upscaling?
tidal bough
visual heron
So, does anyone know an easy to use python library for AI upscaling?
for one, there's an upscaling component in stable diffusion (2x and 4x upscalers there)
haven't seen if you can get only the upscalers without the rest but almost certainly yes
austere swift
there's also dozens of ai upscaling models that you can find online which can be imported into different libraries
visual heron
tidal bough
for one, there's an upscaling component in stable diffusion (2x and 4x upscalers...
I will look into this then
visual heron
tidal bough
haven't seen if you can get only the upscalers without the rest but almost certa...
I don't mind it being a huge library, just need the upscaler to be part of it
austere swift
a quick google search led me to this https://github.com/xinntao/ESRGAN
tidal bough
visual heron
I will look into this then
Last time I messed with it I used the one at https://github.com/AUTOMATIC1111/stable-diffusion-webui but it has been 3 months ago so for all I know it's stone age by now or something 🥴
well, the SD itself. the upscalers in it are probably still exactly the same
 raven summit
Is there any one who have completed deep learning specialization course by Andrew Ng recently???
plzz dm me
visual heron
@austere swift my issue with google is this, usually when searching for ai stuff you get tons of results all telling you how good they are. So its easier to ask if someone has experience with it and knows a good one
visual heron
tidal bough
Last time I messed with it I used the one at <https://github.com/AUTOMATIC1111/s...
So either this or stable diffusion, thx
austere swift
visual heron
<@494466018245345282> my issue with google is this, usually when searching for a...
Yeah I've never worked with ESRGAN but I can attest to the performance of stable-diffusion as I've used that a few times
stoic echo
stoic echo
Hello everyone, I'm new to python. I created a complex application application w...
someone can help me please, i really need yours hepls
austere swift
stoic echo
Hello everyone, I'm new to python. I created a complex application application w...
when generating the exe file you sometimes have to specify some files that should be packaged in with it for certain libraries, including kivy
hasty mountain
austere swift
a quick google search led me to this https://github.com/xinntao/ESRGAN
Interesting... I thought SRGAN was still the state-of-the-art SuperResolution model
Have to take a look sometime
austere swift
hasty mountain
Interesting... I thought SRGAN was still the state-of-the-art SuperResolution mo...
yeah that's "enhanced" SRGAN
stoic echo
austere swift
when generating the exe file you sometimes have to specify some files that shoul...
I didn't understand correctly, please show an example with the code I posted. please
stoic echo
austere swift
when generating the exe file you sometimes have to specify some files that shoul...
this is
austere swift
I honestly don't really remember how to do it, I had to do it once for a project a while ago
regardless, this isn't really the place to ask about kivy stuff, that would be better asked in #user-interfaces
 loud plover
Hello everyone. I'm trying to create predictions/forecasts for time series data with multiple columns but the issue I'm running into is when I use SARIMA it's functions only allow for one series. Like for example when I use this function: sm.tsa.statespace.SARIMAX
How do I get good predictions for multiple columns of stationary data?
delicate bay
which one gives results faster and better: Teachable machine or Yolo
austere swift
i've never heard of teachable machine, but I know yolo has been at the top of pretty much every graph i've seen thus far in terms of speed so yolo is pretty good
stoic echo
austere swift
I honestly don't really remember how to do it, I had to do it once for a project...
i see. thanks
 thorn zephyr
anyone is playing with openai's davinci?
charred light
lapis sequoia
how to know what algo should we apply on a particular dataset
Depends on what problem you want to solve. Starting with a regression (predicting a number) or classification (dog vs cats) problem. From there, you can see how much data you have. How many columns you have. Need to reduce columns? Might need PCA. Neural nets are better with more data.
 random scarab
What kind of dataset is a decision tree algorithm most effective on?
 steady basalt
Like specifically?
Non linear data
Where you aren’t going to be able to pick up relationships at first glance
random scarab
steady basalt
Where you aren’t going to be able to pick up relationships at first glance
Thanks
copper mica
this is from the diffusion model paper

let's say i want to actually compute this by hand, how can i do this
for more context

im struggling to connect the math notation to the actual algorithm
 elfin heart
Hey Guys,
i have a Problem and i hope someone can help me.
My Data is looking like this.
Timestamp                   |               Message
2022-12-02 01:27:15                      Test
2022-12-02 01:27:15                      Test
2022-12-02 01:27:17                      Test
2022-12-02 01:27:45                      Test
2022-12-02 01:28:15                      Test
2022-12-02 01:29:00                      Test
2022-12-02 01:29:30                      Test
I am trying to create a timeseries similar to the one on YouTube, as in the example.
My goal is to group the time with the most messages to later match them to a video to automatically cut highlights by chat activity.
My approach would be to count how many times messages were sent in a certain period of time to determine the point where the most writing took place.
For Example the first three entries are really close together so i want to highlight them.
Now my question.
Does something similar already exist or does anyone have experience with it?
Thank you very much.
 charred light
elfin heart
Hey Guys,
i have a Problem and i hope someone can help me.
My Data is lookin...
charred light
elfin heart
Hey Guys,
i have a Problem and i hope someone can help me.
My Data is lookin...
Are you looking at just specific time stamp? Or having some variation? You can look at groupby in pandas.
elfin heart
charred light
Are you looking at just specific time stamp? Or having some variation? You can l...
Im looking just for the Timestamp the message is irrelevant...
but i thought the same with groupby
charred light
elfin heart
Im looking just for the Timestamp the message is irrelevant...
but i thought th...
I meant, are you looking specifically for: 2022-12-02 01:27:15 or a range of values: Like 2022-12-02 01:27:10 -> 2022-12-02 01:27:15
If you're looking at just the most common, then groupby would work.
steady basalt
copper mica
let's say i want to actually compute this by hand, how can i do this
if you k now what each variable is, whats the problem?
copper mica
I don't know what the variables are.
I know that x(T) represents the fully destroyed image.
I don't know how you are supposed to plug that in a formula.
steady basalt
then theres no point in even attempting to do that because you literally cant
copper mica
I guess my question is where in the paper does it actually explain?
That's my struggle
steady basalt
Think you might need to drop some context on what latents are, I know nothing on diffusion models
steady basalt
yeah not r eading, too techincal, have never learnt about diffusion
charred light
elfin heart
Im looking just for the Timestamp the message is irrelevant...
but i thought th...
Something like: df.groupby(['timestamp']).size() if singular timestamp.
copper mica
😅
steady basalt
id probably need to introduce myself to how themodels work before efven looking at that
copper mica
i mean i don't blame you
what i don't understand is how you're supposed to draw meaning from these formulas
they seem practically worthless
steady basalt
if u know how the models generally work the paper shud be followable
elfin heart
charred light
I meant, are you looking specifically for: `2022-12-02 01:27:15` or a range of v...
Im looking for the range of values in a specific range to get the most written point and ranges of timestamps where is more written than where is nothing written
steady basalt
i mean yeah, people throw shit like that in alot
copper mica
I guess i was assigning too much value to the formulas?
steady basalt
Yes
copper mica
I thought it was important for me to understand
steady basalt
This paper assumes you know these already maybe
copper mica
does anyone have any experience with diffusion models here
elfin heart
charred light
Something like: `df.groupby(['timestamp']).size()` if singular timestamp.
But this is one step in the right direction
steady basalt
u dhave to look into the reverse process they mention
which symbol are you struggling to assign ?
all u need to connect the dots here are what are latents
 chrome lake
Hello. Small NN question, when choosing # of hidden neurons in a hidden layer, some heuristics/sources are based on how many inputs/outputs you have. Now do they mean inputs/outputs of training or # of inputs/outputs of testing. Because I would use the same ANN from the training data on the testing data. I assume they mean based on training data but needed some clarification?
 grand mason
random scarab
What kind of dataset is a decision tree algorithm most effective on?
grand mason
random scarab
What kind of dataset is a decision tree algorithm most effective on?
I think ones with a large number of features, where not all might be important
steady basalt
@copper mica https://arxiv.org/pdf/2209.00796.pdf
this is way more helpful for you surely
infact, i will read this paper if you do
austere swift
what library is being used?
grand mason
Is there a good way to create a graph like this, where the color of the heatmap in the background is based on the density of the red and blue points places
 charred light
it's tied to the axis
austere swift
that should theoretically work, can you show your full code?
austere swift
charred light
it's tied to the axis
you can set the facecolor in the figure function like that
you're not using the figure you created
charred light
austere swift
you can set the facecolor in the figure function like that
Good to know.
I always use white for sanity reasons
austere swift
you can also set the facecolor in the plt.plot() function iirc
but what you should be doing is setting your plt.figure call to a variable like here, then putting figure=fig in the plt.plot() call
elfin heart
charred light
Something like: `df.groupby(['timestamp']).size()` if singular timestamp.
Tried it, firs approach is good, what is the best way to combine it with the Timestamp so i can draw a graph ?
charred light
elfin heart
Tried it, firs approach is good, what is the best way to combine it with the Tim...
Like a histogram of sorts? If you reset the index of that code, you should get a df of 2 columns: timestamp, size. And then you can do a histogram on that.
elfin heart
charred light
Like a histogram of sorts? If you reset the index of that code, you should get a...
df.groupby(['date']).size()
This is an int basically right ?
Not an df
charred light
elfin heart
`df.groupby(['date']).size()`
This is an int basically right ?
Not an df
This returns a series. Where your index is 'date', and your size is your values
elfin heart
Okay so i just have to call to_frame()
charred light
elfin heart
Okay so i just have to call to_frame()
That works too. Or just add a .reset_index()
elfin heart
Okay ^^ will try thanks
elfin heart
charred light
That works too. Or just add a `.reset_index()`
Is there a way to add an offset ?
That its not the exact timestamp that is grouped by ?
Its for example from
So the offset would be 3
from the middle its getting grouped as well
2022-12-02 01:27:13
2022-12-02 01:27:15
2022-12-02 01:27:17
This is from 27:15 + 3 secs = 18 so its out of range
2022-12-02 01:27:19
2022-12-02 01:27:20
You might want to look at a rolling function then. https://towardsdatascience.com/window-functions-in-pandas-eaece0421f7
If you're trying to do something like every 3 second (Hour:Minute:Second)
austere swift
gca not gcf
charred light
elfin heart
charred light
You might want to look at a rolling function then. <https://towardsdatascience.c...
Thanks^^
 summer kindle
eh super init seems useless
serene scaffold
summer kindle
eh super init seems useless
in general? or in what context?
serene scaffold
this is not about data science
summer kindle
k
serene scaffold
if you have a question about this code, go to #1035199133436354600
serene scaffold
it's quite likely that someone would help you, but as you will.
copper mica
steady basalt
<@1009214289527177226> https://arxiv.org/pdf/2209.00796.pdf
thanks a lot 🙂
 covert wigeon
Hi. I'd like to know how can I put the legend along the line?
 sonic stratus
I'm a student interested in Computer Vision... I have some clarifications
Can I give false images in training image-set so as to get rid of potential false recognition? Can I give an empty label file with a false image to make them as false recognitions?
 whole jungle
Can someone give me an ELI5 what is data science and how is it different from statistics?
wooden sail
whole jungle
Can someone give me an ELI5 what is data science and how is it different from st...
not really different, just "more". you do indeed so a large amount of stats, but also other things as well
math from other fields, scientific computing, writing efficient code and pipelines, and using experience/expertise from the field the data comes from
lapis sequoia
guess what
'
 hasty token
I have created a ml model for skin disease detection . The dataset I am using is HAM10000 it has 7 types of disease but doesn't have data for normal skin without any disease so is there a way for me to train the model for normal skin in my already trained model?
 celest timber
Hi there
I consider, if it is possible to transform an entire codebase from one language into another.
The source codebase is about 15 million LOC, written in pretty strictly regulated, C-like C++
The codebase is pretty uniform, so there are not a lot of outliners, in terms of style, and used features, etc.
The target language is Nim, which compiles to C/C++, if that makes any difference for the thought process.
So, I understand that there needs to be a basemodel, that is already trained on at least C++ and Nim, and probably on other languages as well.
Does anyone know one, that is public?
 steel tapir
Anyone here scraped social media websites successfully?
Whats best, scrapy, selenium or a mix of both?
hollow citrus
Hey, does anyone know if I can use a model.joblib file with a docker image, and if so, would you be able to point me to a website or resource where I can learn more about this?
I want to make an image and then mount a model.joblib to it so that I can update the joblib file without affecting the image
Or is this completely the wrong place to ask this...
dusty valve
https://github.com/HRLO77/snake-ai I made a reinforcement learning algorithm that plays snake, here's how it progressed through training
misty flint
hollow citrus
eh its not completely wrong but youll probs get more people with docker experience in #tools-and-devops 
im also not sure about your question. mainly this part:
update the joblib file without affecting the image
you can think of the docker image as a blueprint for the docker container. im assuming you have a separate script to update the joblib file.
hasty mountain
dusty valve
https://github.com/HRLO77/snake-ai I made a reinforcement learning algorithm tha...
How does the optimization works?
Is it through backpropagation?
serene scaffold
copper mica
I'm starting to question the benefit of speed reading
I think it's doubtful that one can "speed read" without a drop in comprehension
copper mica
Yeah I just feel insecure when people tlel me they can read 1000 wpm
But again, are they reading technical content...
Are they reading chalenging material... doubtful
hollow citrus
misty flint
im also not sure about your question. mainly this part:
> update the joblib file...
Like I want to find a way to update the joblib file, on my local machine and then not have to re-make the image or push a new version. So that updating the joblib file doesnt affect the image. I am just learning right now so the image is not for anyone else. I just want to see if that is possible
I will try the channel
misty flint
hollow citrus
Like I want to find a way to update the joblib file, on my local machine and the...
that should be possible for your local machine. just know that the old docker image (if you have the old joblib file) wont be updated since it is essentially in a separate environment.
the purpose of docker is solve the problem of "it works on my machine. how come it doesnt work on yours?".
at least thats one of the issues it solves. others feel free to jump in with more examples.
hollow citrus
I dont want to update/modify the image at all, the image will have the app runner file, I will just have the joblib file mounted and update the model file from time to time. Thats what I am thinking for now. Not sure how distribution would work with this


 zenith plover
Hi guys, I need to set up a regression model for machine learning. I include the following library;
import statsmodels.api as sm
RuntimeError                              Traceback (most recent call last)
File __init__.pxd:943, in numpy.import_array()

RuntimeError: module compiled against API version 0xe but this version of numpy is 0xd

During handling of the above exception, another exception occurred:

ImportError                               Traceback (most recent call last)
Input In [2], in <cell line: 1>()
----> 1 import statsmodels.api as sm
how can i solve it?
 woven dawn
dusty valve
https://github.com/HRLO77/snake-ai I made a reinforcement learning algorithm tha...
woven dawn
dusty valve
https://github.com/HRLO77/snake-ai I made a reinforcement learning algorithm tha...
looks cool!
 fair lion
hi there whats up is there any one that knows how to set up cuda tenserflow GPU
 timid kiln
Is it considered 'bad form' to drop unneeded columns from a dataframe by simply reordering/reindexing with the desired list?
 dark basin
Hey guys. I'm having problems to understand this part of a code from my Udemy course (It's a KNN class), my questions are in the code.
def predict(self, X):
        y = np.zeros(len(X))
        for i,x in enumerate(X): # test points
            sl = SortedList() # stores (distance, class) tuples
            for j,xt in enumerate(self.X): # training points
                diff = x - xt
                d = diff.dot(diff)
                if len(sl) < self.k:

                   ** sl.add( (d, self.y[j]) )****  **(isn't the add() method suposed to take only one element? )****
                else:
                    if d < sl[-1][0]:
                        del sl[-1]
                        sl.add( (d, self.y[j]) )


            votes = {}
            **for _, v in sl:**  ****  (how this for loop works ? I'm confused since the teacher said this will only go through the classes (self.y[j] values), but also the d(distance) was added on the sl.)**
                **
                votes[v] = votes.get(v,0) + 1

            max_votes = 0
            max_votes_class = -1
            for v,count in iteritems(votes):
                if count > max_votes:
                    max_votes = count
                    max_votes_class = v
            y[i] = max_votes_class
        return y
@dark basin
From what I understand, the character _ can replace a variable if you don't feeling like coming up with a variable. In this case, it looks like it's replacing what typically would be the letter k, for example, for k,v in myDictionary: where k is the key and v are the values.
I can't help ya with the question about add tho. I'd have to run the code to see what it does. If I have some time I will.
I'm a bit of a beginner so I'd wait for a 2nd opinion...
dusty valve
hasty mountain
How does the optimization works?
I used the bellman equation with a greedy policy to update the qtable
and i didn't use any traditional in sense "models" (pyt or tf) It's essentially just an agent going through it's environment and updating a qtable
dusty valve
woven dawn
looks cool!
thanks!
hasty mountain
dusty valve
and i didn't use any traditional in sense "models" (pyt or tf) It's essentially ...
I see...so it isn't a neural network? No gradients, no weights...?
hasty mountain
Curious... I know the theory of Q-Learning, but I don't know how to actually apply it.
Maybe I'll try studying the code, then.
bold timber
Anyone can enlighten me on why multiplying Wxh and x1 in a hidden state is without adding bias?
 dark basin
timid kiln
<@1047924911055831140>
From what I understand, the character `_` can replace a ...
dark basin
timid kiln
<@1047924911055831140>
From what I understand, the character `_` can replace a ...
I guess that's it! Thanks man.
charred light
timid kiln
Is it considered 'bad form' to drop unneeded columns from a dataframe by simply ...
No, w/e works. Being explicit about columns you are keeping is better imo.
timid kiln
Is there a way to put multiple criteria in the following function?
df = df[df["status"].str.contains("On Hold", regex=False)==False]
I'm wanting to filter out "On Hold", "Completed", and "Canceled". Just looks silly to have three lines of code doing that.
serene scaffold
@timid kiln you should never do ==True or ==False. If something is already a bool, you don't need to do a comparison with a bool to keep having it as a bool.
That said, you could set regex to true and do a pattern that matches all three. But the question is, in those three cases, is that the whole value?
Like is "on hold" a substring of the value, or the whole thing?
timid kiln
I see. Thank you!
I'm using a little data validation to ensure the values in the dataframe are consistent.
So the field in question (do we call them fields in a dataframe?) would be one of the following:
Complete, Confirmed, Canceled, On Hold, High, In Progress
serene scaffold
"contains" is mainly for looking for substrings. Though it just happens that a whole string is a substring of itself.
timid kiln
What I had before was this, to filter out any project that we know isn't going to happen:
df_wedge_a=df_wedge_a[df_wedge_a["status"].str.contains("Complete")==False]
df_wedge_a=df_wedge_a[df_wedge_a["status"].str.contains("Canceled")==False]
df_wedge_a=df_wedge_a[df_wedge_a["status"].str.contains("On Hold")==False]
It would be easier to use isin
timid kiln
Just wondering if there's a "better" way to do this. Filter out all the rows that we don't want.
serene scaffold
!docs pandas.Series.isin
arctic wedgeBOT
Series.isin(values)```
Whether elements in Series are contained in values.

Return a boolean Series showing whether each element in the Series matches an element in the passed sequence of values exactly.(what's the trash can Reaction do?)
serene scaffold
Delete the message
timid kiln
OK, lemme look that up and I shall attempt to refine the code. Thanks!
serene scaffold
I'll come back in 20 minutes with the solution.
timid kiln
serene scaffold
I'll come back in 20 minutes with the solution.
This isn't the method you describe but, it appears to work:
df = df.loc[(df["status"] != "Completed") & (df["status"] != "Canceled") & (df["status"] != "On Hold")]
I'll see if I can still do it the way you suggested.
charred light
timid kiln
This isn't the method you describe but, it appears to work:
```py
df = df.loc[(d...
Please do, the solution above is making my eyes twitch.
timid kiln
It's really easy for me to read that tho...
charred light
timid kiln
Hang on I'm nearly there.
charred light
k
timid kiln
charred light
k
OK, this appears to work:
df = df.loc[~(df["status"].isin(["Completed", "Canceled", "On Hold"]))]
I just don't have that programmer eye to go "that looks icky". 😄 But this is easy to see what's happening as long as you understand that ~ indicates NOT
@serene scaffold OK my friend, I think I got it. Please check my work sir.
charred light
timid kiln
OK, this appears to work:
```py
df = df.loc[~(df["status"].isin(["Completed", "...
~ is negation, essentially the "opposite" of what's after it.
timid kiln
The little things one learns...
And of course I have to comment the crap out of it so I will remember what's going on when I look at it again in three weeks and go "how does this work???" 😄
Even better I think?
filtered: list = ['On Hold', 'Canceled', 'Complete']
df = df.loc[~(df["status"].isin([filtered]))]
Makes it easier to read. That's normally what I do for readability.
serene scaffold
timid kiln
Even better I think?
```py
filtered: list = ['On Hold', 'Canceled', 'Complete']
...
that was what I was going to suggest. though type annotations aren't really required for literals.
oh wow, I was 20 minutes on the dot. I'm so fucking punctual.
timid kiln
serene scaffold
that was what I was going to suggest. though type annotations aren't really requ...
You're correct of course and I feel a bit silly putting them in there but, at the same time, I feel like it's a good habit for a newbie like me.
serene scaffold
timid kiln
You're correct of course and I feel a bit silly putting them in there but, at th...
there's some truth to it. if you're making an annotation for a container type, be sure to say what's in it, like list[str]
timid kiln
Plus it lets the fancy color-coder thing in vscode show me if a method is available or not. 😄
serene scaffold
hmm. if VSCode's type checker is worth its salt, I should know that filtered is a list of strings with or without an annotation 😛
timid kiln
serene scaffold
there's some truth to it. if you're making an annotation for a container type, b...
Yep, except I found out a few days ago that, being stuck on python 3.8.x, that is no bueno apparently.
I think I'm running 3.10 for this script tho.
serene scaffold
timid kiln
Yep, except I found out a few days ago that, being stuck on python 3.8.x, that i...
you just have to do from __future__ import annotations as the first line.
also, if you do from __past__ import __future__, your code will work for all Python versions 😄
timid kiln
Really?? Oooooh, that's good. Thank you! I'm a very fastidious commenter.
"Python, please incorporate all future improvements into my code please and thank you."
serene scaffold
yep. it starts by making a time loop, and then ...
timid kiln
😄
timid kiln
serene scaffold
that was what I was going to suggest. though type annotations aren't really requ...
OK, so I tested this by adding a row to the dataframe with the status = Canceled and the list didn't work.
removed: list[str] = ['On Hold', 'Canceled', 'Complete']
But it worked when I manually entered 'Canceled'
df = df.loc[~(df["status"].isin(['Canceled']))]
I also tried:
removed: list[str] = [['On Hold'], ['Canceled'], ['Complete']]
But, still didn't work.
Thoughts?
serene scaffold
timid kiln
OK, so I tested this by adding a row to the dataframe with the status = Canceled...
I can figure it out if you show print(df.head().to_dict('list'))
timid kiln
serene scaffold
I can figure it out if you show `print(df.head().to_dict('list'))`
Here's probably the part you're looking for?
'status': ['Canceled', 'In Progress', 'In Progress', 'Confirmed', 'Confirmed']
I'm removing the company-related data atm. brb.
serene scaffold
timid kiln
Here's probably the part you're looking for?
`'status': ['Canceled', 'In Progres...
I'll just use this and make pseudo data. one moment.
timid kiln
serene scaffold
I'll just use this and make pseudo data. one moment.
Just take me a sec here.
serene scaffold
timid kiln
Just take me a sec here.
In [7]: df
Out[7]:
        status  foo
0     Canceled    5
1  In Progress    5
2  In Progress    5
3    Confirmed    5
4    Confirmed    5

In [8]: df.loc[df['status'].isin(['On Hold', 'Canceled', 'Complete'])]
Out[8]:
     status  foo
0  Canceled    5

In [9]: df.loc[~df['status'].isin(['On Hold', 'Canceled', 'Complete'])]
Out[9]:
        status  foo
1  In Progress    5
2  In Progress    5
3    Confirmed    5
4    Confirmed    5
is this not right?
timid kiln
I mean, that appears to have worked, but for whatever reason it's not working on mine?
Let me try it with out the list.
Yeah, using the name of a list in place of the items doesn't work.
serene scaffold
it shouldn't make a difference
In [13]: df.loc[~df['status'].isin(blah)]
Out[13]:
        status  foo
1  In Progress    5
2  In Progress    5
3    Confirmed    5
4    Confirmed    5

In [14]: df.loc[df['status'].isin(blah)]
Out[14]:
     status  foo
0  Canceled    5
I don't know.
removed: list[str] = ['On Hold', 'Canceled', 'Complete']
df = df.loc[~(df["status"].isin([removed]))]
Maybe my vscode is teh broke.
serene scaffold
[removed] is [['On Hold', 'Canceled', 'Complete']]
whereas removed is ['On Hold', 'Canceled', 'Complete']
see?
timid kiln
removed: list[str] = [['On Hold', 'Canceled', 'Complete']]
didn't make a difference 😦
Lemme double check things.
Oh I see what you're saying.
hang on
timid kiln
serene scaffold
see?
Yep, that was the issue. I am humbled by your knowledge of these things. 🙂
 rotund scarab
anyone here using JETBRAINS DATALORE ?
misty flint
 golden prism
even understood my ` prompt
golden prism
even understood my ` prompt
bruh i asked it about web assembly just now

then i asked how would you use rust to write wasm code


iirc chatgpt is a variant of openai's instructgpt which uses the new gpt 3.5 model
davinci-003
instead of 002
here is the article https://techcrunch.com/2022/12/01/while-anticipation-builds-for-gpt-4-openai-quietly-releases-gpt-3-5/

OpenAI has quietly released models based on GPT-3.5, an improved version of GPT-3 that's better at generating detailed text -- and poems.
delicate bay
Can somebody give me a bit of advice? I'm making a real time object detection project and I'm not sure whether to use yolo or teachable machine. Which of theese are faster and more accuarate teachable machine or yolo?
lapis sequoia
Quick question:
what is the difference between static and dynamic data types
 silver widget
Hi all.. This my result while I was tuning scale_pos_weight parameter of xgbclassifier. The data is Stroke prediction from kaggle; how do you choose the best parameter here? Should I worry about mis-classifying healthy individuals or should I sacrifice a bit of TP in terms of not to predict healthy as having a stroke?
 delicate bay
active chat
hollow citrus
"Life"
 latent dirge
I have a pandas dataframe where one row has duplicate values spread across several columns, like this ```python
1 2 3 4 5 8
0 Semifinals Semifinals Semifinals Semifinals Semifinals Final
2 1 Ashleigh Barty 6 6 NaN NaN
3 1 Ashleigh Barty 6 6 NaN NaN
4 5 Iga Świątek 2 4 NaN NaN
5 5 Iga Świątek 2 4 NaN 1
9 10 11 12
0 Final Final Final Final
2 NaN NaN NaN NaN
3 NaN NaN NaN NaN
4 NaN NaN NaN NaN
5 Ashleigh Barty 6 6 NaN
how do I get two tables out of it, separated by unique values in the first row? one table with all columns containing "semifinals" and one table with all columns containing "final"? frozen nymph
def loss(constraint, output):
    """constraints: upper tri matrix (torch.sparse)"""
    choices = torch.argmax(output, dim=1).type(torch.float64).requires_grad_(True)
    choices = torch.logical_and(choices, choices.view(-1, 1)).type(torch.float64)
    choices = choices.to_sparse()
    _loss = torch.sparse.sum(torch.mul(choices, constraint)).requires_grad_(True)
    return _loss
anybody can tell me why I lose my gradient? output is the output from my pytorch model
austere swift
frozen nymph
```python
def loss(constraint, output):
"""constraints: upper tri matrix (to...
you can't get gradients for discretized values (such as the binary values outputted from logical_and)
you can only have gradients when you have continuous values
 grim rampart
hello
I wanna start to learn AI. Can you give me any advice about daily plan of the day?
I mean, what type of programme should I follow?
What type of skills should I learn first?
 fallow hornet
Hello! I just want to share a tool that I made for ChatGPT:
https://github.com/mbroton/chatgpt-api
appreciate any feedback, feel free to use 🙂
GitHub
ChatGPT HTTP API Client. Contribute to mbroton/chatgpt-api development by creating an account on GitHub.
misty flint
fallow hornet
Hello! I just want to share a tool that I made for ChatGPT:
https://github.com/m...
pretty neat! 
 hollow sentinel
i just used it to rephrase my paper 💀
plush jungle
I'm trying to code backpropagation from scratch, and I've mostly got it, but there's one big issue I'm running into
for the part of it where you have to use chain rule to propagate to the previous layers, it involves multiplication of the gradients
Neuron 1  -> neuron 2  -> neuron 3

                Neuron 3 gradient =         dE/dw3
        Neuron 2 gradient = dE/dw2 =        d3w/d2w * dE/dw3
Neuron 1 gradient = dE/dw1 =                d2w/d1w * d3w/d2w * dE/dw3
like this
this is fine if you're dealing with same shaped tensors
but my gradients are all different shapes
I've got:
1 output neuron, 3 weights
3 hidden layer neurons, 10,000 weights
even if I update 1 neuron at a time, my output layer gradient will be shape [3,] and my hidden layer gradient will be shape [10000,]
can you multiply different length vectors?
would it be dot product?
 agile aspen
hey there , i have this project where i should build my own file system from scratch , a DFS to be more specific , using the master client method , i did some researches and yet m still confused about the way i should start , if anyone ever worked on such a project , dm me i'll be so thankful
iron basalt
plush jungle
I'm trying to code backpropagation from scratch, and I've mostly got it, but the...
Do 1 layer again, but this time with two output neurons. Write the forward pass with plain old the loops, then the backward pass.
serene scaffold
agile aspen
hey there , i have this project where i should build my own file system from scr...
this doesn't sound like a data science/AI question
plush jungle
iron basalt
Do 1 layer again, but this time with two output neurons. Write the forward pass ...
why 2 output neurons?
iron basalt
plush jungle
why 2 output neurons?
Because it's more than one.
Which results in some math that will end up working with any number.
With one output neuron you have many-to-one in the forward, and one-to-many in the backward. With at least 2 you have many-to-many.
plush jungle
following your advice I rewrote my function entirely with loops
    def backpropagate(self, output, y):
        for i in range(len(output)-1,0,-1):
            x = output[i-1]
            for neuron in range(len(self.layers[i-1].weights)):
                gradient = np.zeros(len(self.layers[i-1].weights[neuron]))
                for weight in range(len(self.layers[i-1].weights[neuron])):
                    gradient[weight] = -((y  -output[i][neuron]) * output[i][neuron] * (1-output[i][neuron]) * x[weight])

                self.layers[i-1].weights[neuron] -= self.lr * gradient

                bias_gradient = -((y-output[i][neuron]) * output[i][neuron] * (1-output[i][neuron]))
self.layers[i-1].biases[neuron] -= self.lr * bias_gradient```but is it really necessary to switch to 2 output layers?
iron basalt
1 layer with 2 output neurons and multiple inputs is the most simple many-to-many case. So that you can study it and go from there.
A general strategy in problem solving is that when you are asked a hard question, you first ask yourself a more simple version of that same question and solve that first. Then using the understanding gained from that you try the harder version.
Here done in multiple layers (simplification): Multiple layer NN -> single layer NN -> single layer and only 1 output (you could go even further and only 1 input and 1 output).
Then go backwards (effectively doing dynamic programming ourselves (building solution from subproblems)).
agile aspen
serene scaffold
this doesn't sound like a data science/AI question
it is related to data science
iron basalt
iron basalt
Here done in multiple layers (simplification): Multiple layer NN -> single layer...
At each step, try writing it both as simple code and in mathematical form.
iron basalt
plush jungle
```py
def backpropagate(self, output, y):
for i in range(len(output)...
Consider first the forward pass with 1 layer and 2 output neurons, then write it mathematically like we did last time.
violet gull
what in the actual heck kind of training curve is this

 novel python
Hello everyone!
I'm trying to build a model that returns the probability of a client to use more data than a certain threshold in a month given a certain number of points. I have all the daily usage of more than 1000 clients over a month, so for example:
I want to know the probability of a client ending the month with an usage of over 5GB given the first 15 days of usage
How would you guys approach this problem? I still have no idea how to begij
 tropic matrix
I have data that i'm trying to train a regression model on, but I'm wondering how to determine the best architecture for such model. I've tried researching online but my results are inconclusive. For statistics that may be helpful:
7823 input nodes
1 output node
200k samples are available (well actually much more is available, 200k is just how much i've already tested and am sure works perfectly fine)
all data has been standardized (both input and output) using sklearn StandardScaler (ik I need this for my output as it doesn't follow a gaussian distribution, but if i needed to do this for my input i am not sure)
Any help will be appreciated
bold timber
Hello guys, whether in GRU layers each word/token will have 64 vector dimensions?
 charred light
tropic matrix
I have data that i'm trying to train a regression model on, but I'm wondering ho...
charred light
tropic matrix
I have data that i'm trying to train a regression model on, but I'm wondering ho...
You should start with what problem your trying to solve in the first place.
tropic matrix
charred light
You should start with what problem your trying to solve in the first place.
regression like i stated, unless that is not what you mean
charred light
tropic matrix
regression like i stated, unless that is not what you mean
Regression only means that you are predicting a numeric value.
charred light
novel python
Hello everyone!
I'm trying to build a model that returns the probability of a ...
If you have a rate, you could use poisson distribution. Otherwise, you can just predict the final usage amount with a regression model given the data you have at day 15.
tropic matrix
charred light
Regression only means that you are predicting a numeric value.
that is my goal, but I am trying to understand what you mean by "what problem I'm trying to solve", can you elaborate or at least give an example?
charred light
tropic matrix
that is my goal, but I am trying to understand what you mean by "what problem I'...
Regression models are prevalent in machine learning, and regression analysis is the most often used technique for problem solving.
tropic matrix
charred light
https://www.analyticsvidhya.com/blog/2022/01/different-types-of-regression-model...
from those it seems that polynomial regression is what i need, as there is no linear connection between the input and output that i've found in my analysis on the data
misty flint

Engraved
Unless you have been living under a rock, you have heard of this new ChatGPT assistant made by OpenAI. Did you know, that you can run a whole virtual machine inside of ChatGPT?
this is absolutely wild
@signal lintel i know you dont like ML but look at this fake VM 

 signal lintel
misty flint
<@370435997974134785> i know you dont like ML but look at this fake VM <:kekHand...
signal lintel
misty flint
<@370435997974134785> i know you dont like ML but look at this fake VM <:kekHand...

Ars Technica
ChatGPT-generated command line can create virtual files, execute code, play games.
signal lintel
misty flint
<@370435997974134785> i know you dont like ML but look at this fake VM <:kekHand...
Holodeck from Star Trek, soon.
 misty flint
signal lintel
https://arstechnica.com/information-technology/2022/12/openais-new-chatbot-can-h...
misty flint
signal lintel
https://arstechnica.com/information-technology/2022/12/openais-new-chatbot-can-h...
wild. its also wild it can act as a code compiler lmao

 fossil karma
Hi everyone i need help please

i am trying to install face-recognition and am using the anaconda interpreter in pycharm
wooden sail
anaconda is not an interpreter. if you have anaconda, you can install packages with the conda command. alternatively, you can specify your python flavor before pip. try py -m pip install [module]
serene scaffold
wooden sail
anaconda is not an interpreter. if you have anaconda, you can install packages w...
pycharm lets you pick anaconda as your environment
serene scaffold
fossil karma
i am trying to install face-recognition and am using the anaconda interpreter in...
do you know why you're using anaconda instead of venv? in either case, are you installing it at the command line, or using the pycharm UI?
fossil karma
ok bro i have linked the conda environment with pycharm @wooden sail what do you suggest i do
wooden sail
try the options i mentioned from the pycharm terminal
fossil karma
@serene scaffold am installing it at the pycharm terminal
wooden sail
conda install -c conda-forge face_recognition
or
py -m pip install face-recognition
(the underscore for conda is not a typo)
serene scaffold
what do you think about anaconda, Edd?
wooden sail
i think it's good in many cases. if you need it, you know
getting scientific computing libs is essentially impossible without it in many cases
fossil karma
@serene scaffold maybe am wrong guys to use the conda environment please correct me but i found it kind fit for this work
wooden sail
it's fine, i use it for this stuff as well
fossil karma
wooden sail
```
conda install -c conda-forge face_recognition
```
or
```
py -m pip install f...
let me try that command
wooden sail
especially for things like computing, it brings libs with special optimizations
serene scaffold
I worked in academia for two years, and now I'm a year and a half in industry, and I've never been in a situation where I'd benefit from using it. so I don't really get why some people in this space treat it as the default assumption.
wooden sail
about 10 years ago, it was the only reliable way of using numpy. that alone made it well established
but now, for example, in older raspberry os's, it's the only easy way to get things like numba
serene scaffold
I agree. but ten years is like 100 years for programming
wooden sail
it's also the easiest way to install AI libs without having to fish out all deps by hand
fossil karma
@wooden sail i ran the command still getting this error
 serene scaffold
wooden sail
it's also the easiest way to install AI libs without having to fish out all deps...
serene scaffold
wooden sail
it's also the easiest way to install AI libs without having to fish out all deps...
this is the problem that people say they have, but which I have somehow managed to avoid all this time.
wooden sail
just yesterday i had to set up miniforge, a spin of anaconda using conda-forge channels by default, to numba up some code on a raspberry 3
fossil karma
@serene scaffold brother what do you suggest in this situation
wooden sail
didn't wanna spend hours building from source
misty flint
oof
serene scaffold
I've never used a raspberry. if anaconda helped you, I guess that's great
wooden sail
try conda install -c conda-forge dlib alone and see if it gives the same error (probably yes)
ah, also pip has historically been really bad until rather recently
conda's dependency resolution is pretty decent
tl;dr a lot of it is historical artifact by now, but there ARE cases where you can't (painlessly) find pre-builts for the system you want outside of conda
that includes numpy with intel MKL, which is a boon
fossil karma
wooden sail
try ```conda install -c conda-forge dlib``` alone and see if it gives the same e...
ok bro let me start the anaconda prompt
wooden sail
you shuld be able to do it from the pycharm terminal
fossil karma
@wooden sail this what i go through when i try it

@wooden sail i chose conda environment 3.8 , well i started with 3.9 then 3.8 i thought maybe the version had a hand in this
wooden sail
that shouldn't make much of a difference
you did that on the pycharm terminal?
with the conda environment activated?
fossil karma
@wooden sail i did that on the pycharm terminal , with the conda environment added as an interpreter , the only program running is pycharm
wooden sail
in that case, no idea
plush jungle
@iron basalt I've been trying the stuff you said but I still don't understand how the chain rule part can work if the vectors are different lengths
 acoustic otter
hello, I'm new to machine learning and would like to get help on how I can start with it please
plush jungle
acoustic otter
hello, I'm new to machine learning and would like to get help on how I can start...
machine learning is a big topic. what sort of stuff are you interested in?
fossil karma
@wooden sail looks like i didnt include anaconda in PATH during installation how do i specify it in PATH
acoustic otter
plush jungle
machine learning is a big topic. what sort of stuff are you interested in?
image processing mostly
plush jungle
acoustic otter
image processing mostly
are you familiar with CNNs?
acoustic otter
mm not really
plush jungle
CNNs (Convolutional Neural Networks) are huge in image processing. they do classification, object tracking, bounding box drawing, and mask segmentation
are you familiar with neural networks?
acoustic otter
Like the concept of it? I've studied a little about it
but you can basically count me as ground zero honestly
plush jungle
ok well with a vanilla neural network, say you wanted to classify an image as a cat or a dog. you would first take all the pixel values in the image and put them in a huge vector, then pass that vector the the first layer of neurons
then that layer would output to the next layer and so on, and the last layer would output a scalar value representing dog/cat, like 0 being dog and 1 being cat
this works fine on something like the MNIST dataset, where it's all handwritten digits of about the same size, and they're all really low resolution
but it completely falls apart if you have some images where the dog is in the foreground and some where the dog is in the background, cause it'll be different sizes
it's also really slow to train on high resolution images
acoustic otter
oh. so would that be a good point to start on?
plush jungle
yes. my advice would be first watch this 3blue1brown video on neural networks, then actually train one yourself in pytorch or tensorflow on the mnist dataset
acoustic otter
i just so happen to have watched the same video already lol
acoustic otter
so should I try some tutorials on CNN?
would that be a good starting point
oh wait you said tensorflow already
alright, will do ty
plush jungle
acoustic otter
so should I try some tutorials on CNN?
CNNs are a little more complicated and convolutions are hard to wrap your head around. I would recommend first completely understanding vanilla neural nets and how they work, piece by piece
once you have one of those working, by all means, start looking into CNN stuff
acoustic otter
oh alright
 hybrid turtle
hello i need a little help with something to do with beautiful soup
is this the right place for that
plush jungle
sure thing
hybrid turtle
Basically all im trying to do is turn a list into a sentence
right now my results look like this
 proper pier
hi all, i created a random forest model to do predictions on a dataset. The dependent values are label encoded to be 0 and 1 but the prediction spits out decimal values, is there a reason for this?
hybrid turtle
well i cant post it actually.
anyways if you can help me please just dm me and im gonna try another chat for this
proper pier
is it a list of words?
iron basalt
plush jungle
<@119925597395877889> I've been trying the stuff you said but I still don't unde...
What does your forward pass look like mathematically with 2 output neurons?
hybrid turtle
yes
('comments', 10), ('posted', 8),
looks like this, I want to combine it to look like 'comments posted'
@proper pier
plush jungle
iron basalt
What does your forward pass look like mathematically with 2 output neurons?
for each output neuron:
     output = sigmoid(sum from 1-num_weights of ( input * weight ) + bias)
Can you write it with linear algebra?
(Maybe with latex)
plush jungle
iron basalt
Can you write it with linear algebra?
well i guess if there's 2 hidden layer neurons, the input would become a 2x1 vector and it would be
output_vector = sigmoid(dot_product(weights_vector * input_vector) + bias_vector)```I don't know how to use latex syntax
iron basalt
plush jungle
```
for each output neuron:
output = sigmoid(sum from 1-num_weights of ( in...
Without the for loop, just the inner part you have this:
.latex $$o=\sigma(\sum_i{x_iw_i}+b)$$
strange elbowBOT
 hybrid turtle
print (word_count.most_common) generates the most common words as a list and i want to turn the list into a sentence basically
iron basalt
plush jungle
well i guess if there's 2 hidden layer neurons, the input would become a 2x1 vec...
.latex $$o=\sigma(\textbf{x}\cdot\textbf{w}+b)$$
strange elbowBOT
 plush jungle
strange elbow
plush jungle
strange elbow
ok that looks like linear algebra
iron basalt
So now adding the for loop. How would that change this?
You are computing multiple o's with the for loop.
plush jungle
iron basalt
So now adding the for loop. How would that change this?
would you use a for loop? wouldn't all the scalar values just become vectors?
iron basalt
plush jungle
would you use a for loop? wouldn't all the scalar values just become vectors?
Well yes, but kind of skipping this little in between step.
Noticed how we went from a sum with an index i to no index, it got absorbed into the notation.
plush jungle
right
iron basalt
The loops add the indices.
So now for multiple outputs, you can add an index.
Computing o_i.
.latex $$o_i=\sigma(\textbf{x}\cdot\textbf{w}_i+b_i)$$
strange elbowBOT
 iron basalt
Each output neuron has its own set of weights and 1 bias. Hence the index subscript on w.
plush jungle
ok that makes sense
iron basalt
Now one slight change here, let's just treat every vector in this as a matrix with 1 column.
The vector dot product can be written as a matrix product.
.latex $$o_i=\sigma(\textbf{x}^T\textbf{w}_i+b_i)$$
strange elbowBOT
 plush jungle
I'm a little rusty on linear algebra. Is there a difference between a vector dot product and a matrix dot product? isn't it the same operation?
strange elbowBOT
 iron basalt
plush jungle
I'm a little rusty on linear algebra. Is there a difference between a vector do...
iron basalt
plush jungle
I'm a little rusty on linear algebra. Is there a difference between a vector do...
 iron basalt
wooden sail
just as a hint, i think i had bm added to the latex header
iron basalt
wooden sail
just as a hint, i think i had bm added to the latex header
Thx.
Basically, matrix product is like doing multiple dot products.
(And outer products* but more on that later)
 hoary wigeon
hey guys a quick question!
on clustering
Do we need to delete the duplicate datapoints while training clusters?
plush jungle
ok but tie this into backpropagation. it's the backpropagation I'm struggling with
iron basalt
plush jungle
ok but tie this into backpropagation. it's the backpropagation I'm struggling w...
It will, we are doing this rewrite for that to make sense. Preparation.
 supple copper
Is there a where to start kind of section, similar to what we have for vanilla python on this server. Specially for people who have no background in mathematics and statistics?
iron basalt
plush jungle
ok but tie this into backpropagation. it's the backpropagation I'm struggling w...
So notice how we are doing multiple dot products, one for each output neuron and each output neuron has its own weight vector.
Multiple dot products can also be done via matrix multiplication.
So we can absorb the index i into the notation again (1 level higher again).
plush jungle
ok
iron basalt
.latex $$\bm{o}=\sigma(W^T\bm{x}+\bm{b})$$
strange elbowBOT
 iron basalt
We now have an output vector (absorbing the index i), and the weight vector is now a weight matrix (absorbing the index i), same for the bias.
plush jungle
following so far
iron basalt
So one key thing before going further is to notice that when going forward we kind of collapse things. For example in the case with 1 output neuron we went from many-to-one, with an input vector and an output scalar. The dot product sort of crunches down many things into one.
So intuitively when going backwards we would have to do the opposite, we need some operation that expands / goes from one-to-many.
A sort of opposite of a dot product.
plush jungle
ok
iron basalt
With 1 output we did this by multiplying the 1 output's error with all the inputs.
So it kind of goes from 1 to many.
plush jungle
yeah