#data-science-and-ml
1 messages · Page 32 of 1
 serene scaffold
 weary crown
serene scaffold
greyscale. your model doesn't expect color channels. (RGB values require an extr...
weary crown
serene scaffold
greyscale. your model doesn't expect color channels. (RGB values require an extr...
right rgb is like 3 channels in cnn
@serene scaffold what is L btw
serene scaffold
weary crown
<@253696366952316929> what is L btw
idk, I had to look it up, and then I forgot.
weary crown
img = Image.fromarray(canvas_result.image_data.astype('uint8'), "L")``` got from docs; is it greyscale?I have never used pillow before this btw.
weary crown
me neither, well, barely
@serene scaffold what does 1- do when u sent ur code above
img = Image.fromarray(canvas_result.image_data.astype('uint8'), "L")

    # preprocess image
    img = img.resize((28, 28))
    img = np.array(img)
    img = img.reshape(1, 28, 28)
    img = img.astype('float32')
img /= 255``` how would i preprocess this correctly 😦because my numbers start like this, and the white background has a value of 255, whereas we want it to be treated as empty space (0).
 weary crown
so how do i add that here since Image.fromarray(stuff) is a a numpy array
serene scaffold
weary crown
so how do i add that here since Image.fromarray(stuff) is a a numpy array
the screenshot I just showed you is my seven.png, and this is the whole thing that I do to load it as an array: 1 - (np.asarray(Image.open("./seven.png").convert("L").resize((28, 28))) / 255)
which I defined as seven. and then the only other thing I did was model.predict(seven[None, :, :]).argmax()
weary crown
we arent using pngs tho i need to figure out how to do this with the array solely
which is possibly messed up still
gosh i hate hackathons
im so bad at this shit
serene scaffold
I only tried a hackathon once, and after 12 hours I said "fuck this shit" and went home.
weary crown
this is emerso and i's first one
serene scaffold
try to figure out what type canvas_result.image_data.astype('uint8') is
I guess it's probably an array
weary crown
huh

numpy is just the shittiest library ever
whoever made it was really on some good LSD
serene scaffold
try this
img = (
    Image.fromarray(canvas_result.image_data.astype('uint8'), 'RGB')
    .convert('L')
    .resize((28, 28))
    .reshape(1, 28, 28)
    .astype('uint8')
) / 255
might not work actually
serene scaffold
weary crown
numpy is just the shittiest library ever
I'm going to be honest with you: numpy is very widely used, and the problem is you.
weary crown
yeah i was jk im on copium rn
serene scaffold
and that error is from pillow, not numpy.
weary crown
I get an error with .reshape(), so i did .reshape(1, 28, 28, 1) which was working earlier but now it isnt 😦
serene scaffold
img = (
    Image.fromarray(canvas_result.image_data.astype('uint8'), 'RGB')
    .convert('L')
    .resize((28, 28))
)
img = np.asarray(img).reshape(1, 28, 28).astype('uint8') / 255
try that.
weary crown
@serene scaffold i keep getting really bad predictions like itll do it sometimes and get 13% confidence or otherwise i just keep getting 1
 brave sand
serene scaffold
```py
img = (
Image.fromarray(canvas_result.image_data.astype('uint8'), 'RGB...
brave sand
serene scaffold
```py
img = (
Image.fromarray(canvas_result.image_data.astype('uint8'), 'RGB...
does not work. I get an prediction of 0 every time.
brave sand
    img = (
        Image.fromarray(canvas_result.image_data.astype('uint8'), 'RGB')
        .convert('L')
        .resize((28, 28))
    )
    print(img)
    img = np.asarray(img).reshape(1, 28, 28).astype('uint8') / 255
    prediction = 1 - img
st.write("The digit is: ", prediction.argmax())```But we've verified that the training code is correct
brave sand
yes
serene scaffold
brave sand
```py
img = (
Image.fromarray(canvas_result.image_data.astype('uint8...
You didn't actually make a prediction. You have to call model.predict
1 - img is still the image. Not a prediction.
weary crown
sry its 10 pm here we're braindead
serene scaffold
Were you not calling model.predict all along?
weary crown
yes we have been
serene scaffold
Oh
weary crown
if st.button("Predict"):
    img = (
        Image.fromarray(canvas_result.image_data.astype('uint8'), 'RGB')
        .convert('L')
        .resize((28, 28))
    )
    img = np.asarray(img).reshape(1, 28, 28).astype('uint8') / 255

    # predict digit
    prediction = predict_img(img)


    st.write("The digit is: ", prediction.argmax())
    st.write("The probability is: ", prediction.max())
wait we havent
serene scaffold
Does it work now?
weary crown
def predict_img(img):
    model = pickle.load(open('model.pkl', 'rb'))

    # predict digit
    prediction = model.predict(img)
return prediction```That looks fine, albeit inefficient
weary crown
doesnt work tho 😦 just gives terrible predictions
serene scaffold

brave sand
@serene scaffold why does this not work?
if st.button("Predict"):
    model = pickle.load(open('model.pkl', 'rb'))

    # convert canvas content to png
    img = Image.fromarray(np.uint8(canvas_result.image_data))
    img.save('temp.png')

    # convert image to numpy array
    seven = 1 - (np.asarray(Image.open("./temp.png").convert("L").resize((28, 28))) / 255)

    prediction = model.predict(seven[None, :, :]).argmax()
    print(prediction)
    # display result
    st.write("Prediction: ", prediction)
 spiral peak
@jagged forum the bitly link is tripping our filters. Just use the full link to whatever you're linking to
 jagged forum
Hi everyone!
What does the quantity mean in this code?
# Transactions done in France basket_France = (data[data['Country'] =="France"] .groupby(['InvoiceNo', 'Description'])['Quantity'] .sum().unstack().reset_index().fillna(0) .set_index('InvoiceNo'))
I got this from https:/ /www.geeksforgeeks.org/implementing-apriori-algorithm-in-python/ while trying to learn unsupervised learning
Thanks @spiral peak
Also, this is what the data is

 light shell
years = [1924, 1928, 1932, 1932, 1933, 1933, 1935, 1938, 1953, 1955, 1961, 1961, 1967, 1969, 1971, 1977, 1979, 1980, 1988, 1989, 1992, 1998, 2003, 2004, 2005, 2005, 2005, 2005, 2007, 2007, 2016, 2017, 2017, 2018]
Could someone let me know why this code only adds one item/year only to the new dictionary? (Sorry if I am posting in the wrong group chat, I didn't really see one with beginner stuff)

 dusk tide
I am doing a project of transfer learning on Google colab and while executing the code an error comes " session expired. You have run out of ram. " And it says to buy colab pro which is 10$ / month. But I cannot afford money. What else can I do??
 lapis sequoia
@dusk tide see if your computer graphics card supports cuda and run it from terminal?
batch your inputs?
 south sundial
does anyone have any good tutorials or stuff to get started with making a chatbot? Tried a tutorial but the source code i was following was full of errors? Please ping reply
lapis sequoia
new_df = df_homicide[df_homicide['Crime Solved']=='No'].dropna(subset=['Victim Sex', 'Victim Race', 'Weapon'])
I want to drop the rows that are unsolved AND have na in in either of those 3 variables.
When I print new_df however, it only has unsolved cases or rows with Crime Solved == 'No'
does anyone know how I can drop those rows and but not filter the rows to Crime Solved =='No'
 mint palm
How are pretrained weights utilised when models are different?
I was reading a transformer based research paper, they say they have used weights of ImageNet.
 merry pike
hello
can You try the new features of our project and get the odds for the results of the World Cup matches
app web Deployment link: https://world-cup-2022-predictions.herokuapp.com/
GitHub link: https://github.com/Omaraitbenhaddi/ODC-World-Cup-2022-Predictions

GitHub
Predict who will win the FIFA World Cup 2022 . Contribute to Omaraitbenhaddi/ODC-World-Cup-2022-Predictions development by creating an account on GitHub.
 fresh igloo
Hi there, Can anyone point me on how to process the time series data?
 cursive flint
hi guys
its my frist time here and i want to start my journey in the field of data science so can you suggest me how?
im totally new to programming
serene scaffold
cursive flint
its my frist time here and i want to start my journey in the field of data scien...
A few things to keep in mind as you start:
- people study for years before they can start a career in this space. and a degree is virtually required.
- data science is mostly about your theoretical knowledge of data science, and not your programming ability. "learn by doing" is not a viable strategy by itself.
I was going to add that "learning libraries" is not a viable strategy either, but if you're totally new to programming, I guess you don't know what those are
Anyway, I recommend "data science from scratch", which is on our resources page.
!resources data science
 arctic wedgeBOT
Resources
The Resources page on our website contains a list of hand-selected learning resources that we regularly recommend to both beginners and experts.
 hasty mountain
serene scaffold
A few things to keep in mind as you start:
1) people study for years before they...
hasty mountain
serene scaffold
A few things to keep in mind as you start:
1) people study for years before they...
virtually required?
serene scaffold
hasty mountain
*virtually required*?
what part do you find confusing?
hasty mountain
What does it mean to be virtually required?
serene scaffold
hasty mountain
What does it mean to be *virtually* required?
"almost entirely required"
 hasty mountain
serene scaffold
"almost entirely required"
hasty mountain
serene scaffold
"almost entirely required"
Can I try to avoid this if I take part in research projects that involves algorithms and data science?
Uh, I mean...research projects in the area of programming, computer science...
serene scaffold
hasty mountain
Can I try to avoid this if I take part in research projects that involves algori...
you probably won't be able to take part in meaningful research projects unless you're with a university.
serene scaffold
but you're not getting a degree?
hasty mountain
Not in computer sciences/programming in general
serene scaffold
it would be more helpful to say what degree you are getting, not which ones you aren't
hasty mountain
serene scaffold
it would be more helpful to say what degree you *are* getting, not which ones yo...
Uh... Medicine
serene scaffold
hasty mountain
Uh... Medicine
well, many of my coworkers have STEM degrees that are not CS. so if you have a degree in medicine and have contributed to AI research with your university that is related to medicine, then you would probably be a competitive applicant for AI developer positions.
hasty mountain
Nice!
I was trying to get an internship, but it seems that this way would be easier for me to have AI developer as a career option
hasty mountain
serene scaffold
well, many of my coworkers have STEM degrees that are not CS. so if you have a d...
Also... Medicine in STEM = Health Sciences, right?
In my country we don't have a definition like STEM
serene scaffold
hasty mountain
Also... Medicine in STEM = Health Sciences, right?
STEM is just "science technology engineering mathematics". it's not a formal category.
medicine would count as that.
hasty mountain
Ok, thanks!
 uneven mango
 bright pasture
I'm trying to train a voice model, and I can't seem to train it without running into a CUDA error.
RuntimeError: CUDA out of memory. Tried to allocate 2.15 GiB (GPU 0; 24.00 GiB total capacity; 17.20 GiB already allocated; 0 bytes free; 22.64 GiB reserved in total by PyTorch) If reserved memory is >> allocated memory try setting max_split_size_mb to avoid fragmentation. See documentation for Memory Management and PYTORCH_CUDA_ALLOC_CONF
serene scaffold
bright pasture
I'm trying to train a voice model, and I can't seem to train it without running ...
Do you understand what the error message is telling you?
bright pasture
serene scaffold
Do you understand what the error message is telling you?
Not... really? The advice to set "max_split_size_mb" is confusing. Where do I go to do it, what do I do with everything else?
serene scaffold
bright pasture
Not... really? The advice to set "max_split_size_mb" is confusing. Where do I go...
You're using up all the space (ie memory) on the GPU. And there is simply no way to use more memory at once than exists on the GPU, but you might be able to use the space more efficiently (probably at the cost of training speed)
If you're doing something that involves batch sizes, try decreasing the size
bright pasture
serene scaffold
If you're doing something that involves batch sizes, try decreasing the size
You mean something like max_sentences?
bright pasture
bright pasture
You mean something like max_sentences?
Or learning rate?
serene scaffold
bright pasture
You mean something like max_sentences?
not the learning rate--learning rate has no effect on how much memory you're using.
I have no idea what max_sentences is in the context of what you're doing. that's information that you have to provide.
bright pasture
serene scaffold
not the learning rate--learning rate has no effect on how much memory you're usi...
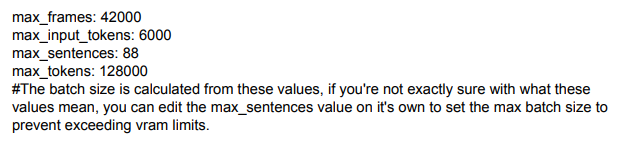 serene scaffold
bright pasture
https://i.imgur.com/vjFJ7EN.png
serene scaffold
bright pasture
https://i.imgur.com/vjFJ7EN.png
please always give text as actual text, not a screenshot. but yes, the comment part at the bottom says that these values determines the batch size. so try decreasing it.
"vram" probably means "virtual ram", which is what you're running out of on the GPU.
A larger batch size means that more data is going through the model at a time, and more data means more memory being used at once. so you can lower it, at the cost of a slower training speed.
 twilit pumice
@serene scaffold How much experience do you have in ML?
serene scaffold
twilit pumice
<@253696366952316929> How much experience do you have in ML?
I have a bachelors degree in CS, I'm the primary author on a paper about NLP, and I've worked in the AI department of my company for about a year and a half. I still have a lot to learn.
twilit pumice
Okay that about sums it up, i wanted to ask how much math do you use in your field and what math is it that you mostly use?
serene scaffold
twilit pumice
Okay that about sums it up, i wanted to ask how much math do you use in your fie...
I don't spend all day doing calculations by hand, but you need to understand probability, statistics, linear algebra, and calculus to understand ML.
bright pasture
serene scaffold
please always give text as actual text, not a screenshot. but yes, the comment p...
So I set it a bit lower, and now I get this error...
OSError: [WinError 1455] The paging file is too small for this operation to complete. Error loading "C:\Users\phill\AppData\Local\Programs\Python\Python310\lib\site-packages\torch\lib\cudnn_adv_infer64_8.dll" or one of its dependencies.
twilit pumice
serene scaffold
I don't spend all day doing calculations by hand, but you need to understand pro...
It would be great if you could take a peek in #career-advice and maybe voice your opinion as for what may be the right choice for me...
serene scaffold
bright pasture
So I set it a bit lower, and now I get this error...
```OSError: [WinError 1455...
I'm not sure what to do
 mild wedge
If I require help with something related to data-science and ai do I post in a help channel or here?
serene scaffold
@twilit pumice looks like the conversation has been going for a while. can you sum up what your current question is?
serene scaffold
mild wedge
If I require help with something related to data-science and ai do I post in a h...
either.
mild wedge
I have a question about MATPLOTLIB
how to I modify my plot so that the axis scale goes at least as high as my largest data point? Currently my Y-axis stops at 0.4 despite it going as high as 0.46 I would like it to stop at 0.5
I tried switching the scale to log on the Y axis as my range is pretty large (from -0.0009 to 0.46) but it then doesn't allow me to label my markers with the regularisation parameter as np.log does not allow handling of logs of negative numbers. When I try to label markers when using a log scale y-axis I get 'ValueError: Image size pixels is too large'.
Also when in the log scale it does not display all my results - omitting the markers where the number of non-zero features is 0.


 unreal charm
Hi, I have untypical question.
I'm on a 3rd year of cognitive studies and I want to write a Bachelor degree with AI, nlp, ml, something with chat bots I think.
The question is, do You have any ideas or suggestions? I need a strict subject, goal and title of my work
twilit pumice
serene scaffold
<@111170235259699200> looks like the conversation has been going for a while. ca...
As i currently have an interest in ML should i attempt getting a degree in CS, or CE. Both cover the level of mathematics that you just mentioned. CS degree is on a mathematical faculty and the amount of math they demand is a lot compared to CE degree, Linear Algebra-Analytic Geometry, Discrete Mathematics 1/2, Mathematical Analysis 1/2/3, Geometry, Algebra 1, Probability, Statistics,... Is this worth it for me in the long run?
 mighty patio
mild wedge
I have a question about MATPLOTLIB
how to I modify my plot so that the axis scal...
mighty patio
mild wedge
I have a question about MATPLOTLIB
how to I modify my plot so that the axis scal...
ax.set_ylim([min, max]) , why not use this to set the max to 0.5?
is the command for setting the limits on the y-axis
You cannot have 0 or negative values on the y-axis in a log plot, log(0) or log(negative number) is undefined. These values are therefore not included in the plot
serene scaffold
twilit pumice
As i currently have an interest in ML should i attempt getting a degree in CS, o...
if you want to work in ML professionally, you'd be better prepared by a CS degree. All of those math courses that you listed (except maybe geometry) would help you understand ML. And you should take courses that are specifically about ML.
twilit pumice
Mathematical Analysis is one of the subjects that really strike fear into me as i heard a lot of students fail years due to it
twilit pumice
serene scaffold
if you want to work in ML professionally, you'd be better prepared by a CS degre...
They don't have any courses that are ML, there is one course in AI that is in fourth year and its like an introductory course to ML... They expect to you to take a two year masters degree in ML after bachelor
 fallen crown
could you give me a good book to learn machine learning ?*
mighty patio
twilit pumice
Mathematical Analysis is one of the subjects that really strike fear into me as ...
How confident are you that you will not do the same? ML may sound exciting now but there is no guarantee you will feel the same way by the time you graduate.
If you are not confident in your math abilities, a math-heavy program might not be right for you.
On the other hand, if you are confident in your math abilities, then you should definitely leverage that to do well in a more difficult program.
Good grades are probably more important for your first job than exactly what program it was
serene scaffold
fallen crown
could you give me a good book to learn machine learning ?*
!resources data science
arctic wedgeBOT
Resources
The Resources page on our website contains a list of hand-selected learning resources that we regularly recommend to both beginners and experts.
serene scaffold
^ you can filter this for books only
serene scaffold
twilit pumice
They don't have any courses that are ML, there is one course in AI that is in fo...
if you want to work in ML, getting a masters degree would be a good idea anyway. I'm one of like two non-masters holders in my department, but I'm starting grad school in january.
twilit pumice
mighty patio
How confident are you that you will not do the same? ML may sound exciting now b...
My relationship with math is an odd one, elementary school was a horrible experience for me due to many reasons...., this led to me not being able to enlist into a high school that offers and requires a lot of math. But i have worked my way up from nothing to similar level that is required for enlistment into one of these two faculties....
serene scaffold
twilit pumice
My relationship with math is an odd one, elementary school was a horrible experi...
I didn't enjoy math for most of my compulsory education. do you still feel that you are "bad at math"?
twilit pumice
I dont think that i am "bad", certainly not a mathematical genius, but bad sounds too harsh. My current problems have more to do with procrastination than understanding of math itself or any other subject really. Due to its nature math requires a lot of repetition and practice, if there is something i have learned, its that discipline is key
mighty patio
In a math heavy program, you will spend more time doing math.
Do you procrastinate more or less when doing math than when doing programming?
mild wedge
mighty patio
`ax.set_ylim([min, max])` , why not use this to set the max to 0.5?
is the comma...
Thank you for your reply. Your solution worked. I am now using subplots which seem to be infinitely more useful that pyplot as is.
twilit pumice
I procrastinate whenever something makes me anxious, now i am already getting into my personal problems that well intertwine with my "professional" life, but to be honest its definitely more engaging to code than to do raw math on paper. I find it harder for myself to get distracted..
mighty patio
twilit pumice
I dont think that i am "bad", certainly not a mathematical genius, but bad sound...
I think you would be better served as being above-average in a program with less math, than below-average in a program that is math heavy.
Due to its nature math requires a lot of repetition and practice
This is a good attitude to have, however, be warned that at university you will meet people for whom this is not true.
twilit pumice
My current math professor got theoretical mathematics degree on mathematical faculty and then a masters in CS on Electrical engineering faculty, and then a PHD on the mathematical faculty... From what i read, guy was a mathematical prodigy in high school, went to a number of regional competitions. During bachelors his average score was like 9.64 and during masters 9.53
Like this is kind of people that you must be talking about...
serene scaffold
twilit pumice
Like this is kind of people that you must be talking about...
you don't have to be a """"prodigy"""" to be successful in this space
your current math professor obviously really likes math, and has for a long time. so it's entirely unsurprising that they wanted to be a math professor.
twilit pumice
What was your average grade during your CS course?
serene scaffold
About average
Though my undergrad was during covid and I was working retail at the same time.
mighty patio
twilit pumice
Like this is kind of people that you must be talking about...
my wife spent twice as much time studying for the math exams as I did, only to get worse grades
she then re-did all her exams to get better grades
It was not a fun time for her, but her motivation held.
My motivation was never tested in the same way.
I am trying to drive home this point, because I think in the end both options will be perfectly fine choices for you, but one may test your motivation more, and you have to be ready for that if you choose to go down that path.
twilit pumice
mighty patio
my wife spent twice as much time studying for the math exams as I did, only to g...
Thank you for your objective opinion, it really mattered to me!
bright pasture
Question, how much pre allocated amount should it be if I have a 3090 24 GB?
Right now by default it’s set to 64M
 desert oar
i see about the dataset, i see in the discussion page for the data set they don't really explain it either... weird but nothing you can do about it.
character n-grams are sequences of n characters (rather than words), where n is usually somewhere in the 2-5 range, or sometimes using a few different n values all together. it puts a lot less burden on your word splitting and text preprocessing, offloading that work to the model to find relevant character sequences. it can really help in a context where spelling and punctuation might be inconsistent
consider the made-up tweets "scotus oral arguments getting spicy" and "oral arguments in goldsmith warhol case today #scotus"
using words as features, you would have to do some text processing, and in more complicated cases some nontrivial entity resolution, to make sure that the feature "scotus" is always recognized as such
whereas with 3-grams you'd have the features #sc sco cot otu tus and sc sco cot otu tus. ideally, the model with learn to recognize the set of overlapping common features as relevant, and the features that differ as irrelevant noise
i have no idea what would cause such extreme overfitting, but this data set is simple enough that maybe i can block out some time to build my own model as a baseline, and from there maybe you could reproduce your problem
it's important to look at the distributions of features because you want to know what features are going to be important to the model
it's also often useful to look at the bivariate association between each feature and the target
more generally, it almost never hurts to engage in a deep exploration of the feature set. at worst, it's interesting but not particularly helpful, but at best it gives you new ideas and a sense of direction in building your model
i also like to do "post hoc" model analysis. in this case for example you could plot the vector embeddings learned by your model using tsne or umap, and color them by class, to see what kind of feature space the model has learned
bright pasture
desert oar
i see about the dataset, i see in the discussion page for the data set they don'...
Since you're a helper, can you help me with something?
desert oar
bright pasture
Since you're a helper, can you help me with something?
usually we encourage people to just ask their question and wait for someone to answer. helpers are all volunteers here and we can't guarantee that anyone will be available to answer any particular question
but i'm around for a few minutes and might be able to offer a quick answer
south sundial
Does anyone have any recommendations on where to start with chatbots?
bright pasture
desert oar
but i'm around for a few minutes and might be able to offer a quick answer
Okay, I keep getting too small paging files or CUDA out of memory errors, and I wanna know what are good steps to prevent these errors.
 trail fractal
does anyone know where i might be able to find a company's fiscal year end date?
desert oar
bright pasture
Okay, I keep getting too small paging files or CUDA out of memory errors, and I...
that i don't know, sorry
bright pasture
desert oar
that i don't know, sorry
Dang, that's alright, thank you for being honest at least.
 mild dirge
bright pasture
Okay, I keep getting too small paging files or CUDA out of memory errors, and I...
mild dirge
bright pasture
Okay, I keep getting too small paging files or CUDA out of memory errors, and I...
cuda out of memory is probably because your model/data requires too much memory
If you are loading all data at once, you might want to instead load it in batches
bright pasture
mild dirge
If you are loading all data at once, you might want to instead load it in batche...
Okay, how do I do that?
Load it in batches, I mean?
mild dirge
Well I would first check whether that is actually the case, first of all maybe check the size of your model
How many weights does it have?
bright pasture
mild dirge
How many weights does it have?
How do I check how many weights it has? In all, the binary files add up to 113 MB.
mild dirge
Of the saved model?
bright pasture
mild dirge
Of the saved model?
Oh no, I'm training something from binarized files, the model isn't made yet.
mild dirge
the binarized files are the data then?
bright pasture
mild dirge
the binarized files are the data then?
Yep.
mild dirge
Okay, well it might still be that it is compressed, and when you load it in it might be bigger
bright pasture
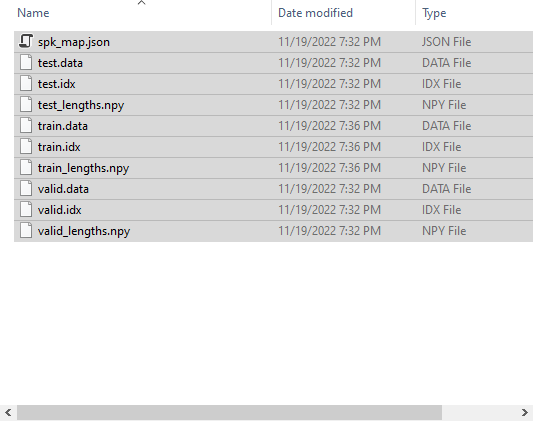 mild dirge
It seems like it's not images or anything, so probably it isn't too too big if it is in 1 file of a few megabytes
If you have not loaded in any model, then I don't know
desert oar
@bright pasture have you tried running batches of 1 data point at a time? just to see if that works
if you can't even run with 1 at a time, and each observation is on the order of a few megabytes, then maybe something else is wrong
bright pasture
mild dirge
It seems like it's not images or anything, so probably it isn't too too big if i...
Oh, it is running a model to help with Hifigan stuff. https://i.imgur.com/2P9BejP.png
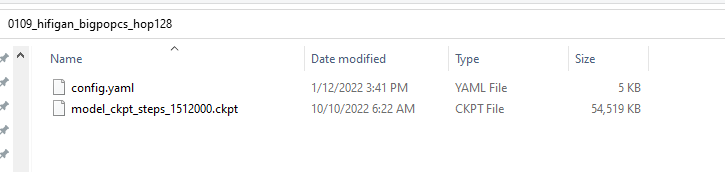 bright pasture
mild dirge
How many weights does it have?
bright pasture
mild dirge
How many weights does it have?
How do I check how many weights it has?
 rotund fractal
im working with a dataset that contains job descriptions and levels(internship,entry,senior)... i want to create/train a model to predict job levels based on descriptions, any tips on how to go about this?
bright pasture
mild dirge
If you are loading all data at once, you might want to instead load it in batche...
Again, how would I load the data in batches? Is there a way I can do this for any process I run?
mild dirge
You'd have to check the docs for whatever framework you are using
I don't know which one you use
But you don't have multiple files, so I don't know if you can even do that, or if it is even necessary
desert oar
rotund fractal
im working with a dataset that contains job descriptions and levels(internship,e...
there are a lot of resources out there for building classification models w/ text data. scroll up a few messages and you'll see an example of someone who built one, and my comments about their work.
bright pasture
mild dirge
You'd have to check the docs for whatever framework you are using
There are multiple frameworks?
mild dirge
Yeah I mean like tensorflow or keras or pytorch etc.
bright pasture
mild dirge
Yeah I mean like tensorflow or keras or pytorch etc.
Oh! I believe it's either tensorflow or Pytorch.
So, with that being said, what would be the ways for each to load them in batches?
 bold timber
Hello guys, now I'm working on food101 image classification that have 101 classes, but when I make a confusion matrix, the result is only on one class, which is an apple pie. Why did it happen?

this is my code for plotting the matrix

 dusty valve
bold timber
Hello guys, now I'm working on food101 image classification that have 101 classe...
dusty valve
bold timber
Hello guys, now I'm working on food101 image classification that have 101 classe...
I'm pretty sure there's a numpy function that does that
Like invert x and y
I forget though
mild dirge
bold timber
this is my code for plotting the matrix
Is it the case that it guessed apple pie for every input?
Is your data very class imbalanced?
bold timber
mild dirge
Is it the case that it guessed apple pie for every input?
the data have 250 images for each class (the dataset have 101 classes)
and the dataset is balanced
mild dirge
Alright, so not imbalanced then
But does it just guess apple pie for every input?
Trying to find out if the issue is the confusion matrix, or the model
bold timber
the data have 75,750 training images and 25,250 testing images.
mild dirge
mild dirge
But does it just guess apple pie for every input?
You should try find this out
See if the amount of input images per class match up with the counts in the confusion matrix
bold timber
mild dirge
You should try find this out
I think is not because the result of probability is like this

This means each image giving probability for all labels
mild dirge
Is every output of the model the same class?
I can't tell from that image
That just shows you have the correct amount of predictions
but not what the predictions are
bold timber
mild dirge
Is every output of the model the same class?
wait a minute, I want to re-run this model
mild dirge
And did you use that array together with the array of labels to make the confusion matrix?
bold timber
mild dirge
And did you use that array together with the array of labels to make the confusi...
wait wait
bold timber
mild dirge
And did you use that array together with the array of labels to make the confusi...
Yeah, all of y_labels is only get 0 values
do you know what is wrong with this code?
 bold timber
this is the value of the y_labels @mild dirge
 mild dirge
not y_labels
bold timber
all of value within that is 0

 soft badge
Guys, have you seen a guy who made an application using the stable diffusion api?
mild dirge
bold timber
sorry, my bad. this is the result of labels
Alright, so why do .numpy() on it and then argmax
It is already the integer representing the class
Just append that integer
bold timber
like this? @mild dirge
 mild dirge
? no
mild dirge
mild dirge
Alright, so why do .numpy() on it and then argmax
This exactly
y_labels.append(labels) (although labels is not really a suitable name, it is a single label)
bold timber
mild dirge
`y_labels.append(labels)` (although labels is not really a suitable name, it is ...
Finally, it works. Thank you so much!!!
But do you know the reason why did happen? @mild dirge
mild dirge
Because every label you go over is just an tensor of size 1 with a single integer
So when you do .numpy() and then argmax, then obviously the first integer in that tensor is the maximum value
So you get 0
The labels are not one-hot encoded
bold timber
bold timber
do you know what is wrong with this code?
I don't know why because this code works when I get the data with image_dataset_from_directory and for this case I use tfds dataset
thank you so much for the explanation! @mild dirge
But do you know the reason why I get so different results when I clone the model and load weight from the existing model? @mild dirge
soft badge
the library streamlit is good for model of machine learning?
desert oar
bold timber
I don't know why because this code works when I get the data with ``image_datase...
you will want to get into the habit of reading the documentation to find out what data types are returned from the functions that you use, especially array size/shape. it will save you from guesswork and confusion in cases like this.
 copper mica
any resources for learning the mathematics behind computer vision?
i'm struggling there
desert oar
copper mica
any resources for learning the mathematics behind computer vision?
im not a computer vision expert, but i would imagine that linear algebra is important. almost never a bad starting place for machine learning
serene scaffold
copper mica
It's just this
what "this" are you referring to?
copper mica
i am looking for it one moment lol

Like i don't know how to compute any of the singular components of this formula
 stuck pasture
hey I got a question about logistic regression. Not sure why it's only predicting positives... am I doing something wrong here?
 serene scaffold
stuck pasture
hey I got a question about logistic regression. Not sure why it's only predictin...
serene scaffold
stuck pasture
hey I got a question about logistic regression. Not sure why it's only predictin...
can you show df.head().to_dict('list')? please do not do a screenshot as I will not look at it.
stuck pasture
 'Exp2': {0: 0, 1: 0, 2: 0, 3: 0, 4: 0},
 'Exp3': {0: 0, 1: 0, 2: 0, 3: 0, 4: 0},
 'Exp4': {0: 0, 1: 0, 2: 0, 3: 0, 4: 0},
 'Exp5': {0: 0, 1: 0, 2: 0, 3: 0, 4: 0},
 'Exp6': {0: 0, 1: 1, 2: 1, 3: 0, 4: 1},
 'Dep': {0: 'Positive',
  1: 'Positive',
  2: 'Positive',
  3: 'Positive',
4: 'Negative'}}```Thanks!
try doing df['Dep'] = df['Dep'] == 'Positive' before you split it into train and test.
can you also do df['Dep'].value_counts()?
stuck pasture
False 1146```see how there's way more True instances than False ones? so the model ends up learning that it's safer to just always say True
you would need a more complex model to learn the subtle distinctions.
stuck pasture
hmmm thats what i thought. I tried doing a CV and got same results... even did PCA on first 3 components and got same results
serene scaffold
look into "binary classifiers for imbalanced data", I guess
stuck pasture
thanks for the help!
serene scaffold
you might also see if adjusting the parameters would help https://scikit-learn.org/stable/modules/generated/sklearn.linear_model.LogisticRegression.html
scikit-learn
Examples using sklearn.linear_model.LogisticRegression: Release Highlights for scikit-learn 1.1 Release Highlights for scikit-learn 1.1 Release Highlights for scikit-learn 1.0 Release Highlights fo...
desert oar
copper mica
that's multidimensional calculus. specifically the gradient which is a vector of partial derivatives.
the gradient isn't that difficult to understand actually. f(x,y) = ax² + by² is a function of two variables, so its gradient is the vector (2ax, 2by) = (∂f/∂x, ∂f/∂y) = ∇f
you might say that the gradient ∇f is a vector-valued function
serene scaffold
What. Does that just mean that the function evaluates to a vector?
desert oar
i don't know if there's some fancy axiomatic construction for it, but yeah
(2ax, 2by) is a function of 2 variables x and y, but it also has 2 outputs
serene scaffold
I'm going to say that it's a function that returns a vector, and idc if mathematicians call me a filthy programmer
Which is something that has happened
It was the worst thing I've ever experienced
desert oar
lol seriously? i suppose those mathematicians don't know about theoretical computer science, which is mostly very abstract math
that's awful
serene scaffold
Don't take my use of negative superlatives too seriously. I'm gay.
serene scaffold
desert oar
the gradient isn't that difficult to understand actually. `f(x,y) = ax² + by²` i...
I agree that it's easy to understand if you already understand single variable derivatives, and the concept of arrays as mathematical constructs. Though many of our users do not.
desert oar
lol i mean, using the term "filthy" is pretty bad
desert oar
serene scaffold
I agree that it's easy to understand if you already understand single variable d...
true. i assumed that they knew calculus at all, which probably isn't a good assumption
usually if you know linear algebra, you've at least seen derivatives before
maybe not a partial derivative though
serene scaffold
I never took multivariate calculus. For some reason, my whole math education skirted around multivariate functions completely. Even when I took algos and data structs, it was never explicitly stated that the runtime of Dijkstra's has two variables (num nodes and num edges), which threw a lot of people off.
And the only time someone told me the difference between a variable and a parameter (in math terms) was my calc2 prof's office hours.
desert oar
serene scaffold
I never took multivariate calculus. For some reason, my whole math education ski...
interesting. i studied economics and multivariate calculus was part of the math sequence. can't remember if it was recommended or required
desert oar
serene scaffold
And the only time someone told me the difference between a variable and a parame...
is there a difference?
if so, TIL
serene scaffold
desert oar
is there a difference?
A parameter is like an unspecified constant. Like you might have f(x) = 3x + a
I'm sure there's a better informal definition than this.
desert oar
serene scaffold
A parameter is like an unspecified constant. Like you might have f(x) = 3x + a
huh, i'm not sure that's a generally accepted distinction, but i think it's a useful one
that or it's generally accepted and i've just never seen it
interestingly that definition is almost completely reversed from how "parameter" is used in programming
 iron basalt
In math, many things depend on context, specifically naming things. But generally, a parameter is a variable not listed in the arguments (of a function). Even more generally, including outside of math, it's something that describes some key aspect of how something behaves. f(x) = x + 2 is a function, but f(x) = ax + 2 is a family of functions, which can be chosen from by setting a to something specific.
(e.g. fitting a curve, it can be thought of as picking the best curve from a (infinite) family of curves, rather than nudging a curve over and over)
desert oar
ah... you know what, i might have heard that before in the context of maximum likelihood and bayesian stats
the f(x;θ) notation i think was meant to convey that θ is a "parameter"
iron basalt
Yeah that is one notation that comes up.
Another might be subscript, e.g. log_b(x).
Or just not at all, it's just in there, like the a shown.
desert oar
that makes sense. i like when concepts have names. makes them easier to talk about and think about.
iron basalt
In many cases parameters also tend to be constants, like ones discovered in physics.
They fundamentally control how it will behave, even with slight changes in value.
 obsidian trench
Hi guys can u help with this assignment
 arctic wedgeBOT
Hey @obsidian trench!
It looks like you tried to attach file type(s) that we do not allow (.pdf). We currently allow the following file types: .gif, .jpg, .jpeg, .mov, .mp4, .mpg, .png, .mp3, .wav, .ogg, .webm, .webp, .flac, .m4a, .csv, .json.
Feel free to ask in #community-meta if you think this is a mistake.
Hey @obsidian trench!
It looks like you tried to attach file type(s) that we do not allow (.xlsx). We currently allow the following file types: .gif, .jpg, .jpeg, .mov, .mp4, .mpg, .png, .mp3, .wav, .ogg, .webm, .webp, .flac, .m4a, .csv, .json.
Feel free to ask in #community-meta if you think this is a mistake.
obsidian trench
i am new machine learning so how to go head with this problem
import pandas as pd
from difflib import SequenceMatcher as sm
df = pd.read_csv('keyword_data.csv')
def brand_search_tearm(search_term):
    stop_words = set(stopwords.words('english'))
    word_tokens = word_tokenize(search_term)
    filtered_sentence = [w for w in word_tokens if not w.lower() in stop_words]
    for sentence in filtered_sentence:
        w1="kelloggs"
        w2 ="davidoff"
        w3="bagrrys"
        w4="nescafe"
        w5="yogaBar"
        if 'k' in sentence and len(sentence)>2 and round(sm(None,w1,sentence).ratio()*100)>60:
            return w1
        elif 'd'in sentence and len(sentence)>2 and round(sm(None,w2,sentence).ratio()*100)>60 :
            return w2
        elif'n'in sentence and len(sentence)>2 and round(sm(None,w4,sentence).ratio()*100)>60 :
            return w4
        elif'y'in sentence and len(sentence)>2 and round(sm(None,w5,sentence).ratio()*100)>60 :
            return w5
        elif 'b'in sentence and len(sentence)>2 and round(sm(None,w3,sentence).ratio()*100)>60 :
            if sentence not in ['bar','bars']:
                return w3
    return 'generic_term'

df['brand']=df['search_term'].apply(brand_search_tearm)
 rugged comet
desert oar
it's also often useful to look at the bivariate association between each feature...
rugged comet
desert oar
it's also often useful to look at the bivariate association between each feature...
bivariate association between each feature and the target
Like how the features sort of influence what the target is going to be? Can you talk more about this or give some examples of what people do to look at this?
nontrivial entity resolution
I looked this up and it sounds like canonicalizing the data. Such as turning#scotusintoscotus. They both reference the same entity so they should be treated the same way more or less.
Also, how would I know to look at the average length of the words or the average number of words for each target for example. Does something like this just come as intuition as one does more work with NLP?
tensorflow keras has a TextVectorization layer that comes with an ngrams parameter.
https://www.tensorflow.org/api_docs/python/tf/keras/layers/TextVectorization#args_1
TensorFlow
A preprocessing layer which maps text features to integer sequences.
obsidian trench
obsidian trench
```py
import pandas as pd
from difflib import SequenceMatcher as sm
df = pd.read...
i know it isn't the right way here i have just hard coded sequence matcher to 60 i don't what goes in the backend can help to do this assignment with right direction
bright pasture
It took a lot of time for me to iron everything out, but I finally have a result of my work.
 mellow wraith
I'm chewing away at a problem here I've been trying to understand what exactly the problem is but to no avail so far. I'm attempting to just get a test version of https://github.com/google/prompt-to-prompt/ running, included in the repo is a jupyter notebook https://github.com/google/prompt-to-prompt/blob/main/prompt-to-prompt_stable.ipynb
However i'm running into an error when I try to run their step 7 in the notebook,
g_cpu = torch.Generator().manual_seed(8888)
prompts = ["A painting of a squirrel eating a burger"]
controller = AttentionStore()
print(controller)

image, x_t = run_and_display(prompts, controller, latent=None, run_baseline=False, generator=g_cpu)
#show_cross_attention(controller, res=16, from_where=("up", "down"))
The full error https://gdl.space/ilunasahes.rb
Succintly,
NotImplementedError: Module [ModuleList] is missing the required "forward" function
both the model and controller implement forward, so I'm extremely confused what part of the pipeline failed here exactly
mellow wraith
seems to be related to the new diffusers library
mellow wraith
ah yeah, it was the new diffuers library. The error was basically useless, the issue was a cuda incompatability between my diffusers library installation, it was neccesary to resinstall torch with a newer cuda version
light shell
Does anyone know how to loop through lists in pandas when they are in rows? I want to count each item inside the lists, but I only manage to get the sum of rows.
 cedar chasm
Anyone know other tic-tac-toe Ai algos other than Minimax? Everywhere I go It's minimax again.
 tiny wadi
cedar chasm
Anyone know other tic-tac-toe Ai algos other than Minimax? Everywhere I go It's ...
tiny wadi
cedar chasm
Anyone know other tic-tac-toe Ai algos other than Minimax? Everywhere I go It's ...
MCTS for example. tictactoe is a small game so minimax solves it fully without a problem
 surreal radish
Hi guys, I have bunch of csv & excel files with storage order of 10G and i may do some ETL on them later, what are some best practice cloud storage for my purpose?
mild dirge
cedar chasm
Anyone know other tic-tac-toe Ai algos other than Minimax? Everywhere I go It's ...
I think more complicated algorithms like using reinforcement learning would just be overkill for that example
hasty mountain
Hey @desert oar so, I tried what you said about creating a vectorizer model for NLP. I passed, as input, a single word and the model had to output a vector.
However, you also said(and I made a quick search) that usually this is done with n-grams. So...this is in order to properly extract the context of that word inside each n-gram, right?
However, what if I'm working with Reinforcement Learning? Would my context be extracted from the game state(such as a frame), and then my output would be a vector?
fallen crown
Hi i am looking a video on MaxMinScaller and I think there is a error in the video, could you confirm ?
the formula

formula Xtest_scaled is not correct ?

it should be Xtest_min and Xtest_max ?
hasty mountain
Nevermind my explanation. I think my head isn't working effectively today.
mild dirge
fallen crown
formula Xtest_scaled is not correct ?
It is correct
The scaling is based on your training data
@fallen crown
fallen crown
mild dirge
It is correct
hmm ok, thanks
mild dirge
fallen crown
hmm ok, thanks
Your model will be based on data scaled using train_min and train_max, so the model will expect data that is scaled in that exact way
If you change the scaling for the test set, then the model will see the same value during training and testing as different values
Preferably we would know the min and max of all the data, but we don't want to use any info about the test set during training, therefore the training min and max are used for everything
@fallen crown
fallen crown
@mild dirge
It was very well explained, I understood everything, thank you very much !!!
 quaint plover
In the context of a statistical analysis, I am trying to perform exact matching between individuals in the control group and individuals in the treatment group individuals based on three covariates a,b,c
I am trying to find the most efficient way to do this without iterating over every row.
Basically, I have df_control and df_treatment that I am trying to merge in a df_merged where I try to match each row of df_control with a exactly one individual in df_treatment. There shouldn't be overlap.
My current approach is to iterate over all members of the left dataframe, trying to find the matching member in the right dataframe. Upon a succesful match, a new row is added to the output dataframe and the original individuals are removed from their original df.
I am trying to see if there is a solution using joins or sets that I don't see.
Thanks!
 thorn wind
Hey guys I want an help regarding my project. I am doing sentiment analysis of IMDb reviews (only 2 columns are there review and sentiment) my doubt is how to find out the most suited classifier algorithm for a given dataset??
As I am practicing different classifier algorithms for different datasets I am still confused about which classifier to use in which condition
Any video suggestion or article helps me
serene scaffold
quaint plover
In the context of a statistical analysis, I am trying to perform exact matching ...
if your solution to a dataframe problem involves iteration, assume it's wrong.
if there's supposed to be a 1:1 match between the left and right dataframe based on columns (a, b, c), then you can just to an inner join (using the merge method) on those three columns. and if there ends up being more than one match for a given (a, b, c) value, you can drop the duplicates.
the code would look something like this
abc = ['a', 'b', 'c']
df_control.merge(df_treatment, how='inner', on=abc).drop_duplicates(subset=abc, keep='first')
Agreed, I think my solution with iteration is sub-optimal.
Unfortunately, there is no 1:1 match. For some individuals of the df_control group, many possible matches exist. For others, there are none.
Here is my current iterative approach:
# for each row of the control group, find an exact match and add it to df_merged
for index,row in df_control.iterrows():
    df_row = row.to_frame().T
    # find intersections between current row and df_treatment
    df_helper = pd.merge(df_row,df_treatment, on=covariates, how='inner',suffixes=('_c', '_t'))
    if len(df_helper)>0:
        # retrieve first row of matched pair
        matched_row = df_helper.iloc[0].to_frame().T
        # add first matched pair to df_matched
        df_matched = pd.concat([df_matched,matched_row])
        # remove matched pair from control group
        df_control = df_control.loc[df_control['id']!=matched_row['id_c'].values[0]]
        # remove matched pair from treatment group
        df_treatment = df_treatment.loc[df_treatment['id']!=matched_row['id_t'].values[0]]
so if there isn't a 1:1 match, there's a heuristic that you use to decide which of the possible rows is closest, and then that closest row is eliminated for future consideration?
also, are the set of covariates always unique within df_control?
quaint plover
serene scaffold
so if there isn't a 1:1 match, there's a heuristic that you use to decide which ...
The set of covariates is not unique as it is observational data (year of birth, occupation, gender). The two dataframes are not the same length either, as the treatment is observational as well (born in first half of year vs born in second half of year). There are left-over individuals that don't get matched in both groups.
My heuristic is simple: I go down the list of rows in df_control and match the row with the first suitable df_treatment individual that is sharing the same covariates.
serene scaffold
quaint plover
The set of covariates is not unique as it is observational data (year of birth, ...
that's not a heuristic in the sense that I had in mind, since it sounds like you're just picking an arbitrary row from the set of possible rows
 neat schooner
anyone know of a regex expression that will return true on 10-0-0 or 7-0. I am trying to filter all wins no ties no losses or all wins no losses. I have tried r"(?:-0?)" but still fails
serene scaffold
neat schooner
anyone know of a regex expression that will return true on 10-0-0 or 7-0. I am t...
\d+(-\d+)*
oh wait
neat schooner
yeah fails on 7-1-0
serene scaffold
neat schooner
anyone know of a regex expression that will return true on 10-0-0 or 7-0. I am t...
you shouldn't really use regex if the semantics of the string matters.
I would just have one that matches the string aspect of the pattern, and then a function that validates the semantics.
neat schooner
yeah that was my thought too once I hit a road block on regex
serene scaffold
quaint plover
The set of covariates is not unique as it is observational data (year of birth, ...
here's a suggestion to simplify the code:
control_rows = {covar, [row for _, row in group.items()] for covar, group in df_treatment.groupby(covariates)}
and then when you get to a row in df_control, and you want to get an arbitrary row from df_treatment that has the same set of covariates, you would just do control_row[current_covariates].pop(), where current_covariates is a tuple of the (a, b, c) values.
that would error if you run out of candidate rows, though.
@quaint plover do you love it?
quaint plover
serene scaffold
that's not a heuristic in the sense that I had in mind, since it sounds like you...
Good one, thanks a lot! control_rows = {covar: [row for _, row in group.items()] for covar, group in df_control.groupby(covariates)}
serene scaffold
quaint plover
Good one, thanks a lot! `control_rows = {covar: [row for _, row in group.items()...
let me know if it works 😄
soft badge
guys at the beginning of learning machine learning seem very confused?
serene scaffold
soft badge
guys at the beginning of learning machine learning seem very confused?
yes, it's challenging
soft badge
so i was see the course of ibm
but i stay confuse in relation a regression linear
not on regression on se but on dataframe issue
because I thought that the regression model would fill all rows in the prediction column
dusty valve
Got this prediction from my model( ignore the extra yellow line). Good?

It's supposed to predict stock prices
It seems to be more accurate for long term predictions this one, my previous are a more accurate in shorter time intervals
 soft badge
I want to know how predict value of column based in others anyone can help me ?
hasty mountain
soft badge
I want to know how predict value of column based in others anyone can help me ?
You must use the other columns to generate an array...
...which, if I'm not mistaken, can be done simply by using something like
X = dataframe['Column1, Column2']
I think...
Maybe also adding a .values after the ]
I think that, after that, you'll have to create another column in the array using the predicted values
dataframe['New Column'] = predicted_values
hasty mountain
Well...then there might be something wrong there...
Try doing the steps in the videos slowly, preferably in a Jupyter notebook, in separated cells, so you can check what you're doing, the outputs...
soft badge
because in my head, when predicting it, it applied to all lines and created another dataframe, but in the videos I saw, it returned only one value
hasty mountain
Nah, it depends on the situation
If you use the predict command, you'll probably return a single value. So, if you want more values predicted, you'll need a loop.
It'll return a single value given the input you gave it to the model
I suppose that, considering it's a linear regression model, you'll find it easier to understand if you think of the line figure in an cartesian plane
soft badge
ok, i can understand the conceps but i was hope other thing in my mind, understand?
hasty mountain
Hm... You want to use more than a single column in order to predict another one?
soft badge
no, actually I thought that for example: based on a column the model would return the filled values of each row in the column I'm predicting, that's why.
hasty mountain
Oh, but you can do that...just use a for loop to generate more than a single value, and then pass those values into a new column in the dataframe
I just can't remember if you'll have to aggregate the predictions into a list, an array or in another type of data...but I suppose an array might work
soft badge
understand, thanks i will test
soft badge
I was able to test a value of a column and get the prediction out
 quaint loom
Is there anyone here who know how this should be solved?
 soft badge
hasty mountain
Oh, but you can do that...just use a for loop to generate more than a single val...
soft badge
hasty mountain
Oh, but you can do that...just use a for loop to generate more than a single val...
thanks so much my friend
I got it, I'm very happy
 gilded bobcat
Hey there I have a NLP question if anyone wants to field it 😄
serene scaffold
gilded bobcat
Hey there I have a NLP question if anyone wants to field it 😄
please always ask your actual question right away. please never "ask to ask"
rugged comet
What are some things that people look for when doing exploratory data analysis for NLP?
gilded bobcat
I am trying to learn NLP (esp with clustering) so I ran a BioBERT model on a list of medical criterion to see if I can cluster groups correctly. Ground_truth are the 'true labels', clean_criterion are the cleaned strings for that determines groups, and biobert_groups are my predicted groupings.
I am realizing that my biobert model is having a hard time seeing that 'pregnancy' and 'pregnant women' are essentially synonyms. I was curious what I could do to fix this? Is manually changing my criterion strings the only way? That seems like a bad idea, it wont generalize if so.
 gilded bobcat
rugged comet
What are some things that people look for when doing exploratory data analysis f...
gilded bobcat
rugged comet
What are some things that people look for when doing exploratory data analysis f...
For I had strings labeled as groups, so I tried to look at group size, made word clouds for the groups, I did some embeddings and did PCA to vizualize them, etc...
rugged comet
What is PCA?
gilded bobcat
rugged comet
What is PCA?
Prinicipal Components Analysis - think of taking your dataframe that has 100 features, you can't plot all of that into a 2d plot, right? Instead you can run PCA which will essentially shrink your data into only 2 features so that you can visualize it on a plot. This is a super simplification.
rugged comet
gilded bobcat
I am trying to learn NLP (esp with clustering) so I ran a BioBERT model on a lis...
It sounds like you want to have pregnancy, pregnant, and pregnant woman to be all part of the same BioBERT group.
Each of the two/three types of clean criterion all have "pregnan" in them with something after. You could do some sort of n-gram thing with that. I have never done that before. I just learned about it. You might be able to apply it here. Otherwise, like you said, you could do some entity resolution by turning the three different clean criterion into one group such as "pregnant".
serene scaffold
rugged comet
What are some things that people look for when doing exploratory data analysis f...
lexical diversity is a good place to start.
rugged comet
serene scaffold
lexical diversity is a good place to start.
Thanks for the idea.
gilded bobcat
rugged comet
It sounds like you want to have pregnancy, pregnant, and pregnant woman to be al...
I like that idea, I guess I am unsure how to implement that, let me think on it
Like it should go to say, just doing a bag of words or TFIDF only does marginally worst than BioBERT, so like these single words mean alot in this NLP exercise
rugged comet
How hard would it be to turn the three categories into one? I'd be tempted to do that.
serene scaffold
gilded bobcat
I am trying to learn NLP (esp with clustering) so I ran a BioBERT model on a lis...
so you're using BioBERT to create vector representations of each clean_criteria value (which appear to be nouns or noun phrases) and clustering them, and you expected "pregnancy" and "pregnant woman" to end up in the same cluster, but they did not?
gilded bobcat
serene scaffold
so you're using BioBERT to create vector representations of each `clean_criteria...
yes!
gilded bobcat
rugged comet
How hard would it be to turn the three categories into one? I'd be tempted to do...
With BioBERT I am not sure, because you just feed in the string, I wouldn't know how to do preprocessing for BioBERT to treat these similar unless I manually clean the strings
serene scaffold
I would expect BioBERT to recognize that "pregnancy" and "pregnant woman" are semantically close (though I wouldn't call them synonyms). How many unique values are there in clean_criterion? can you show df['clean_criterion'].unique()?
gilded bobcat
serene scaffold
I would expect BioBERT to recognize that "pregnancy" and "pregnant woman" are se...
.nunique() brings back 1956, for 2355 rows 😦
Maybe I should stem over lemma?
serene scaffold
gilded bobcat
.nunique() brings back 1956, for 2355 rows 😦
hey, @rugged comet, that probably means that their clean criteria have high lexical diversity 😛
rugged comet
A nice working example!
gilded bobcat
I guess like even my clean criteron is a little too specific, pregnant woman == pregnant just on the biological medical study sense. So I wish there was a way for me to say "hey biobert do more!!" without me parsing through it all haha
Life goes on I will survive!!
serene scaffold
gilded bobcat
Life goes on I will survive!!
you're going to die tbh. just not necessarily because of this.
gilded bobcat
I will survive past this project with a high probability!!
serene scaffold
anyway, biobert is trained to "know" what texts are semantically similar in the context of biomedical literature. it might be that in biomedical literature, "pregnancy" and "pregnant women" are less similar than they are in general texts
you might counter-intuitively use a general-domain bert model and see if your clusters end up feeling more intuitive to you.
rugged comet
Is it possible to turn NaN float values in a dataframe column into the string literal "NaN"?
---------------------------------------------------------------------------
TypeError                                 Traceback (most recent call last)
/tmp/ipykernel_23/445899321.py in <module>
----> 1 text = " ".join(i for i in train_df.keyword)
      2 stopwords = set(stopwords)
      3 wordcloud = WordCloud(stopwords=stopwords).generate(text)
      4 plt.figure(figsize=(15, 10))
      5 plt.imshow(wordcloud, interpolation="bilinear")

TypeError: sequence item 0: expected str instance, float found
I'm trying to make a word cloud for a column.
serene scaffold
rugged comet
Is it possible to turn `NaN` float values in a dataframe column into the string ...
" ".join(map(str, train_df.keyword))
rugged comet
Thank you.
serene scaffold
yw
serene scaffold
rugged comet
Thank you.
' '.join(train_df.keyword.astype(str)) would probably be the same.
but str.join throws a fit if it encounters a not-str.
rugged comet
Ya lol
serene scaffold
temperamental little shit!
rugged comet
Maybe a word cloud isn't a good idea here because some of the keywords are more than one word long. Also, nan is big as expected lol
 serene scaffold
rugged comet
Maybe a word cloud isn't a good idea here because some of the keywords are more ...
serene scaffold
rugged comet
Maybe a word cloud isn't a good idea here because some of the keywords are more ...
' '.join(train_df['keyword'].dropna().astype(str))
also why is your word cloud about doom
rugged comet
serene scaffold
`' '.join(train_df['keyword'].dropna().astype(str))`
Is there a difference between train_df["keyword"] and train_df.keyword? I noticed you used both in your examples.
serene scaffold
rugged comet
Is there a difference between `train_df["keyword"]` and `train_df.keyword`? I no...
pandas does a thing where if __getattr__ doesn't find anything, it tries looking in the column names before giving up. a lot of people dislike that feature because it mixes the column namespace and the instance/class namespace.
also prepare to be immortalized
!otn a urkchar's armageddon bag
arctic wedgeBOT
:ok_hand: Added urkchar’s-armageddon-bag to the names list.
rugged comet
Haha nice!
rugged comet
serene scaffold
also why is your word cloud about doom
Natural Language Processing with Disaster Tweets
https://www.kaggle.com/competitions/nlp-getting-started/overview
My attempt so far
https://www.kaggle.com/code/urkchar/determine-if-tweet-is-about-disaster/

Predict which Tweets are about real disasters and which ones are not
Explore and run machine learning code with Kaggle Notebooks | Using data from Natural Language Processing with Disaster Tweets
serene scaffold
I must now sleep. everyone be good.
rugged comet
Good night.
 fervent hatch
is it possible to use multi-output regression on predicting 3 dice outcomes?
 granite cipher
A complete novice to the field, but how do AI and ML researchers even know that AI at a human level is possible? You often hear that AGI is x years away, but how do they know it’s even possible for a machine to gain consciousness? Or even intelligence in the same way that we understand it?
 tacit basin
granite cipher
A complete novice to the field, but how do AI and ML researchers even know that ...
tacit basin
granite cipher
A complete novice to the field, but how do AI and ML researchers even know that ...
Do we know what's human intelligence or consciousness?
 velvet wadi
Umm I'm a bit new to the data science and ai community can someone suggest small projects to get started with? I've learnt like most of theoritical info behind a few ml algms and i want to try implementing them :)
 tulip walrus
Which course is the better out of the two:

Coursera
Offered by University of Michigan. This course will introduce the learner to applied machine learning, focusing more on the techniques and ... Enroll for free.
or

Coursera
In the first course of the Machine Learning Specialization, you will: • Build machine learning models in Python using popular machine ... Enroll for free.
I know alot of people like andrew's but I am pretty sure its in octave
rugged comet
What do you guys consider to be a correlation high enough between a feature and a target that makes that feature worth training on? > 0.5? > 0.7? > 0.75? Something else?
rugged comet
gilded bobcat
With BioBERT I am not sure, because you just feed in the string, I wouldn't know...
I mean how hard would it be to manually clean the strings then.
gilded bobcat
rugged comet
I mean how hard would it be to manually clean the strings then.
I mean I could, but this is one group of 98 groups and manually implementing rules feels odd if I want this to generalize to more data down the road, data I wouldn't be able to manually change rules constantly on. I was looking if there were general ways to address this just because I am super new to huggngface/bert/NLP in general
cedar chasm
mild dirge
I think more complicated algorithms like using reinforcement learning would just...
Sorry for the late reply. But the problem is I want to do a 5x5 tic-tac-toe and minimax alpha-beta seems too slow. I also want to find another since that's the requirement from my teacher.
rugged comet
@serene scaffold
Disaster tweets contain 14302 unique words.
Non-disaster tweets contain 17968 unique words.
Disaster tweets contain 49613 total words.
Non-disaster tweets contain 63848 total words.
Disaster tweets have a lexical diversity of 0.2882712192368936
Non-disaster tweets have a lexical diversity of 0.2814183686254855
It appears as though the lexical diversities are very similar. I doubt that we could turn this into a feature or extract any meaningful insight from this.
bold timber
Hello guys, this is an illustration of how RNN models work. But I don't understand V, W, and U variables. Can you guys explain to me the meaning of that variables?

 thorn zephyr
U: x -> S
V: S -> o
W: S -> S
that is what they do.
x is the input embeding, o is output embedding, can be mapped to discret tokens. S are states. U, V, W are matrixes.
serene scaffold
rugged comet
<@253696366952316929>
Disaster tweets contain 14302 unique words.
Non-disaster ...
you don't really use lexical diversity as a feature. but if you're doing some kind of classification task, it's good to know how diverse each class is.
are there words that are more common in disaster tweets than there are in non-disaster tweets?
also it looks like everyone was good while I was sleeping. thanks!
hasty mountain
Is it a good idea to ignore the loss computed in the epoch number 0 and start computing it from epoch number 1?
I'm getting quite annoyed by the possibility of "hits by chance" when my model is initialized(epoch 0)
lapis sequoia
import torch

X = torch.randint(0, 3, (32, 3))
C = torch.randn((27, 2))
print(X.shape, C.shape, C[X].shape)
# torch.Size([32, 3]) torch.Size([27, 2]) torch.Size([32, 3, 2])
I don't understand how C[X] becomes a (32, 3, 2). I know this is exploiting something about how X is lists of ints that are being used to index into C.. but I'm confused because C has two dimensions and the lists in X are length three so I'm not sure what's happening
serene scaffold
lapis sequoia
```py
import torch
X = torch.randint(0, 3, (32, 3))
C = torch.randn((27, 2))
pr...
I made a smaller example to try to make it easier to reason about, but I'm struggling with it as well 
In [19]: c
Out[19]:
tensor([[-0.2781, -2.0313],
        [ 0.4137,  0.8333],
        [ 0.1950, -0.8434]])

In [20]: X[:3]
Out[20]:
tensor([[1, 1, 1],
        [2, 2, 0],
        [1, 2, 1]])

In [21]: c[X[:3]]
Out[21]:
tensor([[[ 0.4137,  0.8333],
         [ 0.4137,  0.8333],
         [ 0.4137,  0.8333]],

        [[ 0.1950, -0.8434],
         [ 0.1950, -0.8434],
         [-0.2781, -2.0313]],

        [[ 0.4137,  0.8333],
         [ 0.1950, -0.8434],
         [ 0.4137,  0.8333]]])
If X were 1d and of size 50 f.e. you would get that many slices of C
So (50, 2)
But now X is 2d, so you get (50, 3) slices of C
mighty patio
lapis sequoia
```py
import torch
X = torch.randint(0, 3, (32, 3))
C = torch.randn((27, 2))
pr...
this is indexing by integers, same as in numpy
consider the case above (but here in numpy)
import numpy as np
X = np.random.randint(0, 3, (32, 3))
C = np.random.random((27,2))
D = C[X,:]
print(X.shape, C.shape, D.shape)
(32, 3) (27, 2) (32, 3, 2)
Note that I write D = C[X,:] to highlight the fact that X only operates on the first index, but the ,: is optional (as you know).
The resulting shape of D reflects the fact that the first index has been expanded to the shape of C
note that
E = C[:,X]
would normally give a shape (27, 32, 3) but in this case give IndexError: index 2 is out of bounds for axis 1 with size 2
This is because X contains values 0,1,2, while C is only 2 long on the second axis.
lapis sequoia
Okay I get it woo thanks for the help.. It's indexing rows but actually a list of rows so you get 32 lists of 3 rows of length two
>>> C[X][0]
array([[0.68539896, 0.7246301 ],
       [0.68539896, 0.7246301 ],
       [0.68539896, 0.7246301 ]])
>>> X[0]
array([0, 0, 0])
>>> C[0]
array([0.68539896, 0.7246301 ])
>>> C[[0,0,0]]
array([[0.68539896, 0.7246301 ],
       [0.68539896, 0.7246301 ],
       [0.68539896, 0.7246301 ]])
Thank you!
rugged comet

@serene scaffold I looked at the stopwords too.
Disaster most common words

Non-disaster most common words
 serene scaffold
rugged comet
Non-disaster most common words
serene scaffold
rugged comet
Non-disaster most common words
You should treat like and I'm as stop words
Also & should have been data cleaned
(like replaced with and)
 young granite
is there a way to generate a dict inside a function?
def myfunc():
myfunc.mydict = {}```
like so? wooden sail
certainly, what exactly do you want to do with it?
serene scaffold
young granite
is there a way to generate a dict inside a function?
Not sure I see the issue. Are you trying to persist the same dict between every call to the function?
wooden sail
i think they're more trying to treat the function as an object that has a dict property
modestly cursed, but also doable in python
serene scaffold
wooden sail
i think they're more trying to treat the function as an object that has a dict p...
You would accomplish what I said that way as well
wooden sail
ah, i misread what you wrote
serene scaffold
@young granite if you want to do that, you need to do the assignment outside the function, immediately after the function is defined.
young granite
serene scaffold
<@385750261420916736> if you want to do that, you need to do the assignment outs...
i wanted to use a tracename which is defined inside the function tho Q_Q
wooden sail
outside the func you can do myfunc.myvar = {}
young granite
sad sad
serene scaffold
young granite
sad sad
You can write attributes to the function itself inside the function, but doing so would overwrite whatever value is already there
young granite
serene scaffold
You can write attributes to the function itself inside the function, but doing s...
yeh so far i came aswell 😄
good thing its only for my aesthetics 😄
wooden sail
is there any reason you wanna do it this way and not in a class that has both?
serene scaffold
We love code aesthetics
You can make a class with a dunder call method if you want it to behave like a normal function
young granite
tbh never made a class 🗿
serene scaffold
Don't let your dreams be dreams. Or memes.
young granite
but u guys could maybe help me with another problem i stumbled on
wooden sail
i'm astonished you're doing something this cursed and have never made a class, this is absolutely backwards
young granite
i did FFT and stored the f_hat data (complex) now i want to use this data for ML and later convert it with ifft but i cant input complex data and if i transform i loose my 2 values
rugged comet
serene scaffold
You should treat like and I'm as stop words
Thanks for the tip.
young granite
wooden sail
i'm astonished you're doing something this cursed and have never made a class, t...
im a simple tool i come to a problem and overcome it, somehow
wooden sail
why can't you input complex data? and what 2 values are you talking about
young granite
wooden sail
why can't you input complex data? and what 2 values are you talking about
complex value is (-x,x)
my scikit model wont allow it
wooden sail
i don't know what you mean by (-x,x), and yeah, complex calculus is beyond skl
this requires wirtinger calculus. to my knowledge, pytorch and jax have it. idk about tensorflow, and scikitlearn apparently doesn't
young granite
wooden sail
i don't know what you mean by (-x,x), and yeah, complex calculus is beyond skl
two values in one expression
wooden sail
you can, however, split complex values into real and imaginary
wooden sail
young granite
two values in one expression
well you still haven't given enough context as to why you would need this
young granite
wooden sail
well you still haven't given enough context as to why you would need this
i want to input as few data as possible into my scikit model
so 4>>8
wooden sail
complex numbers are twice the size in memory, and they get handled as being 2 arrays anyway 😛
it doesn't make any difference
young granite
wooden sail
complex numbers are twice the size in memory, and they get handled as being 2 ar...
oh ok
i thought i outsmart the system
🗿
wooden sail
you should read into wirtinger calculus. most complex functions we deal with are not even differentiable in the first place, because being complex differentiable is a very difficult condition to satisfy
real partial differentiability is a lot easier, and since we care only about the parameters and not the super nice extra structure of holomorphic functions, optimization with complex functions is anyway splitting into real and imag
rugged comet
serene scaffold
(like replaced with and)
Is data cleaning part of exploratory data analysis? I was under the impression that cleaning comes after EDA. The steps could be combined though I suppose.
young granite
wooden sail
you should read into wirtinger calculus. most complex functions we deal with are...
ill give it a shot thanks
wooden sail
check here, from page 63 on https://www.matem.unam.mx/~hector/Remmert-TheoryCpxFtns.pdf
young granite
wooden sail
check here, from page 63 on https://www.matem.unam.mx/~hector/Remmert-TheoryCpxF...
thanks
serene scaffold
rugged comet
Is data cleaning part of exploratory data analysis? I was under the impression ...
It comes after EDA in the sense that you can't even know what cleaning needs to be done until you've looked at the data, but you can still do cleaning while you explore (provided that you don't overwrite the original data)
young granite
serene scaffold
It comes after EDA in the sense that you can't even know what cleaning needs to ...
always override 🗿
@wooden sail is there a way to convert complex to float directly?
wooden sail
if you're using numpy arrays, there's np.real and np.imag
young granite
ok thanks
serene scaffold
young granite
always override 🗿
I said overwrite not override. you always want to have the original data available to you.
@keen star this server is not an ad board, so please don't do that.
mint palm
arent feature extractor like ResNext, ResNet "almost" same as embedding layer?
what other difference is there except embedding layer are learnable?
both just input something and make a sort of feature vector out of it.
hasty mountain
mint palm
arent feature extractor like ResNext, ResNet "almost" same as embedding layer?
w...
I think both are learnable
Also...a feature extractor usually works like extracting a feature from a large input. For instance, SRGAN uses VGG19 to extract features from a high resolution image(256x256x3).
And to extract features from a 256x256x3 input, VGG19 uses convs and max pooling layers.
While an embedding layer, from what I've seen, is usually used in NLP, where you deal with inputs with shape (N, 1) or things like this, and then outputs a vector.
So it doesn't need something so robust as VGG19 feature extracting layers.
mint palm
hasty mountain
While an embedding layer, from what I've seen, is usually used in NLP, where you...
yeah nlp is sort of where i think gap widens, but like in some vision transformer and stuff i see they use embedding layer on video. In those type of application what practical benefit embedding provide over normal feature extractor
hasty mountain
Uh... Vision Transformer? Is it an adaptation of the former Transformer model?
mint palm
yup,
hasty mountain
Oh, so it probably have something to do with its structure...or it might be used to help with a classification problem.
mint palm
basically learn video temporally, architecture is same
hasty mountain
Hm... I've seen that Transformer's architecture was made to work with vectorization that the transformer itself does, so...well...
Might be something the architecture needs. Like the positional encoding.
I've seen that Conditional GANs also use embedding layers to generate a vector that will condition the generator's output.
So it might be something related to a classification question...
mint palm
actually in the architecture i am studying they feed SHUFFLED frames, and architecture learn to order them, and output correct order, and so it feels even more pointless to use embedding.
hasty mountain
Hm... Maybe the embedding helps to stablish a relation between each frame, just like it helps stablishing a relation between words.
Ugh...which reminds me I have to restudy the Transformer architecture after learning the logic behind word2vec...
mint palm
maybe....idk maybe then using something other than embedding layer would improve it...
 prime knot
Question: In tensorflow, does batching increase or decrease change accuracy?
serene scaffold
prime knot
Question: In tensorflow, does batching increase or decrease change accuracy?
your question isn't about tensorflow--it's about neural networks in general.
and the answer is that batching is just how many instances you run through the network at once, which is about how efficiently you use your computer's resources. it shouldn't affect performance.
hasty mountain
I think in general more batches should improve accuracy, shouldn't it?
Like, your model will be learning how to deal with many different inputs at once...
Even in GANs this seems to apply.
 spare briar
batch size absolutely does affect performance, but there is no hard rule, depends on the model
@hasty mountain this is the right rule of thumb
serene scaffold
I was mistaken. I concede.
hasty mountain
Well...also...is there a way to know when I should decrease my learning rate in a GAN?
I know that, when I'm training a classifier, for example, if the grads are oscillating, then I have to decrease the learning rate. But what about GANs? Will the grads also oscillate? They seem quite unstable for that...
hasty mountain
spare briar
<@388857837222100993> this is the right rule of thumb
I didn't know those "rules of thumb" were something more formal... I see that there quite many...
spare briar
its just a phrase meaning it is a practical wisdom but not based on rigorous theory
hasty mountain
But what about this one
You need at least 5,000 observations per category for acceptable performance (>=10 million for human performance or better).
What does it mean? I need at least 5,000 iterations to check if my performance is good or bad?
spare briar
training gans is notoriously unstable and requires some tricks, I'd recommend looking at recent GAN papers and following their lead
serene scaffold
inb4 rigorous thumb theory
hasty mountain
spare briar
training gans is notoriously unstable and requires some tricks, I'd recommend lo...
I don't see they changing their learning rate at all. I was just thinking that perhaps I could achieve good results faster if I started with higher learning rates and used a scheduler to decrease them with time
spare briar
hasty mountain
But what about this one
`You need at least 5,000 observations per category for a...
an observation is a sample/data point
they are definitely scheduling their learning rates
hasty mountain
Hm... Then maybe I should take a look again at BigGAN paper...
spare briar
thats a pretty old paper
hasty mountain
It's from 2020
spare briar
2018/2019
hasty mountain
But it's the state of the art model, isn't it?
spare briar
mostly, and vaes are also competitive again (with gans, not diffusion)
hasty mountain
Hm... Curious.
I did read an article in NVidia dev commenting that diffusion models would probably succeed GANs.
Buuut...in the Guided Diffusion, which is a quite recent paper, I think from 2021 or 2022...it's said that diffusion models tend to be heavier, take more time to train and generate less diverse outputs.
Though Guided Diffusion did surpass BigGAN
spare briar
what is your task
hasty mountain
Trying to make a GAN for fun
spare briar
a gan to do what
hasty mountain
It's actually a DCGAN that will grow with time...following an idea from a 2017 paper.
spare briar
generate whole image?
hasty mountain
spare briar
a gan to do what
Generate anime images...simply as that. Nothing complex, nothing robust.
hasty mountain
spare briar
generate whole image?
Yep
 tough forge
I need help keeping track of where i am in a massive loop because i keep crashing my colab notebook. Im trying scrape a bunch of news articles. Can any one help
serene scaffold
tough forge
I need help keeping track of where i am in a massive loop because i keep crashin...
did you check the terms of service for every website you are attempting to scrape?
tough forge
ya im good. Its the colab note book that is crashing because i max out the cache. so i need to figure out were i left off in the loop. I have the main list im working off of in a .txt file that im read the elements from line by line if that helps
serene scaffold
tough forge
ya im good. Its the colab note book that is crashing because i max out the cache...
what website(s) are you scraping?
once you've answered that (and not before), you'd need to be more specific about this loop and the text file. because as it stands, we know basically nothing about how your code works, so we can't speculate about how you'd figure out where it stopped.
 heady anchor
does anyone know how to fix this error
os -> macos ventura
import mediapipe as mp
import numpy as np
import cv2

cap = cv2.VideoCapture(0)

facmesh = mp.solutions.face_mesh
face = facmesh.FaceMesh(static_image_mode=True, min_tracking_confidence=0.6, min_detection_confidence=0.6)
draw = mp.solutions.drawing_utils

while 1:

    _, frm = cap.read()
    print(frm.shape)
    break
    rgb = cv2.cvtColor(frm, cv2.COLOR_BGR2RGB)

    op = face.process(rgb)
    if op.multi_face_landmarks:
        for i in op.multi_face_landmarks:
            print(i.landmark[0].y*480)
            draw.draw_landmarks(frm, i, facmesh.FACEMESH_CONTOURS, landmark_drawing_spec=draw.DrawingSpec(color=(0, 255, 255), circle_radius=1))


    cv2.imshow("window", frm)

    if cv2.waitKey(1) == 27:
        cap.release()
        cv2.destroyAllWindows()
        break
error --> INFO: Created TensorFlow Lite XNNPACK delegate for CPU.
 hushed orchid
tough forge
serene scaffold
what website(s) are you scraping?
hushed orchid
tough forge
serene scaffold
what website(s) are you scraping?
Im trying to use Trilifatura library to scrape fox, cnn and other large news site for articles for a DB i making to do analysis across news networks. Its built for large scale scrapes complete with politeness rules built in. So the program goes and gets the links for each news article from the site map and saves it the list as a txt file. The loop i have an issue with goes through the list and starts scraping articles and writing them to a csv file. at 50k + articles the colab note book crashes becasue the cache i full.
#pulls articles from site map works
from os import write
import trafilatura

from trafilatura import feeds, extract, bare_extraction
import json
import pandas as pd
import csv
nlist = (open("/content/file00.txt", "r")).readlines()
my_dict = []
for link in nlist:
  download = fetch_url(link)
  if download is not None:
    my_dict = bare_extraction(download, output_format="csv")
    print (my_dict)

  try:
      with open('/content/drive/MyDrive/DeepReporter/foxnews7-27-22.txt', 'a') as f:
        w = csv.DictWriter(f, my_dict.keys())
        w.writeheader()
        w.writerow(my_dict)
  except TypeError:

      pass
Hey, can you send the link to that video you're watching?
I want to try to make some gifs with GANs, and a classifier that can organize an output in correct order might be interesting for a discriminator
And attention layers seem to be way more effective than LSTMs
Which is curious... Attention layers seem to be just some layers with crazy math operations and fully connected layers...and after learning about convs and LSTMs I kinda got the preconception that FCC layers are too simple and a bit meh in relation to those other ones.
iron basalt
serene scaffold
inb4 rigorous thumb theory
It's all a bit hand-wavy, with some theory for some specific kinds of networks. There is a bunch of empirical evidence (backed by some theory) that larger batch sizes generalize worse. But at the end of the day, one needs to use batches of some size in deep learning because otherwise it will run too slow. And there are various tricks that can help get around the issue (as is the case with many things in deep learning which makes it hard to really give hard theoretical rules for anything because people will have already found a way around it or moved on to the new stuff for which those rules don't apply (or would take a lot of effort to show that they still apply (which takes time))).
iron basalt
hasty mountain
Which is curious... Attention layers seem to be just some layers with crazy math...
More complex model does not imply better (always, sometimes it does (there is often a minimum needed, but past that it can makes things more difficult with little gain or even negative)).
hasty mountain
I know, but Convs seem to be more computationally efficient and seem to have fewer problems in their outputs.
And LSTMs...well... I always see people worshiping LSTMs
iron basalt
LSTMs was what I was thinking of.
GRU is a simplified LSTM that in theory is weaker, but in practice will often be better (and it runs faster).
(And that is because such theory often does not account for practical feasibility of training, it's just looking at the upper possible)
hasty mountain
I have problems in 90% of the cases that I use LSTMs...the other 10% I'm not sure if I have or not a problem
I'm in love with attention layers now...though I don't quite understand them yet... and I'm kind of lazy to try and study them for now
iron basalt
Attention mechanisms in general in ML have shown to be very effective so it's worth studying them and all their variants.
hasty mountain
All their variants
Every paper I see that uses attention layers, uses a different variant of attention layer 
I'll stick to Transformer and perhaps WaveGlow's variants
iron basalt
iron basalt
(And that is because such theory often does not account for practical feasibilit...
(And much of the problem of ML is this practical part (perhaps the most important part right after some new method that gives something like a 10x better result), which is why GANs have fallen out (hard to train))
hasty mountain
Really? I'm finding them quite easy to train, now
Just took me, like, a year
It's just that their code and theory is quite a mindblow. Everyone uses Goodfellow's comparison between the "money counterfeit" and the "police".
But the code is actually you training the discriminator to classify correctly the images, and then inverting the true/fake labels so the images he correctly classifies as fake will be computed as a loss(as if it had wrongly classified them), which will then provide the backpropagation.
So it's not like the generator is trying to fool the discriminator. It's actually you who's fooling the discriminator so you can backpropagate through the generator so it can learn what must be done.
hasty mountain
After getting this, things get a lot easier...and the "counterfeit x police" comparison is more of a hindrance than a help...at least for me.
rugged comet
serene scaffold
Also & should have been data cleaned
Is this another example of url encoding like %20?
serene scaffold
rugged comet
Is this another example of url encoding like `%20`?
probably. I'm not even sure what that means
rugged comet
Some of the strings in the keyword column had %20 instead of a space.
rugged comet
@serene scaffold After taking your advice about cleaning the data during EDA, the most common non-stopwords become much more interesting.
https://www.kaggle.com/code/urkchar/determine-if-tweet-is-about-disaster?scriptVersionId=111806517


Explore and run machine learning code with Kaggle Notebooks | Using data from Natural Language Processing with Disaster Tweets
bold timber
Hello guys, I have a question about RNN: Whether the number Weight for each hidden layer in RNN models is the same?
serene scaffold
rugged comet
<@253696366952316929> After taking your advice about cleaning the data during ED...
I love that california is a top disaster word
 misty flint

 abstract saddle
hi
 arctic cliff
class Activation_SoftMax:
    def forward(self, inputs):
        exp_values = np.exp(inputs-np.max(inputs, axis=1, keepdims=True))
        output = exp_values / np.sum(exp_values, axis=1, keepdims=True)
        return output
-np.max(inputs, axis=1, keepdims=True)
Why did we have to subtract the max value of every feature from the batch?
Nevermind, I figured it out, It's because (e^a very high number) can equal 0
Which can lead to dead neurons
So should I just avoid using ReLU completly and stick to Leaky ReLU?
south sundial
how effective is matching a string, tokenized by whitespace, against another string vs other methods of intent matching techniques (chatbots)
as in, the match is made depending on how many of the individual tokens (usually words) are present in another string
 frank edge
hi everyone
https://www.usu.edu/math/schneit/StatsStuff/R/Inference_ConfInt.html
i want to know why in iris dataset they choose alpha=0.05?
mint palm
hasty mountain
Hey, can you send the link to that video you're watching?
I want to try to make ...
theres a plus and minus: code is provided but only for testing
 lethal barn
hello is anyone familiar with tflite
i am trying to visualize my model performance, i have done so on tf2 but am having a hard time getting it for my tflite model
would like to metrics such as loss, accuracy per training epoch
mild dirge
Hey, maybe a bit off-topic, but I'm looking at udemy courses on DS, thinking about maybe doing one. But I see a lot of them being 85 euros, and then getting discounted to 10. Seems a bit scammy no? Do people recommend udemy?
misty flint
mild dirge
Hey, maybe a bit off-topic, but I'm looking at udemy courses on DS, thinking abo...
it goes up and down in cycles. think theres set periods every month. i hate that about udemy but theres some decent courses out there
wooden sail
if you're a student, you can apply for "financial aid" on coursera. they almost never reject it, and you get free access to the courses and certificates
(just throwing it out there, idk how udemy works)
 twilit oracle
How would you know which activation function to use on a layer in a neural network, I think im starting to understand what exactly a activation function im just not get how you would know that you need a particular one for a modal
 tidal bough
In theory any activation function can train to any data, it's just a matter of how long it will take/how good the result will be. Nowadays one mostly uses RELU I believe (sigmoids and tanh are the oldest, but eventually it was discovered that RELUs work about as well despite being far simpler).
twilit oracle
yeah i see alot of models use the RELU
so does it mostly depend on the loss function?
tidal bough
It just doesn't matter much at all, AFAIK, what activation functions you use in the intermediate layers, regardless of your loss function. (It does matter what the activation function of your very last layer is, though, because that determines the output range of your data - sigmoid activations are [0,1], tanh is [-1,1], RELU is [0, inf], etc.)
twilit oracle
So would sigmoid be the best if your neural network has only two outputs?
hasty mountain
mint palm
theres a plus and minus: code is provided but only for testing
No problem. I won't be able to understand their code anyway.
If the paper explains their idea (preferably in details), it's enough
Thanks!
hasty mountain
wooden sail
if you're a student, you can apply for "financial aid" on coursera. they almost ...
Bruh... I love you
Do you have any course to recommend on attention layers?
Oh, I found some about the Transformer. Close enough
There's one that also explains about Reinforcement Learning...but only about Q-Learning... Meh... TD-Learning seems more interesting...
tidal bough
twilit oracle
So would sigmoid be the best if your neural network has only two outputs?
Sure, a simple way to implement a 2-class classifier is to have the final layer have 1 output with a sigmoid activation, and interpret that activation as probability
for more than 2 classes one generally uses softmax, which is kinda like a generalization of a sigmoid
twilit oracle
great im asking because i making a model for this dataset i found on wine quality there is 1600 samples each ranging from 0-10 wine quality but im not sure how im going to have the last layer
hasty mountain
twilit oracle
great im asking because i making a model for this dataset i found on wine qualit...
Consider using Log Softmax. People say it tends to make the model more stable.
twilit oracle
oh ok thank you
young granite
whuzz up guys 😄
young granite
guys,
im trying to "combine" 2 df cols like so:
test_list = []

def combine_real_imag(df):
    pair_len = (int)(len(df.loc[:, "real_x-1":].columns)/2)
    for i in df.index:
        for n in range(pair_len):
            temp_df = df.loc[[i]]
            temp_df["x-"+str(n+1)] = temp_df['real_x-'+str(n+1)] + 1j*temp_df['img_x-'+str(n+1)]
            test_list.append(temp_df)
        #df.drop(df.loc[:, 'real_x-'+str(n+1):'img_x-'+str(pair_len)], inplace=True, axis=1)

combine_real_imag(test_df)
test = pd.concat(test_list)
test.head()
this kinda works, however it creates n-times rows for each index and i dont get it fixed so it only creates one combined any suggestions?
serene scaffold
young granite
guys,
im trying to "combine" 2 df cols like so:
```py
test_list = []
def combin...
pd.concat?
young granite
serene scaffold
pd.concat?
i was thinking to maybe store as np.array first and then concat afterwards
u speaking bout concat inside the loop right?
serene scaffold
no, I don't know what your code does. I'm just going by "combine 2 df cols"
young granite
serene scaffold
no, I don't know what your code does. I'm just going by "combine 2 df cols"
the rows i want to concat are always next to each other but not all and the col name changes
serene scaffold
young granite
the rows i want to concat are always next to each other but not all and the col ...
please do print(df.head().to_dict('list)) for both dataframes before we continue
young granite
serene scaffold
please do `print(df.head().to_dict('list))` for both dataframes before we contin...
Columns: [value1, value2, value3, value4, value5, real_x-1, img_x-1, real_x-2, img_x-2, real_x-3, img_x-3, real_x-4]
the second df is created inside the loop so there is only one df at the startingpoint
serene scaffold
young granite
```py
Columns: [value1, value2, value3, value4, value5, real_x-1, img_x-1, real_...
that's not what I asked for. I'll only continue when you do the print statement I said.
it can just be the df as of the start of the loop.
young granite
serene scaffold
that's not what I asked for. I'll only continue when you do the print statement ...
{'value1': [], 'value2': [], 'value3': [], 'value4': [], 'value5': [], 'real_x-1': [], 'img_x-1': [], 'real_x-2': [], 'img_x-2': [], 'real_x-3': [], 'img_x-3': [], 'real_x-4': [], 'img_x-4': []}
however there are values in the cols but i cant share rn
serene scaffold
let me know when you can share them.
young granite
serene scaffold
let me know when you can share them.
just imagine random numbers?
 vernal anchor
hey! does anyone know how to apply svm on 1d data?
 steel forge
How important is linear algebra in ai?
young granite
steel forge
How important is linear algebra in ai?
strong
mint palm
does it make sense to use feature extractor followed by embedding layer
are should i assume them to be unrelated
hasty mountain
mint palm
does it make sense to use feature extractor followed by embedding layer
Embedding layers usually expect one-hot encoded/label encoded inputs, so...maybe not?
You could try conditioning the embedding output based on the feature extractor output
steel forge
young granite
strong
thx
 primal iris
hello
so i visualized some data using kmeans and pca
and i got some result but i really don´t know what does it mean


i've projected it in 3d and 2d
the data seems very close to each other in 2d
fallen crown
Is a dataset of 180 features too little ? My test_set is only 20 features
spare briar
features in train and test set should be the same
fallen crown
spare briar
features in train and test set should be the same
I think it is recommanded to have 20% of datas in the test_set ?
tidal bough
fallen crown
Is a dataset of 180 features too little ? My test_set is only 20 features
i think you're mistaking features and points. Number of features is, roughly speaking, how many values each of your datapoints have.
spare briar
for each sample (point) you measure a bunch of features
you split the samples, not the features
young granite
fallen crown
Is a dataset of 180 features too little ? My test_set is only 20 features
what model u use ~200 should work ok i guess
spare briar
so you meant that you have 180 samples and 20 samples in your test set?
fallen crown
yess
spare briar
there isn't a general answer to your problem, it depends on the effect size and variance
if the problem is easy you need fewer samples
fallen crown
My model worked but the score of the model varies a lot depending on the the split of dataset( train_set and test_set)
spare briar
this is called overfitting
fallen crown
okeyy, can the cause be the number of transformers i used during pre-processing ?
hasty mountain
It might be more related to your features or to your model's (hyper)parameters
fallen crown
I tried to hone too much by using too many transformers ? (encoding, normalization, imputation....)
hasty mountain
Oh...then maybe...
fallen crown
young granite
if all ur points are pre-treated equally thats fine
Yes i used a pipeline
spare briar
what is your model
fallen crown
pipeline = make_pipeline(PolynomialFeatures(), KNeighborsClassifier())
param_grid = {
    'polynomialfeatures__degree' : np.arange(1,10),
    'kneighborsclassifier__n_neighbors' : np.arange(1, 20)
}
grid = GridSearchCV(pipeline, param_grid, cv = KFold(3))
grid.fit(X_train, y_train)```polynomial degree is probably too high*
fallen crown
depending on how my dataset is splited, my score is 0.83, 0.73, 0.95....
fallen crown
spare briar
polynomial degree is probably too high*
the best_model is always with degree 1
spare briar
you should learn about bias variance tradeoff
fallen crown
what is it, anothr transformer ?
spare briar
oh ok so the grid search is over polynomial degree
yeah i expect that the linear classifier is best with such small dataset
fallen crown
spare briar
oh ok so the grid search is over polynomial degree
yes and n_neighbors
fallen crown
spare briar
yeah i expect that the linear classifier is best with such small dataset
Okkey i will try, thank you
spare briar
this is based on the very minimal incomplete info youve given 😆
in the future you should give more info in the original question
fallen crown
I know how tu use pipeline and transformers, estimators but I do not really have an idea when use one rather than another
fallen crown
spare briar
in the future you should give more info in the original question
yess sorry, i will
But do you know where i can get ressources to learn more about the choice to use one rather another transfromer, estimator...
Because it is a little confuse in my head
 valid wind
Hello, I am attempting to make a recommender system using deep learning. However, I want the model to be updated as soon as we receive new information from new users, is there a way to update the model just based on new data or is this not possible?
I am using pytorch
spare briar
@valid wind https://arxiv.org/abs/2209.07663

arXiv.org
Building a scalable and real-time recommendation system is vital for many
businesses driven by time-sensitive customer feedback, such as short-videos
ranking or online ads. Despite the ubiquitous...
 rare socket
any suggestions for genetic algorithm libraries? I am not sure which to chose
I'm trying PyGad but the import is not being recognized
 worldly dawn
rare socket
any suggestions for genetic algorithm libraries? I am not sure which to chose
worldly dawn
rare socket
any suggestions for genetic algorithm libraries? I am not sure which to chose
https://github.com/DEAP/deap is also a popular one on python.
That said, it sounds like your problem is more with python libraries than pygad specifically?
rare socket
worldly dawn
<https://github.com/DEAP/deap> is also a popular one on python.
That said, it so...
I am not sure what would cause this problem. If you have ideas let me know
worldly dawn
rare socket
I am not sure what would cause this problem. If you have ideas let me know
I am missing way too much information to say anything.
rare socket
all I did was "pip install pygad" and import pygad. It doesnt recongnize the module, that's it
worldly dawn
rare socket
all I did was "pip install pygad" and import pygad. It doesnt recongnize the mod...
any error?
worldly dawn
but what about the pip install part?
If it can't find the module it means something isn't there or looking at the wrong place
rare socket
I'm not sure. It's downloading fine
worldly dawn
What does it say?
rare socket
This is when I try and pip install again. The original downloading text is gone
 worldly dawn
What are the last lines displayed when you install it?
rare socket
When I installed it for the first time?
bright pasture


Welp. It's finally here, Peppa Pig Diff-SVC. Yep. It's Peppa Pig her-fucking-self. I am so sorry. Song is "Find My Voice".
 Twitter
·
Twitter
·
Welp. It finally happened.
worldly dawn
bright pasture
https://twitter.com/DesukaP/status/1595473585325641729?s=20&t=TqagaWdOPMTgugIGiF...
Hi ! It's not a shitposting channel
bright pasture
This is not a shitpost by any means.,
This is a legitimate thing I did with machine learning.
serene scaffold
bright pasture
This is a legitimate thing I did with machine learning.
if it is about machine learning, you should say what's interesting about it in the same message that you post it. This server is for help and discussions, so doing dump-and-run with a link isn't very useful.
worldly dawn
bright pasture
This is a legitimate thing I did with machine learning.
Providing some context and intro may help 😉
It will help prop up a discussion. So feel free to include how you did it, why it's interesting, etc.
serene scaffold
Usually, if people post a link with no context, the default assumption is that it's spam.
bright pasture
Okay, well, I used an open source machine learning thing called DIff-SVC, a vocoder which can replicate any voice as long as you have clean wav files of it. The voice dataset was only under four minutes, yet the quality is more than astounding. Inferencing voices relies on reference audio instead of inputting notes.
worldly dawn
bright pasture
Okay, well, I used an open source machine learning thing called DIff-SVC, a voco...
congrats!
bright pasture
Thank you! It took a while for me to be able to train voices properly, but the results are amazing.
thorn zephyr
fallen crown
the best_model is always with degree 1
two is better.
brave sand
how do u guys find implementations for real life with RL algorithms?
hasty mountain
brave sand
how do u guys find implementations for real life with RL algorithms?
Don't automate cars use RL algorithms?
Maybe also robots in some factories?
Maybe you could try searching something related to those things
rugged comet
https://www.kaggle.com/code/urkchar/determine-if-tweet-is-about-disaster
I am seeking some more feedback on this project. Now with increased exploratory data analysis.
Explore and run machine learning code with Kaggle Notebooks | Using data from Natural Language Processing with Disaster Tweets
One thing I'd like to do is visualize the learned embeddings with t-SNE.
lethal barn
hello is anyone familiar with tflite
i am trying to visualize my model performance, i have done so on tf2 but am having a hard time getting it for my tflite model
would like to metrics such as loss, accuracy per training epoch
 red hornet
when you're using kmeans++ to pick your initial k points for kmeans clustering, the very 1st k-point is chosen at random and then kmeans++ is used to select every other k-point, right?
mint palm
my supervisor often says we dont have such somputational resource to train model from "some" research paper.
my question is how do i know if we wont able to train? we have 7 gpus(NVIDIA GeForce RTX 3090, 24 gb) , 500 gb ram
 split drift
Is there an efficient method to compare value with nan, and return nan at the nans location?
Actual behavior:
np.array([np.nan]) > 5 ' --> 'array([False])
Desired behavior:
np.array([np.nan]) > 5 ' --> 'array([nan])
.
tidal bough
split drift
Is there an efficient method to compare value with nan, and return nan at the na...
Hmm, np.where(np.isnan(arr), arr, arr>5)?
though what concerns me is what the dtype of the result'd have to be. A nan is a float, but a bool is basically an int.
split drift
tidal bough
though what concerns me is what the dtype of the result'd have to be. A nan is a...
0, 1, np.nan is good enough as a result
You solution is faster than what I tried to do to solve it, but it still too slow
the check where the nans is, make it takes X10 times more than without
tidal bough
maybe try if
res = arr.copy()
inds = arr!=float("nan")
res[inds] = arr[inds]>5
is faster, it's weird if a nan check is slow - it should in theory just be a comparison with nan
wait a minute
nan doesn't compare equal with itself, does it
yeah, it doesn't. So you do have to use isnan
cursed thought - view the array to uint64 and compare to np.nan, also cast to uint64 🥴
serene scaffold
ironically, float('nan') is float('nan') will be True, but it's still special cased to always compare as False
tidal bough
tidal bough
cursed thought - view the array to uint64 and compare to `np.nan`, also cast to ...
nans only have one possible bit representation, right?
serene scaffold
aren't values like nan and inf stored in the range of n / 0?
tidal bough
tidal bough
nans only have one possible bit representation, right?
oh no

that kinda explains why isnan is slow tbh - it's a whole range of possible bit-values
actually...
I'm not getting it being slow

and for arr=np.random.random(10**7) too - it's about as fast as a comparison
tidal bough
split drift
the check where the nans is, make it takes X10 times more than without
so I'm not sure why you're getting a 10x slowdown, maybe profile it?
split drift
I am doing it on 1m rows, which some of them are nans
I am actually working with pandas series, and doing .dropna() prior to the comprehension also slow it significantly
 scenic tulip
@split drift dropna(inplace = True)
Otherwise I'd preprocess whatever data set you have before hand for NaN values, delete them, then continue with your calculations.
serene scaffold
scenic tulip
<@463431557634457610> dropna(inplace = True)
don't do any inplace operations, though
split drift
@tidal bough Thanks, your solution was the second best!
I updated my post on stackvoerflow with your solution and gave you some credit:
https://stackoverflow.com/questions/74559166/is-there-an-efficient-method-to-compare-ndarrays-and-to-keep-the-nans-at-their-l

Stack Overflow
is there efficient method (in numpy or pandas) to compare ndarray that contains nans with other array, while keeping the nans, instead of replacing them with false?
Actual behavior:
np.array([np.na...
tidal bough
huh, I'm very surprised
res = (s > 1).astype('boolean')
res.loc[s.isna()] = np.nan
is fast
because in my mind, that'd need res to be recast from bool to float for the nan assignment
split drift
I was suprised too,
but runing on 1m rows, this one took 3.25 seconds and your solution took (while keeping pandas indexes), took about 5.5 seconds
tidal bough
split drift
I was suprised too,
but runing on 1m rows, this one took 3.25 seconds and your s...

that's because it results in trues where you ask for nans
the nans get cast to bool and end up True
split drift
someone just down voted my post lol
tidal bough
lol, SO greatness
split drift
tidal bough
the nans get cast to bool and end up True
don't you mean to False?
the nans are casted to false
tidal bough
split drift
don't you mean to False?
no, I don't - it's elements 0, 3, 6, etc that get assigned to nan here, and end up True
tidal bough
arr = np.random.random(10**7).astype(np.float64)
arr[np.random.random(len(arr))<0.1]=np.nan

%%timeit
res = np.where(np.isnan(arr), np.nan, arr > 0.8)

%%timeit
res = (arr > 1)
res[np.isnan(arr)] = np.nan # doesn't work, result is a bool

%%timeit
res = (arr > 1).astype(np.float64)
res[np.isnan(arr)] = np.nan

second one is indeed fastest, but it's wrong
third one is the second one but correct, and funnily enough slower than first


 split drift
tidal bough
```py
arr = np.random.random(10**7).astype(np.float64)
arr[np.random.random(len(...
split drift
tidal bough
```py
arr = np.random.random(10**7).astype(np.float64)
arr[np.random.random(len(...
it would work with pandas series
s = pd.Series([1, 2, 3, np.nan]) res = (s > 1).astype('boolean') res.loc[s.isna()] = np.nan
tidal bough
split drift
not sure what you mean
tidal bough
split drift
it would work with pandas series
`s = pd.Series([1, 2, 3, np.nan])
res = (s > 1)...
huh, it does? like, produces a result with bools and nans? is this some masked arrays magic, I wonder?..
split drift
tidal bough
not sure what you mean
comprehension with nans, is casted to false, while setting certain values to nan is set to true
tidal bough
ah, I see what you mean. yeah, bool(nan) is True but nan > anything is False
this actually makes sense if you think about bool(x) being equivalent to x!=0. Nans aren't zero, so they are truthy. But they also don't have any placement among the other floats.
split drift
Where is your god now?
 split drift
tidal bough
this actually makes sense if you think about `bool(x)` being equivalent to `x!=0...
split drift
tidal bough
this actually makes sense if you think about `bool(x)` being equivalent to `x!=0...
Interesting, but also not intuitive
tidal bough
tried this one hoping to save time on initializing memory, but it's actually slow:
res = np.empty_like(arr)
np.greater(arr, 0.8, out=res)
res[np.isnan(arr)] = np.nan
and this one is the worst, 200ms
res = np.empty_like(arr)
inds = np.isnan(arr)
notinds = ~inds
res[notinds] = arr[notinds]>0.8
res[inds] = np.nan
another thing to consider would be numba
split drift
That's okay,
if I am fine with casting the nans to false ,it takes 1.2 seconds, and the best solution that keeps the nans takes 3.25 seconds, I can live with that
its not close ,but its not that much iterations, that it worth to invest any more time in it
Thanks again (:
tidal bough
argh, numba doesn't support 3.11
split drift
what is numba
tidal bough
you write a function, carefully not doing anything but some supported operations, slap a @njit on it, and numba compiles that function with LLVM for glorious speeds
and working on numpy arrays is mostly supported
oh hey
tidal bough
split drift
what is numba
🥴

that's a 1.5x speedup or so, from a very straightforward function
@njit
def process1(arr):
    res = np.empty_like(arr)
    for i in range(len(arr)):
        el = arr[i]
        if np.isnan(el):
            res[i] = np.nan
        else:
            res[i] = el>0.8
    return res
njit is numba.njit
serene scaffold
tidal bough
that's a 1.5x speedup or so, from a very straightforward function
```py
@njit
de...
I was really upset to see range len, but then I saw njit. 
 glacial trench
Hi, got a quick PySpark question
I have a column in float format, but when I try to use the .describe() method on it to check the count, mean, std dev, min, max, etc. it tells me it's a string. Same goes for other columns like id.

 keen root
Hi,I need some help understanding pytorch autodiff engine. So I have the following:
sum0-> a 1d tensor which is a single scalar tensor with a grad_fn
sum1-> a 1d tensor which is a single scalar tensor with a grad_fn
if I now create a tensor as torch.tensor([sum0,sum1]) it does not appear as it has any gradient function. How come?
spare briar
have you read this? https://pytorch.org/docs/stable/autograd.html
tidal bough
glacial trench
Hi, got a quick PySpark question
I have a column in `float` format, but when I t...
I think that's because the description is a dataframe of several strings. Show it somehow, perhaps print?
iron basalt
tidal bough
🥴
Numba can speed up individual numpy functions too by simply wrapping them in a jitted function.
 fast ridge
Can anyone give me a beginner friendly data science project to work on.
Note: this will be my 2nd or 3rd project
 drowsy timber
hi! i have some SVD exercises and I was hoping if someone can help me interpret these plots. Thanks!
This is plotted from the wine dataset in sklearn

 bronze prism
I trained a model with XGBRegressor and saved the model with pickle. Before training the model, I applied "LabelEncoder" and "MinMaxScaler" to my data, I want to receive data from the user and produce a response with this model, but can I make a prediction without applying the changes made by LabelEncoder and MinMaxScaler to the data?
 fast cairn
Hello. I just want to know how to create neuron Network ai or something like thys?
serene scaffold
fast cairn
Hello. I just want to know how to create neuron Network ai or something like thy...
Do you know very much about linear algebra and calculus?
serene scaffold
fast cairn
No
You need to know those to understand neural networks. You also need to know what you want the network to do
fast cairn
serene scaffold
You need to know those to understand neural networks. You also need to know what...
Ok I know what it will do but I cant explain it
 boreal gale
bronze prism
I trained a model with XGBRegressor and saved the model with pickle. Before trai...
boreal gale
bronze prism
I trained a model with XGBRegressor and saved the model with pickle. Before trai...
even if you can, the predictions will unlikely to be correct. you should apply your LabelEncoder and MinMaxScaler to your user input as well.
but what i recommend is to look into https://scikit-learn.org/stable/modules/generated/sklearn.pipeline.Pipeline.html for the correct way of solving a "user input -> model prediction" task in an end-to-end fashion.
serene scaffold
fast cairn
Ok I know what it will do but I cant explain it
You'll need to learn array arithmetic and how to calculate derivatives and partial derivatives before you can continue, so you might as well start with that
fast cairn
serene scaffold
You'll need to learn array arithmetic and how to calculate derivatives and parti...
I just never knowed about those Word exist Xd i justearn more about they
fast cairn
serene scaffold
You'll need to learn array arithmetic and how to calculate derivatives and parti...
Ummm i end learnin about they like 8 years later
fast cairn
serene scaffold
You'll need to learn array arithmetic and how to calculate derivatives and parti...
I cant Google evrything and learn i have to learn sooo many things....
serene scaffold
@fast cairn those are the things you need to learn before you can learn neural networks, and that's all I have to say about that.
fast cairn
Yeah i know ):
hasty mountain
fast cairn
Yeah i know ):
It's not hard, you know...
I mean...except for derivatives in trigonometric functions
How I hate trigonometric functions...
Also, beware for the chain-rule in derivatives.
It can be confusing...
curiously, I could finally understand how it works after I learned how the stochastic gradient descent works
 timid kiln
Hopefully this is the right channel to post this. Rather than clock up the channel I put this in a help channel:
need some help over in #help-pineapple taking an existing table of data and using groupby to sum up based on a value. Your help is much appreciated!
glacial trench
Hi, how can I make the test column something like 0, 1, 0, 1, 0
 arctic wedgeBOT
@charred egret :white_check_mark: Your 3.11 eval job has completed with return code 0.
001 |    column1  test
002 | 0        a     0
003 | 1        b     1
004 | 2        c     0
005 | 3        d     1
006 | 4        e     0
007 | 5        f     1
008 | 6        g     0
009 | 7        h     1
010 | 8        i     0
011 | 9        j     1
... (truncated - too many lines)
Full output: https://paste.pythondiscord.com/yiqodeluje.txt?noredirect
serene scaffold
that looks like a numpy version of df_temp['test'] = (df.index % == 0).astype(int)
 serene plume
import scipy.spatial.distance as spd

pairwise_sims = spd.pdist(matrix, metric=np.dot)
This is horribly slow because the metric=np.dot is not vectorized. How can I achieve the same - a sequence of pairwise dot products on the matrix rows - but vectorized?
Please ping me if you reply
serene scaffold
@serene plume np.dot by itself is vectorized, is it not? Is the problem that pdist calls it a bunch of times separately (like in a loop)?
Because I'm not sure how to solve that except to re-implement the whole work of pdist with numpy/numba, so that it does the whole batch of calculations as one vectorized thing.
Actually, the solution might be to just do one call to np.dot but after reshaping the arrays a certain way
I'll have to think about it later. Sorry
serene plume
serene scaffold
<@458440277548335125> np.dot by itself is vectorized, is it not? Is the problem ...
Exactly
I'll have to think about it later. Sorry
Reshaping the arrays...Yeah I'll think about it too, but my brain's fried rn, thank you 🙏
Maybe I could get the 2-combinations of rows and split the pairs into two matrices to use np.dot on...idk, I'll revisit it tomorrow
rugged comet
Given this correlation heatmap, for the three targets, which features would you train on and why?
 spare briar
is your goal a predictive model or would you like to interpret coefficients
rugged comet
spare briar
is your goal a predictive model or would you like to interpret coefficients
A predictive model.
 winged yew
any pandas function to covert multiple column at once???
 untold bloom
if by "covert" you meant "change datatypes of", then .astype is capable of that
cols = ["col_1", "col_2", ...]

df[cols] = df[cols].astype(...)
it can take a single datatype, e.g., int or "Int64"
it can also take a mapping of the form "col_name -> dtype" where "dtype" is a single datatype exemplified above
.astype can work on a Series or a DataFrame; and df[cols] where cols is a list of column names, is yet another dataframe, so it works.
it's not inplace, so need to re-assign the result.
mellow wraith
I'm having some trouble with efficiency, I have a very simple gradio webui setup. Essentially, I'd like to keep my diffusion model loaded in vram without having to load and unload it every run. However, when I keep things loaded using a gradio state, it consumes significantly more vram and I'm not sure why.
small test repo https://github.com/CoffeeVampir3/vampire-webui
The abridged version:
pipeline = gr.State(value = dp.load_pipeline)
app_inputs = [pipeline, prompt_textbox, negative_prompt_textbox, seed, num_inputs_slider, width_slider, height_slider, num_steps_slider, cfg_slider]
app = gr.Interface(fn=dp.testpipeline, inputs=app_inputs, outputs=[output_img, pipeline], allow_flagging="never")

def load_pipeline():
    #load model stuff ..
    torch.cuda.empty_cache()
    torch.cuda.synchronize()
    return pipe

def testpipeline(pipe, prompt, neg_prompt, seed, num_images, width, height, num_steps, cfg):
    #do stuff
    torch.cuda.empty_cache()
    torch.cuda.synchronize()
    return images, pipe
It seems like the global state is loading my model more than once
mellow wraith
-- gradio does indeed copy the state, using globals fixes this issue 👍
glacial trench
thanks
 lost trail
hi
 fluid spindle
Hello people
Can someone help me about comprehend these neural network hidden layers activation functions
serene scaffold
fluid spindle
Can someone help me about comprehend these neural network hidden layers activati...
more layers in the neural network means more opportunities for the network to learn subtle relationships between the features.
hasty mountain
serene scaffold
more layers in the neural network means more opportunities for the network to le...
I think he means softmax, tanh, ReLU...
serene scaffold
hasty mountain
I think he means softmax, tanh, ReLU...
I assumed he meant "help me understand hidden layers and activation functions"
but good point
serene scaffold
fluid spindle
Can someone help me about comprehend these neural network hidden layers activati...
activation functions are what allow the network to learn non-linear relationships between features
no matter how many layers you have, if you don't use non-linear activation functions, it's basically the same as having one layer.
hasty mountain
Ok, I didn't know about that
Interesting
Maybe that explains some things in my models
serene scaffold
hasty mountain
Interesting
*Maybe that explains some things in my models*
you can always do any linear transformation in one step. so no matter how many linear transformations you do in order, you can always get from the first step to the last step in one linear transformation
so the nonlinear activation functions create intermediary states that can't easily be recreated without going through the network.
hasty mountain
serene scaffold
you can always do any linear transformation in one step. so no matter how many l...
Hm... So wouldn't this make the ReLU function and its derivatives (Leaky ReLU) kinda disposable?
I mean...a layer could learn that inputs < 0 should be multiplied by 0 and, then, this would output a 0.
serene scaffold
hasty mountain
Hm... So wouldn't this make the ReLU function and its derivatives (Leaky ReLU) k...
it's still nonlinear. though I don't fully understand how it works as compared to softmax et al.
 hasty mountain

serene scaffold
I'm starting grad school in january. hopefully I can test out of intro to AI. I still have a lot to learn about deep learning though.
hasty mountain
I can quite understand softmax sigmoid et al, but now I got confused with ReLU and tanh...
I thought activation functions were more of a facilitator to the neural network
serene scaffold
they are, for the reasons I said.
hasty mountain
Instead of spending hours of training so my model learns that I want outputs within range [-1, 1], I can simply apply a tanh function and voilá
serene scaffold
you're talking about using them as a squashing function for the output layer?
hasty mountain
Yes
serene scaffold
well, they can do that too, I guess
fluid spindle
I was tracking this course with the source book
Timestamp of the part I didn't understand after watching 4 times is this: https://youtu.be/gmjzbpSVY1A?t=760

Neural Networks from Scratch book, access the draft now: https://nnfs.io
NNFSiX Github: https://github.com/Sentdex/NNfSiX
Playlist for this series: https://www.youtube.com/playlist?list=PLQVvvaa0QuDcjD5BAw2DxE6OF2tius3V3
Spiral data function: https://gist.github.com/Sentdex/454cb20ec5acf0e76ee8ab8448e6266c
Python 3 basics: https://pythonprog...
I essentially didn't get how he calculated any value except w1=6
wooden sail
hasty mountain
I mean...a layer could learn that `inputs < 0` should be multiplied by 0 and, th...
this is a nonlinear operation
hasty mountain

wooden sail
do you know what (non)linear means?
hasty mountain
wooden sail
do you know what (non)linear means?
I thought I did, but it seems I don't
serene scaffold
serene scaffold
it's still nonlinear. though I don't fully understand how it works as compared t...
@hasty mountain this function might basically be two lines, but the whole function has to be one straight line to be linear.
wooden sail
serene scaffold
<@388857837222100993> this function might basically be two lines, but the whole ...
this is also not right
serene scaffold
oh
wooden sail
.latex linearity refers to functions that satisfy the properties
[
f(ax) = af(x)
]
and
[
f(a+b) = f(a) + f(b)
]
 strange elbowBOT
Failed to render input.
No logs available.
serene scaffold
the latex thing is broken.
wooden sail
sigh, the bot is tripping
 desert bear
Hey, I have a question regarding undirected graph clustering. I have a data (over 300m records) of user comments under youtube videos. I want to build a graph representing videos that were commented by the same user. I want to cluster it in order to obtain the topics of videos.
Any idea on which algorithm to use (must be efficient, because the data is very large)?
wooden sail

this, for example, does NOT include functions of lines of the form y = mx + b. it DOES include integrals and derivatives, among other stuff you wouldn't immediately think "linear" about
serene scaffold
desert bear
Hey, I have a question regarding undirected graph clustering. I have a data (ove...
are you using neo4j or what?
 stone pike
You can express linearity as f(ax + by) = a f(x) + b f(y) as well which combines additivity and homogeneity in one line.
hasty mountain
wooden sail
this, for example, does NOT include functions of lines of the form y = mx + b. i...
Oh... I see...
serene scaffold
desert bear
Hey, I have a question regarding undirected graph clustering. I have a data (ove...
also, "a graph representing videos that were commented by the same user" and "clustering the videos by topic" seem to be unrelated concerns. if you're inferring the topic of each video by the content of the comments, which users commented on the same videos is sort of irrelevant.
hasty mountain
hasty mountain
Oh... I see...
But then...a neural network layers don't use linear operations? Since the output is out = w*in + bias
wooden sail
you're correct
the W x part is linear, where W is a matrix and x is a vector
once you add the bias, it becomes an affine transformation
neural networks do affine transformations, composed with nonlinear ones
serene scaffold
wooden sail
this is also not right
not sure how what you said conflicts with what I said. is f(x) = 0 and f(x) = x not two linear functions?
wooden sail
affine transformations can also be represented as linear ones by lifting into one dimension higher though
hasty mountain
Oh...
wooden sail
serene scaffold
not sure how what you said conflicts with what I said. is `f(x) = 0` and `f(x) =...
yes, but the equation of a line in general is mx + b, which is affine, not linear
i.e. it does not necessarily cross the origin
hasty mountain
So...if I use a layer without bias, I can remove the ReLU activation that would come after it(at the expense of risking more training time)?
wooden sail
hasty mountain
So...if I use a layer without bias, I can remove the ReLU activation that would ...
no, because the relu is anyway not linear
and affine transformations cannot mimic more general nonlinear functions
hasty mountain
Oh...
So without bias = linear
With bias = non-linear, but can't mimic nonlinear functions
I see
wooden sail
if you don't use an activation function, you can anyway represent nested affine transformations as a single affine transformation, similar to how you can do this with linear ones
serene scaffold
what is affine?
hasty mountain
So... this is why keras refer to FCC layers as "Linear" layers...
serene scaffold
just y = mx + b?
hasty mountain
wooden sail
transformations that preserve lines and parallelism
e.g. rigid transformations like rotations, offsets, etc
desert bear
serene scaffold
are you using neo4j or what?
Python
wooden sail
the proper definition requires talking about affine spaces
desert bear
serene scaffold
also, "a graph representing videos that were commented by the same user" and "cl...
Well, I was thinking about checking whether users comment only videos of certain topic
that's why I would build a graph of nodes that would be connected by the link if they were commented by the same users
serene scaffold
desert bear
that's why I would build a graph of nodes that would be connected by the link if...
suppose you have Video and User nodes. if you want to figure out the topics of the Videos by which Users comment on them, you have to know what topics those Users care about
but I think it would make more sense to tag each Video based on the comments (regardless of who says them), and then make inferences about the Users based on which videos they watch.
desert bear
Well I have access to video's description, so I could label videos according to topic with NLP
serene scaffold
yes, you could do that, too
desert bear
I don't have access to textual comments unfortunately
serene scaffold
the title + description might be enough
desert bear
just to commentor_id, video_id, number_of_likes under comment and replies
desert bear
serene scaffold
the title + description might be enough
Yea
do you know about any algorithms, methods that I could use, after I build this graph?
Also I can apply a weight to each link, e.g. number of users that commented under two videos
 serene scaffold
desert bear
do you know about any algorithms, methods that I could use, after I build this g...
serene scaffold
desert bear
do you know about any algorithms, methods that I could use, after I build this g...
if you're not using neo4j (which is a graph database system), you should make the graph with networkx. and you can look in the networkx docs to see what algorithms they have. don't worry about how efficient you think they're going to be until you've actually used them.
desert bear
Yea, I know this library. But wouldn't that be computantionaly expensive to use it. I expect the graph to be very large since I have over 300 millions of records
serene scaffold
you're pre-maturely optimizing
if the whole graph fits on your RAM, just use networkx normally.
desert bear
alright, I might give it a try. It's still better that using a matrix to draw connections
I am using aws for computing, so If I encounter problems with ram, I will use bigger machines
Okay, thank you. I'll let you know when I am done with networkx
tidal bough
stone pike
You can express linearity as `f(ax + by) = a f(x) + b f(y)` as well which combin...
It doesn't, your snippet is just equivalent to f(x+y) = f(x) + f(y). You likely meant for that a to be inside.
I'm used to writing it as for any vectors v,u and scalars a,b, f(a*v + b*u) = a f(v) + b f(u) myself, though that's equivalent.
stone pike
Thanks for the correction, you are right. I meant it to be inside.
 uncut raptor
hi
lapis sequoia
hi, i'm new here! Can i post here my question about pandas pivot (my personal issue)?
serene scaffold
lapis sequoia
hi, i'm new here! Can i post here my question about pandas pivot (my personal is...
you can! the best way to get pandas help is to start by showing a text sample of the dataframe, usually with print(df.head().to_dict('list')), and then you can explain the transformation you want.
the reason being that you often have to state exactly what the schema of the dataframe is for anyone to comment
lapis sequoia
python
import pandas as pd
import numpy as np
data = [['A', 1, 1, 200, 2, 123], ['B', 3, 2, 300, 2, 123], ['C', 4, 3, 0, 2, 123]]
df = pd.DataFrame(data, columns=['name', 'draw', 'result', 'earns', 'age', 'hour'])
print(df)
  name  draw  result  earns  age   hour
0    A     1       1    200    2    123
1    B     3       2    300    2    123
2    C     4       3      0    2    123

# WORKS ONLY FOR 1 FEATURE
df.pivot(index="hour", columns="draw", values="earns").reindex(columns=range(1, 4+1), fill_value=-1)

# DESIRED
features = ['age', 'earns']
feature    age/draw_1 age/draw_2 age/draw_3 age/draw_4 earns/draw_1 earns/draw_2...
hour
123          2            -1           2          2          200        ...
more clear?
serene scaffold
lapis sequoia
python
```
import pandas as pd
import numpy as np
data = [['A', 1, 1, 200, 2, 12...
yeah, still thinking...
thanks for giving an executable example btw. super helpful
when you pivot the table, what aggregation function are you using for earns?
lapis sequoia
0 come from the object
each row is a runner
no aggs, consider it's provided from db, not an agg
for the example here i put only 2 feature, i have 122 for my concrete case, wanna achive it with simplified way
i said "earns", it can be "weight" of runner, "weight_device", "penality", juste some features