#data-science-and-ml
1 messages · Page 24 of 1
 fringe anvil
 desert oar
fringe anvil
cause i get
```
NameError: name 'surfaces' is not defined
```
desert oar
fringe anvil
cause i get
```
NameError: name 'surfaces' is not defined
```
the usual caveats apply w/ respect to untested code written by strangers
although in this case i don't see the typo
surfaces = df2['surface'].unique().to_list()
did you forget this one?
fringe anvil
desert oar
```python
surfaces = df2['surface'].unique().to_list()
```
did you forget this o...
yup totally my bad, i wasnt scrolled all the way up. this is usually my bed time. 😬
last one is empty, but the rest looks "good"

i dont have any ref image
desert oar
fringe anvil
last one is empty, but the rest looks "good"
honestly... i'm not sure. i would need a copy of the data. hopefully at least this gives you a starting point, the technique of looping over unique values and filtering
fringe anvil
desert oar
honestly... i'm not sure. i would need a copy of the data. hopefully at least th...
yeah these are more advanced than the simple stuff they show us. the jump from the lectures we get to the complexity of the problems we have to solve.. when we only been at it for a month, is kinda insane
@desert oar i cannot thank you enough for your valuable time
desert oar
fringe anvil
yeah these are more advanced than the simple stuff they show us. the jump from t...
pandas matplotlib numpy etc. stuff can be overwhelming because it's sometimes hard to know when you need to learn a new idiom within those frameworks, and when you need to apply a general programming idiom. that comes with time and practice.
desert oar
fringe anvil
<@389497659087650836> i cannot thank you enough for your valuable time
you're welcome, i think rushing students through bootcamps does them a great disservice (although it hopefully gets you started & gets you a job) and i'm happy to help offset that in whatever way i can
!code please post code as text (in a codeblock), not a screenshot. read below for instructions:
 arctic wedgeBOT
Here's how to format Python code on Discord:
```py
print('Hello world!')
```
These are backticks, not quotes. Check this out if you can't find the backtick key.
 shrewd igloo
plt.figure(figsize=(20,25), facecolor='white')
plotnumber=1
for column in data:
if plotnumber<=9:
ax = plt.subplot(3,3,plotnumber)
sns.distplot(data[column])
plotnumber+=1
plt.show()
Can someone help with understanding the code? Is there any other way I can use loops here top plot for all the columns at once?
shrewd igloo
desert oar
!code please post code as text (in a codeblock), not a screenshot. read below fo...
Posted . Thanks for the quick prompt.
desert oar
shrewd igloo
plt.figure(figsize=(20,25), facecolor='white')
plotnumber=1
for column in data:
...
the box above has instructions for adding syntax highlighting to your code
the formatting will get messed up if you try to post it as plain text
anyway, what's wrong with the current code? it just loops over columns and makes a plot for each one
shrewd igloo
desert oar
anyway, what's wrong with the current code? it just loops over columns and makes...
yes. Can we use loops here in some another way. maybe by creating a variable where I will store the column names and then using that for the loop and only those columns will be printed?
desert oar
shrewd igloo
yes. Can we use loops here in some another way. maybe by creating a variable whe...
sure, but why? i assume data is a data frame? normally i loop over columns with for column in data.columns
i don't know what that ax = is doing in there
that seems like a mistake
oh, i see
is this supposed to create a 3x3 grid?
btw distplot is deprecated and you should use displot instead
seaborn also uses its own system for creating a "faceted" grid, it's not meant to work with subplots necessarily
shrewd igloo
desert oar
i don't know what that `ax = ` is doing in there
ax is for plotting the plot at 3 plots on one lrow nd column
shrewd igloo
desert oar
btw `distplot` is deprecated and you should use `displot` instead
ok.lemme try this.
desert oar
if you really want to do this the "grammar of graphics" way, you can "melt" this dataframe and then use the melted column name indicator as the faceting variable
i am curious: why are you asking this question?
it's hard to answer if i don't understand your intentions
shrewd igloo
desert oar
i am curious: why are you asking this question?
I find it hard to understand loops so was wondering If i can use something else or a simpler version of loop for plotting the same distplot
desert oar
shrewd igloo
I find it hard to understand loops so was wondering If i can use something else ...
i see. loops are a fundamental concept and are worth spending the time to understand
the other option (the "melt" thing) i think would only be more complicated
shrewd igloo
desert oar
i see. loops are a fundamental concept and are worth spending the time to unders...
yeah. Will have to. Anyway Thanks for the help. Really appreciate it:)
 haughty pewter
plt.plot(y_test.reset_index(drop=True), "blue", label = "Real Data")
plt.plot(lr_output, "red", label = "Linear Regressor")
plt.xlim()
plt.legend()
plt.title("Test Summary")```
How does one perform linear regression predictions and scoring on line graphs like these? I don't really get it
desert oar
haughty pewter
How does one perform linear regression predictions and scoring on line graphs li...
you don't perform regression on graphs you do it on data.
what do you mean by "scoring"? what are you actually trying to do?
that looks like a time series. models work a bit differently on time series data
 slate hollow
Learning multivar calf
*calc
in school right now
and thinking “gradients? From machine learning?” gives me the same vibe as “thanos? From fortnite?”
 obsidian copper
I am unable to convert this variable to float because of these 3 values ('Not present', 'Other', 'Refused')
How do I remove these from categories??

 feral spoke
obsidian copper
I am unable to convert this variable to float because of these 3 values ('Not pr...
feral spoke
obsidian copper
I am unable to convert this variable to float because of these 3 values ('Not pr...
Do you want to remove those 3 values?
obsidian copper
feral spoke
Do you want to remove those 3 values?
yes I dont have these in the data but its present as a category in categories
feral spoke
obsidian copper
yes I dont have these in the data but its present as a category in categories
You can slice the dataframe
obsidian copper
i can convert it to float after its removed
feral spoke
and once the slicing is done you can convert that to float
obsidian copper
I sliced it but it throws an error. let me show the error but basically it says cannot covert 'Not present' to a float. 'Not present' is a value in categories so maybe thats causing the problem
feral spoke
obsidian copper
I sliced it but it throws an error. let me show the error but basically it says ...
Yeah, can you open a help ticket and ping me there?
obsidian copper
okay
 wintry barn
Anyone here know timeseries forecasting? I need some help to predict something with longer ranges
 finite compass
Hello. Can someone help me with a webscrape tablular data from pdf to dataframe in python ? I tried tabula (Showing ambiguous error) and camelot libraries
 calm flower
Would ai be the best to scrape the data out of this table. https://codepen.io/Cmarino_/pen/YzLmwrZ Thats the code for it and its soo goofy i want to end the guy who wrote it. Thats the real code from my schools timetable page which is also loaded in a iframe.
finite compass
Its not working. The PDF is 500+ pages long. The specific table is in page 340 or something and cant scrape the table
 young granite
calm flower
Would ai be the best to scrape the data out of this table. https://codepen.io/Cm...
young granite
calm flower
Would ai be the best to scrape the data out of this table. https://codepen.io/Cm...
so u just want to use ur schoolhomepage as an "api"?
young granite
finite compass
Its not working. The PDF is 500+ pages long. The specific table is in page 340 o...
tried requests_html?
young granite
finite compass
Its not working. The PDF is 500+ pages long. The specific table is in page 340 o...
even tho i never used it this looks exactly like something u search:
import tabula

file = "http://lab.fs.uni-lj.si/lasin/wp/IMIT_files/neural/doc/seminar8.pdf"

tables = tabula.read_pdf(file, pages = "all", multiple_tables = True)
im just trying to put the tabel into a .CSV tabel but because of the html code it likes to duplicate and there's 500 lines of data
young granite
calm flower
im just trying to put the tabel into a .CSV tabel but because of the html code i...
2k lines for a pretty shitty looking timetable pog
young granite
calm flower
im just trying to put the tabel into a .CSV tabel but because of the html code i...
work around would be automate copy/paste and then create a df out of that
however i dont know a lib that does what u want it to do
finite compass
young granite
even tho i never used it this looks exactly like something u search:
```py
impor...
Tried using tabula but there is error of ambiguity. Cant figure out why the exact page numbers are showing error. Other tables are working but this table is giving issues to pull using Tabula
finite compass
young granite
tried requests_html?
Can't use Requests_html since there is a script of the website to navigate to the specific page number in the pdf
young granite
finite compass
Can't use Requests_html since there is a script of the website to navigate to th...
so like uni access
maybe u violate some ToS, which is not allowed on this DC 🗿
young granite
so maybe share link
 loud cave
wintry barn
Anyone here know timeseries forecasting? I need some help to predict something w...
loud cave
wintry barn
Anyone here know timeseries forecasting? I need some help to predict something w...
what kind of data do you have? tell us more
desert oar
wintry barn
Anyone here know timeseries forecasting? I need some help to predict something w...
check the pinned messages and don't "ask to ask"
young granite
isnt that related to GPR and Bayes opt.
desert oar
finite compass
Its not working. The PDF is 500+ pages long. The specific table is in page 340 o...
PDF scraping is not an exact process. The PDF file format is not really meant to be read or processed, it is meant for visual display. It was also originally a proprietary Adobe product, and they didn't really make any attempt to make it usable for other people. Also, various PDF writers don't comply to specifications. Therefore, any program that attempts to scrape tables out of a PDF is never going to get it right 100% of the time. You are almost always going to have to go back and fix things up by hand, or work around errors.
Expecting perfection with PDF scraping is a recipe for frustration and disappointment.
 serene scaffold
I can confirm that text extraction being shit for PDFs is one of the biggest problems for NLP, and that there are no great solutions
 azure socket
What is the best way to keep rotating the image until the barcode is read?
Using opencv and pyzbar
 fickle rock
Now this is an introduction to data science I like 😳
 desert oar
"cumsum" is a fun one too
serene scaffold
😠
desert oar
(i guess we should probably keep it pg-13 here)
 hushed kraken
We want to make a for loop to test different neural networks with different number of layers, activation functions, etc... and define witch model would be the most optimal. Does anyone know a good reference to do that? (pls ping me on response, thnx)
desert oar
hushed kraken
We want to make a for loop to test different neural networks with different numb...
sounds like you are looking for resources on optimizing the architecture and hyperparameters of a model
look up "hyperparameter optimization"
scikit-learn has some good references on it, although you might not want to use scikit-learn with deep learning models
read this section of their user guide, it's a good overview of popular techniques in the topic https://scikit-learn.org/stable/model_selection.html

scikit-learn
Cross-validation: evaluating estimator performance- Computing cross-validated metrics, Cross validation iterators, A note on shuffling, Cross validation and model selection, Permutation test score....
hushed kraken
thank you sir
desert oar
this is also a big topic and kind of a complicated one
there are many many techniques for doing this, and there are several conceptual pre-requisites to understanding and applying the techniques correctly
i recommend starting with the basics: train/test splits, cross-validation, scoring metrics for model evaluation, and the notion of "searching" a space for optimal hyperparameters
then you can move on to thinking about different search strategies, e.g. grid search, random search, halving search, bayesian / black-box optimization, evolutionary algorithm, et alia
hushed kraken
Our assistent said we could make a for loop on our model and run it in the server and see witch model would be the best. We our second year engineers so I dont think the method should be very complicated
desert oar
hushed kraken
Our assistent said we could make a for loop on our model and run it in the serve...
yes, but even doing that properly (setting up the data correctly and making an accurate assessment) requires a bit of understanding
hopefully the doc i sent + the search terms i provided are a good starting place
the fast.ai course probably also has some good material on model selection and hyperparameter optimization
hushed kraken
ok thank you man
 molten smelt
hi
i made an ai that can differentiate between 2 shapes
is there any way to improve it?
pls ping when responding
serene scaffold
molten smelt
is there any way to improve it?
we don't know enough about how it works or how it currently performs to make any suggestions.
molten smelt
can i send the file?
serene scaffold
That wouldn't help. Try describing how the model is designed, and tell us what scores you're getting for the performance metrics.
molten smelt
i just saw a video on yt on ai and thought that i make it
tbh i dont have very good idea how ai works
molten smelt
serene scaffold
That wouldn't help. Try describing how the model is designed, and tell us what s...
its based on the perceptron
serene scaffold
molten smelt
its based on the perceptron
It's good to learn about perceptrons, since all neural networks build on the concept of perceptrons. but that also means that I still don't know enough about your model architecture to offer suggestions. I also don't know how it performs.
molten smelt
serene scaffold
It's good to learn about perceptrons, since all neural networks build on the con...
its basically an exact copy
serene scaffold
 marsh goblet
anybody used openai before?
marsh goblet
anybody used openai before?
it's easier for everyone if you bake your follow-up question into your first question. what would you ask if someone had used openai?
example: "has anyone used openai? I'm trying to do x, but I've run into this problem", etc.
marsh goblet
serene scaffold
it's easier for everyone if you bake your follow-up question into your first que...
youre right its just because its a pretty new module called whisper - and i want to build something from it, but i just used tensorflow before and i am a complete beginner kinda
so i wasnt sure if that chat was that active at all first
serene scaffold
marsh goblet
so i wasnt sure if that chat was that active at all first
it doesn't matter if the chat is active or not. you'll never get an answer until your actual question is exposed.
marsh goblet
so the question would be: is it hard, do i need to learn some deep ml concepts before or can i just start and trial and error my way through - my goal is it to build a speech to text automation with moviepy and whisper, but sadly there isnt to much out there to really research this
marsh goblet
serene scaffold
it doesn't matter if the chat is active or not. you'll never get an answer until...
you are right
serene scaffold
you can't fumble your way to understanding AI by messing with python AI modules. that might work for other kinds of programming, but not AI.
marsh goblet
why not
serene scaffold
it's very theory driven.
that said, speech recognition is a common problem, so I imagine there are off-the-shelf solutions where you just feed audio to it and get text back.
marsh goblet
yeah i know thats pretty simple
but i want to integrated that into a larger tool, which automatically transcribes videos f.e. and adds the text chunks to the recognized/transcripted time stamp
if that makes sense
simple text to speech is not hard just the application to that problem kinda scares me a bit or am i just overthinking
serene scaffold
so you basically want a program that puts captions in the video?
marsh goblet
yeah exactly that would be one part with whisper f.e. and the other one would be to create the whole video itself with moviepy
so basically u would feed the programm with an audio and it would create a video 2-5min later
serene scaffold
I'm not sure how you'd do that, but "python automated video captioning" would probably be a good google query.
marsh goblet
yeah the only thing for that i found so far was the OpenAi Whisper Module, that would also fit with moviepy and has a really low error rate
i just dont want to learn unnecessary ai/ml concepts right now because i just simply dont have the time (would love to learn it one day, but for now i cant)
but i kinda recognize that i dont really ask a question hahaha
 lapis sequoia
what do you guys think about this guide?

GitHub
Minimal Machine Learning Study Plan. Contribute to AssemblyAI-Examples/ML-Study-Guide development by creating an account on GitHub.
fringe anvil
so, ive added title, as requested by the instructor. apparently the indoor: clay being blank is normal. but the broken up indoor: carpet is not normal, rest is fine apparently

good friday afternoon everyone ❤️
 tacit basin
lapis sequoia
what do you guys think about this guide?
tacit basin
lapis sequoia
what do you guys think about this guide?
What do you think about it?
 quiet seal
Hi I'm having a little bit of trouble with pandas and was hoping someone could help
I have a 'description' field containing ...values' is set to 'Administrators': [PASSED]"\n\nThis policy setting and ndf2[ndf2['description'].str.match('.*alue', na=False, flags=re.MULTILINE)] spits out a dataframe containing that record
ndf2[ndf2['description'].str.match('.*This', na=False, flags=re.MULTILINE)] returns…nothing.
okay, I have multi-line regex enabled, the string This is clearly in the field, what am I doing wrong here?
serene scaffold
@quiet seal please do print(ndf2['description'].head()), put the text (no screenshots) in the chat, and explain what you want to match.
quiet seal
Can't connect here from the PC with the data on it and can't copy the data from that machine to here due to security policy stuff. I'm trying to match a text string coming out of a Nessus scan; the field contains newlines, and I can only match with the first line of text in the field.
serene scaffold
it looks like regex might actually be overkill for what you're trying to do.
you could just do ndf2['description'].str.contains('This', regex=False)
quiet seal
Eventually I want to pull out a particular field; part of the string (the tail end, actually) ends in \n\nActual Value:\n'<some data I want to pull into a new column>' but I haven't gotten far enough to actually match anything, much less pull it out with str.extract()
quiet seal
serene scaffold
you could just do `ndf2['description'].str.contains('This', regex=False)`
I recognized the error in my first message too late 🙂 Will try to be more specific
 hasty mountain
@serene scaffold tell me...if I want to extract features from a sentence (Batch, 1), would it be better if I use linear layers, or should I convert this sentence into a 3D array and pass it through some Conv2Ds?
I've seen that VGG19 used Conv2D layers to extract features, using linear layers only in the end, to classify the images.
I don't see that much of a difference in feature extraction between Conv2Ds and Linear layers(apart from the input shape), but if VGG19 used especially Conv2Ds for feature extraction and reserved the Linear layers for the ending there might be something to it.
quiet seal
Okay, I think I found the solution. ndf2[ndf2['description'].str.replace('\n','XXX').str.match('.*XXXThis', na=False, flags=re.MULTILINE)] works
 wary crown
I am trying to run a machine learning program from this tutorial. It worked perfectly with the iris dataset, however, when I tried my own, I had some difficulties and am currently getting inaccurate models. Now it is stating that UserWarning: The least populated class in y has only 1 members, which is less than n_splits=2. warnings.warn(, which is probably what is affecting my accuracy.
 untold bloom
quiet seal
Okay, I think I found the solution. `ndf2[ndf2['description'].str.replace('\n','...
untold bloom
quiet seal
Okay, I think I found the solution. `ndf2[ndf2['description'].str.replace('\n','...
re.MULTILINE is ineffective with .str.match
.match has implicit ^ in front, as you probably know it
re.MULTILINE doesn't affect that implicit ^'s matching behaviour
so you can remove that flag
you rather needed, it seems, re.DOTALL
so that . matches really everything
by default it doesn't know of \n
quiet seal
Aha, that helps
untold bloom
.match is a useless and confusing function
quiet seal
Well in any case, re.DOTALL worked and now it's doing what I needed, so thanks.
 dusty valve
untold bloom
`.match` is a useless and confusing function
dusty valve
untold bloom
`.match` is a useless and confusing function
What
 grave frost
marsh goblet
but i kinda recognize that i dont really ask a question hahaha
grave frost
marsh goblet
but i kinda recognize that i dont really ask a question hahaha
probably use one of the many wrappers around Whisper
its the best model there is - but its also a bit slow and compute hungry
marsh goblet
grave frost
probably use one of the many wrappers around Whisper
yeah true, i mean i kinda got it working but its not doing anything sadly
its running and should create a file in a dir but nothing happens anybody knows why?
 dusty valve
grave frost
its the best model there is - but its also a bit slow and compute hungry
dusty valve
grave frost
its the best model there is - but its also a bit slow and compute hungry
What about bloom? 176 billion param model
grave frost
dusty valve
What about bloom? 176 billion param model
he wants STT, and BLOOM is quite awful anyways
 merry ridge
Does anyone know to what extent an extreme outlier is possible when generating a normally distributed random number.
I see that a Mersenne twister takes 53 bits of floating point precision, so I feel like you should be able to generate say a number greater than, say, 10 if you sample 100 trillion times from N(0,1). But it's not clear to me if the implementation makes such an observation literally impossible as opposed to a "up to a set of zero measure" impossibility.
(I know this is an abuse of the term zero measure)
 tidal bough
The change of getting an outlier 10 std from the mean is 1 in 10^23 or so
10^14 attempts will only get you outliers around +-8std
but I get what you mean
merry ridge
Yeah, I wasn't sure how to best codify what I was asking other than to say enough and hope it is understood.
arctic wedgeBOT
Lib/random.py lines 576 to 589
# Uses Kinderman and Monahan method. Reference: Kinderman,
# A.J. and Monahan, J.F., "Computer generation of random
# variables using the ratio of uniform deviates", ACM Trans
# Math Software, 3, (1977), pp257-260.

random = self.random
while True:
    u1 = random()
    u2 = 1.0 - random()
    z = NV_MAGICCONST * (u1 - 0.5) / u2
    zz = z * z / 4.0
    if zz <= -_log(u2):
        break
return mu + z * sigma```so I guess one has to read that paper to know
(and there's a whole different algorithm in gauss which may have different properties)
merry ridge
Well, a paper certainly helps me get a lot further than I was a moment ago. Thanks for that
tidal bough
wow, this is an old paper
merry ridge
A lot of these kind of things are always surprisingly old
There is a theorem that says you can approximate any continuous function with a 2 layer neural network and I think it was proved around 1960?
oh no, I think I am confusing results. Maybe the one I am thinking about is in the 1990s.
tidal bough
It seems to me like the algorithm is exact-in-theory, so only floating-point inaccuracies may affect it
though that's not a big discovery, is it?.. of course it'd be floating point stuff.
merry ridge
Nope, I was really hoping for an informative stackexchange post that condensed the information for me without having to read a paper though.
wary crown
How do I predict new outputs with an sklearn model
I have a csv with 2 items per row (an input, an output), and I want to add new inputs to predict the output but am unsure of how to do this.
can someone please explain
serene scaffold
wary crown
How do I predict new outputs with an sklearn model
I have a csv with 2 items per...
did you use the predict method?
 serene scaffold
I won't look at screenshots of text.
wary crown
the numbers on the right are above 20,000 thats all you need to know about the screenshot
anyway
serene scaffold
it's less than I would need to know to help you, for sure.
wary crown
well you can see the values on the left are going up 17,18...
so when i do this print(rfr.predict([[20]]))
it doesnt work well
so I just wanted to know if im doing this right or not
serene scaffold
what is rfr?
serene scaffold
wary crown
random forest regressor
this is a super relevant piece of information that I need to know to help you, and which I never could have known unless you told me.
serene scaffold
so you have an x and a y. you're basically just trying to fit a curve, yes? can you make a plot that shows the x and y values?
serene scaffold
whatever you want, as long as there's an image you can drop in the chat at the end. (pictures of text are bad, pictures of visualizations are good.)

 wary crown
set_config(print_changed_only=False)

rfr = RandomForestRegressor()
print(rfr)

RandomForestRegressor(bootstrap=True, ccp_alpha=0.0, criterion='mse',
                      max_depth=None, max_features='auto', max_leaf_nodes=None,
                      max_samples=None, min_impurity_decrease=0.0,
                      min_samples_leaf=1,
                      min_samples_split=2, min_weight_fraction_leaf=0.0,
                      n_estimators=100, n_jobs=None, oob_score=False,
                      random_state=None, verbose=0, warm_start=False)
rfr.fit(xtrain, ytrain)
RandomForestRegressor(bootstrap=True, ccp_alpha=0.0, criterion='mse',
                      max_depth=None, max_features='auto', max_leaf_nodes=None,
                      max_samples=None, min_impurity_decrease=0.0,
                      min_samples_leaf=1,
                      min_samples_split=2, min_weight_fraction_leaf=0.0,
                      n_estimators=100, n_jobs=None, oob_score=False,
                      random_state=None, verbose=0, warm_start=False)
this part basically never happens, because you don't write it to a variable
or is that the output of a jupyter cell?
look at the docs: https://scikit-learn.org/stable/modules/generated/sklearn.ensemble.RandomForestRegressor.html
scikit-learn
Examples using sklearn.ensemble.RandomForestRegressor: Release Highlights for scikit-learn 0.24 Release Highlights for scikit-learn 0.24 Combine predictors using stacking Combine predictors using s...
there's a bunch of parameters you can mess with. you're not taking advantage of them currently.
serene scaffold
that's your homework 😄
there's a reason companies pay big bucks for people who know this shit.
wary crown
ok ill look through for one that sets the output or something
serene scaffold
one that sets the output?
 iron basalt
"Read more in the User Guide."
scikit-learn
The goal of ensemble methods is to combine the predictions of several base estimators built with a given learning algorithm in order to improve generalizability / robustness over a single estimator...
 smoky marlin
Somebody here that could help me out with my data plot

I have this plot, but i would like to have more timestamps on the x axis
iron basalt
iron basalt
https://scikit-learn.org/stable/modules/ensemble.html#forest
It explains some of the most important parameters.
wary crown
serene scaffold
one that sets the output?
because im getting decimals
not nums in the thousands like I should
serene scaffold
@wary crown I'll add that when you do read the user guide, you're going to see a lot of words you don't know. and it would probably take you a long time to learn what those words mean, and what the words that define those words mean, etc. you're not going to understand it all right now. and you might have to accept that you're not going to make this model work today, or this week. the important thing is to keep a positive attitude about learning.
iron basalt
wary crown
because im getting decimals
Note the links in the user guide such as the "decision trees" link. Click on them and read more.
scikit-learn
Decision Trees (DTs) are a non-parametric supervised learning method used for classification and regression. The goal is to create a model that predicts the value of a target variable by learning s...
wary crown
wary crown
because im getting decimals
wait is it outputting a percentage???
it shouldnt because I have continuous data
wary crown
serene scaffold
<@843979954055807006> I'll add that when you do read the user guide, you're goin...
IT
WORKED
I WAS SCALING MY x AND y AND IT WAS THROWING MY DATA OFF
hasty mountain
Can anyone give me some tips on how to get rid of vanishing gradients?
I've tried residual blocks, batch normalization, weights initialization and using a bigger learning rate, but I simply can't make my gradients stop vanishing.
Also, using a shallow network doesn't seem that interesting to me, as I want to make a network for feature extraction.
 low bloom
whats the best way to add a row to a column in pandas?
I was going to use append, but pandas says that is now deprecated
feel free to @ me
serene scaffold
low bloom
I was going to use append, but pandas says that is now deprecated
what are you trying to do overall? because adding individual rows to a dataframe iteratively is O(n^2).
low bloom
I am trying to read from an excel file that has 5 sheets with like 10 columns and 100 rows each sheet
then I want to iterate through them and put all of their column 1 in a df to merge all of them
then I want to get a permutation of all possible ways that I can combine them
I am not sure if that makes sense at all
serene scaffold
anyway, you have two options:
- keep appending items to a plain Python list, and then turn that whole list into a dataframe once you have everything (efficient)
- keep calling
pd.concat(inefficient)
low bloom
serene scaffold
anyway, you have two options:
1. keep appending items to a plain Python list, an...
what if I loop and append them to my df with something like
df.loc[index, my_column_name] = "my_value"
and no, all I really understand about your problem is that you have some excel data, and you want to do some operation on permutations of that data.
serene scaffold
low bloom
what if I loop and append them to my df with something like
```python
df.loc[i...
inefficient as fuck.
low bloom
so I guess I will create a list and then put that list into the df
serene scaffold
you wouldn't be putting the list into a df. you'd be creating a dataframe from that list.
low bloom
since my data is small, I dont think Ill need a lot of efficiency, but if I can get some efficiency then all the better
serene scaffold
I can't continue helping without knowing what the data looks like and exactly what you're trying to do. if you've already loaded the five dataframes into memory, do print(df.head().to_dict('list')) and put the text in the chat. Keep in mind that I will not look at screenshots of text.
low bloom
serene scaffold
I can't continue helping without knowing what the data looks like and exactly wh...
I dont think I can show the data
serene scaffold
low bloom
I dont think I can show the data
then you'll have to create pseudo data where everything is the same type as the real data that it mocks.
I know that might sound like a big ask, but this is like asking an SQL question and not saying what the schema of the tables are.
low bloom
serene scaffold
I know that might sound like a big ask, but this is like asking an SQL question ...
yeah I completely understand and maybe if I can create something small it might help us out
and also it might give me some clarity as well
this is my first time really messing with pandas
serene scaffold
you can create an example that's simpler than the real data as long as it encapsulates the problem.
this is my first time really messing with pandas
the adventure begins

low bloom
serene scaffold
<:pandaWow:554697564197486598>
what are your thoughts if I just create plain python list and try to shove it into a df column?
too inefficient?
serene scaffold
@low bloom it wouldn't be inefficient, just a bad use of pandas.
you might as well just not involve pandas in the solution
low bloom
serene scaffold
you might as well just not involve pandas in the solution
yeah I guess thats true
 rotund scarab
For a starter, Seaborn or Matplotlib ?
desert oar
rotund scarab
For a starter, Seaborn or Matplotlib ?
seaborn, if you want to make fancier plots sooner. matplotlib if you have the time to dedicate to reading a lot of docs and understanding how it works.
seaborn is based on matplotlib so you should probably start with matplotlib basics no matter what.
it might also help to spend a bit of time looking over the docs for the R library ggplot2, because seaborn is heavily inspired by ggplot
plotnine is also an interesting and under-appreciated alternative to seaborn, with the same "grammar of graphics" inspiration
 unique cove
hello, i have around 22k of data containing time duration in second
i want to calculate the average time of it, but i need to remove unnecessary data such as 0 time (process havent started), or time that take too long time (anomaly)
i tried to find the outlier using IQR, but after i removing the outlier, the new dataset will have its another outlier
i kinda confused how to determine and removing the outlier in my data.. can anyone give me some explanation?
im new and currently learning analytics btw, so maybe i skipped some step before defining outlier
desert oar
unique cove
hello, i have around 22k of data containing time duration in second
i want to ca...
don't obsess over removing outliers. the boxplot IQR method is a "rule of thumb", it is not a strongly-motivated statistical procedure. it's not an outlier unless it seems like an outlier based on your knowledge of the data!
there are other outlier removal heuristics as well, e.g. > 2 standard deviations away from the mean
unique cove
i tried using boxplot but, it shows this, idk why, i cant read it
is it because the outlier is too much and too far away?
 desert oar
consider whether you actually want to remove outliers at all. are "anomalies" even possible? what would cause an anomaly? what subjectively would you consider an outlier?
unique cove
😅
desert oar
unique cove
i tried using boxplot but, it shows this, idk why, i cant read it
is it because ...
this looks like highly skewed data. look at a histogram or kernel density plot or violin plot, in addition to the boxplot
i would not categorize those points as outliers based on that plot
it's also possible that the presence of many 0s is corrupting the data
unique cove
desert oar
consider whether you actually want to remove outliers at all. are "anomalies" ev...
yes, anomaly very possible, i want to calculate procces time of a process
and this process is communication between 2 system, and very likely to fail, and we need to adjust manually, this kind of scenario, i want to exclude in my calculation
desert oar
you said that 0s are not possible in a real observation, and that they reflect some problem and need to be removed. try computing the boxplot with 0s removed.
unique cove
desert oar
you said that 0s are not possible in a real observation, and that they reflect s...
that plot is without 0
desert oar
unique cove
yes, anomaly very possible, i want to calculate procces time of a process
and th...
what happens when it fails? it runs until a timeout ends the process?
if so, wouldn't you expect to see a large number of points with t = max timeout?
then every point with t < max timeout must represent a completed process, even if it's long duration
those are the kinds of questions you need to ask here
unique cove
no it would not run at all
until we retry it manually, and that cause the duration become huge, let's say there is failure yesterday, and i retry it today.. the duration would be 1 day
but in normal scenario it should be just in seconds
unique cove
desert oar
don't obsess over removing outliers. the boxplot IQR method is a "rule of thumb"...
from google, i tried anothe method by calculating z-score
but 1 thing i doubt is, what score is counted as outlier? it is always be -/+ 3? because from what i read is zscore -/+3 is considered outlier?
untold bloom
dusty valve
?
this answers your first quasi-question i guess
young granite
can one explain to me when i use rng = np.random.RandomState(1) to get random numbers how does it work?
Cause im following a script atm and i get the same values as the script even tho it should be "random"
 wise iris
I'm using yolov5 to do some object detection, I have the doubt that it's running on my CPU and not my GPU, is there a way to find this out? And is there a way to decide witch GPU tu use?
 strong sedge
young granite
can one explain to me when i use ```rng = np.random.RandomState(1)``` to get ran...
strong sedge
young granite
can one explain to me when i use ```rng = np.random.RandomState(1)``` to get ran...
When u put the 1 in np.random.Randomstate
That 1 is used as the starting seed
young granite
strong sedge
When u put the 1 in np.random.Randomstate
That 1 is used as the starting seed
can u elaborate a bit more pls
strong sedge
young granite
can u elaborate a bit more pls
random numbers is not actually random, they are pseudo random, that is if you the starting condition, you can predict the next numbers
when you pass a 1, you are setting a seed
strong sedge
young granite
and if i leave out a number
there is some mechanism (taking the current time or something) to set the seed
strong sedge
young granite
its more "random" then with a seed?
it just makes it repeatable, if you dont set a seed, you will not be able to repeat the conditions exactly
young granite
can u maybe help me with another question i found no answer to:
gaussian_process.kernel_ ≠ gaussian_process.kernel
young granite
strong sedge
it just makes it repeatable, if you dont set a seed, you will not be able to rep...
ok thanks that explains why random isnt random 😄
young granite
young granite
can u maybe help me with another question i found no answer to:
```gaussian_proc...
why are the resulting functions different
strong sedge
young granite
can u maybe help me with another question i found no answer to:
```gaussian_proc...
I have no idea about this
young granite
sad but thank u ❤️
wise iris
wise iris
I'm using yolov5 to do some object detection, I have the doubt that it's running...
does anyone have any idea of how to do this?
young granite
wise iris
does anyone have any idea of how to do this?
maybe a non code way would be to use taskmang. and see the usage of ur CPU and GPU
maybe u could use CUDA aswell?
strong sedge
wise iris
I'm using yolov5 to do some object detection, I have the doubt that it's running...
idk what framework ur using, but both tensor-flow and pytorch has a way to see if its working on cpu or gpu
id suggest googling for the function name
wise iris
strong sedge
idk what framework ur using, but both tensor-flow and pytorch has a way to see i...
Pytorch
young granite
wise iris
Pytorch

W&B
A short tutorial on using GPUs for your deep learning models with PyTorch, from checking availability to visualizing usable. Made by Ayush Thakur using W&B
lapis sequoia
Could anyone help with this task in python pandas?

 grizzled zealot
Py
 bold timber
Hello guys, I have a question about tuning the pre-trained model:
In this case, I want to tune the last 10 layers on EfficientNetB0. But, why I get 12 layers that are trainable?

This is my architecture before I tune the model

And I just do this for the tuning of the model

please give me an insight into this🙏
wise iris
young granite
https://wandb.ai/wandb/common-ml-errors/reports/How-To-Use-GPU-with-PyTorch---Vm...
I followed this step and it returns False

but this computer has a good GPU, should I reinstall the drivers or something?
young granite
wise iris
I followed this step and it returns False
u need a nvidia gpu to utilize
 wise iris
I guess this is the problem
 desert oar
unique cove
from google, i tried anothe method by calculating z-score
but 1 thing i doubt is...
desert oar
unique cove
from google, i tried anothe method by calculating z-score
but 1 thing i doubt is...
no, the "Z score" is just a number of standard deviations away from mean. a cutoff of 3 standard deviations from the main is no more principled than 1.5 times IQR from the mean
furthermore, because this data is apparently very skewed, the rules of thumb from the Normal distribution about standard deviations from the mean and probabilities do not apply
based on your description, it sounds like none of these data points should be considered outliers, and you just have a very skewed distribution, with some very long running processes in your data
you might want to consider analyzing this data on a logarithmic scale, i.e. log(y) instead of y
that will automatically force you to remove 0 values anyway, and it will have the effect of compressing the range of the data. the natural log is a nice transformation in particular because, at small scales, differences in natural logs can be interpreted on the original scale as percent changes

Cross Validated
Can somebody explain how the properties of logs make it so you can do log linear regressions where the coefficients are interpreted as percentage changes?
fringe anvil
good morning everyone. im trying to describe, in english, this graph. i was wondering, what is the purpose of the red "mean" line?

so far ive got this
"""
in the first graph, we plot births per day for a year,
with outliers circled in blue with mm/dd as the date format.
the smoothed blue line, takes the average of the graph,
it gives a nicer visual to it and makes it easier to read.
"""
 mortal dove
Mean is another word for average
So I suspect it's the average of all the data points on the graph
desert oar
fringe anvil
good morning everyone. im trying to describe, in english, this graph. i was wond...
the mean/average is mathematically equivalent to the "center of mass" from physics, and corresponds intuitively to what most people think of as "the middle" of some thing. so it's being shown here as a kind of reference for the individual data points
note that in this case the mean is maybe lower than you would expect from eyeballing the chart. that's because of some extreme low points dragging the whole thing down
fringe anvil
oh ok, i barely finished my coffee. i understand the mean, i just wasnt sure how it was helpful on this graph.. but it makes sense when explained like this. thanks
i guess when i saw the round number "100" i thought that he handpicked the number. or used some fancy math to make the data gravitate around that number
i tend to overcomplicate/overthink things lol
ive tried to google periodic component and residual .. i havent seen anything that explains it in a way where i could reformulate it in my own words to explain those graphs. would anyone have better sources to provide?

 desert oar
fringe anvil
ive tried to google periodic component and residual .. i havent seen anything th...
desert oar
fringe anvil
ive tried to google periodic component and residual .. i havent seen anything th...
"residual" is stats jargon for "deviation from an estimate", aka "error".
"residuals around/about the mean" are deviations from the mean
"periodic" means "repeating" or "cyclical"
check out the pinned messages, i have a big post in there w/ time series analysis resources
fringe anvil
desert oar
check out the pinned messages, i have a big post in there w/ time series analysi...
thanks a lot
 bold pumice
Hey everyone!
- I developed neograd, a deep learning framework created from scratch using Python and NumPy.
- It supports automatic differentiation, many popular optimization algorithms like Adam, 2D, 3D Convolutions and MaxPooling layers all built from the ground up. It can also save and load models, parameters to and from disk.
- I initially built this to understand how automatic differentiation works under the hood in PyTorch, but later on extended it to a complete framework. I just released v0.0.3 today.
- I’m looking for feedback on what more features I can add and what can be improved. Please checkout the github repo at https://github.com/pranftw/neograd Thanks!



GitHub
A deep learning framework created from scratch with Python and NumPy - GitHub - pranftw/neograd: A deep learning framework created from scratch with Python and NumPy
fringe anvil
desert oar
"residual" is stats jargon for "deviation from an estimate", aka "error".
"resi...
you describe machine learning as "in general, machine learning is anything where a machine or algorithm learns to perform a task without human supervision by learning from data."
i thought the first step in ML was SL. supervised learning, or am i mixing stuff
bold pumice
bold pumice
Hey everyone!
- I developed neograd, a deep learning framework created from scr...
Colab notebooks to try out neograd

 wooden forge
I'm trying to construct a grid of black squares, and everytime you click on one it turns white. Now for some reason my code does very weird things:
The coordinates I input doesn't correspond to the array coordinates. I tried to change that by letting `i = y - (N-1)` and `j = x with (x,y)` the mouse coordinates. But only the first line will be converted properly (top row of the plot). The rest will be inverted vertically.
When all squares are white the plot automatically reset to black squares.
Here is my code:
import numpy as np
import matplotlib.pyplot as plt
import matplotlib
import math

N = 3

# Make an empty data set
data = np.zeros((N, N))

# Make a figure + axes
fig, ax = plt.subplots(1, 1, tight_layout=True)

# Draw the boxes
box = ax.imshow(data, cmap='gray', extent=[0, N, 0, N])

# Draw the grid

for x in range(N + 1):
    ax.axhline(x, lw=2, color='w', zorder=5)
    ax.axvline(x, lw=2, color='w', zorder=5)

# Create interactivity
def on_click(event):
    gx = event.xdata
    gy = event.ydata

    print('x=',gx)
    print('y=',gy)

    i = int(gy) - N + 1
    j = int(gx)

    data[i,j] = 1
    ax.imshow(data, cmap='gray', extent=[0, N, 0, N])

    fig.canvas.draw_idle()

fig = plt.gcf()
fig.canvas.mpl_connect('button_press_event', on_click)

# Turn off the axis labels
ax.axis('off')

plt.show()```
Thanks for your helpWhen all squares are white the plot automatically reset to black squares.
that'd be because you're not specifying a range of values to expect, so matplotlib normalizes it for you. So a grid of all zeros is the same as a grid of all ones to it (each cell is equal to the mean, in both cases).
wooden forge
hooo I see
tidal bough
pass vmin=0, vmax=1 to imshow to fix that
wooden forge
I remember that
well thanks that fixes one issue !
Now I still have to figure out why the coordinates aren't the right one when I change a square from black to white
tidal bough
which coordinate is wrong? i or j?
wooden forge
the i
the row are inverted after the top one
here it works

but here it doesn't change the correct one
 tidal bough
Invert it, then, perhaps? something like N-1 - int(gy).
wooden forge
so the top row isn't affected by this issue
there is no way
it worked xd
omg I inverted it in my code not in my handwritten notes
this is silly
well thanks ! 💜
wooden forge
alright, just wondering one more thing, I've added a reset button that works like a charm but for some reason when I click again on the figure the past values are shown
# Create interactivity
def on_click(event):
    gx = event.xdata
    gy = event.ydata

    print('x=',gx)
    print('y=',gy)

    i = N - 1 - int(gy)
    j = int(gx)

    data[i,j] = 1
    ax.imshow(data, cmap='gray', extent=[0, N, 0, N], vmin=0, vmax=1)

    fig.canvas.draw_idle()

def reset(event):
    data = np.zeros((N, N))
    ax.imshow(data, cmap='gray', extent=[0, N, 0, N], vmin=0, vmax=1)
    fig.canvas.draw_idle()

fig.canvas.mpl_connect('button_press_event', on_click)

axes = plt.axes([0.46, 0.1, 0.1, 0.075])
reset_button = Button(axes, 'Reset',color='lightcoral', hovercolor="red")
reset_button.on_clicked(reset)

# Turn off the axis labels
ax.axis('off')

plt.show()```basically added a button to this code
should I instead entirely wiped the figure
 dusk tide
How to get a job in ML as a fresher after college in a good company??
wooden forge
dusk tide
How to get a job in ML as a fresher after college in a good company??
#career-advice I think is the place you could get better answer ?
serene scaffold
dusk tide
How to get a job in ML as a fresher after college in a good company??
apply to good companies. did you take ML-related courses?
wooden forge
wooden forge
alright, just wondering one more thing, I've added a `reset button` that works l...
so yeah it resets but doesn't keep the value of the data array so it's pointless
I feel like using classes would be easier
 odd meteor
dusk tide
How to get a job in ML as a fresher after college in a good company??
odd meteor
dusk tide
How to get a job in ML as a fresher after college in a good company??
If you dig ML Research, you can try joining an ML Research company. I know Cohere is currently hiring.
If you are pretty good with JAX give Cohere a try.
Aside that, attending ML/ tech events can do the magic as well. It's all about positioning and preparedness meeting opportunity!
For now, have some nice pet projects on your Github, and leverage LinkedIn.
All the best ✌️
wooden forge
wooden forge
alright, just wondering one more thing, I've added a `reset button` that works l...
just had to make data global lmao
hasty mountain
odd meteor
If you dig ML Research, you can try joining an ML Research company. I know Coher...
What if I'm in college in an area completely different from math sciences/engineer, but still want to at least be an intern in ML area?
PS: I do have some projects in GitHub... I just don't know if they're nice
desert oar
fringe anvil
you describe machine learning as "in general, machine learning is anything where...
"supervised learning" is "machine learning" with labeled data
fringe anvil
desert oar
"supervised learning" is "machine learning" with labeled data
yeah i had to google, i was confusing terms here. thanks
strong sedge
hasty mountain
What if I'm in college in an area completely different from math sciences/engine...
I am trying to get an internship as well
It's really hard in my country as there arnt many ai related firms here atm
 silk axle
I have a pandas DataFrame with just over 80k entries, and I'm trying to shorten it by a given condition (where the string from attribute has '12:00' in it). How can I achieve this?
strong sedge
silk axle
I have a pandas DataFrame with just over 80k entries, and I'm trying to shorten ...
.apply ?
silk axle
I don't really understand the pandas docs tbh 😅
silk axle
strong sedge
.apply ?
That doesn't seem to do what I want. Seems to just be map() but on a df
I want to have items that don't meet the condition be removed
I'm aware of df.filter() and df.where() but couldn't figure out how to use them
If it helps, the format of the df is basically this json fed into json_normalize():json [ { "from": "2018-01-20T12:00Z", "to": "2018-01-20T12:30Z", "intensity": { "forecast": 266, "actual": 263, "index": "moderate" } }, ... ]
strong sedge
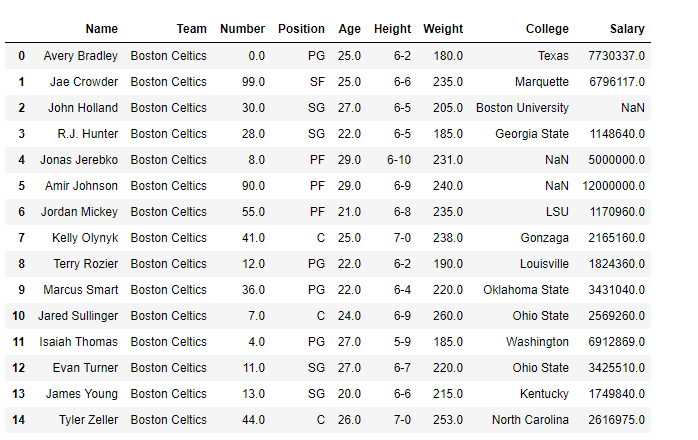
GeeksforGeeks
A Computer Science portal for geeks. It contains well written, well thought and well explained computer science and programming articles, quizzes and practice/competitive programming/company interview Questions.
Check this?
Combine this with .where
Should do what you want
silk axle
I've tried that sorta thing and it doesn't work
desert oar
silk axle
I have a pandas DataFrame with just over 80k entries, and I'm trying to shorten ...
are you trying to filter a string column? or are you trying to filter a datetime column?
silk axle
desert oar
are you trying to filter a string column? or are you trying to filter a datetime...
string
df_filtered = df['12:00' in df['to']]```gives a KeyError: Falsedf.loc[df['to'].str.contains('12:00')]
if these are supposed to be timestamps, i strongly suggest actually parsing them and working with datetime data
silk axle
🤔

xticks are in a weird order, and they don't line up with the data being plotted?
df = pd.read_csv('intensity_forecasted_and_actual_2018-01-24T21.30Z-2022-08-17T23.30Z.csv')

df['intensity.difference'] = df['intensity.actual'] - df['intensity.forecast']

df2 = df[df['to'].str.contains('12:00')]
df2.plot.bar().set_xticks(df2.index, map(format_iso_string, df2['to']))
plt.show()
Things are ordered by date in the csv, so it's something in the code making the order weird
@desert oar
desert oar
try explicitly sorting by index. df.sort_index(inplace=True)
silk axle
desert oar
try explicitly sorting by index. `df.sort_index(inplace=True)`
Nope, still weird
desert oar
silk axle
Nope, still weird
got a sample dataset? is the index actually the time series timestamp?
oh i see it is
are these strings or datetimes? should be the latter
use pd.to_datetime to convert
silk axle
desert oar
use `pd.to_datetime` to convert
I went with py df['to'].apply(lambda s: datetime.datetime.fromisoformat(s[:-1])) df['from'].apply(lambda s: datetime.datetime.fromisoformat(s[:-1]))
No clue if that works or not
>>> df['to'].dtype.name
'object'
```🤔So I've updated the dtype to datetime, but now the thing for checking '12:00' is broken lol
df['to'] = pd.to_datetime(df['to'], format='%Y-%m-%dT%H:%MZ')
df['from'] = pd.to_datetime(df['from'], format='%Y-%m-%dT%H:%MZ')

df.sort_values(by='to', inplace=True)

df2 = df[(df['to'].dt.hour == 12) & (df['to'].dt.minute == 0)]```this no longer errors, just need to see the output of the graphRight, I remembered why I didn't have them as a datetime now
By them being a datetime they're getting plotted on the graph, which I don't want
And I still have the issues above (out of order & it's not mapping to the xticks)
@desert oar
 scenic oasis
Hey, im trying to understand how to make an AI chatbot for discord. So that it can learn and improve its conversation "skills"
but everytime I look it up I see the "patterns" and "responses". But how does it learn? It looks to me like you just look if a string contains hello for example to see wich response youre gonna give back
but I dont understand how you can get the AI to make his own sentences
Sorry if this is a bit vague haha
serene scaffold
@scenic oasis a discord chat bot that improves over time would be a huge undertaking for a beginner to AI. You would give up before making any meaningful progress
I would pick a simpler first project.
scenic oasis
Do you have any suggestions? Or is an AI that "learns" to big of an undertaking
serene scaffold
scenic oasis
Do you have any suggestions? Or is an AI that "learns" to big of an undertaking
Basically, anything that actually does something. Your first few projects should just be code that applies a beginner concept
Like, understanding what data is in the context of AI and how to manipulate it.
Or getting a grasp of the vocabulary
scenic oasis
aha, I always thought of an AI as something that learns from its own mistakes
and that getting values in return for example would be more of an API
serene scaffold
scenic oasis
aha, I always thought of an AI as something that learns from its own mistakes
Yes, but not according to your understanding
scenic oasis
aha, sorry having a little brainfart here haha. How does it learn if not improving?
serene scaffold
scenic oasis
aha, sorry having a little brainfart here haha. How does it learn if not improvi...
Try watching 3blue1brown's video series about neural networks
When AI people talk about machine "learning", they're talking about a process that takes place before the AI is ever actually used in a real situation
Whereas the general public usually think AIs are actively learning while they're being used. This is rarely the case.
scenic oasis
ooooh that explains it, I indeed thought they were actively learning
serene scaffold
Don't get me wrong, some do.
scenic oasis
yeah I was breaking my brain over how that learning proces would take place in code haha, how does it know whats good and wrong. How does it keep track etc
but this and the video explains it
serene scaffold
Yeah, if you had an AI that learns while it's being used, you have to decide what information it's supposed to take from each new interaction
And how that information will adjust the inner workings of the AI
And what you're going to do with people expose your AI to misinformation
scenic oasis
yep, but I couldnt figure out how that would look in code
serene scaffold
How will you stop that from making your ai worse?
serene scaffold
scenic oasis
yep, but I couldnt figure out how that would look in code
If you don't know what gradient descendent and matrix multiplication are, it looks nothing like what you might have envisioned.
scenic oasis
in a bad or good way haha
serene scaffold
Neither. Not currently knowing stuff isn't bad.
scenic oasis
good point
 grand canyon
hey everyone, i had a question regarding splitting pytorch tensors
i have a pytorch tensor of size [3, 1920, 2560]
i want to split this into a size of [3, 50, 50]
i tried using the chunk method, but i was not sure what dimension to input
is the chunk method the right method for the job or is there something else i can do
serene scaffold
I can't think of how you'd go from (1920, 2560) to (50, 50)
grand canyon
the idea is that
if i multiply 1920 and 2560 and divide that by 50 x 50, that's the number of tensors ill get
im not sure if that's the right thought process
serene scaffold
what do 1920 and 2560 mean?
grand canyon
i have a large image that's size 1920 x 2560 and i want to subdivide that into chunks of 50 x 50, so i thought i tensorize that large image and then chunk that large tensor into smaller tensors
@serene scaffold is that the right thought process
serene scaffold
grand canyon
<@253696366952316929> is that the right thought process
you might get better Google results if you search for "create tiles of image pytorch"
grand canyon
serene scaffold
you might get better Google results if you search for "create tiles of image pyt...
alright ill try that and get back
serene scaffold
grand canyon
alright ill try that and get back
what did you find? "unfold" might be the word that you're looking for, if you're using pytorch
grand canyon
serene scaffold
what did you find? "unfold" might be the word that you're looking for, if you're...
yeah i was looking at it
there's no way to get to the dimensions i want using
that unfold
so i think ill just manually split the images
hasty mountain
grand canyon
so i think ill just manually split the images
You could use a Conv2D without bias and weights 1
I think...
grand canyon
i figured it out i just used cv2
 hazy hare
bold pumice
Hey everyone!
- I developed neograd, a deep learning framework created from scr...
hazy hare
bold pumice
Hey everyone!
- I developed neograd, a deep learning framework created from scr...
ayooo kudos dude
bold pumice
hazy hare
ayooo kudos dude
Thanks man!
bold pumice
You want to learn ai in general or build a framework from scratch?
desert oar
silk axle
```py
>>> df['to'].dtype.name
'object'
```🤔
that's a series of "python objects", not a series of dtype "datetime"
pd.to_datetime does the job
 rugged comet
I know that at the validation loss goes up due to overfitting. But what does it mean when the validation accuracy is pretty steady like in the second graph? I thought that my model architecture or whatever could use some work. It seems like adding more epochs isn't the answer here.


 wooden sail
that's also overfitting. the model isn't learning anything useful
rugged comet
How can I break the stagnancy in the validation accuracy?
I'm very new to ML so I don't know what strategies are out there.
wooden sail
it depends on the network and data. common solutions are getting/using more data or doing augmentation
rugged comet
Thanks for the ideas!
silk axle
desert oar
that's a series of "python objects", not a series of dtype "datetime"
Yeah, I realised & fixed that (as per the code I sent below that message) but the outputted graph is still really crazy and just not right (like the image I sent above)
 urban knoll
I'm trying to understand YOLO, I've been looking at different tutorials and it isn't clear to me where they get the images to train and test or what kind of for at they are supposed to be in
wooden forge
Hello there,
I am currently trying to create Coway's Game of Life in Python with matplotlib. (https://paste.pythondiscord.com/likaqexija here is the code). I would like to connect a button to an animation so when I press it I can start the animation (maybe even add another one to pause it). But I don't really know how to do it, and the code just doesn't work as intended. It simply runs one time and stops with the error : python newGrid = data.copy() AttributeError: 'int' object has no attribute 'copy' which is weird since data is an array. Any help would be appreciated!
essentially, how to make animation starts on press of a button in a imshow plot
desert oar
silk axle
Yeah, I realised & fixed that (as per the code I sent below that message) but th...
post some sample data that reproduces the issue and i can take a look
just put csv on the paste site
 winged mason
https://paste.pythondiscord.com/haluhipifo
UserWarning: Using a target size (torch.Size([10])) that is different to the input size (torch.Size([10, 10])).
I have tried putting label.to(device).to(torch.float32).unsqueeze(1) on line 62 but I failed.
anyone knows why?
thank you in advance :)
(pytorch)
silk axle
desert oar
just put csv on the paste site
Yep, gimme a few mins
silk axle
desert oar
post some sample data that reproduces the issue and i can take a look
That data gives the same thing, so you should hopefully be able to reproduce it now
dusk tide
odd meteor
If you dig ML Research, you can try joining an ML Research company. I know Coher...
Thanks
dusk tide
serene scaffold
apply to good companies. did you take ML-related courses?
Yes . I did an online training certification course.
Also Andrew ng's course also
desert oar
silk axle
That data gives the same thing, so you should hopefully be able to reproduce it ...
thanks, i'm going out for the day but I will let you know when I give it a shot
arctic wedgeBOT
Hey @frosty creek!
It looks like you tried to attach file type(s) that we do not allow (). We currently allow the following file types: .gif, .jpg, .jpeg, .mov, .mp4, .mpg, .png, .mp3, .wav, .ogg, .webm, .webp, .flac, .m4a, .csv, .json.
Feel free to ask in #community-meta if you think this is a mistake.
Hey @frosty creek!
It looks like you tried to attach file type(s) that we do not allow (). We currently allow the following file types: .gif, .jpg, .jpeg, .mov, .mp4, .mpg, .png, .mp3, .wav, .ogg, .webm, .webp, .flac, .m4a, .csv, .json.
Feel free to ask in #community-meta if you think this is a mistake.
 frosty creek
Hey Guys,
Created something that might make working with (Python Polars) dataframes easier. No more df.head() and you can search for code examples.
serene scaffold
frosty creek
Hey Guys,
Created something that might make working with (Python Polars) datafr...
this sort of falls under self-promotion, but I'll allow it.
Can you explain more about how it works? what's wrong with df.head(), and how does this make it better?
 bitter fiber
I like df head and tail for its purpose but maybe there is space for more
serene scaffold
head and tail are useful if you can assume that the first or last n rows of the data encapsulate the whole schema of the df. which is less likely to be true if you have an intricate indexing scheme for the rows
lapis sequoia
I was good with coding so I didn't have difficulty learning data scraping and data cleaning but now in machine learning it is kind of hard because there is so much math in it. I am thinking of using autoML is that okay?
serene scaffold
lapis sequoia
I was good with coding so I didn't have difficulty learning data scraping and da...
what's your goal?
serene scaffold
lapis sequoia
Data sciencetist
then you will eventually need to bite the bullet and learn the math
serene scaffold
lapis sequoia
or Computer sciencetist
this isn't a specific occupation
serene scaffold
serene scaffold
then you will eventually need to bite the bullet and learn the math
and when I say that you'll eventually need to learn the math, you need to start long before you'll be employment-ready. so, the sooner the better.
lapis sequoia
i agree
fringe anvil
desert oar
"residual" is stats jargon for "deviation from an estimate", aka "error".
"resi...
hey, sorry to come back at you after that long. i think i get the residual thing.. but not quite sure about the periodic? is it like a frequency? like Hz?
how does it apply or make sense in this graph?
lapis sequoia
serene scaffold
and when I say that you'll eventually need to learn the math, you need to start ...
shit there is so much
okay thanks
serene scaffold
lapis sequoia
shit there is so much
you can take it slow. just focus on some statistical algorithms that only use algebra
wooden sail
fringe anvil
hey, sorry to come back at you after that long. i think i get the residual thing...
sure, periodic means that it repeats with some frequency (or multiple frequencies, too)
fringe anvil
linear algebra, probability and statistics. im in the same boat lol @lapis sequoia
wooden sail
you might also find it as "seasonality" depending on what you're doing
lapis sequoia
i found this it says you have to do one course one by one
fringe anvil
wooden sail
you might also find it as "seasonality" depending on what you're doing
oh i did see that word in a lot of our data sets
wooden sail
fringe anvil
oh i did see that word in a lot of our data sets
if you've heard of fourier or harmonic analysis, they come in handy here
lapis sequoia
fringe anvil
linear algebra, probability and statistics. im in the same boat lol <@4562265777...
 fringe anvil
wooden sail
if you've heard of fourier or harmonic analysis, they come in handy here
fringe anvil
wooden sail
if you've heard of fourier or harmonic analysis, they come in handy here
i did see something about fourier transform. all that is related, somehow, to time series. which we havent seen yet
wooden sail
sounds about right, yes
fringe anvil
i dont like this jumping back and forth between subjects that we havent seen to finish workshops with a very close deadline
ill have to get used to it lol
lapis sequoia
it's not like that I can't learn math for data science the reason in future I will have math in A Level which teach all the requirement math for data science
lapis sequoia
fringe anvil
i dont like this jumping back and forth between subjects that we havent seen to ...
True
 zealous escarp
In bash I can repeat a command with the syntax ![number]. Is there a way to re-execute a jupyter cell like that without using the mouse to scroll back and click buttons?
serene scaffold
zealous escarp
In bash I can repeat a command with the syntax ![number]. Is there a way to re-...
if you want that, you might consider using IPython instead of jupyter
zealous escarp
serene scaffold
if you want that, you might consider using IPython instead of jupyter
ah, too bad i can't have the best of both worlds. thanks
serene scaffold
zealous escarp
ah, too bad i can't have the best of both worlds. thanks
you don't think IPython is that? it's basically jupyter but in a terminal. so your hands stay on the keyboard
zealous escarp
serene scaffold
you don't think IPython is that? it's basically jupyter but in a terminal. so yo...
my understanding is that Widgets only work in jupyter. do they also work in ipython?
serene scaffold
zealous escarp
my understanding is that Widgets only work in jupyter. do they also work in ipy...
not if they're interactive, no
frosty creek
serene scaffold
this sort of falls under self-promotion, but I'll allow it.
Can you explain mor...
You can always see your tables - check out this screenshot. When I'm using a Jupyter Notebook, I'm always doing df.head() to see a snippet of the dataframe.
 young granite
frosty creek
You can always see your tables - check out this screenshot. When I'm using a Jup...
young granite
frosty creek
You can always see your tables - check out this screenshot. When I'm using a Jup...
so in other words always have a excel kinda view?
is a table "updated" when i normalise it for example?
 steady basalt
young granite
is a table "updated" when i normalise it for example?
steady basalt
young granite
is a table "updated" when i normalise it for example?
Is this pandas?
serene scaffold
steady basalt
Is this pandas?
polars
steady basalt
Oh this guy made his own app lmao
Cool,
Meanwhile I can barely code a functioning hangman app
wise iris
can someone please help me? I'm using yolov5 with PyTorch, but I found out that it's using the CPU and not my GPU.
I went on pyTorch.org and undersood that to use the GPU version i have to use the command pip3 install torch torchvision torchaudio --extra-index-url https://download.pytorch.org/whl/cu116
so I did...
By using the command python -m torch.utils.collect_env I can see the information of pyTorch and still it says that CUDA is not available:
Is CUDA available: False
CUDA runtime version: Could not collect
GPU models and configuration: GPU 0: NVIDIA GeForce RTX 2060```
I guess I have 2 versions downloaded at the moment or something
how can I fix this?
 river sapphire
anyone know some possible solutions to the temporal credit assignment problem? i'm very new to RL so any beginner-friendly explanations would help
frosty creek
young granite
so in other words always have a excel kinda view?
Yep - the visible table reflects the dataframe in the code.
 tacit nacelle
When applying mask rcnn object detection on a video does it only detect moving object? Most codes work with background substraction method is there any way to detect non moving object also
 fossil ivy
What do you reckon would be a good figsize for this?
I have measurements on every single day of the year

I keep having the x label cut off even when I save the plot as a picture
serene scaffold
fossil ivy
What do you reckon would be a good figsize for this?
I have measurements on ever...
can you make the y axis start at 100? other than that, it's fine
idk if that will fix the xlabel part, though
fossil ivy
serene scaffold
can you make the y axis start at 100? other than that, it's fine
I need the 0 because I have a direct comparison with other graphs in my presentation, and there are values below 100 in there
fossil ivy
serene scaffold
idk if that will fix the xlabel part, though
trying plt.savefig('duration.png', dpi=300, bbox_inches='tight')
bbox_inches= "tight" might do the trick
young granite
someone knows another way of filling an uncertainty area with plotly.go instead of 2 traces with just one?
 fringe anvil
hello, im trying to simplify my code, but really it looks a bit more complex. i managed to "fix" my graph. but im not sure what i should do with this line
i, j = np.unravel_index(k, (num_rows, num_cols))
is there more basic python way to make it happen
 mighty patio
fossil ivy
What do you reckon would be a good figsize for this?
I have measurements on ever...
mighty patio
fossil ivy
What do you reckon would be a good figsize for this?
I have measurements on ever...
You should adjust the figsize according to where the figure should go, so without seeing the presentation/report/etc. we cannot say what would be a good size.
I would personally reduce size and increase the dpi. Taken together this will increase the font size and line thickness.
Big font is always good for presentations.
The plot shows very simple curves, so you do not need to make it big in order to communicate the contents.
Also: IMO it looks more professional to put the label on the curves themselves rather than use a legend, but it is more work.
Try fig.tight_layout() and see if this fixes the x-axis label. If not you can try fig.suplot_adjust(). You will have to look up the parameters.
grave frost
lapis sequoia
it's not like that I can't learn math for data science the reason in future I w...
How old are you? If you're just starting HS, you can keep the math on the backburner for a while
rugged comet
When I have multiple, one-hot encoded features, is it okay if I just concatenate them together using numpy.concatenate? Or is there a better approach that I haven't heard of?
 pliant sundial
How much python should I know before learning machine learning and machine learning libraries like numpy, pandas, matplotlib?
serene scaffold
rugged comet
When I have multiple, one-hot encoded features, is it okay if I just concatenate...
If you're doing basic stuff, that's fine
serene scaffold
pliant sundial
How much python should I know before learning machine learning and machine learn...
It doesn't matter, because learning machine learning theory is really a whole separate ordeal from learning python.
And learning how to use numpy and matplotlib won't help you do it. Those assume you know what you're trying to do.
pliant sundial
Yeah but to make ML projects how much python should I know?
Before learning libraries
serene scaffold
You shouldn't have to look up how python itself works to understand how 95% of the code you see is evaluated, even if you don't know what it does.
serene scaffold
pliant sundial
Before learning libraries
You will not learn ML just from reading the docs for ML libraries, to be clear. If you want to be an ML developer, that's a whole extra journey you need to take in addition to practicing general programming.
 crisp arrow
Do you know of any APIs or tools that extract the text from PDFs, especially Arxiv papers?
serene scaffold
crisp arrow
Do you know of any APIs or tools that extract the text from PDFs, especially Arx...
There's this https://textract.readthedocs.io/en/stable/
But keep in mind that PDFs are by their nature hostile to any system that could consistently extract clean text from them
Individual paragraphs will probably be reliably clean, if they don't have any non-language symbols (math etc). But expect to see lots of extra noise that you'll have to find a way to clean or ignore
 kind heart
Im trying to do a gridsearch to determine hyperparameters for SVM but its been like 10 hours and still not done, dataset has arnd 68k samples with 11 features split into 30% test 70% train, and has been scaled using standard scaler. Is this normal?

I tried to speed things up by increasing number of cores used (n_jobs=5) and dedicating more memory (4gb Ram) to the notebook
 coral nimbus
Can someone explain the coding process of LSTM path prediction in layman’s terms? I’ve looked through many code examples and the only things in common(which I can see) is the definition+procurement of dataset, split into train/test data and after some convoluted process the model is trained and results are presented
Is there anything I need to know about this convoluted process?
rugged comet
I have a feature that can have a combination of 337 possible values. For example, Object 1 could have positives for types 5, 37, 62, and 179. To me, this would look like an array like
[..., 0, 1, 0, ..., 0, 1, 0 ..., 0, 1, 0, ..., 0, 1, 0, ...]
where the total length of the array is 337. And the 1s are at indices 4, 36, 61, and 178.
Each object can have from 1 to 5 inclusive positive values for the types.
Would it make sense to add 337 columns to my dataframe? If I did that, I could just put a 1 or a 0 for present or not present for that type. To be clear, this is a feature that I'll be training on, not the target class that I'm trying to identify.
 versed gulch
How would I make the following code into a list comprehension?:
bf_pts = []
 if neighbours.count(255) - 1 > 2:
   bf_pts.append((z, x, y))
# where neighbours is also a list
There's no loop that I see.
versed gulch
my mistake ignore this
rugged comet
Okay.
versed gulch
does anyone know why I am getting an invalid syntax here:
bf_pts = [coord if neighbours.count(255) - 1 > 2 for coord, neighbours in coords_neighbours]

# e.g: coords_neigbours = [((1, 1), [0, 0, 0, 0, 255, 255, 0, 0, 0]), ...]
Yeah
versed gulch
why
silk axle
versed gulch
does anyone know why I am getting an invalid syntax here:
```py
bf_pts = [coord...
!list-comp
arctic wedgeBOT
Do you ever find yourself writing something like this?
>>> squares = []
>>> for n in range(5):
...    squares.append(n ** 2)
[0, 1, 4, 9, 16]
Using list comprehensions can make this both shorter and more readable. As a list comprehension, the same code would look like this:
>>> [n ** 2 for n in range(5)]
[0, 1, 4, 9, 16]
List comprehensions also get an if statement:
>>> [n ** 2 for n in range(5) if n % 2 == 0]
[0, 4, 16]
For more info, see this pythonforbeginners.com post.
silk axle
The if condition goes at the end
silk axle
versed gulch
is it always at the end?
It depends on what the if statement is for
If you want to store a different thing in the list then it goes at the beginning, but then it requires an else
odd_or_even = ['even' if n % 2 == 0 else 'odd' for n in numbers]```You can also have it at the beginning and the end
Something like py odd_or_even = ['even' if n % 2 == 0 else 'odd' for n in numbers if isinstance(n, int)]
 young granite
so ehm guys if i created a GPR function how can i get a math equation out of my data using python 🗿
young granite
young granite
so ehm guys if i created a GPR function how can i get a math equation out of my ...
numpy.polyfit
wooden sail
versed gulch
Does anyone know why Python is not recognising my key word arguement?
pass just False
versed gulch
wooden sail
pass just False
yh i caught my mistake which was a spelling error
young granite
@wooden sail u know a smart approach to construct or find a fitting math equation out of a dataset
wooden sail
hmm? you have some data you observed and want to find an equation that explains it?
young granite
i play around a lil bit with GPR and wanted to see if there is a smart approach maybe ML that is good in finding math eqautions for a given dataset

so currently i run np.polyfit on the mean_predicitions
wooden sail
what's gpr here
young granite
gaussian regression function
wooden sail
what's your blue curve there
young granite
wooden sail
what's your blue curve there
X * np.sin(X) * np.cos(X)**2
my starting funtion
wooden sail
the first question is whether you need the function to pass exactly through the data points or not
young granite
no just a good approximation
and maybe that the tool finds that its a sin function
that would be dope af
wooden sail
as a sin function, hmm
what do you know and what do you not know
e.g. do you know if it is really x sin(x) cos**2(x), but not the frequencies?
young granite
i constructed the function in a given range
therefore i do know its x sin(x) cos**2(x)
wooden sail
wdym in a given range
young granite
X = np.linspace(start=0, stop=10, num=1_000).reshape(-1, 1)
wooden sail
well but that has nothing to do with what the function is
young granite
well yes but ur question is referring to the snippet of the function in the range of 0-10
wooden sail
not really
wooden sail
what do you know and what do you not know
young granite
i do know that i created 1000 datapoints from the function x sin(x) cos**2(x)
wooden sail
ok, and what are you trying to do now
young granite
i predicted a function using mean_prediction and now i wanted to construct a math approximation to come back to the org function
or atleast to one that fits in the given range
therefore i wanted to know if theres a smart tool which finds e.g. high jumps in data points that could not be fit with a poly function and therefore must be a sin/cos function
sorry for my bad descriptions edd
wooden sail
i'm not sure i've ever seen something like that
young granite
wooden sail
i'm not sure i've ever seen something like that
mhhh sad i mean i can simply increase the polynomial function grade
and get a good fitting one but thats not rlly what i wanna do
wooden sail
that usually results in wild oscillations between the points
young granite
correct atleast between the points where not many points are
this for example is now grade 30

it fits the mean prediction
however at the end is what u just described
wooden sail
since you're treating it as if the model is unknown, your best bets are something like splines or using deep learning
young granite
can u elaborate or just ur guesses ?
wooden sail
elaborate on which part
young granite
how i would construct DL in this regard
wooden sail
make a deep neural network and train in on (x,y) pairs, hoping you have enough to get something reasonable
but as you might imagine, if you don't know the model and have very little data, there is also little you can do 😛 it means you know nothing
young granite
i mean with 6 points 😄
young granite
hahaha
wooden sail
what you already have is about as good as it gets
wooden sail
i'd pair your polynomials with a model order estimator
young granite
yeh
wooden sail
and pick the "best one" in that way
young granite
whats a model order estimator hahaha
but to come back to the DL it does not know what sin is therefore it would never give me a sin function or would it?
wooden sail
nope
but if you also have a "blind" problem (where the model is unknown), then not much you can do about it
model order estimation is the process of, after choosing a model or parametric family, choosing how many parameters to use. in this case, it would be the choice of the degree of the poly
young granite
and i simply input x and y?
 west burrow
does someone know how to work with streamlit and pandas? can some god take a look at #☕help-coffee
wooden forge
wooden forge
essentially, **how to make animation starts on press of a button in a __imshow__...
I found the solution lol
but I have another question regarding animation and how to stop an animation on condition in #help-burrito
 fading wigeon
Hey, so I'm working on transforming variables in a dataset to normality. My naive approach is to just apply every transform I know to the data and perform normality tests to see which one works best for each variable. This has proven effective thus far.
However, I should only be applying one transform to a grouping of variables. I am not sure how to evaluate which transform is best for the group as a whole. I could just count the number of times X was the most effective transform, Y, etc and choose the one of greatest incident, but I'd like to be a bit more sophisticated than that. Any ideas? Idk, summing pvalues across each transform and going with the lowest? Lol.
wooden sail
have you read about histogram equalization? alternatively, you can read on transforming PDFs https://www.cl.cam.ac.uk/teaching/2003/Probability/prob11.pdf
 fleet pulsar
hello
 timid kiln
How can I test to see if any of the cells (is that what they're called?) in the row are blank?
fline_data: pd.DataFrame = data_range.iloc[:, 11:20]
.isna().any()
assuming that you're representing blankness with NaN. which you should.
timid kiln
serene scaffold
.isna().any()
Well, I have to replace the blanks with NaN I guess?
fline_data = fline_data.replace(r'^s*$', float('NaN'), regex = True)
fline_data.dropna(inplace=True)
if len(fline_data) == 0:
    return None
The source dataframe is coming from a table in Excel. I'm checking to see if any of the values in the df are blank as it's going to "break" the rest of the program. The dataframe fline_data will always be just one row.
serene scaffold
timid kiln
Well, I have to replace the blanks with NaN I guess?
```py
fline_data = fline_da...
so "blanks" are strings that are only whitespace?
timid kiln
serene scaffold
so "blanks" are strings that are only whitespace?
A blank cell in Excel is a cell that is completely empty. I mean, there could be a space in the cell, but it's more likely that it's completely blank and devoid of data, characters, etc.
serene scaffold
timid kiln
A blank cell in Excel is a cell that is completely empty. I mean, there could b...
if a cell is truly empty, it's not an empty string any more than it's 0. empty strings and 0 are still "things". if you opened the Excel data in pandas, the cells that are truly empty are probably NaNs.
timid kiln
serene scaffold
if a cell is truly empty, it's not an empty string any more than it's 0. empty s...
Lemme put some blanks in there and see what I get. One moment please.
serene scaffold
timid kiln
Lemme put some blanks in there and see what I get. One moment please.
I'm focused mostly on moderating the #python-3-11-release-stream, so be sure to ping
timid kiln
serene scaffold
if a cell is truly empty, it's not an empty string any more than it's 0. empty s...
Oh this is promising. The blank cell shows up in the dataframe as NaN, so I don't need to run a replace on anything.
timid kiln
serene scaffold
I'm focused mostly on moderating the <#1033918720000655420>, so be sure to ping
And I was wrong, fline_data can have more than one row. I need to check if any rows have a NaN and if so, exit the function.
So I guess, grab the number of rows before and after the dropna and if those values are different I know I need to exit?
timid kiln
serene scaffold
I'm focused mostly on moderating the <#1033918720000655420>, so be sure to ping
df.isnull().values.any() according to the internet
serene scaffold
timid kiln
And I was wrong, `fline_data` can have more than one row. I need to check if *an...
"if any row has at least one NaN" is the same as "the dataframe has at least one nan", so you can just do if df.isna().any():, and that will reduce to one bool.
you don't need the values.
serene scaffold
serene scaffold
"if any row has at least one NaN" is the same as "the dataframe has at least one...
would have to be .any().any(), actually. you want to avoid using .values
timid kiln
serene scaffold
you don't need the values.
Gotcha. Thank you!! Have fun with the moderating. Didn't they just release python 3.10?
I'm forced to use 3.8.x for a lot of what I'm doing. Not a huge deal except the packages/libraries I'm forced to use are in need of updating, especially xlwings. But that's off topic ig.
serene scaffold
timid kiln
Gotcha. Thank you!! Have fun with the moderating. Didn't they just release py...
3.10 was a year ago 😄
timid kiln
serene scaffold
3.10 was a year ago 😄
lol I thought when I started using python at the beginning of this year it was 3.9... oops lol
timid kiln
serene scaffold
would have to be `.any().any()`, actually. you want to avoid using `.values`
This is something that's a bit confusing to me. When you have time later today, if you wouldn't mind, would you be able to explain how/why there's the need to chain the .any() after the dataframe multiple times? What does each instance represent? If you want to direct me to RTFM that's fine as well; I know you're busy. Thank you! 😄
serene scaffold
timid kiln
This is something that's a bit confusing to me. When you have time later today,...
DataFrame.any reduces to a Series, and then you need to do Series.any to reduce that to a scalar.
timid kiln
serene scaffold
DataFrame.any reduces to a Series, and then you need to do Series.any to reduce ...
Ah, this is new to me. OK. Noted.
Did you learn pandas on the job, or did you take a course? If you took a course or know of one you could recommend I'd appreciate it. If I could have advised me a year ago I would have told myself to drop everything and try to become an expert in pandas...
serene scaffold
timid kiln
Ah, this is new to me. OK. Noted.
Did you learn pandas on the job, or did you...
I wrote a paper that involved doing lots of calculations and creating huge latex tables, and I spent dozens of hours painstakingly re-writing ad hoc code and manually confirming my calculations, so I made a point of figuring out how to do all the calculations for the paper without using .apply or writing any for loops.
timid kiln
serene scaffold
I wrote a paper that involved doing lots of calculations and creating huge latex...
/me googles "latex table"
serene scaffold
whatever pandas thing you're trying to do, exhaust all possible options before writing a loop or using apply. and that will force you to learn the API. or perish.
timid kiln
lol
serene scaffold
timid kiln
/me googles "latex table"
you know, LaTeX. like Microsoft Word but code.
timid kiln
serene scaffold
whatever pandas thing you're trying to do, exhaust all possible options before w...
Well, I haven't learned how to use .apply, so based on your testimonial I shall continue my ignorance. 😄
Oh right. I am aware of LaTeX, never used it tho.
I'd be very interested to read your paper. I realize anonymity is important on the Internet but, would you be willing to share it with me?
Is the source code included?
serene scaffold
timid kiln
Well, I haven't learned how to use `.apply`, so based on your testimonial I shal...
.apply calls a Python function on every row/column (for DataFrame) or each element (Series), which pandas can't optimize. There are cases where pandas genuinely doesn't provide the functionality you need, and you have to use .apply, but beginners often use it as a crutch.
timid kiln
BTW beautiful cat you have there.
I have a gorgeous ragdoll but my daughter has basically stolen him from me lol. Fair enough, whatever makes her happy. 😄
serene scaffold
timid kiln
I'd be very interested to read your paper. I realize anonymity is important on ...
my real-world identity is already known. paper: https://www.sciencedirect.com/science/article/pii/S1532046421002999
source code: https://github.com/NLPatVCU/medaCy

Systematic reviews are labor-intensive processes to combine all knowledge about a given topic into a coherent summary. Despite the high labor investme…

GitHub
:hospital: Medical Text Mining and Information Extraction with spaCy - GitHub - NLPatVCU/medaCy: Medical Text Mining and Information Extraction with spaCy
timid kiln
DUDE (apologies to the pronouns idk I'm an old man). That looks like something I'd definitely be interested in, if I could apply it to chemistry papers.
timid kiln
serene scaffold
my real-world identity is already known. paper: https://www.sciencedirect.com/sc...
OK I'll have to set aside my enthusiasm and finish the task at hand. Thank you for your help and thank you for sharing that!
serene scaffold
timid kiln
OK I'll have to set aside my enthusiasm and finish the task at hand. Thank you ...
no problem 😄
@timid kiln sent you a DM btw
young granite
timid kiln
DUDE (apologies to the pronouns idk I'm an old man). That looks like something ...
what are u currently working on in chem field? If i might ask :)?
timid kiln
young granite
what are u currently working on in chem field? If i might ask :)?
Oh, I'm a chemical engineer. I'm developing a workflow for a program called PIPESIM. However, grabbing data out of industry papers would be pretty darn awesome. That's why I was interested in what Stelercus was talking about.
young granite
timid kiln
Oh, I'm a chemical engineer. I'm developing a workflow for a program called PIP...
yeh thats why i ask im a CE myself but more in the applied field
timid kiln
young granite
yeh thats why i ask im a CE myself but more in the applied field
Forgive me, what do you mean by applied?
young granite
timid kiln
Forgive me, what do you mean by *applied*?
i guessed u do plant engineering and i am more in the field of "normal" chemistry
timid kiln
young granite
i guessed u do plant engineering and i am more in the field of "normal" chemistr...
This is correct. I've worked in production facilities, engineering design and construction, etc. I hated lab in college so had no interest in pursuing a PhD or R&D.
 shadow halo
Hi people, how can I use the Panda's .apply() function to apply a Python function that we can call .func() for the sake of the explanation on a list containing a String type of elements. Basically iterating on the list applying .func() on each item
 storm kelp
Any spark users here?
storm kelp
shadow halo
Hi people, how can I use the Panda's `.apply()` function to apply a Python funct...
df.apply(lambda, .func)
I think?
shadow halo
storm kelp
df.apply(lambda, .func)
The thing is idk what to write in the lambda to iterate on the elements of my list
I'm kinda lost
storm kelp
shadow halo
The thing is idk what to write in the lambda to iterate on the elements of my li...
Have you defined the function already?
shadow halo
Yes the function works on single elements
So all I have to do is make it pass on every item
 harsh edge
I think I have the same problem
storm kelp
@shadow halo you want the function to apply to every element of a series?
harsh edge
Im trying to do something like:
df.groupby['A','B'].apply(value_counts().value1/(value_counts().value1 + value_counts().value2)
Is this related to your problem @shadow halo?
when I do df.value_counts(), it works, but inside the apply() it does not
shadow halo
storm kelp
<@259309552191668234> you want the function to apply to every element of a serie...
I have a column that contains list type of data, if it was a normal single value, it would've been trivial but here I gotta pass my function on the elements of the list of the column
storm kelp
shadow halo
I have a column that contains list type of data, if it was a normal single value...
What does the function do
shadow halo
storm kelp
What does the function do
it returns the stem of the word that you give to it
shadow halo
harsh edge
Is this related to your problem <@259309552191668234>?
Sorry it's not simillar, I hope you get help soon
storm kelp
You want the output to be saved as a column in the df or don't care?
harsh edge
shadow halo
Sorry it's not simillar, I hope you get help soon
no worries, I won't bother until u get your help then. GL!
shadow halo
storm kelp
You want the output to be saved as a column in the df or don't care?
Yes the output would be stored in a new column
I wanna give more informations: The column has a list[str], what can I type in the lamda function for me to iterate on the elements of that said list. Because I'm used to work with single values and not this data type
storm kelp
@shadow halo
df.assign("new column" = func(df.column))
shadow halo
Doesn't work
Because I'm working with a function that need to work with a singular element of the list not a the whole of it
hence why I want to iterate on it inside the lambda
shadow halo
What is that axis=1 for?
storm kelp
You have pandas installed right?
shadow halo
Yeah
storm kelp
Axis=1 means it will apply the function to each row. Axis=0 would be each column
Might need .select("column"). before the apply statement if you want it to only apply to one column
serene scaffold
storm kelp
Any spark users here?
Always ask your actual question. Never ask if people know about the topic of a question without asking the actual question.
serene scaffold
shadow halo
Hi people, how can I use the Panda's `.apply()` function to apply a Python funct...
Please explain what you are trying to do. You should avoid using apply as much as possible.
storm kelp
@serene scaffold
Having issues with .count in PySpark where it's taking a long time to count rows from a dataframe of 25 rows (filtered from a very large dataset). Is this an inherent thing with PySpark or should I examine the code more closely?
shadow halo
serene scaffold
Please explain what you are trying to do. You should avoid using apply as much a...
I'm working on text stuff in uni, need to iterate on a list of word in df column and apply a function on every element
steady basalt
@serene scaffold i got a job offer… 😬 first DS related role
serene scaffold
shadow halo
I'm working on text stuff in uni, need to iterate on a list of word in df column...
Please be more specific. You can probably accomplish your actual goal more efficiently if you don't force yourself to think in terms of iteration.
steady basalt
Looks like I’m gona be back here
shadow halo
serene scaffold
Please be more specific. You can probably accomplish your actual goal more effic...
I'm burnt from all the grind, I feel it doesn't need much research. What I wanna achieve is a applying a stem function on lists contained in a column (in a pandas DF), that's why I'm using the .apply(), which helped me because I worked on full Strings before segmenting that string for stemming each element of the phrase. So all I need is: What to write in the lambda function, is it a for loop? or what trickery should I use to explore that list on each row
Thank you for your assistance guys I really appreciate it. I'm gonna look it up with classmates if they got on the same approach as me on the problem. I think I'm doing this the wrong way from the start
harsh edge
Hi friends! I have a problem using the .apply() to a pandas dataframe. What I'm trying to do is something in the lines of:
df.groupby['A','B'].apply(value_counts().value1/(value_counts().value1 + value_counts().value2)
That is, I wan't to get the ratio of value1 when grouping by A and B. My problem is, df.value_counts() works fine, but when I have to put value_counts() in the apply, it does not work. I've just tried ```py
df.groupby['A','B'].apply(lambda x: x.value_counts().value1/(x.value_counts().value1 + x.value_counts().value2)
and it also does not work because some groups don't have value1 or value2.

 What I want is tranforming df1 into df2, following the rule above, where SR is value1 and SL is value2:
```py
df = pd.DataFrame({'Agent':['A','A','B','B','A','A','A','B'],
                   'Month':[1,1,1,1,2,2,2,2],
                   'Value':['SR','SR','LR','SR','SR','LR','LR','LR']})

df2 = pd.DataFrame({'Agent':['A','A','B','B','A','A','A','B'],
                   'Month':[1,1,1,1,2,2,2,2],
                   'Value':['SR','SR','LR','SR','SR','LR','LR','LR'],
                   'Grouping': [1,1,0.5,0.5,1/3,1/3,1/3,0]})
 feral hull
bold pumice
Hey everyone!
- I developed neograd, a deep learning framework created from scr...
feral hull
bold pumice
Hey everyone!
- I developed neograd, a deep learning framework created from scr...
Neat
That’s very very cool, well done :)
serene scaffold
shadow halo
I'm burnt from all the grind, I feel it doesn't need much research. What I wanna...
I understand that you're tired. You're still telling me about how you want the expected solution to look, without telling me what the underlying problem is. I can't work with that.
storm kelp
I think he has lists stored in each row and wants his function to be applied to each element of each list in each row.
Imo I would tidy/reformat the data but it depends on what exactly he's trying to do
scenic oasis
Hey, I recently created an "AI" that you can chat with and can be used in any language (like spanish, dutch etc etc). But I recently found out discord etc dont allow selfbotting, so the porpuse for the AI kinda dissapeared
Does anyone have a cool idea I can use my AI for to keep learning? not sure what I should do with it now xD
fringe anvil
im trying to split on a comma to get the city of my "Purchase Address" column .. and store the result in a new column ["city"]
i cant quite understand why it's saying 'Series' object has no attribute 'split' .. is there a specific method i can use for this?
all_data["city"] = all_data["Purchase Address"].split(",")[1]

hmm .str.split ?
serene scaffold
scenic oasis
Hey, I recently created an "AI" that you can chat with and can be used in any la...
you can make a bot account
serene scaffold
fringe anvil
im trying to split on a comma to get the city of my "Purchase Address" column .....
you have to do .str.split(','). .str. is the accessor for string methods. but once you make that change, it will break for a different reason.
fringe anvil
serene scaffold
you have to do `.str.split(',')`. `.str.` is the accessor for string methods. bu...
yup, now its complaining my len() isnt the same
serene scaffold
fringe anvil
yup, now its complaining my len() isnt the same
that's because the [1] part is done to the whole Series, not on the individual lists that split creates. but you should probably just use .str.extract
fringe anvil
serene scaffold
that's because the `[1]` part is done to the whole Series, not on the individual...
hmm, so extract would be the way to go.. i was making stuff a bit complicated i guess
hmm would .apply somehow be useful here?
serene scaffold
fringe anvil
hmm would .apply somehow be useful here?
Only if you want to cop out.
fringe anvil
i dont see how to use extract.. apparently its for regex?
serene scaffold
fringe anvil
i dont see how to use extract.. apparently its for regex?
You'd write a pattern that matches everything up to the first ,
Or between the first and second comma, idk
serene scaffold
serene scaffold
`.apply` calls a Python function on every row/column (for DataFrame) or each ele...
Using apply is tantamount to giving up
fringe anvil
serene scaffold
Using apply is tantamount to giving up
oh i see
im almost there
[,]\s[A-Za-z]*[,]
its not quite working tho
serene scaffold
Use regex101
fringe anvil
serene scaffold
Use regex101
yup
 serene scaffold
Great
fringe anvil
i need to drop the commas, but how do i drop them, but still specify that i need whats between them
serene scaffold
()
fringe anvil
(,\s)[A-Za-z]*(,)
fringe anvil
oh.. lol sry

 serene scaffold
fringe anvil
is that a normal behavior?
serene scaffold
fringe anvil
is that a normal behavior?
either it's normal behavior, or you found a bug. and you probably didn't find a bug.
serene scaffold
fringe anvil
oh btw i found a simple solution to my city column
interesting. does every row have the same number of commas?
fringe anvil
serene scaffold
either it's normal behavior, or you found a bug. and you probably didn't find a ...
they "should" be floats, but looks like pandas thinks they are string?
serene scaffold
fringe anvil
they "should" be floats, but looks like pandas thinks they are string?
I'd have to know what all the values in the column are to understand why you got that result.
fringe anvil
serene scaffold
interesting. does every row have the same number of commas?
it's an address format, so yes, 2 commas
fringe anvil
serene scaffold
I'd have to know what all the values in the column are to understand why you got...

it's some amazon sales csv apparently
serene scaffold
keep in mind that Pandas objects are probably the most complicated in the entire Python ecosystem. it's pretty much impossible to make definitive statements about how a DataFrame will behave in a given situation unless you're very familiar with how it's arranged.
serene scaffold
fringe anvil
idk, you might have to do df['Price Each'].tolist() and put it in the pastebin
!paste
arctic wedgeBOT
Pasting large amounts of code
If your code is too long to fit in a codeblock in Discord, you can paste your code here:
https://paste.pythondiscord.com/
After pasting your code, save it by clicking the floppy disk icon in the top right, or by typing ctrl + S. After doing that, the URL should change. Copy the URL and post it here so others can see it.
fringe anvil
serene scaffold
keep in mind that Pandas objects are probably the most complicated in the entire...
hmm, there could be a mistake, and somehow a string is somewhere in those 186000 rows.. ? then pandas tries to convert that column to the path of less resistance?
serene scaffold
fringe anvil
hmm, there could be a mistake, and somehow a string is somewhere in those 186000...
what is df['Price Each'].dtype?
fringe anvil
serene scaffold
what is `df['Price Each'].dtype`?
dtype('O')
serene scaffold
fringe anvil
dtype('O')
I guess that means object? weird.
fringe anvil
serene scaffold
I guess that means object? weird.
yeah, not quite sure, some says its pandas string, some says python object
rugged comet
Currently, my labels are lists of strings. For example, one label might look like
["W"]
or
["W", "U"]
An object can have between 1 and 5 labels.
Would it make more sense to have 1 output layer with 5 nodes or 5 output layers with 1 node each? What's the reasoning? If you need more information about the structure of the problem, let me know.
serene scaffold
rugged comet
Currently, my labels are lists of strings. For example, one label might look lik...
how would you have more than one output layer?
rugged comet
serene scaffold
how would you have more than one output layer?
Using the tensorflow functional api.
serene scaffold
rugged comet
Using the tensorflow functional api.
I don't use tensorflow. you might train a network that has five nodes in the output layer, and the goal is for each node representing a class that a given instance belongs to has an activation greater than .5
I'm not familiar with problems where one instance can belong to more than one class, but if those classes are grounded in meaningful properties of the real-world things they represent, it should be learnable.
rugged comet
I think it's called multi-label classification.
serene scaffold
cool
there's multi-class classification, but that's where there's more than two classes that something could be. not where it could belong to more than one of them.
rugged comet
Yeah for my problem, one object can have multiple labels.
Reading about it now
https://machinelearningmastery.com/multi-label-classification-with-deep-learning/

Multi-label classification involves predicting zero or more class labels. Unlike normal classification tasks where class labels are mutually exclusive, multi-label classification requires specialized machine learning algorithms that support predicting multiple mutually non-exclusive classes or “labels.” Deep learning neural networks are an examp...
It looks like they say to use one layer with multiple nodes.
desert oar
fringe anvil
hey, sorry to come back at you after that long. i think i get the residual thing...
thing goes up and down on regular intervals. like how temperature goes down at night and up during the day. so yeah, like a wave with a frequency.
if you have a graph of any time series data, you should be thinking about whether there is a periodic or seasonal component to the data.
@silk axle
import matplotlib.pyplot as plt
import pandas as pd

data = pd.read_csv('iqigaxesot.csv')
data['from'] = pd.to_datetime(data['from'])
data['to'] = pd.to_datetime(data['to'])
data['intensity.forecast'] = data['intensity.forecast'].astype(float)
data['intensity.index'] = data['intensity.index'].astype('category')

data['intensity.difference'] = data['intensity.forecast'] - data['intensity.actual']

(
    data.set_index('to').sort_index()
    [['intensity.forecast', 'intensity.actual', 'intensity.difference']]
    .plot()
)
plt.show()
the only difference is that each output node has an individual sigmoid function instead of applying softmax to the entire layer
and of course you need to reconsider your loss function and evaluation metrics
the math all does kind of "just work" though
rugged comet
I haven't read about softmax until now. It sounds like for my problem, I should have one output layer with 5 nodes. And I should use softmax for the activation.
desert oar
rugged comet
I haven't read about softmax until now. It sounds like for my problem, I should ...
if one observation can have multiple labels, then you don't want softmax. softmax is for when you have one possible label and you need all the scores to sum to 1 (like a probability distribution over labels)
if you have multiple labels on each observation, then you're effectively building separate binary classifiers for each label, albeit with shared features inside the hidden layers
rugged comet
I'm mostly familiar with sigmoid. Softmax sounds like sigmoid for multiple outputs.
I didn't know you could apply multiple activation functions node-wise to one layer.
desert oar
rugged comet
I'm mostly familiar with sigmoid. Softmax sounds like sigmoid for multiple outpu...
softmax is a generalization of sigmoid to multiple values, compressing them all so that they sum to 1
rugged comet
I see. That's not really what I want then. You make it sound like I want a sigmoid for each node which makes sense.
desert oar
rugged comet
I see. That's not really what I want then. You make it sound like I want a sigmo...
yep, and that's what the code in the article you posted does
model.add(Dense(n_outputs, activation='sigmoid'))
Oh I see. I thought I had to do something fancy if I wanted to apply an activation function to multiple nodes. But now it seems so simple.
Thank you for helping me.
 potent parrot
 shell crest
I've never been able to get pyqtgraph to work though
shell crest
I've never been able to get pyqtgraph to work though
why not? what issues have you had; btw we (pyqtgraph) have a channel here you can ask for specific help there
rugged comet
When creating a train test split, is the test data also considered the validation data? Or is the validation data a different subset of all the data?
desert oar
rugged comet
When creating a train test split, is the test data also considered the validatio...
the terminology is loose and not everyone follows the same conventions
rugged comet
I see. Thanks.
lapis sequoia
'_xsrf' argument missing from POST
I am getting this
and not able to save my notebook
rugged comet
I'm trying to get the vocabulary size so I know the shape of my text input.
text_vectorizer = layers.TextVectorization()
print(x_train_text)
print(x_train_text.dtype)
text_vectorizer.adapt(x_train_text)
I get this seemingly strange output which says that it doesn't support floats.
https://pastebin.com/RBGvdrgL
I don't think my inputs are floats so I don't know what's going on.
Pastebin
Pastebin.com is the number one paste tool since 2002. Pastebin is a website where you can store text online for a set period of time.
My end goal is to get the shape for this input layer
text_inputs = keras.Input(shape=())
 sleek fjord
how to run tensorflow version 1.13 model on parallel GPUs?
lapis sequoia
rugged comet
I'm trying to get the vocabulary size so I know the shape of my text input.
```p...
Hey.
rugged comet
Hello
lapis sequoia
From what I can see in their docs

you either need an np array or a tf.data.Dataset, in your case it is a plaintext.
rugged comet
x_train_text = np.asarray(x_train[2])
text_vectorizer = layers.TextVectorization()
text_vectorizer.adapt(x_train_text)
This outputs the same error.
lapis sequoia
I'm checking how to correctly do it, gimmi a while.
rugged comet
Okay. Thank you for trying to help me.
Before applying numpy.asarray, x_train_text is a pandas.core.series.Series of strings if that makes a difference.
lapis sequoia
wasn't it plain text?
rugged comet
Well it's a dataframe of plaintext. I thought that would work tbh
lapis sequoia
right, so series of words I suppose?
rugged comet
A series of sentences.
print(x_train_text)
0        At the beginning of your upkeep, you may say "...
1        {3}{B}, Exile a permanent you control with a L...
2        Cannot be the target of spells or effects. Wor...
3        When you set this scheme in motion, until your...
4        Spells and abilities you control can't destroy...
                               ...
14330    When Rith's Grove enters the battlefield, sacr...
14331    Flying\nWhenever Rith, the Awakener deals comb...
14332    Whenever a creature you control deals combat d...
14333                       You gain 4 life.\nDraw a card.
14334    Return target artifact card from your graveyar...
Name: text, Length: 14335, dtype: object
Right got it.
rugged comet
x_train_text = x_train[2].to_list()
This worked lol. Didn't even know this method existed.
https://datascience.stackexchange.com/questions/82440/valueerror-failed-to-convert-a-numpy-array-to-a-tensor-unsupported-object-type

Data Science Stack Exchange
I have written the following code for a neural network to perform regression on a dataset, but I am getting a ValueError. I have looked up to different answers and they suggested to use df = df.val...
lapis sequoia
okay wait.
lapis sequoia
rugged comet
```py
x_train_text = x_train[2].to_list()
```
This worked lol. Didn't even know ...
text_dataset = pd.Series(["At the beginning of your upkeep, you may say ", "{3}{B}, Exile a permanent you control with a L", "Cannot be the target of spells or effects. Wor"])
max_features = 5000  # Maximum vocab size.
max_len = 4  # Sequence length to pad the outputs to.
vectorize_layer = tf.keras.layers.TextVectorization(
 max_tokens=max_features,
 output_mode='int',
 output_sequence_length=max_len)

vectorize_layer.adapt(text_dataset)
This works.
I'll see now why yours doesn't.
removing those args made some warning but still working. Are you sure in your case its pd.Series?
rugged comet
lapis sequoia
removing those args made some warning but still working. Are you sure in your ca...
x_train_type = x_train[0]
print(type(x_train_type))
<class 'pandas.core.series.Series'>
hm same.

 thorn birch
I need someone to help me with installing cuda that match tensorflow 2.9.1 can anyone do it?
 copper fjord
so i have a dataframe in pandas that looks like this
Day Consumption(KWh)
0 1 2.144
1 1 2.895
2 1 2.462
3 1 2.273
4 1 2.282
... ... ...
715 30 6.019
716 30 5.899
717 30 4.232
718 30 3.881
719 30 3.876
What i want is to calculate daily consumption
and make a new dataframe out of it
lapis sequoia
copper fjord
so i have a dataframe in pandas that looks like this
Day Consumption(...
as in sum of day 1, 2 and stuff like that? checkout groupby.
!d pandas.DataFrame.groupby
arctic wedgeBOT
DataFrame.groupby(by=None, axis=0, level=None, as_index=True, sort=True, group_keys=_NoDefault.no_default, squeeze=_NoDefault.no_default, observed=False, dropna=True)```
Group DataFrame using a mapper or by a Series of columns.

A groupby operation involves some combination of splitting the object, applying a function, and combining the results. This can be used to group large amounts of data and compute operations on these groups.yes
i want the total sum for each day
but i dont know how to use gropby
lapis sequoia
yeah checkout above docs, they have example as well.
copper fjord
hmm
young granite
copper fjord
hmm
!e
import pandas as pd
df = pd.DataFrame({'day': ['1', '1', '2', '3'],
                   'kwh': [2.8, 3.2, 6.4, 8.4]})
new_df = df.groupby(by=["day"]).sum()
print(new_df)```@young granite :white_check_mark: Your 3.11 eval job has completed with return code 0.
001 |      kwh
002 | day
003 | 1    6.0
004 | 2    6.4
005 | 3    8.4
 unique ridge
I think this is the right place to ask this so lets give it a shot 🔥 . Lets say we have the following picture [types of scales]:
I am a bit struggling with explaining to mysefl what the right values in my dataset are (even though rapid miner can say it to me).
Nominal can be anything like the second picture.
Ordinal is ranking based for example of how you feel 1 - sad .... 5 - super happy
then we have 2 i dont really understand.
- Interval is numeric but then i have a hard time to understand it (see 3rd pic)
- Same goes for ratio but i see in the 4th pic there has to be equal distances.
If i would have greenhouse data and that data has a row of relative humidity. Would that still be nominal?


 whole rain
excuse me how i can't pd read the csv because this problem
 serene scaffold
whole rain
excuse me how i can't pd read the csv because this problem
serene scaffold
whole rain
excuse me how i can't pd read the csv because this problem
Please don't ask people to read screenshots of text.
it's easier for everyone if you put the actual text as text into the chat.
 crystal widget
whole rain
excuse me how i can't pd read the csv because this problem
crystal widget
whole rain
excuse me how i can't pd read the csv because this problem
I think some character is not being recognized in the UTF-8 codec. You can set encoding_errors='ignore' or set another encoding.
pd.read_csv(df_path, sep='\t', names=['review_text', 'category'], encoding_errors='ignore')
Doing that you will ignore the error and continue reading with malformed data.
You can verify in position 832 what is the invalid byte and set the correct encoding
desert oar
unique ridge
I think this is the right place to ask this so lets give it a shot 🔥 . Lets say...
avoid getting too caught up in these specific categorization of types of data. it's best to think of them as a hierarchy of "what you are allowed to do" with any particular data feature. it makes sense to compute intervals on an "interval" feature, but it doesn't make sense to compete ratios, so it's not a "ratio" feature.
relative humidity cannot go below zero, right? so i would say that is a ratio scale
 next matrix
I completed my A.I
Includes Neural Network, Deep Learning, Machine Learning, Language Processing
But I Want To Give Thinking Power
How is it Possible..
desert oar
next matrix
But I Want To Give Thinking Power
not possible yet. check back in 100 years
next matrix
O
unique ridge
desert oar
avoid getting too caught up in these specific categorization of types of data. i...
Ah okey, with our CRISP-DM phases i also do a data description. Normally i would have put in a table whether it is a string or an int, but i wanted to do these values now. Relative humidity is in percentages and goes from 0 to 100.
desert oar
unique ridge
Ah okey, with our CRISP-DM phases i also do a data description. Normally i would...
consider that there is a difference between the "physical" data type (e.g. float64), the "real world" data type (a real number), and any "constraints" or "formatting" required (in the range 0 - 100)
and this "interval, ratio, ordinal, nominal" system is yet another way to categorize data
unique ridge
but it should be good to categorize them then right?
desert oar
unique ridge
but it should be good to categorize them then right?
yeah it's a useful tool for reasoning about data
but it's not something you should obsess over either. the most important distinctions are nominal vs. ordinal vs. ratio/interval. you must not confuse those.
the distinction between ratio and interval is much less important
unique ridge
youre right about that to not obsess over it. In our python datascience courses there was talked about this system and i found it a good case to use it in my lil datascience project i have. Yet id still find it a bit hard to determine on whether should be interval / ratio. Like i just want to know when is what
I have it written out like this now:
Attribute | Type | Desc
x - string - bla bla
y - float - bla bla bla
 coral cradle
I have a data set with 13 variables and some of the datasets have outliers. I want to remove them. My question is that if I were to remove the record with the outlier would the entire record be removed?
 fringe anvil
yesterday this was working, but now i get invalid literal for int() with base 10: 'Quantity Ordered'
df["Price Each"] = df["Price Each"].astype("float64")
df["Quantity Ordered"] = df["Quantity Ordered"].astype("int64")
is that first comma before Order ID normal? could it be messing up my dataframe
 desert oar
unique ridge
youre right about that to not obsess over it. In our python datascience courses ...
desert oar
unique ridge
youre right about that to not obsess over it. In our python datascience courses ...
string data can't be interval or ratio unless you define magnitude, difference (intervals), and zero for strings
you can define those things, but normally text data is either ordinal or nominal or something else
consider that there is data that is even less structured than nominal
e.g. a blog post: it's not nominal data, it's completely unstructured text
or maybe a json document, which you might say is "structured" (it might even follow a specific schema) but is itself none of those categories
the sooner you stop confusing "physical data types" (string, float) with "real world data entities" (person name, eye color, temperature), the sooner you can start doing real data analysis
desert oar
fringe anvil
yesterday this was working, but now i get invalid literal for int() with base 10...
you messed up loading your data. it looks like the column names are embedded as the first row of the data.
unique ridge
So, lets say i have the following stuff:
date, avg temperature, relative and abs humidity, and radiation are all nominal?
fringe anvil
desert oar
you messed up loading your data. it looks like the column names are embedded as ...
 desert oar
unique ridge
So, lets say i have the following stuff:
date, avg temperature, relative and abs...
desert oar
unique ridge
So, lets say i have the following stuff:
date, avg temperature, relative and abs...
no, why would they be? read the definitions again.
date is interval, temperature and humidity and radiation are all ratio.
fringe anvil
yeah thats what i was thinking, why is it trying to convert the column names
desert oar
fringe anvil
yeah thats what i was thinking, why is it trying to convert the column names
you tell me. show me a sample of your data (e.g. the first 10 lines of the csv file) and the code you used to load it
unique ridge
desert oar
the sooner you stop confusing "physical data types" (string, float) with "real w...
so the basic trick is to stop thinking like a programmer? 😛
desert oar
unique ridge
so the basic trick is to stop thinking like a programmer? 😛
yes. software and code is a tool for carrying out data analysis, modeling, machine learning, etc.
treat it like a tool
unique ridge
okay okay
desert oar
(btw you should have that mindset in all programming anyway, but it's especially important in data science)
unique ridge
imma go read that stuff again and then i will give you my answers if you would like.
fringe anvil
filenames = glob(path+"/sales*.csv")
all_data = pd.concat([pd.read_csv(f) for f in filenames],
                     ignore_index=True).to_csv("../data/all_data.csv",index=False)
df = pd.read_csv("../data/all_data.csv")
Order ID,Product,Quantity Ordered,Price Each,Order Date,Purchase Address
176558,USB-C Charging Cable,2,11.95,04/19/19 08:46,"917 1st St, Dallas, TX 75001"
,,,,,
176559,Bose SoundSport Headphones,1,99.99,04/07/19 22:30,"682 Chestnut St, Boston, MA 02215"
176560,Google Phone,1,600,04/12/19 14:38,"669 Spruce St, Los Angeles, CA 90001"
176560,Wired Headphones,1,11.99,04/12/19 14:38,"669 Spruce St, Los Angeles, CA 90001"
176561,Wired Headphones,1,11.99,04/30/19 09:27,"333 8th St, Los Angeles, CA 90001"
176562,USB-C Charging Cable,1,11.95,04/29/19 13:03,"381 Wilson St, San Francisco, CA 94016"
176563,Bose SoundSport Headphones,1,99.99,04/02/19 07:46,"668 Center St, Seattle, WA 98101"
176564,USB-C Charging Cable,1,11.95,04/12/19 10:58,"790 Ridge St, Atlanta, GA 30301"

looks like i converted order date correctly
alright got it

then i used .astype()

woohoo
desert oar
i didn't even know about convert_dtypes
normally i like to also convert strings to string, i'm surprised it left those as object
and i'm also very surprised that price each wasn't loaded as float by default
i'd still be very skeptical here
pandas should load numerical data as float by default
if it doesn't, that means something is wrong, and convert_dtypes might be too aggressive
fringe anvil
so i used glob to parse multiple files and concat them together. could it be the problem? there is left over single quotes a bit everywhere, where the joining happened
desert oar
fringe anvil
so i used glob to parse multiple files and concat them together. could it be the...
that shouldn't be a problem because you're constructing a new dataframe inside pandas, and saving that. but it can be a problem if one of the individual dataframes was loaded incorrectly before concat'ing
fringe anvil
i restarted the kernel and cleared output. i had to go back and forth between convert_dtypes(), dropna() and reset_index() then .astype() in order to make it happen .. around 5-6 times for it to finally stick
something definitely wrong as you pointed out
desert oar
fringe anvil
i restarted the kernel and cleared output. i had to go back and forth between co...
this is a normal experience, i'm sorry to say
fringe anvil
now the columns are aligned tho. in the last screenshots it was a bit wonky
 desert oar
you do it less and less as you gain more experience. you eventually make fewer mistakes and develop better debugging skills & better intuition for what might be going wrong. but it still happens
desert oar
fringe anvil
now the columns are aligned tho. in the last screenshots it was a bit wonky
is order id globally unique? if so, consider making it the index
that way you have meaningful row labels
and you can always access rows by "position" with .iloc
fringe anvil
desert oar
is order id globally unique? if so, consider making it the index
hmm, its amazon sales data, it should be unique by purchase
desert oar
so each product might be part of an order, meaning that order ids can be shared across multiple products?
oh i see, rows 2 and 3 have the same order id
fringe anvil
its the same order im guessing by order date
fringe anvil
yesterday i was trying to split a column and keep just the city from the address. i tried regex, and it was a mess, then i came up with this

i was so proud lol
desert oar
fringe anvil
yesterday i was trying to split a column and keep just the city from the address...
nice! note of course that this relies on the addresses being formatted in a specific way, but in this case it looks like they are
fringe anvil
desert oar
nice! note of course that this relies on the addresses being formatted in a spec...
yup, nicely comma separated, by street, city and zip code. it was one of those HAHA! moment
hmm, i thought i had a good logic here lol

TIL: ctrl+enter instead of shift+enter lol
serene scaffold
fringe anvil
hmm, i thought i had a good logic here lol
you can't add a column that's indexed differently
sales_by_month would be per month.
fringe anvil

in my head, it should take every month, like january, add all the "total_paid" together for that month. and return a dataframe ... oh
this is a new data frame with different amount of rows
coral cradle
coral cradle
I have a data set with 13 variables and some of the datasets have outliers. I wa...
could someone let me know
 serene scaffold
fringe anvil
serene scaffold
fringe anvil
if you have more than one year, this combines months from different years
harsh edge
harsh edge
Hi friends! I have a problem using the .apply() to a pandas dataframe. What I'm ...
Hi guys, can someone help me with this problem?
I've also tried to do a function
def proporcao(x):
    try:
        x.value_counts().SR
    except:
        try:
            x.value_counts().LR
        except:
            prop = np.nan
        else:
            prop = 0
    else:
        try:
            x.value_counts().LR
        except:
            prop = 1
        else:
            prop = x.value_counts().SR/(x.value_counts().SR + x.value_couts().LR)
    return prop
and doing apply(proporcao)
but it returns only nan
harsh edge
harsh edge
I've also tried to do a function
```py
def proporcao(x):
try:
x.val...
Oh the function works! There was a typo
fringe anvil
serene scaffold
if you have more than one year, this combines months from different years
its all from 2019. but good point, if it was from different years too
harsh edge
sorry for the bother guys :)
lapis sequoia
fringe anvil
its all from 2019. but good point, if it was from different years too
in that case, you can pass by as a list too just as a side note.
fringe anvil
is that logic any good? total paid per "hour" of the day .. the question asks, what time should we display advertisements to maximize likelihood of customer's buying product.. my logic would be, advertise where theres most sales, cause thats where the users are more actif? im thinking between 10am and 9pm.. but that might be too large .. are they talking about a specific hour?

ill go with 7pm. lower the ads cost lol
.agg() is faster than .apply() right?
desert oar
fringe anvil
is that logic any good? total paid per "hour" of the day .. the question asks, w...
that's what they mean by hour of day, yes
desert oar
fringe anvil
.agg() is faster than .apply() right?
they are different functions that serve different purposes
use agg for aggregation on individual columns
use apply for transformations on multiple columns, and/or for operations that aren't strictly aggregating many rows to one row.
fringe anvil
desert oar
they are different functions that serve different purposes
gotcha thanks
im having a question here, asking me what products are sold together most often. would there be a way to see that?