#data-science-and-ml
1 messages · Page 7 of 1
 misty flint
 atomic fox
can anyone recomend a python package for excel data?
 serene scaffold
misty flint
<@253696366952316929> how do you feel about this quote
serene scaffold
misty flint
<@253696366952316929> how do you feel about this quote
someone's hungry
serene scaffold
atomic fox
can anyone recomend a python package for excel data?
pandas
serene scaffold
misty flint
<@253696366952316929> how do you feel about this quote
in either case, I think the quote is a facetious remark about the graphic and how it doesn't communicate anything without context.
atomic fox
pandas is like the gold standard?
misty flint
serene scaffold
in either case, I think the quote is a facetious remark about the graphic and ho...
thats fair.
atomic fox
i used to use pyxl or whatever a few years ago
serene scaffold
atomic fox
i used to use pyxl or whatever a few years ago
pandas uses openpyxl to do the actual interfacing with excel
misty flint
i think it really represents the popularity of the transformer model in various use cases
serene scaffold
misty flint
i think it really represents the popularity of the transformer model in various ...
robots in disguise
 hazy saddle
Ok, now I have a series of boolean, should I use dataframe.loc??
serene scaffold
hazy saddle
Ok, now I have a series of boolean, should I use dataframe.loc??
yes. good job 💚
hazy saddle
serene scaffold
yes. good job 💚
thx Stelercus, you're tough but wise!
hazy saddle
serene scaffold
yes. good job 💚
I've just realize I'm having the same problem, only get the limit dates, not the ones in the middle
serene scaffold
hazy saddle
I've just realize I'm having the same problem, only get the limit dates, not the...
you should look at the data, sorted by the date column, and make absolutely sure that rows between the two dates are even there
because what between does is pretty clear.
hazy saddle
this is a piece of the series of between method:
7166 True
7167 False
this is the result of printing those indexes:
print(data_relevant["FechaEncuesta"][7167]) // 2022-08-07 00:00:00
print(data_relevant["FechaEncuesta"][7166]) // 2022-07-07 00:00:00
serene scaffold
hazy saddle
this is a piece of the series of between method:
7166 True
7167 False
...
is the dataframe even sorted on FechaEncuesta?
because that isn't required to be the case for Series.between to work.
hazy saddle
serene scaffold
is the dataframe even sorted on FechaEncuesta?
like this?
data_relevant = data_relevant.sort_values("FechaEncuesta")
serene scaffold
hazy saddle
like this?
data_relevant = data_relevant.sort_values("FechaEncuesta")
yes
hazy saddle
its sorted and still doesn't work....😟
serene scaffold
hazy saddle
its sorted and still doesn't work....😟
are you using a jupyter notebook?
hazy saddle
nope, vs code
serene scaffold
hmm
can you show me the code for when you call between? because I don't even know what your end dates are
 lapis sequoia
What would happen if you did backprop with a slightly modified derivative?
serene scaffold
lapis sequoia
What would happen if you did backprop with a slightly modified derivative?
slightly modified how?
lapis sequoia
Mhm like it had a +1 and you removed it
serene scaffold
removed what?
lapis sequoia
The +1 term
serene scaffold
so like, if you're taking the derivative of 2x^2 + 4x, use 2x instead of 2x + 4?
 arctic wedgeBOT
Hey @hazy saddle!
It looks like you tried to attach file type(s) that we do not allow (.zip). We currently allow the following file types: .gif, .jpg, .jpeg, .mov, .mp4, .mpg, .png, .mp3, .wav, .ogg, .webm, .webp, .flac, .m4a, .csv, .json.
Feel free to ask in #community-meta if you think this is a mistake.
serene scaffold
@hazy saddle you don't have to show all the code and all the data. just an example that replicates the problem.
hazy saddle
serene scaffold
can you show me the code for when you call between? because I don't even know wh...
ok, the data too heavy to attach, but
I have to go, see ya!
serene scaffold
hazy saddle
ok, the data too heavy to attach, but
I have to go, see ya!
it's not that it's "too heavy to attach", it's that our moderator bot deletes messages if they have a zip attached.
hazy saddle
thank for your help
lapis sequoia
serene scaffold
so like, if you're taking the derivative of `2x^2 + 4x`, use `2x` instead of `2x...
Correct.
hazy saddle
serene scaffold
it's not that it's "too heavy to attach", it's that our moderator bot deletes me...
sh*t, you're right
serene scaffold
hazy saddle
sh*t, you're right
what are two end dates that will reproduce the problem?
hazy saddle
import pandas as pd
from datetime import date, timedelta
from utils import get_Week

file = "InfoAbaste221072022.csv"

data = pd.read_csv(file, sep=";",
   encoding="latin-1",
   parse_dates=["FechaEncuesta"])

markets = list(set(data["Fuente"]))

columns = ["Fuente", "FechaEncuesta", "Grupo", "Ali", "Cant Kg"]

data_relevant = data[columns]

data_relevant = data_relevant.sort_values("FechaEncuesta")

first_day_week1, last_day_week1, first_day_week2, last_day_week2 = get_Week(data)


first_week_filter = data_relevant["FechaEncuesta"].between(first_day_week1, last_day_week1)

first_week_data = data_relevant.loc[first_week_filter]
I'm lookin between 2022-07-07 and 2022-07-13
serene scaffold
hazy saddle
I'm lookin between 2022-07-07 and 2022-07-13
In [18]: df.loc[df['FechaEncuesta'].between('2022-07-07', '2022-07-13'), 'FechaEncuesta'].unique()
Out[18]: array(['2022-07-07T00:00:00.000000000', '2022-07-13T00:00:00.000000000'], dtype='datetime64[ns]')

In [19]: df.loc[df['FechaEncuesta'].between('2022-07-07', '2022-07-10'), 'FechaEncuesta'].unique()
Out[19]: array(['2022-07-07T00:00:00.000000000'], dtype='datetime64[ns]')

In [20]: df.loc[df['FechaEncuesta'].between('2022-07-07', '2022-07-09'), 'FechaEncuesta'].unique()
Out[20]: array(['2022-07-07T00:00:00.000000000'], dtype='datetime64[ns]')
there just aren't any days between those two days, except those two.
you can do df.groupby(df['FechaEncuesta'].dt.day).head(), and you will see that it goes from july 7, straight to july 13, with no days in between.
hazy saddle
not sure I understand...
look
print(data_relevant["FechaEncuesta"][7167]) // 2022-08-07 00:00:00
serene scaffold
hazy saddle
not sure I understand...
look
print(data_relevant["FechaEncuesta"][7167]) //...
that's in august.
hazy saddle
i'm confused, i guess the datetime is backwards, if i look the data in text editor find this:
Bogotá, D.C., Corabastos;**08/07/2022;**20:18;TL;WOL099;null;'25;CUNDINAMARCA;'25040;ANOLAIMA;null;null;VIN VND CIDRA;VERDURAS Y HORTALIZAS;Calabaza;800;KILOGRAMO;1;800;LMCORTESR;
serene scaffold
hazy saddle
i'm confused, i guess the datetime is backwards, if i look the data in text edi...
if you have 08/07/2022, there's no way to know if "8 July 2022" or "7 August 2022" is intended, unless you know what format they're using a priori.
whereas if you have the year first, like 2022/8/7, then it's known to be year/month/day
in your data, is the day or month first?
hazy saddle
serene scaffold
if you have `08/07/2022`, there's no way to know if "8 July 2022" or "7 August 2...
ok, thanks for your help! good night
 haughty pewter
df["Total Average"] = df.iloc[:, 6:19].mean(axis=1) #Calculate average of all rows from column 6 to column 19
I'm trying to calculate the average of all rows from column 6 to column 19, but how do I make it skip any columns with a value of 0?
they can be between 0-5
serene scaffold
haughty pewter
`df["Total Average"] = df.iloc[:, 6:19].mean(axis=1) #Calculate average of all r...
you can replace those zeros with NaN, and then it will take care of itself.
 pseudo wren
I’m starting school in the fall and have a lot of questions about the actual math involved. I feel like I’ve come a long way from knowing no data science, to knowing some and the field of AI and data science is enticing, but I’m wondering how much math I’ll be using in practice.
I like, even love this field and want to work hard at it. I just also know I’ve struggled with math in the past. What’s helped you guys? Were you always innately good at math, or did it take work for you to get where you needed to be?
serene scaffold
pseudo wren
I’m starting school in the fall and have a lot of questions about the actual mat...
you need to understand the math behind AI to approach some problems intelligently. you'll never actually do any calculations by hand, but you should be able to if you had to.
I think people psych themselves out about math. you can learn math. if you're in the US, chances are, the techniques your teachers used to teach you math were pretty shitty. don't talk yourself into thinking that it's more arduous than it has to be.
pseudo wren
serene scaffold
you need to understand the math behind AI to approach some problems intelligentl...
This is what I believe too. In high school I wasn’t super motivated with math, and I think it left me with a lot more questions than answers. Math as it’s taught in high school tells you to assume a lot of things, rather than gives you the explanation for why things are. I struggled with that a lot. It’s harder to remember things if you don’t know why they are that way.
 patent pine
Does anyone have an example or a real application of the gym library on factories or something similar?
 velvet birch
Okay I got a pretty basic and probably dumb question
Why do we do EDA on the data we have?
 wooden sail
it can give you some idea of which tools might be effective for whatever you want to do with the data
velvet birch
wooden sail
it can give you some idea of which tools might be effective for whatever you wan...
Okay so after I do EDA, I have some observations on which columns are useful and which might not be
So in the model training part I can use these?
wooden sail
sure, but it also helps you pick the model in the first place
velvet birch
wooden sail
sure, but it also helps you pick the model in the first place
By this do you mean that one would be able to identify whether they need classification algorithm or regression algorithm or that which exact model they should be using for this job (like RandomForest or SVC)?
wooden sail
that would be the idea, yeah
for example if you discover in a preliminary stage that your data exhibits some sort of 1 or 2D statistical invariance, then convolutional neural networks make sense. if there is a strong temporal correlation, then an LSTM makes sense. or maybe you discover that the problem doesn't require deep learning at all (deep learning doesn't always makes sense and is often not really needed)
velvet birch
So this is the reason why one should know the theory behind a machine learning algorithm?
wooden sail
yeah, at least at a reasonable level of understanding. no need to know all the math if that's not your thing, especially if you're not doing research. if to be able to use a tool well, you need to know when it makes sense to use it
there are scenarios where it makes sense to hit a screw with a hammer, but that's usually not what you wanna do
velvet birch
Ah dude I haven't been doing anything like this
I just make a few graphs to understand the distribution of the data and that's all
Then move onto making a model using a pre-decided algorithm
wooden sail
that's usually fine if you have enough data and computational power. if you lack one one or both of these, then knowing which model to use is vital
or if the data is not nice, too
velvet birch
wooden sail
that's usually fine if you have enough data and computational power. if you lack...
I need to get here
Like for the past 2-3 months I was learning the theory behind ML algos and never really figured out why it's needed
And that thing has been eating me up since then
That's the whole reason why I got into Kaggle and Discord servers
 fleet helm
where can i find tutorial about machine learing and data science and how can i practice them
 desert void
guys, i'm new to competitions in kaggle . how do i load such big datasets and its taking a lot of time
 bold timber
Whether TensorFlow will automatically encode the categorical data if we have applied the input function to the model?
serene scaffold
desert void
guys, i'm new to competitions in kaggle . how do i load such big datasets and it...
are you doing it locally?
misty flint
haha the 'today' bullet point

💀
from Jacopo's "MLOps at a Reasonable Scale" talk
 young ridge
Hello again, is there any way i can change the data types of multiple columns in one go?

 cedar sky
I wrote an article comparing Harry Potter and AI on medium(Ik it sounds weird, but check it out): https://medium.com/@hariaakash646/artificial-intelligence-is-basically-harry-potter-3251e5e3b64b
Read it when you get time and tell me how it is. And also give it some 👏 lol

Medium
Artificial intelligence is magical. Comparing it with the seemingly unrelated Wizarding World, opens up a wide range of possibilities. So…
 long perch
Hey all! I trained a regression model in Google Cloud's Vertex AI the other day. When I set it up I forgot to export the test data (set at a random 10% sample). Now I want to do some additional testing. Do anybody know if it's possible to retrieve that subset of data afterwards?
 mild dirge
Don' t know anything about that google cloud vertex, but did you use a seed for generating that sample?
@long perch
haughty pewter
is there any reason why my centroids refuse to move to red? also I'm confused on how to interpret clusters
 desert void
serene scaffold
are you doing it locally?
desert void
serene scaffold
are you doing it locally?
thanks for reply, im doing it on kaggle
desert void
serene scaffold
are you doing it locally?
i'm unable to read using pd.read_csv
 mint palm
best place to learn student teacher network's working?
i have a presentation to give.
serene scaffold
desert void
i'm unable to read using pd.read_csv
show the code and the whole error message, please.
 steady basalt
bros its 30c its too hot to work and code
serene scaffold
steady basalt
bros its 30c its too hot to work and code
use a fan and don't train any models locally.
steady basalt
serene scaffold
use a fan and don't train any models locally.
hahahaha, i only train locally on sensitive data
laptops hot
i bought a water sprayer to spray myself
arctic wedgeBOT
Hey @desert bear!
It looks like you tried to attach a Python file - please use a code-pasting service such as https://paste.pythondiscord.com
steady basalt
man im really enjoying my calculus book so far
really happy
much much nicer than lin alg ive taken previously
desert void
serene scaffold
show the code and the whole error message, please.
do we need to use any library like dask or just pandas is enough

 desert bear
hey i am trying to make a sentensen to entety nlu model and i get this error: text Traceback (most recent call last): File "C:\Users\Sebastiaan\AppData\Local\Programs\Python\Python38\lib\code.py", line 90, in runcode exec(code, self.locals) File "<input>", line 1, in <module> File "D:\PyCharm 2021.2.2\plugins\python\helpers\pydev\_pydev_bundle\pydev_umd.py", line 198, in runfile pydev_imports.execfile(filename, global_vars, local_vars) # execute the script File "D:\PyCharm 2021.2.2\plugins\python\helpers\pydev\_pydev_imps\_pydev_execfile.py", line 18, in execfile exec(compile(contents+"\n", file, 'exec'), glob, loc) File "D:/fun/jarvis/nlu/classifier_test.py", line 61, in <module> for X, Y, in train_loader: File "C:\Users\Sebastiaan\AppData\Local\Programs\Python\Python38\lib\site-packages\torch\utils\data\dataloader.py", line 681, in __next__ data = self._next_data() File "C:\Users\Sebastiaan\AppData\Local\Programs\Python\Python38\lib\site-packages\torch\utils\data\dataloader.py", line 721, in _next_data data = self._dataset_fetcher.fetch(index) # may raise StopIteration File "C:\Users\Sebastiaan\AppData\Local\Programs\Python\Python38\lib\site-packages\torch\utils\data\_utils\fetch.py", line 52, in fetch return self.collate_fn(data) File "D:/fun/jarvis/nlu/classifier_test.py", line 50, in vectorize_batch Y, X = list(zip(*batch)) ValueError: too many values to unpack (expected 2)
how can i fix that?
you can find my code hear: https://paste.pythondiscord.com/raw/ruxuxuleje
 harsh sapphire
line #?
 grizzled verge
Hey guys for Gensims most_similar function how do I get a list of just the most similar word without the float value next to them
I was looking through documentations trying to do it and it wasn’t working
desert bear
i found the couse it have to do with the text collate_fn=vectorize_batch
in line 58 and 59
these are not nessesery so i removed them and then i had this error
Traceback (most recent call last):
  File "C:\Users\Sebastiaan\AppData\Local\Programs\Python\Python38\lib\code.py", line 90, in runcode
    exec(code, self.locals)
  File "<input>", line 1, in <module>
  File "D:\PyCharm 2021.2.2\plugins\python\helpers\pydev\_pydev_bundle\pydev_umd.py", line 198, in runfile
    pydev_imports.execfile(filename, global_vars, local_vars)  # execute the script
  File "D:\PyCharm 2021.2.2\plugins\python\helpers\pydev\_pydev_imps\_pydev_execfile.py", line 18, in execfile
    exec(compile(contents+"\n", file, 'exec'), glob, loc)
  File "D:/fun/jarvis/nlu/classifier_test.py", line 61, in <module>
    for X, Y, in train_loader:
ValueError: too many values to unpack (expected 2)```@wooden sail currently just on linear function problems and am trying to write the equation for a like through point a,c with slope m but I am confused because that equations intercept depends on m so not sure how to write that
wooden sail
hmm?
 odd meteor
grizzled verge
Hey guys for Gensims most_similar function how do I get a list of just the most ...
odd meteor
grizzled verge
Hey guys for Gensims most_similar function how do I get a list of just the most ...
Can you show an example of the output?
steady basalt
Like
wooden sail
steady basalt
<@467435887236612106> currently just on linear function problems and am trying t...
can you give all the info? show the original problem, preferably
wooden sail
yes but you worded it poorly
steady basalt
I have no choice but to just use a symbol for the intercept ??
 wooden sail
the whole thing is in symbols
steady basalt
Oh, it’s a,c extrapolated via m to give the intercept as an extension of ac
?
Doesn’t it depend if m is positive?
wooden sail
a line is of the form y = mx + b. we know when x = a, y = c. so subbing that in we get c = ma + b, or b = c - ma
then the eq is y = mx + c - ma
 fickle shale
i need a face shape dataset for men
fickle shale
fickle shale
i need a face shape dataset for men
can i get dataset?
steady basalt
wooden sail
then the eq is y = mx + c - ma
So point c minus m times value x at a u mean? Or what
wooden sail
c is not a point
steady basalt
It is in that question
steady basalt
Sorry yes I meant c as in c from the point not as in intercept as it’s sometimes written
C - ma is the intercept?
wooden sail
mhm
wooden sail
steady basalt
Sorry yes I meant c as in c from the point not as in intercept as it’s sometimes...
here's an arbitrary example i made up right now, in case you weren't convinced
In [1]: import matplotlib.pyplot as plt

In [2]: import numpy as np

In [3]: x = np.linspace(0,10,100)

In [4]: m = -3.345643

In [5]: a = 6.23234

In [6]: c = -9.039485

In [7]: b = c - m*a

In [8]: y = m*x + b

In [9]: plt.plot(x,y)
Out[9]: [<matplotlib.lines.Line2D at 0x7faaa86e3d90>]

In [10]: plt.scatter(a,c)
Out[10]: <matplotlib.collections.PathCollection at 0x7faaa86fcbb0>

In [11]: plt.scatter(0,b)
Out[11]: <matplotlib.collections.PathCollection at 0x7faac5085370>

In [12]: plt.legend(('line','(a,c)','(0,b)'))
Out[12]: <matplotlib.legend.Legend at 0x7faaa86e3f70>

In [13]: plt.show()
 steady basalt
wooden sail
here's an arbitrary example i made up right now, in case you weren't convinced
steady basalt
wooden sail
here's an arbitrary example i made up right now, in case you weren't convinced
I just did a example but it required c + ma not -
Equation for the line perpendicular to y=5x-3, through point 2,1
Must be -1/5x + 7/5
wooden sail
dude ofc, because they're not asking you the same thing lol
please read the questions carefully
steady basalt
If it’s perpendicular u add not minus?
wooden sail
i think i need to answer you the same way rex did, unfortunately
steady basalt
What’s that
wooden sail
that sadly you don't listen, so i can't help you. good luck with your problems
steady basalt
I did listen and I did it how you said, but for this question the answer required adding
So instead of minus 2/5 you’d add
To get 7/5 not 3/5
wooden sail
not listening to people here is fine, but if you also don't read your book carefully, you're not getting very far
steady basalt
I did read it
It never said that you change method for perpendicular lines, in fact it didn’t rly go over this topic at all
Yeah I just checked it literally didn’t explain any of this
Perpendicular for points a b is y=(-1/m)(x-a)+ b and parallel is m(x-a)+b
lapis sequoia
Any tips on where to find Machine Learning communities? Just want it to be active.
non-discord, non-reddit would be best
wooden sail
at uni?
lapis sequoia
My uni is online I'm not sure if that's an option for me
 warm dragon
Hey guys can someone help me out. I’m trying to PyTorch to train a model using my gpu but it has an insane memory leak where no matter how much gpu memory I give it it quickly overflows
wooden sail
lapis sequoia
My uni is online I'm not sure if that's an option for me
do they offer some sort of platform to discuss stuff though
warm dragon
Rn i gave it 40 gb of gpu memory (with an a100$ and after 15 or so batches it is full and crashes
This is during inference as well
lapis sequoia
wooden sail
do they offer some sort of platform to discuss stuff though
Not really, and probably no clubs for online students
I was thinking like forums for undergrads/professionals or something similar
wooden sail
i see. if you're a student though, you could try something like applying for coursera's financial aid to participate in their ML courses for free. then you could interact with other people taking the courses there via the coursera forums. other than that, i can't think of any suggestions. forums for undergrads are stuff like stack overflow and some discussions on researchgate. i wouldn't know what else to suggest, maybe someone else has more/better ideas
 dusty valve
i tried to use tf.estimator.DNNClassifier to determine whether or not a string has swear words. although for every single string i enter it gives me [0.46180007 0.5381999] the first index is the probability of it being 0 (no swears) while the second is the probability of it having a swear (1). here is my code and csv files
the training data is pretty small
nvm i got it working!
working semi decently too
now i just need butt tons of data and im good to go
 desert oar
i'd be curious of the DNN outperforms a pile of hand-crafted regex. i assume the DNN is more likely to be able to learn obscure formulations like d̷̘͚i̸̹̤c̴̡̞k̵̮̳ ̸͖̂b̸͓͉u̴̡̖ţ̵̩̪t̵͓͕ and 【fuck】
desert oar
fortunately you can manually construct a huge dataset of this
dusty valve
if anyone has a large dataset of strings that contain swear words, dm me
desert oar
i was just going to suggest generating your own
dusty valve
yeah just saw that
desert oar
write an algorithm that can produce basic human sentences, then write another one to obfuscate the swear words and/or sections of the whole text
use unicode lookalikes, etc.
dusty valve
that should be easy
desert oar
yeah, this is a great use case for data augmentation
dusty valve
thnx
desert oar
what kind of dnn are you using? convolutions? rnn/lstm? transformers? something else diy?
lapis sequoia

am I getting this error because each array for both x and y have to all be the same size?
warm dragon

if my training loss is going down but AUC staying roughly the same
does this mean i should increase learning rate
or just wait it out
misty flint
wooden sail
that sadly you don't listen, so i can't help you. good luck with your problems

anyway, hope grad school is going well Edd
just finished myself

mint palm
How does correlation in sequenced portion of video plays a role in training???
In anomaly detection
steady basalt
misty flint
just finished myself
I’m finishined in less than a month
 stone scroll
A coworker of mine is using matplotlib to draw a wafer plot with a quiver plot on top of it like the one displayed in this image. He told me that it is very slow since he has to draw many shapes to make the wafer plot. He is looking for something faster and even interactive. I mentioned maybe Bokeh or plotly could do it. I don't really know if this is possible in either library or if it would be faster. Does anyone have any suggestions or experience doing something similar?

 grand vapor
how can I define error, like for an error bar, if I don't really know what the error is? for instance, in google sheets, you can tick a box called "error bars" and it'll just generate them for you automatically
desert oar
stone scroll
A coworker of mine is using matplotlib to draw a wafer plot with a quiver plot o...
matplotlib should be able to handle this, it's possible that his code isn't very efficient. but he might also want to consider #pyqtgraph or even gnuplot
desert oar
grand vapor
how can I define error, like for an error bar, if I don't really know what the e...
usually it's something like 1 or 2 standard deviations. the google sheets documentation https://support.google.com/docs/answer/9085344?hl=en&co=GENIE.Platform%3DDesktop says that you can choose between a constant value, a percentage of some kind, or the standard deviation.
Want to get more out of Google Docs for work or school?
velvet birch
Am currently working on a clustering project using KMeans Clustering on the Mall Customer Segmentation dataset and am wondering on what type of EDA should I do to have the ideal clusters
(https://www.kaggle.com/datasets/vjchoudhary7/customer-segmentation-tutorial-in-python)
Currently am thinking of making 2D scatterplots between columns and to look for clusters in the plot, then do the same with a 3D scatterplot. But this doesn't seem like an ideal strategy because in some cases I might be doing 4D clustering and in those cases I won't be able to visualize the clusters in this way.

Market Basket Analysis
Would doing stuff like making histograms for different columns even help here?
desert oar
velvet birch
Am currently working on a clustering project using KMeans Clustering on the Mall...
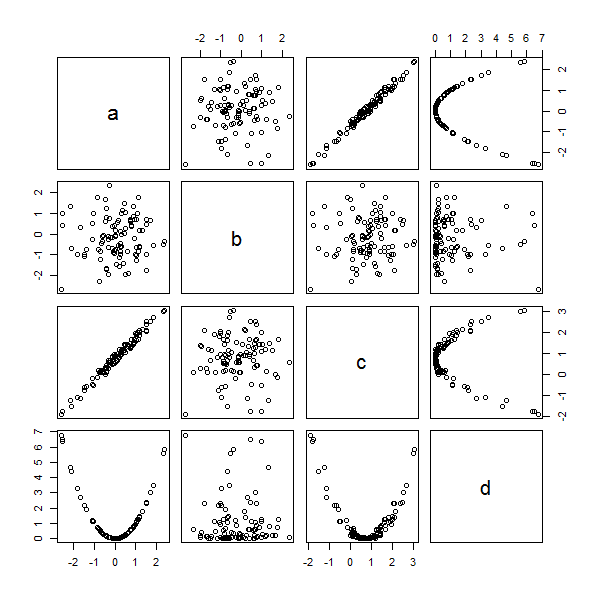
with just 4 dimensions you could use a grid of pairs of variables
a "scatter matrix" i think it's called sometimes
desert oar
it would work but it starts getting hard to read at bigger sizes
example: https://i.stack.imgur.com/oREtY.png
 velvet birch
So on each axis there are multiple columns? Is that how we are able to visualize these?
desert oar
you might also want to use some dimension reduction algorithm to be able to plot your data in 2d or 3d. of course there are also quantitative ways to evaluate clustering quality
velvet birch
You mean elbow method and silhoutte score?
desert oar
those are some valid options yes
 inner belfry
Help me
 desert oar
note that silhouette score (and k-means in general) do not perform well on clusters that are not approximately "spherical"
desert oar
inner belfry
Help me
gitattributes is not a python file
velvet birch
desert oar
note that silhouette score (and k-means in general) do not perform well on clust...
Yh heirarchical clustering is helpful here
desert oar
my go-to for clustering is hdbscan
velvet birch
What type of EDA you do for those?
inner belfry
desert oar
gitattributes is not a python file
clear it gitattributes ?
desert oar
velvet birch
What type of EDA you do for those?
i look at the univariate distributions (density plot, percentiles, mean, etc), then i move up to pairwise bivariate distributions (e.g. scatterplot matrix like i posted above), then i go for dimension reduction to see more of the global structure. sometimes i've even done 3d plots and manually "flew" through the 3d point cloud
desert oar
inner belfry
clear it gitattributes ?
don't run it as python code. leave it alone
inner belfry
desert oar
don't run it as python code. leave it alone
How do I run the project?
desert oar
inner belfry
How do I run the project?
explain what you are trying to do in greater detail
velvet birch
desert oar
i look at the univariate distributions (density plot, percentiles, mean, etc), t...
Sorry for just bombarding you with questions
But how does that help in determining which columns to fit in the clustering algorithm?
desert oar
velvet birch
But how does that help in determining which columns to fit in the clustering alg...
it doesn't, but it does help me at least understand the shape of the data and decide what kind of clustering might even make sense + how to evaluate it
feature selection is a whole different issue. i rely as much as possible on domain knowledge for that. but i also try to discard features that seem uninformative, e.g. it is mostly all the same value or has a lot of missing values that can't be easily imputed
velvet birch
I guess cause I've already decided that I'll be using KMeans for the job, this part is not of much use for me
velvet birch
desert oar
feature selection is a whole different issue. i rely as much as possible on doma...
This tho can't be observed with EDA alone right?
desert oar
velvet birch
I guess cause I've already decided that I'll be using KMeans for the job, this p...
not doing basic eda is like driving with your eyes closed. just do it on every dataset no matter what.
desert oar
velvet birch
This tho can't be observed with EDA alone right?
you can get some idea about it, yes
velvet birch
desert oar
not doing basic eda is like driving with your eyes closed. just do it on every d...
Yh that's something I've heard a lot
But my main problem rn is that
Even if I do EDA on the data I have
I can't find much use of it
The question "what's the purpose of doing this" always comes in my mind
I've heard a lot that it helps you in understanding the data, which then helps you in choosing the algorithm you want to go with
But I've never been able to implement this in actual projects and that's just eating me up
Do you have any notebooks in mind I can go through?
desert oar
velvet birch
The question "what's the purpose of doing this" always comes in my mind
the main purpose is that you want to understand the distribution of the data
where is there a high density of data points? are there extreme values to consider? what variables are highly related?
velvet birch
I guess for now I should just go through a few datasets on Kaggle and check the code of other people on how they do stuff
stone scroll
desert oar
matplotlib *should* be able to handle this, it's possible that his code isn't ve...
Thanks for the suggestions. I did suggest that maybe the code could be optimized. It turns out that he didn't care so much since he still wants to add interactivity.
wooden sail
velvet birch
I guess for now I should just go through a few datasets on Kaggle and check the ...
very simple things to consider, for example, are that if your data is not jointly gaussian with diagonal covariance, using vanilla least squares as your cost function is not optimal
stone scroll
grand vapor
how can I define error, like for an error bar, if I don't really know what the e...
That is a super loaded question for this application. Each vector would represent a single measurement, which is deviation away from the ideal. So in a sense we are measuring the error. We can define an x and y direction std for a single water plot.
lapis sequoia
 steady basalt
Damn such a cheater
 severe karma
hi anyone here are familiar with pandas
currently I have a dataframe that each row contains a substring, I want to locate which sentence the substring at by doing a substring matching, using panda apply function, however, it runs horribly slow, any efficient way to do so ?
I have use selenium with panda apply, because selenium can scrape text around my row element surrounded and minimize collision error (since substring matching might not be reliable, 17 matches with 17000 or 17)
but selenium find element seems to not working concurrently and incredibly slow as well
I am looking for a efficient and reliable method, thanks
the definition of sentence here would be .split('.'), assuming full stop as the sentence where my row element located at
have tried .str.contains, normal matching or regex, but none of them really improve the performance
velvet birch
You should firstly store all the data you need in one place and only then try using pandas on it
That'll be a lot more convenient too
 storm kelp
anyone here transitioned to learning python from R?
 turbid spear
Is Dataquest.io free for only the first 3 lessons of each path
 tacit basin
I think yes
https://www.freecodecamp.org/learn is free forever :)

Learn to Code — For Free
 elfin jungle
I've got a project where I want to see the sales of a company based off store locations, store sales, individual product sales, and the date. I was thinking of applying a linear model but I dont think its the best choice given there's a time factor. Thoughts?
serene scaffold
elfin jungle
I've got a project where I want to see the sales of a company based off store lo...
have you heard of time series forecasting? also, how are you going to represent nominal features like "location"?
elfin jungle
yea i realized it'd be time series, not something i covered in my course, so exploring more about it. I'd have location be region/city based: ie. london, manchester, etc
serene scaffold
elfin jungle
yea i realized it'd be time series, not something i covered in my course, so exp...
how many distinct locations are there?
elfin jungle
that's a really good question
depends on the level of granularity i'd want
cities will be probably close to 30
regions would be 15
or increased granularity down to neighbourhoods or streets
serene scaffold
elfin jungle
cities will be probably close to 30
how many instances would there be per city? also, is there really any point for the "region" feature, if every city belongs to one region?
serene scaffold
elfin jungle
or increased granularity down to neighbourhoods or streets
that would probably result in too many distinct values for that feature, and make it useless.
elfin jungle
serene scaffold
that would probably result in too many distinct values for that feature, and mak...
exactly my thought
there'd be a few hundred per city
serene scaffold
I would just have city as a one-hot feature (or something like that), and see how it goes.
elfin jungle
so if im comparing manchester, london, and brighton, i'd want the model to understand sales might differ based on location, whether region or city
elfin jungle
serene scaffold
I would just have city as a one-hot feature (or something like that), and see ho...
ow right, have to make each region an individual column
serene scaffold
elfin jungle
so if im comparing manchester, london, and brighton, i'd want the model to under...
if you know what regions each city belongs to, you don't necessarily need the model to know.
elfin jungle
true, but greater london would include parts outside of london that wouldn't exhibit many sales
so i feel the model would fall off aswell if i choose regions rather than cities
serene scaffold
elfin jungle
true, but greater london would include parts outside of london that wouldn't exh...
you would probably need to break greater london into more than one "city", if the geographical scope of your data is the UK.
elfin jungle
Yea that makes sense, maybe just expanding the regions with special cases will reduce the number of hotencoders i'd have
you mind if i dm you at another time I run into any more doubts?
serene scaffold
elfin jungle
you mind if i dm you at another time I run into any more doubts?
you should just ask here. I check this channel often enough, and it's good to be able to get input from other people
elfin jungle
Alright will do! 🙂
atomic fox
Hi All, I have this matrix where I need to figure out a list of species each zoo is missing in the matrix (Original content is 152colXx562rows)
Would I be able to do this in pandas easily? or would I be better off just programming it in Python?
For this Matrix, I would need to show that:
LA Zoo - Monkey, Reptile
NY Zoo - Bird, Bear, Reptile
FL Zoo - Bird, Monkey
 steady basalt
I’m starting to think SQL and probability intuition is by far the most important abilities for passing technical tests when interviewing
Which is pretty dumb imo
serene scaffold
atomic fox
Hi All, I have this matrix where I need to figure out a list of species each zoo...
even if you read each table into memory with pandas, you can figure out what is missing with sets.
!e
animals = {'bird', 'dog', 'elephant', 'donkey'}
la_zoo = {'dog', 'donkey'}
missing_animals = animals - la_zoo
print(missing_animals)
@serene scaffold :white_check_mark: Your 3.11 eval job has completed with return code 0.
{'bird', 'elephant'}
 serene scaffold
atomic fox
It's really that simple? lmao
serene scaffold
atomic fox
It's really that simple? lmao
a lot of people don't know about sets. those poor, poor people.
atomic fox
oh wait, what if I needed to group the animals by species? for example, the LA zoo has a Grizzly Bear, so I can just take any bear species out of its missing animals list
serene scaffold
atomic fox
oh wait, what if I needed to group the animals by species? for example, the LA z...
In [1]: animals = ['parrot bird', 'panda bear', 'polar bear', 'grizzly bear']

In [4]: pd.MultiIndex.from_tuples(map(str.split, animals))
Out[4]:
MultiIndex([( 'parrot', 'bird'),
            (  'panda', 'bear'),
            (  'polar', 'bear'),
            ('grizzly', 'bear')])
you could start with something like this, I guess.
if you have an extra level of column indexing to give you superclasses of animals, you can then figure out which zoos have at least one of each superclass.
atomic fox
Hmm I will give it a go and report back
 exotic thicket

How come x2>-2x? In this picture it's a perceptron learning algorithm
Hello guys plz someone help me with this problem I don't know how come is that =>x2>-2x
 wild dome
this is a column of a dataframe
0       128
1       111 <- new min
2       116
3       121
4       110 <- new min
       ...
7       131
8       100 <- new min
9       122
        ...
50      105
51       93 <- new min
52      129
        ...
4995    137
4996    139
4997    118
4998    105
4999    100
how can I set the values to be the same until there's a new minimum? like this
0       128
1       111 <- new min
2       111
3       111
4       110 <- new min
       ...
7       110
8       100 <- new min
9       100
        ...
50      100
51       93 <- new min
52       93
        ...
4995     93
4996     93
4997     93
4998     93
4999     93
@wooden sail I have a application test whicih is asking something that appears to be maths, want to look at it?
wooden sail
i can glance at it while i eat, but wdym by "application test"
steady basalt
its for a job, the first screening exam
im on the final question, fared quite well for all of the others but got stuck on a calculus
data science quiz
its basically asking you, in python, to find the gradient at a point along a 3dimentional graph function
so its multivariate
im happy to share all questions after i submit
wild dome
matplotlib, is there a function to annotate every data point?
wooden sail
all i'll say is you're overthinking it
sorry, that was at supermoon, not you. pyplot has an annotate function you can use
steady basalt
wooden sail
all i'll say is you're overthinking it
I sent it to you. wasnt rly shure what to do.
i can send u others too as ive submittedf i tnow
if ur interested, there was a few MCQs
i answered all except for the mountai none
there was a few stats, one linalg and a few prob ones
let me show u the lin alg one
wooden sail
it never said to compute the gradient directly in python. the easiest solution was to differentiate by hand and code the resulting function in. numpy.gradient uses finite differences and is therefore not exact. not only that, it won't work if you just give in scalars x and y
dusty valve
for a pandas dataframe like column_1, column_2 hello, 0 there, 1 how would i iterate over every row in column_1 and replace it with a 1D array of integers?
wooden sail
you could've used sympy too, if you really don't wanna do the math yourself. but it had to be done symbolically, either on paper or with a lib
steady basalt
wat do u thnk about that matrix one
young ridge
hi guys is there a more efficient way of doing this code?
 steady basalt
well, im sure youd get that one
young ridge
the o notation and the run time for this cell is quite bad
wooden sail
dusty valve
for a pandas dataframe like ```
column_1, column_2
hello, 0
there, 1``` how woul...
that would create a ragged array, it's not good to have columns containing arrays
dusty valve
wooden sail
that would create a ragged array, it's not good to have columns containing array...
well, what im trying to do it take that data frame, and do py dataframe = read_csv(...) train_y = dataframe.pop('column_2') dataframe.head() because i need to encode the strings in the first column
wooden sail
dusty valve
well, what im trying to do it take that data frame, and do ```py
dataframe = rea...
what you'd do is add more columns, not put an array inside a column
steady basalt
@wooden sail also, there was one which i had never seen before. it was how many edges does a fully connected graph have
its something liek 2/1-n something or other
odd meteor
dusty valve
for a pandas dataframe like ```
column_1, column_2
hello, 0
there, 1``` how woul...
You can use the itterrows() method
https://stackoverflow.com/questions/16476924/how-to-iterate-over-rows-in-a-dataframe-in-pandas

Stack Overflow
I have a pandas dataframe, df:
c1 c2
0 10 100
1 11 110
2 12 120
How do I iterate over the rows of this dataframe? For every row, I want to be able to access its elements (values in cell...
wooden sail
steady basalt
<@467435887236612106> also, there was one which i had never seen before. it was ...
lemme think. the first node has n-1 edges. the second node has n-2, since one of its edges is already set in. it looks like (n-1)! to me, but lemme look it up
dusty valve
if there's another option to encode the strings in col_1 i'll take it
steady basalt
wooden sail
lemme think. the first node has n-1 edges. the second node has n-2, since one of...
I think ur right, but id never encountered such a topic before
I mean, ive never even looked into graph theory so it was a hard one
i just googled it 😉
wooden sail
ah oops i multiplied them but they were supposed to be added added, that was my bad. but the logic was sound. so n-1 + n-2 + ... + 0. then yeah, n(n-1)/2
steady basalt
oh, they also askeda monty hall problem
they also asked what unit is variance in
which i think its just unit squared
wooden sail
dusty valve
if there's another option to encode the strings in col_1 i'll take it
one hot is usually done by adding columns (or rows, depending on how the data is oriented)
steady basalt
oh, they also asked if you had two dice and a coin, whats the odds of landing a combined 7 and heads
1/6 i think
they asked what does the valuye of the sigmoid function tend to as x moves towards -inf, which i answered as 0
they asdke dme to write a python function to referse a functions arguments into a new function, as well as a sql query
overall, not too bad
wooden sail
steady basalt
1/6 i think
1/12, shouldn't it be? 6 ways to roll a 7 out of 36 ways to roll 2 dice, but also 1/2 to roll a head
steady basalt
wooden sail
1/12, shouldn't it be? 6 ways to roll a 7 out of 36 ways to roll 2 dice, but als...
to roll a 7 out of 2 die, its 3 possible options but with two arrangements so thats 6./12 ?
wait a second
thers only 3 ways u can roll 7
wooden sail
6, since order matters
odd meteor
young ridge
hi guys is there a more efficient way of doing this code?
You could bin it with pandas cut() method. This should improve the runtime as well.
https://pandas.pydata.org/docs/reference/api/pandas.cut.html
young ridge
odd meteor
You could bin it with pandas `cut()` method. This should improve the runtime as ...
ohhhh aight thanks ill take a look
steady basalt
but im pretty sure i got the sigmoid question right it was the easiest one
pytohn and sql was tricky but its doable
and they also asked if a dude had a stack of cards and said he guessed all ur cards correctly after guessing all cards, he abuses which metric which i answered recall
i mena thats a recall of 1
odd meteor
steady basalt
and they also asked if a dude had a stack of cards and said he guessed all ur ca...
I believe the metric that was abused was precision (if I don't have an equal number of shapes in the card pack I hold)
steady basalt
odd meteor
I believe the metric that was abused was precision (if I don't have an equal num...
it would be recall
if he gussed all cards, his precision wud be rly low. but recall 1.0 as didnt miss any of the picked cards
odd meteor
steady basalt
if he gussed all cards, his precision wud be rly low. but recall 1.0 as didnt mi...
If he guessed all cards correctly?
Well, I guess it depends on what they actually mean by "abuses" which metric
steady basalt
odd meteor
If he guessed all cards correctly?
if he claimed he guessed all of the picked ones correctly, the picked ones isnt the entire set
that claim that u got 1,0 is just abusing recall
his precision will be low like 0.1
odd meteor
odd meteor
I believe the metric that was abused was precision (if I don't have an equal num...
I mean to say Accuracy here not Precision.
 tulip flint
Any one got a suggestion for the best approach to creating a model to detect video game characters(data would be images of character from various angles, outfits etc) . I was going to do face detection, but that isnt gonna work for the character not facing the camera.
 earnest widget
Hi, I would like to know how transfer learning can be done with a custom object detection task, not image classification. Is it possible to use yolo pretrained weights onto our own model? Main reason why I'm asking is because I am trying to get a higher mAP value which is the metric used for object detection instead of normal accuracy.
 whole zephyr
yo, dumb question I didn't quite find an answer to (more like I wanna confirm a thing):
if I have a low amount of data, an epoch on GPU won't differ too much from an epoch on a CPU, right?
especially if the model is not too complex, i.e. something like 6 Dense layers, output layer has 3 classes and after each Dense layer, I have 0.5 dropout rate with an input layer of at most 208 neurons (depending on the features extracted from the data) and each Dense layer starts has half the number of neurons of the previous layer, starting from 512 on the first active layer
wooden sail
the easiest answer is to try it and see. parallelization is not only done over data samples in a batch, but also over all matrix operations even if there's a single data vector
 summer pebble
how do you identify what glove embedding pretrained text file to use? i am currently trying to train my model that is using gru.
whole zephyr
wooden sail
the easiest answer is to try it and see. parallelization is not only done over d...
yeah, well logic and the intuition from what I learned in parallel computing classes and other info about well data size in parallel computing tell me it is the case
in my case, the computing times were quite similar, but I don't have more data to "fill" the dataset so that I can check my hypothesis that more data would result in epoch duration growing alot faster on CPU than GPU
so it's more like a "does my intuition make sense?" type of question
wooden sail
whole zephyr
yeah, well logic and the intuition from what I learned in parallel computing cla...
that sounds about right. the general philosophy is that, although there's a ton of cores, they're each weaker than what your cpu has. for very small matrices, you would indeed expect the cpu to be faster, especially considering the cost of moving stuff from memory to gpu memory. then as the matrices get larger, you start reaping the benefits of massive parallelization
my previous comment was more along the lines of "it's difficult to know where the break-even point is"
whole zephyr
thanks
 unique flame
earnest widget
Hi, I would like to know how transfer learning can be done with a custom object ...
unique flame
earnest widget
Hi, I would like to know how transfer learning can be done with a custom object ...
There is the NVIDIA TLT package, but I've never used it. I increased my training set and got an increase of 2% on the mAP  . What is your mAP and IoU if I may know?
earnest widget
unique flame
There is the NVIDIA TLT package, but I've never used it. I increased my training...
Well my mAP value just hits 80-81 and then just stops increasing, my training set is around 6000+ images as well. I don't have the IOU calculated though. Just using the built in TF mAP function with keras. Not using a pretrained model either.
unique flame
oh you use a public data-set
So you don't train using Darknet?
hmm 6000+ images should have given a good mAP tho
I've seen one with 1000 hit 90%
and mine is way less
earnest widget
unique flame
So you don't train using Darknet?
I have not used that, just wanted to know how I could get higher results without using a pretrained model directly because 6000+ images is a decent bit of data.
earnest widget
unique flame
oh you use a public data-set
Yeah just a medical dataset with a total of 8000+ images which I then split.
unique flame
the only thing I've seen is NVIDIA TLT, but never used it. So go knock yourself out
out of curiousity which version of yolo are you using?
earnest widget
Hmm yeah I'll check it out. But do you think that the custom model can be an issue for why it does not increase beyond 80?
earnest widget
unique flame
out of curiousity which version of yolo are you using?
I have yolov4 but not used yet cause I can't seem to get it to work on my custom model.
unique flame
How many classes do you have? my first guess would be that the data has some problems.
unique flame
earnest widget
I have yolov4 but not used yet cause I can't seem to get it to work on my custom...
Well I mean on which version of Yolo did you train your custom model?
earnest widget
unique flame
How many classes do you have? my first guess would be that the data has some pro...
I only have one class given for the images, like the images are all confirmed for having that specific object present in it. I don't have any classification, just detecting the object. F.e. the images are confirmed cases of stenosis so I'm just detecting it with the help of the labels.
earnest widget
unique flame
Well I mean on which version of Yolo did you train your custom model?
I used yolov3.
serene scaffold
young ridge
hi guys is there a more efficient way of doing this code?
it looks like you're overwriting the age (a number) with a string that represents a range of ages. don't overwrite data with a less specific version of that data, or with data of a different type.
df['Age'] = df['Age Group']
df['Age Group'] = ''
df.loc[df['Age'].le(14), 'Age Group'] = 'Child'
df.loc[df['Age'].between(15, 24), 'Age Group'] = 'Youth'
something like this.
 meager crater
serene scaffold
it looks like you're overwriting the age (a number) with a string that represent...
meager crater
serene scaffold
it looks like you're overwriting the age (a number) with a string that represent...
ow god, completely forgot about le and between existence; do they work for datetime modules?
serene scaffold
meager crater
ow god, completely forgot about le and between existence; do they work for datet...
Yep!
 scenic cairn
Yeah, your intuition is correct. There's likely no qualitative distinction between the classes as clustered. Also, before downsampling, you could just make the markersize much smaller to see if anything closer to a pattern appears. ALSO, your data shows no one working after the age of 80, but then a few random 84 year olds? Something to check out as well.
serene scaffold
meager crater
nice, i've been using `.dt.___ < date`
you can still do that, if you want to do things only in terms of the day (and not hours, seconds, etc)
 placid oak
Hi where would you guys suggest moving to after learning python basics and doing small projects. I've got a 12 months free of data camp but it doesn't look comprehensive. I've also heard of Kaggle micro courses but I'm not sure how effective they are
serene scaffold
placid oak
Hi where would you guys suggest moving to after learning python basics and doing...
what is your goal
placid oak
serene scaffold
what is your goal
Quant
But starting in data science is the best path I can take leading to that
placid oak
placid oak
Hi where would you guys suggest moving to after learning python basics and doing...
Also have access to all Coursera courses
serene scaffold
placid oak
Quant
idk what quant is.
placid oak
serene scaffold
idk what quant is.
Quantitative analyst it's basically if data science and data analysts had a love child placed it in the finance industry
They are usually employed by large trading and hft firms and require extensive technical knowledge, you deploy that knowledge for trading operations
serene scaffold
placid oak
Quantitative analyst it's basically if data science and data analysts had a love...
seems that most people who are employed as "data scientists" these days are data analysts anyway. idk what employers for quantitative analysts look for in applicants, though.
placid oak
serene scaffold
seems that most people who are employed as "data scientists" these days are data...
Tbh it doesn't matter at this stage. Rn I need to work on learning the skills of a data scientist
serene scaffold
placid oak
Tbh it doesn't matter at this stage. Rn I need to work on learning the skills of...
what is "this stage"? what do you do currently?
placid oak
serene scaffold
what is "this stage"? what do you do currently?
I only know basic python and am currently studying the required math for data science at school.
serene scaffold
placid oak
I only know basic python and am currently studying the required math for data sc...
by "school", are you referring to mandatory public education (called high school in the US)? university/college?
placid oak
I study Maths, Further Maths and Computer Science in the UK
Sort of a college
But the maths ain't a problem
serene scaffold
can you take courses that are specific to your goals?
hazy saddle
Hi everyone, I'm getting this error:
first_week_data['Ciudad'] = first_week_data['Fuente'].apply(lambda element: element.split(',')[0])
/home/carlos/Documentos/Programacion/Python/angela_dane/semanal/data.py:60: SettingWithCopyWarning:
A value is trying to be set on a copy of a slice from a DataFrame.
Try using .loc[row_indexer,col_indexer] = value instead
I've read the sugested documentation but didn't see the conection with my problem.
serene scaffold
hazy saddle
Hi everyone, I'm getting this error:
first_week_data['Ciudad'] = first_week_dat...
can you do print(first_week_Data['Fuente'])?
also please always show the whole error message, starting from Traceback. (and please do that now as well, because I think there might be more to this.)
hazy saddle
/home/carlos/Documentos/Programacion/Python/angela_dane/semanal/data.py:58: SettingWithCopyWarning:
A value is trying to be set on a copy of a slice from a DataFrame.
Try using .loc[row_indexer,col_indexer] = value instead
See the caveats in the documentation: https://pandas.pydata.org/pandas-docs/stable/user_guide/indexing.html#returning-a-view-versus-a-copy
first_week_data['Ciudad'] = first_week_data['Fuente'].apply(lambda element: element.split(',')[0])
/home/carlos/Documentos/Programacion/Python/angela_dane/semanal/data.py:60: SettingWithCopyWarning:
A value is trying to be set on a copy of a slice from a DataFrame.
Try using .loc[row_indexer,col_indexer] = value instead
See the caveats in the documentation: https://pandas.pydata.org/pandas-docs/stable/user_guide/indexing.html#returning-a-view-versus-a-copy
last_week_data['Ciudad'] = last_week_data['Fuente'].apply(lambda element: element.split(',')[0])
it's not an error it's a warning
serene scaffold
serene scaffold
can you do `print(first_week_Data['Fuente'])`?
this
hazy saddle
print(first_week_Data['Fuente']) ------>
0 Armenia, Mercar
4785 Medellín, Central Mayorista de Antioquia
4784 Medellín, Central Mayorista de Antioquia
4783 Medellín, Central Mayorista de Antioquia
4782 Medellín, Central Mayorista de Antioquia
...
33485 Bucaramanga, Centroabastos
33458 Bogotá, D.C., Plaza Samper Mendoza
33484 Bucaramanga, Centroabastos
33492 Bucaramanga, Centroabastos
33504 Bucaramanga, Centroabastos
Name: Fuente, Length: 37854, dtype: object
serene scaffold
hazy saddle
print(first_week_Data['Fuente']) ------>
0 Arme...
do .str.extract(r'^([^,]+)') instead
hazy saddle
like this?
first_week_data['Ciudad'] = first_week_data['Fuente'].apply(lambda element: element.extract(r'^([^,]+)')[0])
serene scaffold
hazy saddle
like this?
first_week_data['Ciudad'] = first_week_data['Fuente'].apply(lambda e...
no apply
hazy saddle
same warning
serene scaffold
hazy saddle
same warning
show the new code exactly
hazy saddle
first_week_data['Ciudad'] = first_week_data['Fuente'].str.extract(r'^([^,]+)')
/home/carlos/Documentos/Programacion/Python/angela_dane/semanal/data.py:58: SettingWithCopyWarning:
A value is trying to be set on a copy of a slice from a DataFrame.
Try using .loc[row_indexer,col_indexer] = value instead
See the caveats in the documentation: https://pandas.pydata.org/pandas-docs/stable/user_guide/indexing.html#returning-a-view-versus-a-copy
first_week_data['Ciudad'] = first_week_data['Fuente'].str.extract(r'^([^,]+)')
/home/carlos/Documentos/Programacion/Python/angela_dane/semanal/data.py:60: SettingWithCopyWarning:
A value is trying to be set on a copy of a slice from a DataFrame.
Try using .loc[row_indexer,col_indexer] = value instead
 sacred narwhal
hi there, im currently trying to do a classification problem where i have an image with spots. im trying to classify each pixel in the image as either spot or not spot. what is the best algorithm to do this?
misty flint
placid oak
Quant
you need to have a decent finance background as well. see if you can include that as your domain focus
are you going to further education after graduating college? quant positions can be extremely competitive otherwise
haughty pewter
how does one resample their data, especially if it's not timeseries but regular numeric data? been trying to look it up, but I can't really find any solid solutions
placid oak
misty flint
you need to have a decent finance background as well. see if you can include tha...
Yeah, Ik a bit about finance but that is the least important topic for getting into a Quant position. Maths and computing are far more essential.
placid oak
misty flint
are you going to further education after graduating college? quant positions can...
Yeah I’m tryna get into a top uni here however if not I'm also applying to degree apprenticeships at fintech companies which allow you to gain a degree in a relevant field while working under the company
The degree apprenticeship looks appealing cuz all uni finances are covered with no student debt and you can choose which career pathway you would like at the company such as Software Engineering or Data Science
misty flint
placid oak
Yeah, Ik a bit about finance but that is the least important topic for getting i...
yes as long as you dont forget.
misty flint
placid oak
The degree apprenticeship looks appealing cuz all uni finances are covered with ...
yes but it can be uber competitive but maybe you can stand out depending on your projects/resume
good luck

lapis sequoia
What's your favorite resource to study/learn about ML?
Preferably one that helps you get a solid fundamental understanding of the underlying principles.
 warped fern
hazy saddle
/home/carlos/Documentos/Programacion/Python/angela_dane/semanal/data.py:58: Sett...
warped fern
hazy saddle
/home/carlos/Documentos/Programacion/Python/angela_dane/semanal/data.py:58: Sett...
Hi @hazy saddle, I am not getting the copy of a slice error on Python 3.10. However if you use .loc[:,'Fuente'].apply... it should work. ```In [5]: import pandas as pd
In [6]: last_week_data = pd.read_clipboard()
In [7]: last_week_data
Out[7]:
Index Fuente
0 0 Armenia, Mercar
1 1 Medellín, Central Mayorista de Antioquia
2 2 Medellín, Central Mayorista de Antioquia
3 3 Medellín, Central Mayorista de Antioquia
4 4 Medellín, Central Mayorista de Antioquia
5 5 Bucaramanga, Centroabastos
6 6 Bogotá, D.C., Plaza Samper Mendoza
7 7 Bucaramanga, Centroabastos
8 8 Bucaramanga, Centroabastos
9 9 Bucaramanga, Centroabastos
In [18]: last_week_data['Ciudad'] = last_week_data.loc[:,'Fuente'].apply(lambda element: element.split(',')[0])
In [19]: last_week_data
Out[19]:
Index Fuente Ciudad
0 0 Armenia, Mercar Armenia
1 1 Medellín, Central Mayorista de Antioquia Medellín
2 2 Medellín, Central Mayorista de Antioquia Medellín
3 3 Medellín, Central Mayorista de Antioquia Medellín
4 4 Medellín, Central Mayorista de Antioquia Medellín
5 5 Bucaramanga, Centroabastos Bucaramanga
6 6 Bogotá, D.C., Plaza Samper Mendoza Bogotá
7 7 Bucaramanga, Centroabastos Bucaramanga
8 8 Bucaramanga, Centroabastos Bucaramanga
9 9 Bucaramanga, Centroabastos Bucaramanga```
wooden sail
haughty pewter
how does one resample their data, especially if it's not timeseries but regular ...
what are you trying to resample?
warped fern
haughty pewter
how does one resample their data, especially if it's not timeseries but regular ...
I am thinking to just create an arbitrary column with a repeating pattern in it such that you can perform a group-by on the arbitrary value.
 fervent narwhal
lapis sequoia
What's your favorite resource to study/learn about ML?
Preferably one that hel...
fervent narwhal
lapis sequoia
What's your favorite resource to study/learn about ML?
Preferably one that hel...
If you are trying to get into deep learning - https://d2l.ai/ is probably one of the better introductions.
I also like to recommend the book by Ian Goodfellow and Yoshua Bengio and Aaron Courville
 serene steeple
hi, i have sql db, and i want to search for string in "comment" collumn, is that possible to search by string ?
warped fern
haughty pewter
how does one resample their data, especially if it's not timeseries but regular ...
For example, you could do something like this df['resampler'] = np.trunc(np.arange(1+step, len(df), step)).astype(int)[:len(df)] to create a new column which could be used to group by. col1 col2 col3 resampler 0 0.607871 10.075861 20.203499 1 1 0.049092 10.531278 20.696755 1 2 0.832901 10.512815 20.765228 1 3 0.376783 10.583901 20.758072 1 4 0.982780 10.229963 20.051475 1 5 0.739152 10.478775 20.420801 2 6 0.720491 10.644305 20.083453 2 7 0.705236 10.203818 20.870851 2 8 0.783557 10.351655 20.012904 2 9 0.957087 10.882574 20.691543 2 10 0.636897 10.653356 20.954984 3 11 0.306318 10.617002 20.963245 3 12 0.557695 10.704019 20.616715 3 13 0.352175 10.987861 20.704404 3 14 0.132969 10.216441 20.135463 3 15 0.615025 10.387754 20.457027 4 16 0.595251 10.301297 20.603991 4 17 0.819896 10.239930 20.914990 4 18 0.336612 10.016438 20.628703 4 19 0.275393 10.850988 20.743750 4 20 0.384558 10.404489 20.853798 5 And then you could perform the groupby like df.groupby(by='resampler', axis=0).first() Which would yield a "resampled" data frame as such: In [39]: df.groupby(by='resampler', axis=0).first() Out[39]: col1 col2 col3 resampler 1 0.607871 10.075861 20.203499 2 0.739152 10.478775 20.420801 3 0.636897 10.653356 20.954984 4 0.615025 10.387754 20.457027 5 0.384558 10.404489 20.853798 In my example, step = 0.2, but you could use a smaller number for a larger sample interval or a larger step for a 'faster' sample rate.
haughty pewter
sorry for the late reply, I was busy with something, I was just trying to perform k-means clustering on these two columns

which ends up creating horizontal clusters
haughty pewter
warped fern
For example, you could do something like this `df['resampler'] = np.trunc(np.ara...
but i'll try that and see how I could modify it, thanks
steady basalt
This for classical stats models otherwise no imo
warped fern
haughty pewter
but i'll try that and see how I could modify it, thanks
To tell you the truth, I am unfamiliar with k-means clustering - not sure if my reply will be helpful for that, but I'll be curious if it does.
wooden sail
steady basalt
This for classical stats models otherwise no imo
this is pretty wrong. you need statistics to formulate appropriate cost functions
steady basalt
ehh statistics is a huge field and not really something u can just 'learn' to apply to cost functions its not worth it
maybe if you just focused on specific areas of statistics
i found the same problem with calculus, massive field but in this case you sort of need to wade through the endless foundational stuff before moveing on to differentials
else it makes 0 sense
my statement was meaning that the relevant importance of stats drops off compared to other stuff once you exit those areas of ml
exotic thicket

Hello ppl my question is how this (1,1) can be ruled out when it can be (1,0) as it can also fires 1
Or is that inhibitory is 1 then whole unit becomes "0"??
steady basalt
didnt it say x2 must be 0
wooden sail
steady basalt
my statement was meaning that the relevant importance of stats drops off compare...
i disagree entirely, the majority of ML is estimation theory and IS statistics
steady basalt
wooden sail
i disagree entirely, the majority of ML is estimation theory and IS statistics
what are the main applications of probability theory in ML would you say
in a typical classification project
wooden sail
everything, lol. the output of the network is probabilities, to start with
steady basalt
sure, but how would being well versed in probability theory help you produce better results from a random forest for instance
wooden sail
let's just say that all of the issues you've been having with your unbalanced classes are statistics problems
steady basalt
yep. and ive found that categorising age improves random forest performance, whichi believe has been due to reducing noise
exotic thicket
@steady basalt which step in the row ua narrating abt
wooden sail
well, you'd know what you're doing instead of "believing" if you knew stats. you're at a point where you're so far removed from the topic that you can't properly assess its usefulness
steady basalt
wooden sail
well, you'd know what you're doing instead of "believing" if you knew stats. you...
Even if i 'knew' all of stats, i wouldnt be able to exploit that with python on this data
how would you even go about analysing how the noise is ruining classififiers?
practically
The root of the issue is poor data not imbalance
wooden sail
you would also be able to do something about that, too, but the conversation is pointless
my only point is to tell you not to misguide others by saying stats isn't important, it's key in ML whether you understand that or not
steady basalt
it is important, that isnt what I said at all
steady basalt
wooden sail
you would also be able to do something about that, too, but the conversation is ...
im listening, theres no need to hate
 thorn bobcat
So I'm trying to implement a Sequential model to Detect the likelihood of someone getting liver cirrhosis given some readings and I keep running into this error while trying to train the model:
WARNING:tensorflow:Layers in a Sequential model should only have a single input tensor, but we receive a <class 'dict'> input: {'N_Days': <tf.Tensor 'IteratorGetNext:11' shape=(None,) dtype=int64>, 'Status': <tf.Tensor 'IteratorGetNext:18' shape=(None,) dtype=string>, 'Drug': <tf.Tensor 'IteratorGetNext:8' shape=(None,) dtype=string>, 'Age': <tf.Tensor 'IteratorGetNext:0' shape=(None,) dtype=int64>,
I just wanna make sure I'm doing it right or make it work for starters.
FULL CODE @
https://drive.google.com/file/d/101ZQUkUi8ZnYm6g5YPdCIdWZtwwx_nEi/view?usp=sharing
Google Docs
 versed gulch
from torch.utils.data import Dataset
class ConfocalDataset(Dataset):
    def __init__(self, img_dir, mask_dir, transform=None):
        self.img_dir = img_dir
        self.mask_dir = mask_dir
        self.transform = transform
        # list all the files in this folder
        self.imgs = os.listdir(img_dir)
        self.mask = os.listdir(mask_dir)

    def __len__(self):
        return len(self.imgs)

    def __getitem__(self, index):
        img_path = os.path.join(self.img_dir, self.imgs[index])
        mask_path = os.path.join(self.mask_dir, self.mask[index])

        img = czifile.imread(img_path).reshape(242, 512, 512)
        mask = io.imread(mask_path)

        if self.transform:
            img = self.transform(img)

        return (img, mask)
dataset = ConfocalDataset(img_dir = images_path, mask_dir = masks_path,
                          transform = transforms.ToTensor())

dataset[0][0].shape
gives torch.Size([512, 242, 512]) instead of 242,512,512 which I specified in my Class, does anyone know why, by the way this is a 3D dataset of greyscale images
 deep condor
hazy saddle
warped fern
Hi <@750548803769073695>, I am not getting the copy of a slice error on Python 3...
deep condor
hazy saddle
warped fern
Hi <@750548803769073695>, I am not getting the copy of a slice error on Python 3...
Hi carry_a_laser, thx for answering, still gettring the warning. I have a question, why did you use [:,'Fuente'], why ;, ?
warped fern
hazy saddle
Hi carry_a_laser, thx for answering, still gettring the warning. I have a quest...
Hi - basically I was using that to try to avoid the error A value is trying to be set on a copy of a slice from a DataFrame. Try using **.loc[row_indexer,col_indexer]** = value instead. Basically ":" is the row_indexer and 'Fuente' is the col_indexer. Here is a pretty good explanation on stack overflow: https://stackoverflow.com/questions/48409128/what-is-the-difference-between-using-loc-and-using-just-square-brackets-to-filte
Stack Overflow
I've noticed three methods of selecting a column in a Pandas DataFrame:
First method of selecting a column using loc:
df_new = df.loc[:, 'col1']
Second method - seems simpler and faster:
df_new...
hazy saddle
warped fern
Hi - basically I was using that to try to avoid the error `A value is trying to ...
ok, nice
 vast spade
Hello, I have a question to anyone using m1 mac for data science and machine learning. How is the compatibility of python packages? As I see on the internet, many people still face issues. I'm indecisive just because of these compatibility issues
wooden sail
so, the metal framework should quite in theory allow you to have gpu acceleration on m1 both for pytorch and tensorflow, but you have to follow the steps carefully
vast spade
what about some packages like scikit, numpy, pandas and some database management tools(postgres, sql)
wooden sail
i honestly don't know about those. i would be surprised if they didn't work, but at the same time, they fall back on BLAS and LAPACK builds for x64 normally, so they probably need a special version or have to be built from source. i couldn't say for sure
meager crater
serene scaffold
you can still do that, if you want to do things only in terms of the day (and no...
yeah, catch myself using .replace for that to remove it completely or just .date
velvet birch
I created a scatter matrix for 3 numeric columns I had in my dataframe to identify which columns can be used for clustering

From the above plot I can see that the columns Income and Score are forming 5 clusters and Age and Score are forming 2 clusters.
So I was wondering, that should I use all three columns for the clustering?
serene scaffold
@vast spade this is where you can ask your question
Hello, I have a question to anyone using m1 mac for data science and machine learning. How is the compatibility of python packages? As I see on the internet, many people still face issues. I'm indecisive just because of these compatibility issues
steady basalt
vast spade
what about some packages like scikit, numpy, pandas and some database management...
They run just fine
steady basalt
vast spade
Hello, I have a question to anyone using m1 mac for data science and machine lea...
The issues have been resulted last winter
Resolved
You will have a good experience on Mac OS if you know what you’re doing with miniforge
 young narwhal
Hi, I have a question
I have a dataframe like this:
| col_1 | col_2 | date | money |
| A | B | '2022-06' | 400 |
| A | B | '2022-07' | 500 |
| A | C | '2022-07' | 600 |
| A | C | '2022-06' | 700 |
I need to create as many columns with that date format, to end up like this
| col_1 | col_2 | 2022-06 | 2022-07 |
| A | B | 400 | 500 |
| A | C | 700 | 600 |
For now, I am basically adding the columns (getting a set of that column) and initializing them in 0. Then I just fill the columns one by one in a loop (yes, not very efficient) while filtering the data.
Is there a better (more efficient or pythonic) way to do this?
lapis sequoia
young narwhal
Hi, I have a question
I have a dataframe like this:
| col_1 | col_2 | date ...
I think there is a function which exists which does this. Lemme check docs.
I have done this kinda thing before.
 novel acorn
Hello everyone, hope you're doing great!
Anyone know how to fix this? I'm using seaborn. I want to get the correct scale, but when I set the ylim, and yticks, it looks like in the image.
Code is as follows:
sns.set_style("whitegrid")

ax = sns.lineplot(data = df,
             x = "Tiempo (min )",
             y = "Presión (mbar)",
             )

ax.set(ylim=(min(df["Presión (mbar)"]), max(df["Presión (mbar)"])))
ax.set_yticks(df["Presión (mbar)"])
Dataset is the 2nd image


I want to make it look similar to this, but using Python
 lapis sequoia
young narwhal
Hi, I have a question
I have a dataframe like this:
| col_1 | col_2 | date ...
lapis sequoia
young narwhal
Hi, I have a question
I have a dataframe like this:
| col_1 | col_2 | date ...
There is pandas.get_dummies
!d pandas.get_dummies
arctic wedgeBOT
pandas.get_dummies(data, prefix=None, prefix_sep='_', dummy_na=False, columns=None, sparse=False, drop_first=False, dtype=None)```
Convert categorical variable into dummy/indicator variables.But yeah you'll need to look up to make it work, but it does convert categorical data into each col.
young narwhal
Looks like it is exactly what I needed. Thank you very much. Really appreciated
lapis sequoia
There may be another step required since it may just make cols of 1s and 0s, but it should not be too hard.
novel acorn
novel acorn
I want to make it look similar to this, but using Python
Changed the scale to logarithmic and it's fixed, now I just have to change the ylabels
wooden sail
novel acorn
Changed the scale to logarithmic and it's fixed, now I just have to change the y...
that's what i was about to suggest. you can swap the y ticks for log y and plot in semilogy
novel acorn
wooden sail
that's what i was about to suggest. you can swap the y ticks for log y and plot ...
What's semilogy? 😮
wooden sail
it plots your quantities in a logarithmic scale along the y axis
there is also semilogx, and loglog (both axes logarithmic)
if you use semilogy, it'll change the ticks and the plot for you automatically, but it's up to you if you want to show the ticks in linear or log scale
 worldly wyvern
hello guys i need help a project im working on could someone dm if his free
 cosmic briar
hey guys, i have a dataset with 1380 samples and 1.8 million features, and i need to run supervised learning on it
so important step is feature selection, so i'm trying to find some good methods or libraries for it
i need to keep in mind space and time as well
any suggestions ?
serene scaffold
young narwhal
Hi, I have a question
I have a dataframe like this:
| col_1 | col_2 | date ...
you need to use pivot_table. it's exactly for this
!docs pandas.DataFrame.pivot_table
arctic wedgeBOT
DataFrame.pivot_table(values=None, index=None, columns=None, aggfunc='mean', fill_value=None, margins=False, dropna=True, margins_name='All', observed=False, sort=True)```
Create a spreadsheet-style pivot table as a DataFrame.
The levels in the pivot table will be stored in MultiIndex objects (hierarchical indexes) on the index and columns of the result DataFrame. prime kite
hello, im new here. Is anyone good at analyzing excel files with multiple columns and using time series analysis on them?
I have code setup but running into issues with my low coding knowledge
serene scaffold
prime kite
I have code setup but running into issues with my low coding knowledge
you're most likely to get help when you ask a question that people can read and start answering right away. like by showing the code and the error message.
serene scaffold
!paste
arctic wedgeBOT
Pasting large amounts of code
If your code is too long to fit in a codeblock in Discord, you can paste your code here:
https://paste.pythondiscord.com/
After pasting your code, save it by clicking the floppy disk icon in the top right, or by typing ctrl + S. After doing that, the URL should change. Copy the URL and post it here so others can see it.
prime kite
    #return datetime.strptime(s, '%m/%d/%Y %H:%M') old dating
    return datetime.strptime(s, '%Y-%m-%d %H:%M:%S EDT')

main_data = pd.read_csv('hvac_data.csv', parse_dates=[0], index_col=0, date_parser=parser)

for i in range(2,3):
    coltwo = main_data.iloc[:, i]

stl = STL(coltwo, period=15)
stl_data = stl.fit()
seasonal, trend, resid = stl_data.seasonal, stl_data.trend, stl_data.resid

redsidual_mean = resid.mean() #mean of the residual graph
residual_dev = resid.std() #stdev of the residual graph

upper_bounds = redsidual_mean + 2*residual_dev #for anomaly detection
lower_bounds = redsidual_mean - 2*residual_dev

anomalies = x[(resid < lower_bounds) | (resid > upper_bounds)]
print(anomalies)
My main issue is that I want to analyze all the columns in that range, but it only analyzes the last one in the for loop
and the other issue is that the bounds vary with the column I am analyzing. How would I go about making the bound change based on standard deviation or mean?
earnest widget
I'm facing an issue while trying to import tensorflow-ranking module. The error:
AttributeError: module 'tensorflow._api.v2.compat.v2.__internal__' has no attribute 'monitoring'
The TF version is 2.4.1 with Python 3.9+, trying to get my gpu to work as well so that's why I am using these respective versions.
 slate scroll
earnest widget
The TF version is 2.4.1 with Python 3.9+, trying to get my gpu to work as well s...
slate scroll
earnest widget
The TF version is 2.4.1 with Python 3.9+, trying to get my gpu to work as well s...
Maybe try upgrading numpy and TF? https://github.com/tensorflow/tensorflow/issues/54286#issuecomment-1031205739
young narwhal
serene scaffold
!docs pandas.DataFrame.pivot_table
That solved my problem in nearly one line. Thank you very much sir
 indigo moth
Hi guys !
I have a couple of questions that teachers never answer in data science master courses:
Since I'm passionated with CS and maths, I'd like to make the plots and graphs look better, sharper, cleaner, with dark mode preferably. and I find those matplotlib so ugly !
So, I'd like to have a better understanding on how the conversion between functions and graphs occur so I get to know what to edit to make all these viz look the way I'd like them to.
If someone has a good experience on this please lmk ! :D
serene scaffold
indigo moth
Hi guys !
I have a couple of questions that teachers never answer in data scienc...
I think seaborn plots are nicer, idk?
earnest widget
slate scroll
Maybe try upgrading numpy and TF? https://github.com/tensorflow/tensorflow/issue...
I did upgrade to TF 2.9.0 but now my GPU does not show up, I guess there is specific support for certain Python versions with TF.
indigo moth
serene scaffold
I think seaborn plots are nicer, idk?
Well, I'm not really looking for a lib name since I guess this is just about me googling and finding it but, I'd like to know if I can maybe create my own graphics or something? :o
Since matplotlib is mostly used, I'd like to know if there's a way to edit just the graphics part of it if that makes sense?
wooden sail
tbh if you want that granularity, i would recommend you export the data you want to plot into a csv, and then plot it in latex using tikz and/or pgfplots. then you can create vector graphics out of your dataset and format them however you like
 indigo moth
wooden sail
tbh if you want that granularity, i would recommend you export the data you want...
indigo moth
wooden sail
tbh if you want that granularity, i would recommend you export the data you want...
mmmh you can't always do this ig
wooden sail
wdym?
prime kite
how do you make a for loop that loops through csv columns? while applying your anomaly code?
like my previous code
serene scaffold
prime kite
how do you make a for loop that loops through csv columns? while applying your a...
if you use pandas, you can do iteritems(), I guess
!docs pandas.DataFrame.iteritems
arctic wedgeBOT
DataFrame.iteritems()```
Iterate over (column name, Series) pairs.

Iterates over the DataFrame columns, returning a tuple with the column name and the content as a Series.but the goal is often to do this as little as possible.
prime kite
will this work for large data set with 100 columns?
serene scaffold
prime kite
will this work for large data set with 100 columns?
you can iterate over as many columns as will fit in the memory of your computer.
dusty valve
given two images, what algorithm(s) can i use to determine the similarity between the two? I've read up a bit on image similarity but i don't know where to start.
serene scaffold
dusty valve
given two images, what algorithm(s) can i use to determine the similarity betwee...
semantic similarity?
(I have no idea, I'm just thinking of how we can unpack your question)
 agile cobalt
from a quick google:
the answers in https://stackoverflow.com/questions/11541154/checking-images-for-similarity-with-opencv explains some methods
seems like https://www.geeksforgeeks.org/measure-similarity-between-images-using-python-opencv/ implements the 'histogram' one, but idk if that's even the best way to implement it since geeks4geeks isn't very credible tbh
Stack Overflow
Does OpenCV support the comparison of two images, returning some value (maybe a percentage) that indicates how similar these images are? E.g. 100% would be returned if the same image was passed twi...
serene scaffold
agile cobalt
from a quick google:
the answers in https://stackoverflow.com/questions/11541154...
geeks4geeks is an exploration of sadness.
 iron basalt
dusty valve
given two images, what algorithm(s) can i use to determine the similarity betwee...
iron basalt
dusty valve
given two images, what algorithm(s) can i use to determine the similarity betwee...
What makes two images similar? Which objects they contain? Which patterns they contain? Difference in pixel values (pixel by pixel)? Overall dominant colors? Total brightness level?
Or maybe a combination of all of the above in some weighted / heuristic fashion?
 alpine epoch
hi! simple request
how would i search this:
say i have one type of element called an A. i have a list of A's.
i also have an element type B as well as a master list. i know that in the master list, all A's are flanked by B's, in that an A element is surrounded by a B on both sides
now, i want to find the specific B's that surround the A's i have
how would i do this? sorry its not too specific because its a bioinformatics question for currently unpublished research but im blanking out lol
serene scaffold
alpine epoch
how would i search this:
say i have one type of element called an A. i have a l...
I would transform the sequence into a string and use a regular expression.
wooden sail
iron basalt
What makes two images similar? Which objects they contain? Which patterns they c...
you are under the impression that there is a single definition of "distance" and "similarity". all of the things you mentioned are valid metrics, and you're supposed to use the one that suits your application
serene scaffold
but I'm one to see a lot of things as a regular expression problem. because I have issues. sort of like how if you're vladimir putin, you see a lot of things as a long white table problem.
iron basalt
wooden sail
you are under the impression that there is a single definition of "distance" and...
There is not a single definition. You have to choose, I am asking them because they probably have some idea of what they want / what their problem is.
serene scaffold
wooden sail
you are under the impression that there is a single definition of "distance" and...
you are right. the asker didn't specify.
wooden sail
iron basalt
There is not a single definition. You have to choose, I am asking them because t...
sorry i pinged the wrong person, i was reading the original message you referenced 😛
iron basalt
wooden sail
sorry i pinged the wrong person, i was reading the original message you referenc...
Yeah I often reply to the wrong thing.
iron basalt
dusty valve
given two images, what algorithm(s) can i use to determine the similarity betwee...
You have to choose what you think will be good indicators for later for whatever problem you are doing and try to extract those / compare the images by that.
And you can then organize images by those indicators.
wooden sail
alpine epoch
how would i search this:
say i have one type of element called an A. i have a l...
you could formulate this as a peak-finding problem. what you have is of the same shape as non-overlapping "pulses" in a time series, and these can be located by doing matched filtering and then peak-finding. this is pretty much equivalent to what stelercus said regarding regex, since the sequences are well-resolved. the only open question is whether BABAB is a valid sequence with 3 Bs or not, i.e. if it should be BABBAB instead. in either case, this can be done efficiently with something like a sliding window, or if you're feeling super fancy, with a discrete fourier transform
iron basalt
If you are doing some NN stuff, you can have the NN find out those for you while it tries to do whatever problem you want it to do. If the NN is big enough / is flexible enough / depending on the type of NN.
(Hard coded approach vs let the NN figure it all out (with enough data / training))
wooden sail
i keep a notebook under my pillow, but i doubt that's what you mean
iron basalt
alpine epoch
is anyone here familiar with bed files btw
Do you mean BED files? https://en.wikipedia.org/wiki/BED_(file_format)
The BED (Browser Extensible Data) format is a text file format used to store genomic regions as coordinates and associated annotations. The data are presented in the form of columns separated by spaces or tabs. This format was developed during the Human Genome Project and then adopted by other sequencing projects. As a result of this increasingl...
alpine epoch
iron basalt
Do you mean BED files? https://en.wikipedia.org/wiki/BED_(file_format)
yes!
iron basalt
alpine epoch
yes!
What about them? They are really simple.
alpine epoch
yep; im just searching entries of these
would the peak file approach be useful for this
im just terribly inexperienced thats all
iron basalt
alpine epoch
would the peak file approach be useful for this
What Edd suggested sounds good. I would start with a sliding window (most simple approach) on some made up cases to test, then bigger cases and try to account for edge cases. So the usual programming process for exploratory algorithm design / making something up.
If your starting test cases are small enough, and there are not too many computations, you can do it by hand on paper first before worrying about code.
wooden sail
some questions include: do you really only want BAB, or is in some cases something like CAB or AAB allowed? what happens at the beginning and end of the list? e.g. starting with AB or ending with BA? is BABAB two pairs of valid surrounding Bs or just one? you can ignore them when you first set things up, but they have to be dealt with at some point
we could call these "noise", "boundary conditions" and "overlap"
iron basalt
Solve the more simple version of the same problem first (that still captures the main issues / essence) and let that inform you on how to do the more complex version later (the actual problem).
steady basalt
PCA really doing a number on my classifier. does PCA even work properly if its alot of binary features
dusty valve
iron basalt
What makes two images similar? Which objects they contain? Which patterns they c...
i was thinking a weighted combination them
 tidal bough
dusty valve
given two images, what algorithm(s) can i use to determine the similarity betwee...
tidal bough
dusty valve
given two images, what algorithm(s) can i use to determine the similarity betwee...
!pypi ImageHash
arctic wedgeBOT

Image Hashing library
tidal bough
these might be what you're looking for
they detect stuff like cropping/scaling/reencoding (as in, such operations don't affect the perceptual hash much), and generally also overall similarity
steady basalt
@wooden sail

what does it mean by is cont.?
there is only one point -2,1
or is that giving x values?
wooden sail
that's an interval of x values
wooden sail
no
steady basalt
what is a continuous function anyway?
wooden sail
it means at all the infinitely many x values in that interval
steady basalt
oh ok
ty
so yea between those two values f(x) can only be those two functions depending on the value of x
but im not sure what theyre exactly asking by that
wooden sail
i think the accessible definition of continuity for you is in terms of limits
steady basalt
so theres... more advanced stuff that would be beyond this level in that definition?
wooden sail
epsilon delta would be nice, but that's also elementary
wooden sail
a is false
wooden sail
with the limit definition, for points inside the interval, we say f is continuous at the point (c, f(c)) if f(x) = a (the function is defined at x=c and has some value a) and also the limit as x -> c of f(x) is a
that means the function has to be defined at that value of x, and the limit as x approaches that value from the left and from the right has to equal the value of the function
in your example, f(0) = 2, since f(x) = x + 2 in the interval [0,1]. if we approach x = 0 from the right, we get this same value. however, if we approach from the left, then f(x) = x - 1, whose limit as x approaches 0 from the left is -1
then the limit as x -> 0 of f(x) does not exist, and the function has a type of jump discont.
iirc at the boundaries of the interval it suffices to have the corresponding one-sided limit
i'm afraid there's no simpler explanation
while we're at it, for b), note that sin(y) is 2 pi periodic, meaning that it starts over whenever y is an integer multiple of 2 pi, i.e. of the form 2 n pi for integer n. now we do a substitution with y = 2 pi x. then we need y = 2 pi x = 2 n pi, so x = n. that means that every integer value, sin (2 pi x) repeats itself, so it indeed has period 1
steady basalt
wooden sail
then the limit as x -> 0 of f(x) does not exist, and the function has a type of ...
so its a gap?
well, it will look like a bunch of vertical lines
iron basalt

Desmos
If you go from the left to right, what is the furthest y you get to without jumping, and if you go from right to left, what is the furthest y you get to without jumping?
wooden sail
what? how does that translate to vertical lines? and infinitely many, at that
steady basalt
in the interval for example of 0 to 1, f(x) = x+2 right?
wooden sail
mhm
steady basalt
so at any points id have thought you'd just get a line going straight
steady basalt
if x is 1.5, youd get a straight line y=x+5
wooden sail
that's just one point (c, f(c))
steady basalt
sorry y=1.5+2
wooden sail
that's a point, not a line
wooden sail
you need to take a step back
iron basalt
The problem is we are not dealing just with individual points, we are trying to talk about the function as a whole.
wooden sail
review some precalc before you step into calculus, otherwise you will understand nothing
steady basalt
yes im in my first week of this topic xd i just happened across a more advanced problem that what ive learnt
and was curious
wooden sail
take a step back to algebra
steady basalt
im currently going thru the function stuff now which may be similar to 'precalc'
its explaining exponential functions, transformations, trig functions
striaght lines, curves
wooden sail
that's indeed what you should look at, but this looks like you skipped ahead, since it involves limits
wooden sail
ok. take it easy, all in good time
steady basalt
im on page 21 out of 1100
wooden sail
haste makes waste, and all of the stuff you see will build up on itself. if you skip something, it'll come back and bite you
steady basalt
honestly may need to practise more algebra if i ever want to take on the advanced stuff, it looks mind bneding
towards the ned of the book its like some trippy shit, pipes and stuff
stokes law is meant to be from physics
...
wooden sail
no, that's a common application for it though
steady basalt
it will probably take me a literal year to finish this book
iron basalt
It's just more notation, it will make sense when you see each notation introduced one by one.
And have a solid intuition before calc.
steady basalt
'calculus, single and multivariate' by hallett, check it out. starts with the basics and builds into some advanced stuff
wooden sail
it sounds like the book goes all the way from precalc to vector calc from what you're saying. this is like 3 or 4 semesters of math
iron basalt
How functions look when plotted and algebra's relation to geometry.
steady basalt
wooden sail
it sounds like the book goes all the way from precalc to vector calc from what y...
that is correct, but the precalc is quite short actually, just a couple chapters
probably the first 80 out of 1k pages
wooden sail
you need to be fluent in that stuff to before you move on though
steady basalt
right now its just exersices for log functions and 'compisites' functions within functions liek f(g(x))
it took me ages today of contemplating just to give up and look at the solution but it was k(y) = e^-y&^2 and you had to composite it
iron basalt
If you want the really easy intro to calculus, then Calculus Made Easy by Thompson is pretty good. But the book you currently have seems fine too. Just don't skip stuff. You can't really do that in a math book unless you already know a lot of math.
steady basalt
the reason why it was so hard bcs they never exaplined you have to introduce another 'z'
the answer was f(z) = e^2 and f(g) y^2
wooden sail
that looks all sorts of wrong
steady basalt
so i think its f(z(g)) or something
thats from memory tho i can grab a photo
example 2B
 steady basalt
not looking forward to the upcoming sin cos stuff comning up
hated that in school
just excited when i finally get to differentials
steady basalt
side note: how would you go by altering this random forest so that you increase recall by sacrificing a little bit of precision
 steady basalt
id be happy for it to overguess 1 a little bit more
 copper wasp
Thanks
steady basalt
@wooden sail wow hit some truely incredible information
f^-1(x)
and eulers number
just amazing
wooden sail
log(exp(x)) = x moment
steady basalt
im guessing u know alot about inverse functions
if R = f(T) = 7T-35,
T = f^-1(R), why does that equal R/7 +5?
r/7 + 35 no id have thought
ohhh we divide 35 by 7
oops missed that
 rough mountain
So I have a bunch of review data and I wish to extract sentiment toward certain topics. Any idea on how to go about this?
Currently I'm just extracting sentences that contain related keywords and getting sentiment from those.
 spare briar
 modest onyx
you forgot the learning rate
modest onyx
Oh yeah true
Good catch
I was planning to finish up this video for the SOME2 thing, but at this point I really just want to make the best video I can make
which means I won't lower the quality just to meet the deadline of 2 days 😪
 quaint sable
at the moment I'm using list comprehension to append json data to another list. Overtime this will use alot of processing power, is it better to pass json data to a np array?
velvet birch
Can anyone suggest some good feature selection techniques for clustering?
wooden sail
modest onyx
the vids are looking ok, but you're shooting yourself in the foot with the first one. because you chose a non-convex plot, you now have to explain how and when gradient descent does and does not work, since it doesn't always converge, and even if it does, it doesn't necessarily do so at the global optimum
modest onyx
well yeah because that's the truth
neural networks are non convex so I want to make that clear from the start
I don't have to go into too much detail though, just mention that it's non convex and what non convex means and the problems that causes to training
very briefly
wooden sail
convexity is a kinda large topic to just brush under the rug, but ok 😛
modest onyx
yeah but would you say it's better to mention it briefly to make the viewer aware of it (so that they might look into it further if they like), or not mention it at all?
wooden sail
i guess the former, if those are your only 2 options
modest onyx
well yeah cuz the video is supposed to be an introduction to computer vision with a focus on deep learning
I'm not even planning to go into the details of backprop as that deserves a video for it's own
a "tourist guide" so to speak
modest onyx
also random question
do you think I should refer to mse_error as E or something referring to error in general?
just thought about it now
that might make it more clear that I can put any differentiable error function there and it would work
wooden sail
maybe call it cost function or error/error energy
 lucid pelican
I have a small doubt regarding numpy save, is it faster to load a saved array of shape (1105, 512, 256, 1) or to compute it on the go. does anyone have any idea?
 wooden sail
you can test it yourself with timeit. it'll depend on which operations are used to create the arrays. in your case, the array seems to require loading several other arrays, so i'd say loading a single big array is a lot faster than loading several arrays
steady basalt
@wooden sail surely they don’t mean f divided by g right? U can’t calculate that with ur brain

12C
Surely it just means of either
wooden sail
wdym?
steady basalt
3n^2-2 / n+1
When I put that into the website it makes a graph which certainly has two domains
Weird
wooden sail
a function cannot have two domains
wooden sail
that's still just one domain, but made up of the union of disjoint sets
wooden sail
it should've been, discussing domains of functions requires talking about sets, since the domain of a function is a set
steady basalt
I’ve been taught domains
wooden sail
then that should've been there
steady basalt
But not when it has to be calculated of something like that where there’s a gap
wooden sail
keep in mind division by 0 is undefined
steady basalt
I was thinking instead of a divide sign they just meant and
wooden sail
that means the function does not exist when the denominator is 0
steady basalt
So x can’t be 1?
wooden sail
n cannot be -1
steady basalt
So it’s -inf to excluding -1 then excluding -1 to inf
wooden sail
mhm
steady basalt
They didn’t show how to do two sets of a domain
How does this graph look
Is the syntax that big { for two domains?
wooden sail
there's several ways to describe a set
i think the easiest here would be
.latex $(-\infty, -1) \cup (-1, \infty)$
 strange elbowBOT
 strange elbowBOT
 wooden sail
.latex or $n \in \mathbb{R} \ {-1}$
strange elbowBOT
 steady basalt
strange elbow
steady basalt
strange elbow
Must be this thanks
Or with the > and < signs but with a comma between?
wooden sail
that's also valid, yeah
steady basalt
If it CANT be -1 shudnt the bracket be ]?
wooden sail
] includes the value, ) excludes it
steady basalt
So we exclude infinity?
wooden sail
it's not a number, and it's not part of the traditional real numbers
steady basalt
Oh ok
wooden sail
strange elbow
ignore this one btw, i mangled it. i wanted to write a set difference but forgot a few brackets and stuff
steady basalt
x^3 +5x +10 this is invertible and yet x^3 -5x+10 isnt, weird
why does stretch only happen negatives
exotic thicket
Hello Guys, I'm into the Perceptron learning algorithm in that I'm stuck on the Cconvergence of Perceptron learning based on deep learning so, is there any best interpretation resource that clarifies some of my doubts if anyone knows abt the concept let me know
wooden sail
how in-depth of an answer are you looking for
steady basalt
exotic thicket
Hello Guys, I'm into the Perceptron learning algorithm in that I'm stuck on the ...
Convergence on the minima?
U reading gradient descent?
steady basalt
@wooden sail red flag, my text book has rly bad reviews. people complain it gives problems it h asnt given prior teachings for in terms of methods
wooden sail
do they give concrete examples? tbh i know better than to trust the reviews of students at face value 😂
steady basalt
wooden sail
do they give concrete examples? tbh i know better than to trust the reviews of s...
not for everythign thats asked, which is why i may have upset you previously as It wasnt even covered earlier
but its liek 3/5 stars reviews. maybe i shud use a rly popular one instead?
I had a look at a famous maths book from the 1950s on analysis and it covers all theory but its too hard for me to understand past page 20 because its purely explaining definitions in a quick way
steady basalt
I meant the rudin book
wooden sail
yeah, you're definitely not ready for that
steady basalt
the book starts off with things that I NEED to know though
i can give u an example, in the first few pages it explains SYNTAX that i literally need to read papers such as how to show that something belongs to a set in symbols
wooden sail
you can try if you want, then, but that's a book usually used in mathematics majors that requires a lot of mathematical readiness
steady basalt
for example
wooden sail
you can get to that level early if you're good, but for many people you need to already know calculus before learning analysis
steady basalt
 wooden sail
like it'd go after your current book
steady basalt
this i think is foundations that I SHOULD learn
rational number system is something u shud know by default
I mean, take a look at the first 10 pages
wooden sail
trust me, you're not ready for that 😛
 wooden sail
if you study this way, you will get stuck at natural numbers before even reaching trig and calculus
yes, you should, but waaaay later on
you don't understand anything there, and you won't for quite a while
 wooden sail
YES lol
steady basalt
but this looks like plain logical tinking
wooden sail
😂
wooden sail
steady basalt
OBVIOUSLY theres only one positive
there is no "obviously", you need to PROVE it
nothing is taken as obvious. you have to start from the proof that 1 +1 = 2 working with natural numbers before you even reach this
steady basalt
the proof is that something to the power of a positive number equals a positive number must have a positive base?
wooden sail
you should DEFINITELY skip this
steady basalt
ok ill leave this book for now
so this is taking concepts i will learn about soon in my text book but turning them into actual theoretical proofs which is deeper?
wooden sail
if you don't believe me, try the book out and see how far you get with what you know 😛 lemme know how that goes
wooden sail
steady basalt
so this is taking concepts i will learn about soon in my text book but turning t...
pretty much. it's a lot more formal
you remember you disliked linalg, yeah? why was that?
steady basalt
but ill learn about |z| in calc?
wooden sail
that's complex variables/complex analysis. that goes after calc
steady basalt
oh okay
after how much calc tho? cause my textbook goes to university level i think
im pretty sure my book ends highschool calc after 70%
wooden sail
university level 😛 complex analysis requires multivariable calculus
and some linear algebra too
steady basalt
my book goes to multivariable but also more whacky stuff that i showed previously
im sure thats first year uni at least
wooden sail
yes, you need that for complex vars too
green's theorem, for example, is used all the time
steady basalt
is that stokes stuff uni level
wooden sail
yes
steady basalt
1st year?
wooden sail
multivar calc level
however long it takes you to get there
so differential calc and integral calc are prerequisites. at least 2nd year, very likely
steady basalt
i feel like over here in high school multivariable is part of a advanced course u take in school
wooden sail
you say that but, did you learn it?
steady basalt
no cause i dropped the subject in my first year of hs
wooden sail
it doesn't matter what level it "should" be taught at, what matters is that you don't know it
steady basalt
i got to basic differential and integrals
wooden sail
so you need to review it from scratch
wooden sail
well, get a different book and compare them as you go along
steady basalt
AbeBooks.com: Calculus: Single and Multivariable, International Student Version (9780470409442) by Hallett, Deborah Hughes and a great selection of similar New, Used and Collectible Books available now at great prices.
not sure what international means
lots of ppl saying dont use for self teach
seems very differnet to the normal one
normal edition looks way harder
 spice marten
How do you guys come up with project ideas?
I have been trying to think of a cool idea for weeks now
And I literally can't
rough mountain
So, how do I detect if a sentence is about a specific topic? I know that lda and stuff exist, but they don't seem that useful in this case.
rough mountain
spice marten
I have been trying to think of a cool idea for weeks now
If you want a challenge, play with the steam review data of your favorite game.
serene scaffold
rough mountain
So, how do I detect if a sentence is about a specific topic? I know that lda and...
can you elaborate?
spice marten
Idk Im looking to do something that involves AI and web scraping but I can't think of nothing.
rough mountain
serene scaffold
can you elaborate?
Say I have video game reviews.
"The graphics are very good."
"The game looks good"
"The game is very fun"
In this example I wish to filter for reviews talking about graphics. So I want to get the first two reviews from my dataset.
serene scaffold
rough mountain
Say I have video game reviews.
"The graphics are very good."
"The game looks go...
if you're looking for reviews about graphics, why would you want the first two, but not the last one? because the second two are basically the same.
wooden sail
i think they mean "looks" quite literally
serene scaffold
I see
wooden sail
it is a good-looking game
rough mountain
Oops bad example. ^ this is right
rough mountain
wooden sail
it is a good-looking game
that's a better example
serene scaffold
well, you don't have to overthink it. can you just look for certain keywords? "looks", "graphics"?
rough mountain
serene scaffold
well, you don't have to overthink it. can you just look for certain keywords? "l...
I've tried that. In somewhat works, but going through and looking for every keyword is time consuming and prone to error. And if possible a better method would be able to use context, as I've just shown many words have double meanings.
serene scaffold
rough mountain
I've tried that. In somewhat works, but going through and looking for every keyw...
if checking that a string contains at least one of a few possible substrings is taking a long time, I imagine that so will anything "smarter"
rough mountain
serene scaffold
if checking that a string contains at least one of a few possible substrings is ...
Not processing time, but human time in finding the keywords in the first place
wooden sail
not to mention you'd need labelled data in the first place, though
rough mountain
Honestly I wouldn't mind making a dataset once if could be confident I could re-use the model it makes.
serene scaffold
rough mountain
Not processing time, but human time in finding the keywords in the first place
if you have a dataset where reviews about the visual aesthetic of the game are marked, you can write something to figure out what "interesting" words are most frequent in those reviews.
wooden sail
something similar to sentiment analysis seems reasonable off the top of my head, but stelercus is the expert here
rough mountain
Actually that makes sense, instead of sentiment analysis, topic analysis (as in a 0 to 1 chance of it being the topic). The only issue is would would have to train a new model for every topic.
serene scaffold
rough mountain
Actually that makes sense, instead of sentiment analysis, topic analysis (as in ...
topic modeling is a thing, but I don't think that's what you want.
rough mountain
I know, and it's not.
I think it should be possible to find keywords through embeddings, but I'm not quite sure how that would work.
serene scaffold
rough mountain
I think it should be possible to find keywords through embeddings, but I'm not q...
just to be clear, do you have a labeled data set, or no?
rough mountain
I currently do not. I just have reviews and if the reviews were thumbs up or down. If it is the best way I'm willing to make one, but only if necessary.
serene scaffold
rough mountain
I currently do not. I just have reviews and if the reviews were thumbs up or dow...
I would see if anyone has published on anything having to do with video game reviews, and see what dataset they used, and if it's available. it's a long shot, but it's a good idea to check first.
rough mountain
serene scaffold
I would see if anyone has published on anything having to do with video game rev...
The only good dataset I can find is the one of half a million steam reviews I'm already using. It has steam data which is just thumbs up or down and review text along with the game information.
This seems like a method that might get close to what I want. https://blog.insightdatascience.com/contextual-topic-identification-4291d256a032
I don't get to choose the topics, but it at least seems decent
 crystal skiff
guys im trying to make a nn that will detect if a shoe is converse, adidas, or nike
but when i train my model
im getting 41 percent accuracy
i dont know why im a beginner, can someone help me?
this is my code
from pickletools import optimize
from tkinter.tix import ListNoteBook
import tensorflow as tf
from tensorflow import keras
from tensorflow.keras import layers
import os
import cv2
import matplotlib.pyplot as plt
import numpy as np
import random

DATADIR_TRAIN = 'shoes_data/train'
DATADIR_TEST = 'shoes_data/test'

IMG_SIZE = 50

CATEGORIES = ['adidas', 'converse', 'nike']
#               (0)         (1)       (2)

training_data = []

def create_training_data():
    for category in CATEGORIES:
        path = os.path.join(DATADIR_TRAIN, category)
        class_num = CATEGORIES.index(category)
        for img in os.listdir(path):
            try:
                img_array = cv2.imread(os.path.join(path, img), cv2.IMREAD_GRAYSCALE)
                new_array = cv2.resize(img_array, (IMG_SIZE, IMG_SIZE))
                # plt.imshow(new_array)
                # plt.show()
                training_data.append([new_array, class_num])
            except Exception as e:
                print(e)

create_training_data()

random.shuffle(training_data)

X = []
y = []

for features, labels in training_data:
    X.append(features)
    y.append(labels)

X = np.array(X).reshape(-1, IMG_SIZE, IMG_SIZE, 1)
X = X/255.0
y = np.array(y)


model = keras.Sequential([
    layers.Flatten(),
    layers.Dense(256, activation='relu'),
    layers.Dense(128, activation='relu'),
    layers.Dense(3, activation='sigmoid')
])

model.compile(
    loss=keras.losses.SparseCategoricalCrossentropy(),
    optimizer='adam',
    metrics=['accuracy']
)

model.fit(X, y, epochs=10, batch_size=64)```your model is kinda small, and you might wanna exploit spatial invariance by using a few convolutional layers
crystal skiff
what is spatial invariance?
wooden sail
let's say something like the adidas logo showing up anywhere on the image indicates that it's adidas wear. doesn't matter where the logo is
crystal skiff
yea
wooden sail
that's the principle behind convolutional neural networks
crystal skiff
i added the conv layers and the accuracy went up to 79 percent
wooden sail
cool
crystal skiff
wooden sail
that's the principle behind convolutional neural networks
i hsould have used conv layers from the start
wooden sail
to be fair, you could've gotten good results with an arbitrarily deep network of only dense layers, but applying all the knowledge you have of the underlying phenomenon into the network structure makes it perform better more easily
that's the difference between bad black box deep learning and knowing what you're doing 😛
 arctic cliff
I don't know whether I should learn TF or PyTorch
And what's the best source to learn the syntax?
Thanks in advance
serene scaffold
arctic cliff
I don't know whether I should learn TF or PyTorch
And what's the best source to ...
languages have syntax. libraries have APIs. you don't "learn TF/pytorch syntax".
it seems that pytorch is becoming more widely used than TF.
arctic cliff
That makes sense ^^"
Where can I learn PyTorch?
I am learning Deep learning from Andrew ng so I just need to learn how to use the library ig
serene scaffold
I don't think we have a curated resource for that, unfortunately.
arctic cliff
Thanks
lapis sequoia
arctic cliff
I don't know whether I should learn TF or PyTorch
And what's the best source to ...
In case of tf, we have this
https://www.tensorflow.org/tutorials

TensorFlow
Complete, end-to-end examples to learn how to use TensorFlow for ML beginners and experts. Try tutorials in Google Colab - no setup required.
lapis sequoia
idk if this is the channel but
given the url of an embed video, can u get a random frame without downloading the whole video?
 junior forum
serene scaffold
languages have syntax. libraries have APIs. you don't "learn TF/pytorch syntax"....
junior forum
serene scaffold
languages have syntax. libraries have APIs. you don't "learn TF/pytorch syntax"....
Do you happen to have some thoughts on why people are using PyTorch?
 eager hollow
Recently got into ML/DL for a video for my channel, i genuinely fell in love with it. I learned TensorFlow, but, i hear a lot of people saying PyTorch is better. Should i switch
unique flame
I would do both. I'm gonna learn pytorch too after a while for the sake of versatility.
modest onyx
learn pytorch please
serene scaffold
junior forum
Do you happen to have some thoughts on why people are using PyTorch?
not really. originally, tensorflow was more "black boxy" than pytorch, but I don't think it's like that anymore.
modest onyx
don't learn tensorflow
serene scaffold
modest onyx
don't learn tensorflow
perhaps you could answer tsavorite's question 
 serene scaffold
what's "other"? jax?
modest onyx
even google is switching their products to jax
modest onyx
serene scaffold
what's "other"? jax?
nah probably all other frameworks whatever they are
I'd assume jax holds most of its percentage tho
steady basalt
modest onyx
tensorflow is dying
Yes he’s it is, and funnily enough google shills keep claiming otherwise. PyTorch is winning for academia except in industry where companies that for some reason don’t want to
Tensorflow really is annoying trying to shove data into models and getting version errors
 supple wyvern
are there any good tutorials with tensorflow which it reads an image and recognises it?
possibly any with teachable machine
serene scaffold
supple wyvern
are there any good tutorials with tensorflow which it reads an image and recogni...
recognizes what about it?
 modest thistle
presumably he meant the bot can describe what the image is: https://stackabuse.com/image-recognition-in-python-with-tensorflow-and-keras/
Stack Abuse
TensorFlow is a well-established Deep Learning framework, and Keras is its official high-level API that simplifies the creation of models. Image recognition/c...
crystal skiff
hey guys, so i made a model that can classify weather a show is converse, nike or addidas but when i try to predict i gives me this out put [[0, 1, 1]] and i dont know what to make of this, can someone explain this to me
from tensorflow import keras
from tensorflow.keras import layers
import os
import cv2
import matplotlib.pyplot as plt
import numpy as np
import random

DATADIR_TRAIN = 'shoes_data/train'
DATADIR_TEST = 'shoes_data/test'

IMG_SIZE = 50

CATEGORIES = ['adidas', 'converse', 'nike']

training_data = []

def create_training_data():
    for category in CATEGORIES:
        path = os.path.join(DATADIR_TRAIN, category)
        class_num = CATEGORIES.index(category)
        for img in os.listdir(path):
            try:
                img_array = cv2.imread(os.path.join(path, img), cv2.IMREAD_GRAYSCALE)
                new_array = cv2.resize(img_array, (IMG_SIZE, IMG_SIZE))
                training_data.append([new_array, class_num])
            except Exception as e:
                print(e)

create_training_data()

random.shuffle(training_data)

X = []
y = []

for features, labels in training_data:
    X.append(features)
    y.append(labels)

X = np.array(X).reshape(-1, IMG_SIZE, IMG_SIZE, 1)
X = X/255.0
y = np.array(y)

model = keras.Sequential([
    layers.Conv2D(64, (3, 3), input_shape=X.shape[1:]),
    layers.Activation('relu'),
    layers.MaxPooling2D(pool_size=(2, 2)),

    layers.Conv2D(64, (3, 3)),
    layers.Activation('relu'),
    layers.MaxPooling2D(pool_size=(2, 2)),

    layers.Flatten(),
    layers.Dense(256, activation='relu'),

    layers.Dense(128, activation='relu'),
    layers.Dense(3, activation='sigmoid')
])

model.compile(
    loss=keras.losses.SparseCategoricalCrossentropy(),
    optimizer='adam',
    metrics=['accuracy']
)

model.fit(X, y, epochs=19, batch_size=64, validation_split=0.1)

model.save("model.h5")
from tensorflow import keras
import cv2
import matplotlib.pyplot as plt


CATEGORIES = ['adidas', 'converse', 'nike']

def prepare(path):
    IMG_SIZE = 50
    img_array = cv2.imread(path, cv2.IMREAD_GRAYSCALE)
    new_array = cv2.resize(img_array, (IMG_SIZE, IMG_SIZE))
    return new_array.reshape(-1, IMG_SIZE, IMG_SIZE, 1)

model = keras.models.load_model("model.h5")

prediction = model.predict([prepare('shoes_data/test/nike/15.jpg')])

print(prediction)
print(CATEGORIES[int(prediction[0][1])])```Can it only be one of the three? @crystal skiff
crystal skiff
yea
mild dirge
Then your model is wrong
you shouldn' t be able to get 2 ones
You are using sigmoid instead of softmax for the last layer
crystal skiff
lemme make that change
mild dirge
Then you get something like
[0, 0, 1] -> Converse
[0, 1, 0] -> Nike
[1, 0, 0] -> Addidas
crystal skiff
ur right
crystal skiff
imm a beginner to this so pls excuse my silly mistaks

 mild dirge
Whats the problem? @bold timber
bold timber
mild dirge
Whats the problem? <@786960616664727572>
I don't know why the output shape becomes None, 30, 30, 32
can you explain this?
mild dirge
None is the batch size, which may be unknown, and thus None
Then you have a kernel of 3x3, so the output shape is reduced by 2 for both image dimensions
And 32 filters, thus it becomes (32-2, 32-2, 32) thus (30, 30, 32)
Which part confuses you? @bold timber
bold timber
mild dirge
Then you have a kernel of 3x3, so the output shape is reduced by 2 for both imag...
Why it get reduced by 2? whether it because I use pool_size 2,2?