#profiling observations - dedicated
1 messages · Page 1 of 1 (latest)
 royal beacon
thread

wSimSV doesnt have MT (mostly PhysObjs) - is it they may influence each other and thus must remain linear?
overall usually a big computation part with many vehicles (carX, tankX, planeX)
while those for SPE normally have around 0.1 ms, there is also situations with 0.5-0.8 ms, and certain extreme situations with 2-3 ms
curious if any config side parameter(s) may influence this simulation part

fsAPr seems like data loading. another case of seemingly slow loading (yet not as bas as other samples to follow in other areas)

cLVis may be worth looking into

wPSnd is also fairly heavy on the server - usually its a specific one

wsSet looks to be already handled by MT handling very well(?). usually has both on a client a sizeable (1-1.5 ms ) footprint here. might be worth looking into if optimizations are doable. no clue what this is about tho

similar situation with visUU - should be some type of visibility/LOS type checks going by the naming - those are expensive tho in nature

also crULOC from netwT (network data handling?) might be worth a look for high pop servers (players/AI) - needs frame caps from those servers
royal beacon

animDone to add up
we dont have anything set up in SPE tho. for A3 i can only see for animals or otherwise just mission specific.
only other i could think of would be XEH/CBA?
another snapshot of PhysObs importance


wsSet seem mostly updAttPos - some AI decision making?

another wPSn1 sample - this time with Car


25 ms preloading(?) of a/multiple sound file(s) within reasonable limits (ogg/wss)


79, 15 and 24 ms for rtm in same frame


 winged valley
royal beacon
wSimSV doesnt have MT (mostly PhysObjs) - is it they may influence each other an...
winged valley
royal beacon
wSimSV doesnt have MT (mostly PhysObjs) - is it they may influence each other an...
Yes.
Most of simulation is not safe for MT at all. And I don't think its feasible to fix that
winged valley
royal beacon
while those for SPE normally have around 0.1 ms, there is also situations with 0...
extreme situations over say 0.5ms. Often are one step that iterates over something, which might be multithreadable.
But it needs to be long enough, that multithreading overhead wouldn't make it slower
winged valley
royal beacon
cLVis (line intersects) can be multithreaded, if there are multiple calls to it. But yours only has a single call which wouldn't be worth it.
Also it always depends on which objects are in the line and if they are loaded already or not. It might just be a one-time fluke there
winged valley
royal beacon
Its simulation, has the same multithreading problems, can't do much
winged valley
royal beacon
wsSet looks to be already handled by MT handling very well(?). usually has both ...
Its weird that there is only one long job. It should have multiple short jobs
winged valley
royal beacon
yes its lots of visibility checks, but that is already multithreaded, you can see the josb under it.
More worker threads would get it done faster
winged valley
royal beacon
also crULOC from netwT (network data handling?) might be worth a look for high p...
Its already multithreaded, as you can see by the jobs below it.
winged valley
royal beacon
we dont have anything set up in SPE tho. for A3 i can only see for animals or ot...
CBA XEH indeed adds AnimDone eventhandler to every unit, even if nothing uses them. I would love for that to be removed, but I don't know how they would do that without breaking XEH
winged valley
royal beacon
updating positions of attached objects. Lights on vehicles or flashlights on soldiers guns
But its weird that its only one thread, and for so very long too
winged valley
royal beacon
25 ms preloading(?) of a/multiple sound file(s) within reasonable limits (ogg/ws...
async file loading is not relevant though, its async.
But very weird there, the cLSAW checks water surface height, that should be extremely fast, how does that take 12 ms
Theres nothing I can do about file loading
 midnight jetty
winged valley
CBA XEH indeed adds AnimDone eventhandler to _every_ unit, even if nothing uses ...
midnight jetty
winged valley
CBA XEH indeed adds AnimDone eventhandler to _every_ unit, even if nothing uses ...
we could check in init I guess, and add it only to relevant units
would be quite a bit of a refactor tho
and all mods that added it manually to their classes would need to update
royal beacon
winged valley
cLVis (line intersects) can be multithreaded, if there are multiple calls to it....
see this from WLs: #perf_prof_branch message
 royal beacon
midnight jetty
and all mods that added it manually to their classes would need to update
royal beacon
midnight jetty
and all mods that added it manually to their classes would need to update
in what way/why? like XEH would add animDone as scripted EH instead - at init it would check if there is any class definition for that unit type making use of AnimDone
royal beacon
winged valley
But its weird that its only one thread, and for so very long too
always one thread for me in various scenarios. ie WLs:
 winged valley
royal beacon
winged valley
royal beacon
That was already multithreaded in v6, but temp disabled in v7
winged valley
royal beacon
That is also part of the things that I forgot to enable..
It has to split these into threadssafe and unsafe ones. And that splitting is off, so it does them all in one block
royal beacon
winged valley
updating positions of attached objects. Lights on vehicles or flashlights on sol...
shouldnt it be also mostly during nighttime? or is it the physical object/proxy?


pthAS while MT, it may be prolong the main thread worst case? (if this some pathfinding for AI)

possible to get more profiling subscopes in PhysObjs, so we might be able to learn why carX/tankX/planeX in some situation draw considerable more time?
something within simTr here? 4x cLRSu at the wheel collisions?


0.3 ms fsAPr - another file load? here not async tho
winged valley
royal beacon
shouldnt it be also mostly during nighttime? or is it the physical object/proxy?
the physical object.
Yes light sources might not matter much when they off, that could maybe be improved, not sure.
winged valley
royal beacon
pthAS while MT, it may be prolong the main thread worst case? (if this some path...
It doesn't, its completely async
winged valley
royal beacon
0.3 ms fsAPr - another file load? here not async tho
sometimes files are just needed immediately.
Like here something apparently needs to look up something in an animation
winged valley
royal beacon
something within simTr here? 4x cLRSu at the wheel collisions?
its weird that it takes so long for whatever cLRSu is.
Can be multi threaded probably, but the impact is going to be very small, considering it also adds overhead
royal beacon
new v8 impressions for DS

nothing specific here. SPE WLs again

once you have a couple of vehicles, PX makes a big chunk of it.
what is the left third PX3 vs right PX3 separation about?
if these can get MT, probably the one of the biggest wins for server (for missions with vehicles) [also still good for a client/SP]

154 vehicles then?
 winged valley
I hopefully turn on multithreaded px3 in v9
royal beacon
sample of a heavy hitter (Nashorn tank) - mainly simTr with cLRSu and simEaiF

otherwise EpeFR - i'd assume this is linked or actual the PX3 ones basically
winged valley
royal beacon
cLRSu, grabs road surface terrain height, I think highest roadway lod.
Weird that its so many in there
winged valley
royal beacon
That is waiting for previous frames px3
royal beacon
winged valley
cLRSu, grabs road surface terrain height, I think highest roadway lod.
Weird tha...
number of wheels? (tanks have 8-12 or so i believe)
winged valley
That is more than 12 tho, shown in the prof
with how many there are, MT would work there
its also a bit weird that they are so slow
royal beacon
class Wheels has 16 for nashorn
19 elements - 16 = 3 top remaining
sherman with 0.56 ms vs calliope with 0.08 - from the subscopes looks like crewed (with proxies) vs empty

 winged valley
Also is that nashorn standing on terrain, or in/on a building?
royal beacon
this is still WLs. so on terrain - i was US side tho. so didnt see it
moving to PZKW

main performance hog = tanks/vehicles = PX3
other simulation parts also heavy with ~10 ms each but PX does a good chunk more

 winged valley
Why is your tank so bad physx wise.
Why is it so much more complex than vanilla tanks?
royal beacon
i guess this is some stats. no clue what they mean
is one px3step one vehicle or could be multiple?
as for our PXs setup Instant and Kerc would need to be asked. AFAIK its based on A3 system and advised by reyhard


the MT for sound appears to work differently on the DS?

is the x/y for PX3 means it completed x of a total of y in one frame?
 winged valley
royal beacon
the MT for sound appears to work differently on the DS?
winged valley
royal beacon
the MT for sound appears to work differently on the DS?
Yes.
Async AI/sound are so it runs parallel to render, but DS has no render. so it doesn't make sense there
royal beacon
a detail view for px3step
winged valley
royal beacon
is the x/y for PX3 means it completed x of a total of y in one frame?
Either that is how many it needs to do in the frame.
Or it means so many physx vehicle, out of the total that exist, are simulated this frame
royal beacon


client perspective in PZKW
3 big wSimF and one big wSimR - probably also vehicle related. there is some infantry outside vehicles but not much.

px3initO still happens on the client (too probably) - at times it has subscopes (with low coverage), at times not


(when layer actives all the tanks)


one doesnt see the mouse cursor. maybe splitting sound on server to (more) workers may still be meaningful - or it kept them in the main thread for a reason?
winged valley
cannot split sound
royal beacon
left the DS on over night - apparently PZKW kept running even without players
Statistics manager took 10 ms
Statistics manager took 11 ms
Statistics manager took 6 ms
Statistics manager took 7 ms
Statistics manager took 8 ms
Statistics manager took 9 ms
are these new/useful to share?
Warn: 10.01 ms spent, NMT=Type_137
Warn: 10.01 ms spent, NMT=Type_98
Warn: 10.03 ms spent, NMT=Type_110
Warn: 10.04 ms spent, NMT=Type_110
Warn: 10.05 ms spent, NMT=Type_133
Warn: 10.07 ms spent, NMT=Type_110
Warn: 10.08 ms spent, NMT=Type_137
Warn: 10.09 ms spent, NMT=Type_137
Warn: 10.09 ms spent, NMT=Type_180
Warn: 10.10 ms spent, NMT=Type_110
Warn: 10.10 ms spent, NMT=Type_137
Warn: 10.11 ms spent, NMT=Type_110
Warn: 10.12 ms spent, NMT=Type_110
Warn: 10.12 ms spent, NMT=Type_136
Warn: 10.13 ms spent, NMT=Type_98
Warn: 10.14 ms spent, NMT=Type_110
Warn: 10.15 ms spent, NMT=Type_466
Warn: 10.17 ms spent, NMT=Type_137
Warn: 10.17 ms spent, NMT=Type_180
Warn: 10.17 ms spent, NMT=Type_467
Warn: 10.18 ms spent, NMT=Type_110
Warn: 10.20 ms spent, NMT=Type_110
Warn: 10.21 ms spent, NMT=Type_137
Warn: 10.22 ms spent, NMT=Type_110
Warn: 10.22 ms spent, NMT=Type_137
Warn: 10.28 ms spent, NMT=Type_266
Warn: 10.30 ms spent, NMT=Type_98
Warn: 10.32 ms spent, NMT=Type_110
Warn: 10.33 ms spent, NMT=Type_110
Warn: 10.34 ms spent, NMT=Type_468
Warn: 10.41 ms spent, NMT=Type_137
Warn: 10.50 ms spent, NMT=Type_110
Warn: 10.52 ms spent, NMT=Type_110
Warn: 10.53 ms spent, NMT=Type_92
Warn: 10.64 ms spent, NMT=Type_10
Warn: 10.71 ms spent, NMT=Type_466
Warn: 10.73 ms spent, NMT=Type_110
Warn: 10.76 ms spent, NMT=Type_110
Warn: 10.83 ms spent, NMT=Type_110
Warn: 10.84 ms spent, NMT=Type_110
Warn: 10.87 ms spent, NMT=Type_110
Warn: 10.92 ms spent, NMT=Type_266
Warn: 10.99 ms spent, NMT=Type_110
Warn: 11.03 ms spent, NMT=Type_110
Warn: 11.06 ms spent, NMT=Type_110
Warn: 11.15 ms spent, NMT=Type_137
Warn: 11.94 ms spent, NMT=Type_126
Warn: 12.28 ms spent, NMT=Type_132
Warn: 12.79 ms spent, NMT=Type_132
same with these
TimeLimiter, Category AITraceFireSector exceeded time limit, runtime 20004, limit 20000, denied requests 6
TimeLimiter, Category AITraceFireSector exceeded time limit, runtime 20008, limit 20000, denied requests 27
TimeLimiter, Category AITraceFireSector exceeded time limit, runtime 20626, limit 20000, denied requests 3
TimeLimiter, Category AITraceFireSector exceeded time limit, runtime 21295, limit 20000, denied requests 31
TimeLimiter, Category AITraceFireSector exceeded time limit, runtime 22358, limit 20000, denied requests 20
TimeLimiter, Category AITraceFireSector exceeded time limit, runtime 27272, limit 20000, denied requests 41
TimeLimiter, Category AITraceFireSector exceeded time limit, runtime 31214, limit 20000, denied requests 82
TimeLimiter, Category AITraceFireSector exceeded time limit, runtime 39557, limit 20000, denied requests 28
useful to profile anything related to these?
winged valley
No and no.
Though I thought I disabled the second one
Ah no the second one is something different.
royal beacon
PZKW with local DS
starting with the obvious (i think) - basically the client has to calc only his own tank (unless potentially other AI local to me with vehicles)


now to the server - from i understand it doesnt have enough to calc on the main thread, and thus pushes part of PX to the next frame - which then extends that duration
main parts are netwT (network stuff), wSimO, wSimR (its subscopes wSimE-wSimSV - aka vehicles - and wSimTrt-wSimSV - aka infantry and objects - and wSimF), waituSens (aka AI) - plus wsSet (proxies), waitSnd (sound) and visUA (visibility calcs I think) [all three already async)


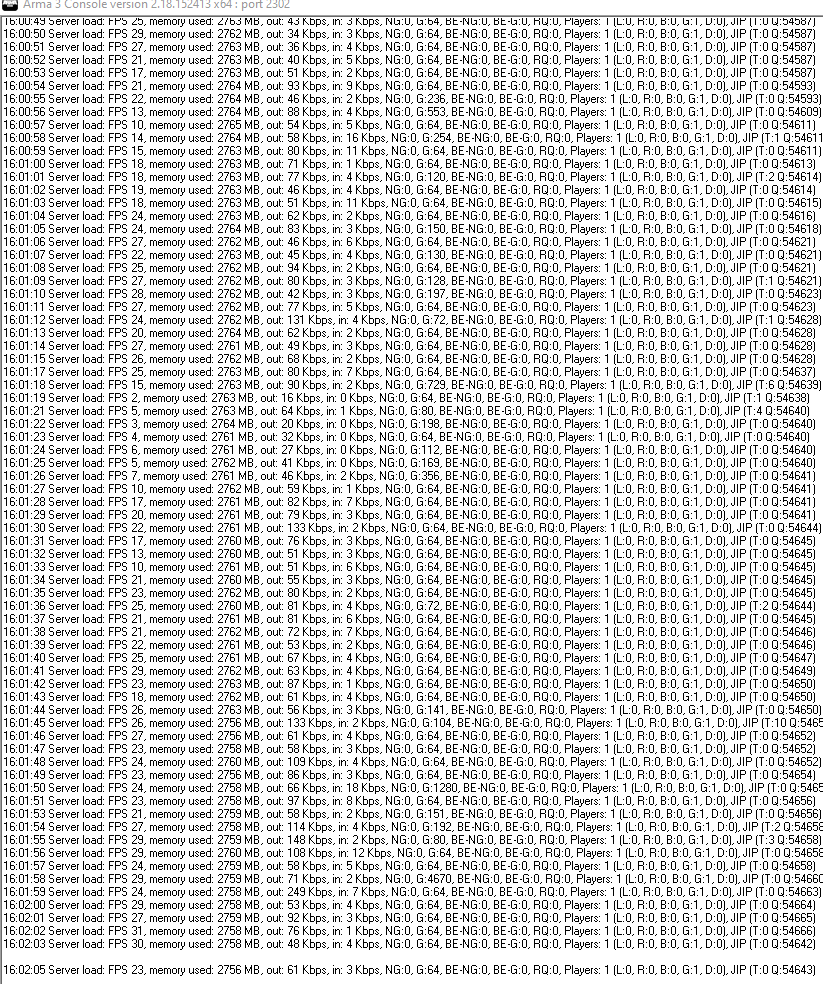
server is mostly between 20-30 fps, some dips 10-20 and a few 5-10
will try to check with tracy what these are about
royal beacon

SPE WLs on Normandy terrain

not doing well on advancing

will check later tonight how both WLs + PZKW performs on our real DS with modern CPU
royal beacon


our real DS is now bored with PZKW - mostly 45-50 fps

looking to be the same with WLs
royal beacon
cant get any real load on our DS with the SPE missions any more - PX done in MT has unblocked the frame computation
maybe with 50-100+ active vehicles it may still matter
now would be good get some server captures from very high player/AI population game modes
royal beacon
@opal estuary provided a few frame captures from high pop KOTH and Warlords
important to note is the server hardware is very fast, plus fpslimit is used - so it goes above the normal 50 cycles limit

WL Redux with ~100 players. 8,4 ms - so over 100 fps. should be 12 worker threads. in total 20 threads

with ~100 players much is network (left ~17% netwT with 1,4 ms) - nwSer is sending? vs nwCli receiving?

wSimA with 4,6 ms and subscope wSimR with 4 ms make roughly 50% - still very little given the player, AI(?) and vehicle count.
interestingly seems very low PX comps here. could be just the specific situation


wsSet with its async job (ie updAttPJ) with ~5% still noteworthy

waitSnd in the same range

finally cLVis at the end with its many jobs done in MT is still very significant computation wise - big improvement from being MT

in regards to non MT extra threads. big red one at the bottom seems also network stuff - maybe the sending? still easily enough time left while main thread does entity simulation

bottom right one is the PX3 async part. with 1 ms ~10%. if i get this right, only 1 of 161 vehicle type entities needed PX simulation? could be interesting how heavy vehicle use situations (20-40+ active cars-tanks-planes) look like with that hardware

last noteable item to me is the quite long cLVsS 1.8 ms task in the async thread at the top (the whole thread looks to be these tasks)
two more interesting observations:
- almost no AI computation (waituSens) - most AI local to players?
- almost all the threads in the middle are couit

a second capture from that session
main difference is the 4 job threads with aiMUp (with the cLVsS) essentially empty (vs one "full" with 3,5 ms, a second one with 0.9 ms and the remaining two "empty")
otherwise the frame composition is more or less the same
JIPqueue
main amount came from 13 entities
111 5:97
220 318:444
239 318:330
257 15:1191
442 145:1863
569 2:14396
584 2:153191000 30:732
1375 2:15070
1645 2:15306
1790 2:12840
2484 391:28
5921 391:1268
(would be handy to keep the naming schema at the "message per object" overview at the bottom like objects list has a the top: creator:283 networkId:17)
111 5:97
Type_96 creator:5 networkId:97 - owner Hi (62323dfe) - 222549d28800# 2199335: c_journalist.p3d B_Soldier_TL_F REMOTE220 318:444
Type_96 creator:318 networkId:444 - owner Panda (67a2756) - O Alpha 3-4:1 (Panda) REMOTE239 318:330
Type_96 creator:318 networkId:330 - owner Panda (67a2756) - 2225251d8000# 2252988: o_soldier_01.p3d O_Soldier_TL_F REMOTE257 15:1191
Type_96 creator:15 networkId:1191 - owner FeatherLight (1ba21008) - O Charlie 3-1:1 (FeatherLight) REMOTE442 145:1863
Type_96 creator:145 networkId:1863 - owner Arseniy Pushkoff (90a4ebc) - O Alpha 1-2:1 (Arseniy Pushkoff) REMOTE569 2:14396
Type_96 creator:2 networkId:14396 - owner VALAKI (3a15b0e6) - 222519af6800# 2290789: o_fullghillie_f.p3d O_Soldier_TL_F REMOTE584 2:15319
Type_96 creator:2 networkId:15319 - owner F.I.N.T (63d36c0a) - O Bravo 1-6:1 (F.I.N.T) REMOTE1000 30:732
Type_96 creator:30 networkId:732 - owner KILLA (7d86bde) - O Alpha 2-3:1 (KILLA) REMOTE1375 2:15070
Type_96 creator:2 networkId:15070 - owner Marvin (1985b8a6) - O Alpha 3-3:1 (Marvin) REMOTE1645 2:15306
Type_96 creator:2 networkId:15306 - owner Alligator (1eb3c3c) - O Bravo 3-6:1 (Alligator) REMOTE1790 2:12840
Type_96 creator:2 networkId:12840 - owner User (19368b27) - O Bravo 2-4:1 (User) REMOTE2484 391:28
Type_96 creator:391 networkId:28 - owner Elias (15a2ff28) - 222524839800# 2273071: o_soldier_01.p3d O_Soldier_TL_F REMOTE5921 391:1268
Type_96 creator:391 networkId:1268 - owner Elias (15a2ff28) - O Alpha 2-4:1 (Elias) REMOTE
curious if the high counts indicate some kind of abuse

KOTH with 95 players. 3,7 ms, so at ~270 fps.
probably mainly due to no AI, less vehicles and other entities
netwT with 0,8 ms, wSimA with 1,2 ms (very low), wsSet with 0,8 ms, waitSnd with 0,3 ms and visUA with 0,1 ms
i guess lots of vehicle use at the same time could bring down the server fps somewhat. beyond that would be interesting if anything else does


KOTH with 135 players. 6,8 ms (double to above rougly) - seems mainly due to more network computations
if i get this right, the nwSerSMT task in a thread doesnt get completed and finished in the next frame?
if so, could this lead/be related to the jitter/short desync Dwarden is seeing?
@opal estuary next need some low fps server captures from both 🙏 (below 20/10 fps - diag_captureSlowFrame ["sLoop", 0.05, 0, true, 100]; executed on the server)
royal beacon


52 players WLs (non redux) with 10 ms
4,6 ms of that is waituSen/AI - with three ~3ms pthAS in threads
vs two other later captures of the same session having just 0.02 ms for waituSens/AI (total at 6,1 and 7,4) - seems strange
royal beacon

11 ms with 120 players KOTH. from @opal estuary


nwSerWait with 4,8 ms with the SendMessagesThread with (4,8 ms) - mostly from msgSn of 4,2 ms
nwSer with 1,9 ms, and async netSSM with 2,5 ms


other main scopes are also rather small here (general simulation, AI, sound, etc)
would be interesting to see this player number scope with weaker server hardware - seemingly the network send/receive/sync could be main limiting factor
Total objects: 292
Statistics objects: 292IsLocal: 108
IsMarkedToDelete: 0
IsDestroyed: 24
IsDamageDestroyed: 37
IsDamageDead: 37
IsSimulated: 228
IsInvisible: 20
IsAnyPlayer: 103
IsOutsideMap: 4
curious how the 103 anyplayer vs the suggested 120 count from Dwarden comes from (still in lobby, dead without a body?)
 opal estuary
royal beacon
11 ms with 120 players KOTH. from <@94784638945337344>
opal estuary
royal beacon
11 ms with 120 players KOTH. from <@94784638945337344>
KOTH, no AI
royal beacon
surprising to me how few vehicles were in use
opal estuary
royal beacon
surprising to me how few vehicles were in use
vehicles are expensive so not everyone buys them and die fast (action packed game), i will fix that soon
royal beacon

new jip worker i believe - to be seen how that looks for REDUX/WL with high player count
royal beacon
another capture provided by @opal estuary - KOTH with 100 players running at 200 fps (5 ms for total)


nwSer has only a 28% coverage. the big white block at the end mainly
(if cLXXX is always collision) as best as i can tell from previous frame captures, collision checks/computation seems to be among the most expensive low level scopes


wSimSV often has very limited coverage for its "2nd half" - just contains a bunch of cLGSL with 0 ms
if possible the updAttPJ is probably among the best candidates for optimization of some form - for both client and server. the MT job isnt helping that much


as mentioned before curious to see if the async netSSM turns out to be a fps limiting factor for weaker servers with high player count


forgot the other big thread from wsSet - updAttPJ. is the other actual a subjob of this?
 royal beacon
parWorldSimulate_plus_Sound is split into 14 jobs (0.1 ms each) over 8 threads (+ main)

waitSnd has its one subjob - if either wPsn1 could be split into multiple job sets or wPsn1 and wPsn2 run in parallel (wPsn 3 seems usually low) - this would be another one relevant for both client and server. but depends if you can run sound jobs/tasks in parallel in the first place
wPsn2 has usually also near 0% coverage. so impossible to judge what it does
last one for now with just general overview - WLs with 54 players running at ~100 fps (9,5 ms)

main difference is more unit+vehicle(+object?) simulation and less network
royal beacon
Warn: 738.66 ms spent, NMT=Type_126
Warn: 197.95 ms spent, NMT=Type_126
Warn: 147.91 ms spent, NMT=Type_114
Warn: 117.14 ms spent, NMT=Type_5
Warn: 113.09 ms spent, NMT=Type_5
Warn: 112.86 ms spent, NMT=Type_5
Warn: 109.02 ms spent, NMT=Type_5
Warn: 105.57 ms spent, NMT=Type_5
Warn: 103.78 ms spent, NMT=Type_114
Warn: 103.17 ms spent, NMT=Type_5
Warn: 102.86 ms spent, NMT=Type_5Warn: 99.06 ms spent, NMT=Type_5
Warn: 96.41 ms spent, NMT=Type_98
Warn: 86.45 ms spent, NMT=Type_114
Warn: 83.29 ms spent, NMT=Type_120
Warn: 80.48 ms spent, NMT=Type_114
Warn: 58.46 ms spent, NMT=Type_114
Warn: 54.80 ms spent, NMT=Type_114Warn: 47.60 ms spent, NMT=Type_126
Warn: 44.63 ms spent, NMT=Type_114
Warn: 43.09 ms spent, NMT=Type_114
Warn: 40.64 ms spent, NMT=Type_5
Warn: 40.08 ms spent, NMT=Type_114
Warn: 38.94 ms spent, NMT=Type_98
Warn: 37.95 ms spent, NMT=Type_98
Warn: 37.55 ms spent, NMT=Type_114
Warn: 36.27 ms spent, NMT=Type_133
Warn: 32.91 ms spent, NMT=Type_114
Warn: 31.86 ms spent, NMT=Type_114
Warn: 28.96 ms spent, NMT=Type_5
Warn: 28.22 ms spent, NMT=Type_133
Warn: 26.94 ms spent, NMT=Type_126
Warn: 26.87 ms spent, NMT=Type_5
Warn: 26.55 ms spent, NMT=Type_98
Warn: 26.11 ms spent, NMT=Type_133
Warn: 25.59 ms spent, NMT=Type_466
Warn: 25.51 ms spent, NMT=Type_133
Warn: 24.93 ms spent, NMT=Type_466
Warn: 24.73 ms spent, NMT=Type_5
Warn: 24.45 ms spent, NMT=Type_5
Warn: 23.91 ms spent, NMT=Type_466
Warn: 23.05 ms spent, NMT=Type_120
Warn: 22.55 ms spent, NMT=Type_160, NetworkCommand: 34
Warn: 21.82 ms spent, NMT=Type_126
Warn: 20.73 ms spent, NMT=Type_98
(+ more between 20-10 ms in rpt from Dimon)
doesnt appear in my logs any more 🤔
Original output filename: Arma3RetailProfile_Server_x64
Exe timestamp: 2024/11/21 12:15:02
Current time: 2024/11/24 15:10:37Type: Public
Build: Profile
Version: 2.18.152434
but he also has:
2019 15:23:02 Server can't keep up, too many incoming network messages. Remaining in queue: 17
2060 15:23:08 Server can't keep up, too many incoming network messages. Remaining in queue: 32
2075 15:23:14 Server can't keep up, too many incoming network messages. Remaining in queue: 6
2142 15:23:27 Server can't keep up, too many incoming network messages. Remaining in queue: 60
2529 15:59:05 Server can't keep up, too many incoming network messages. Remaining in queue: 94
2546 15:59:24 Server can't keep up, too many incoming network messages. Remaining in queue: 12
2938 16:44:35 Server can't keep up, too many incoming network messages. Remaining in queue: 110
3256 17:00:08 Server can't keep up, too many incoming network messages. Remaining in queue: 9
4004 17:21:05 Server can't keep up, too many incoming network messages. Remaining in queue: 114
4069 17:22:58 Server can't keep up, too many incoming network messages. Remaining in queue: 413
4224 17:29:04 Server can't keep up, too many incoming network messages. Remaining in queue: 110
4372 17:31:13 Server can't keep up, too many incoming network messages. Remaining in queue: 204
4399 17:31:33 Server can't keep up, too many incoming network messages. Remaining in queue: 185
 mint frigate
royal beacon
> 2019 15:23:02 Server can't keep up, too many incoming network messages. Remain...
mint frigate
royal beacon
> 2019 15:23:02 Server can't keep up, too many incoming network messages. Remain...
Hi, have you found the origin of these messages?
opal estuary
to figure which ones are causing it, one must loog on the network messages diag , you can then sort of 'figure it out' for the interval values
royal beacon
i have no means to do that. for one as best as i can tell, it requires more logging/narrowing down the source
in addition it could have different reasons/sources from what i understand - engine problem (with MT changes or "anything else"), bad network settings (basic.cfg), server not powerful enough, poor scripting, etc
-networkDiagInterval=1 (or higher value - per second) may provide more insights with that. maybe also #logEntities and #exportJIPqueue https://community.bistudio.com/wiki/Multiplayer_Server_Commands#Performance_Profiling
maybe also #captureframe or #captureSlowFrame sLoop 0.3 0 1
mint frigate
I tried the -networkDiagInterval=1 as well as #logEntities, #captureframe, and also the ArmaScriptProfiler, but I can't see the issue. However, the #exportJIPqueue command doesn't seem to work since I get no feedback in my .rpt files. Yet, I still see the message: Server can't keep up, too many incoming network messages.
Here are my logs; if you notice anything unusual, I'm all ears...
CaptureFrame : https://pastebin.com/LUzB7wgz
RPT Client : https://pastebin.com/HLKTFHB5
logEntities part1 : https://pastebin.com/s5ZWHqaY
logEntities part2 :https://pastebin.com/TK2uRssk

 royal beacon
@mint frigate thanks. a few notes:
- captureframe seems from the client and not the server, right?
- exportJIPqueue and networkDiagInterval should create log files named accordingly in the rpt folder
- is the tracy image from a moment of
Server can't keep up, too many incoming network messages- doesnt look like it? - the rpt doesnt contain it either. so didnt happen in that session?
- what is the console screenshot about? doesnt look like from a problematic moment
mint frigate
royal beacon
<@199608934292520961> thanks. a few notes:
1. captureframe seems from the client...
I can't launch captureframe on my server or exportJIPbecause I have no return log.
My point is indeed, I don't see anything special in the set of logs yet on my server logs I do have at times the server can't keep up and players have desynch and latency
I didn't say anything, I didn't look in the right place for the logs ...
mint frigate
royal beacon
<@199608934292520961> thanks. a few notes:
1. captureframe seems from the client...
With the actual log from my server
21:08:19 Server can't keep up, too many incoming network messages. Remaining in queue: 2
21:08:19 In last 5000 miliseconds was lost another 1 these messages.
21:08:49 Server can't keep up, too many incoming network messages. Remaining in queue: 8
21:08:49 In last 5000 miliseconds was lost another 1 these messages.
21:08:55 Server can't keep up, too many incoming network messages. Remaining in queue: 11
21:09:51 -- LogEntities saved to file logEntities_241063_03-12-2024_21-09-51.log --
21:10:02 Server can't keep up, too many incoming network messages. Remaining in queue: 3
21:10:44 Server can't keep up, too many incoming network messages. Remaining in queue: 7
21:11:20 Server can't keep up, too many incoming network messages. Remaining in queue: 7
After the #captureSlowFrame sLoop 0.03 0 1
_initMessages - Total: 7653
Type_330 : 2
Type_405 : 16
Type_60 : 169
Type_360 : 1457
Type_331 : 2
Type_346 : 3
Type_391 : 15
Type_451 : 2
Type_62 : 1
Type_364 : 1322
Type_64 : 1142
Type_349 : 1
Type_65 : 46
Type_291 : 1579
Type_187 : 21
Type_53 : 778
Type_248 : 18
Type_294 : 2
Type_54 : 13
Type_10 : 274
Type_385 : 18
Type_70 : 362
Type_328 : 2
Type_329 : 215
Type_59 : 193
_initMessagesRE - Total: 130456
Type_380 : 130456
With the basic.cfg :
MinBandwidth=10485760;
MaxBandwidth=104857600;
MaxMsgSend = 768;
MaxSizeGuaranteed = 800;
MaxSizeNonguaranteed = 400;
MinErrorToSend = 0.004;
MinErrorToSendNear=0.04;
opal estuary
mint frigate
With the basic.cfg :
MinBandwidth=10485760;
MaxBandwidth=104857600;
MaxMsgSend ...
try decrease maxMagSend to 512 or 384
mint frigate
Thanks, I'll give it a try
mint frigate
It's not working I keep having the same message even if no one is on the server ...
royal beacon
without more info (aka the logs), nothing can be done here
royal beacon
for reference how the captures look like @fiery oracle
CaptureFrame issues
Server overwhelmed by incoming messages. In this case deleting objects?
Like, thousands of objects being deleted? But something is weird. Each of these deletions should go into JIP queue, except if the object that is being deleted doesn't exist or is already gone.
But you have the async JIP queue here, and its idle, there is nothing being processed by it. So.. overwhelmed by deleting objects that.. are already deleted?Also the server during that framedrop, processed 98.2ms of network messages.
The hard time limit for "server can't keep up" is 100ms, it might've been hit but there is no RPT theresecond captureFrame is exporting jip queue, done via script command which ended up needing 75ms
Next one.. uh... Server is spending 245ms processing messages
But one of them is sending mission file to a joining player. Most of the time splitting the mission file in segments.
from <#perf_prof_branch message>


 fiery oracle
royal beacon
for reference how the captures look like <@226159903356616705>
> CaptureFrame ...
fiery oracle
royal beacon
for reference how the captures look like <@226159903356616705>
> CaptureFrame ...
I had them open in https://ui.perfetto.dev/, but didn't really think to check them in-game. Most of the values I could see didn't mean a lot to me, like onSMF_2_2
royal beacon
@fiery oracle yeah the low level scopes are usually impossible to guess. still you can see the server stalling from the network message handling (either receiving or sending)
fiery oracle
royal beacon
<@226159903356616705> yeah the low level scopes are usually impossible to guess....
Yeah that was my best guess on a few of them judging from the amount of desync going on at the time. Wasn't always dropping like that with the desync though, so ¯_(ツ)_/¯.
I'm just glad I have something to go on now though, as I was 100% in the dark on even what to look for. Our mission file has ~1000 files, being SQF, hpp, etc, so I was dreading trying to look into it. 99% chance I would never have even thought to look at radioChannel systems
royal beacon
as Dedmen said also getting a mpMessageDetailsServer log with data, could potentialy highlight other (sqf network) coding problems.
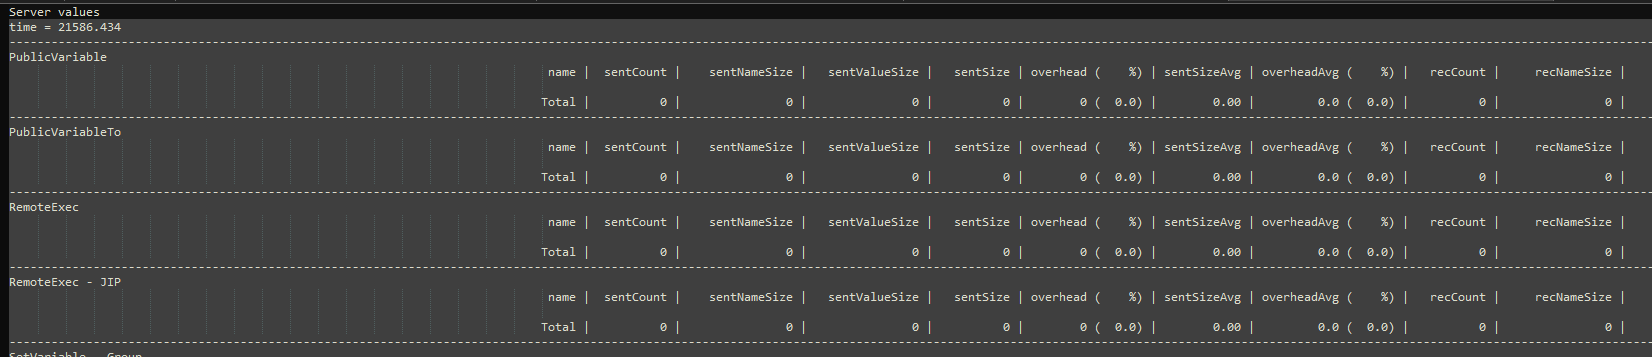
mpMessageDetailsServer is still a mystery to me tho. at times it contains nothing basically or just no data; it seemed to require -networkDiagInterval to work; but as you set it, and still have no data, its puzzling
fiery oracle
I'm confident in debugging so long as I have some type of info to go off of, but I did notice that its sometimes completely empty, even with the networkDiag as you said
royal beacon
here is a working sample



 fiery oracle
Small update to the server network issues I was having;
As per the Feedback Tracker issue (#arma3_feedback_tracker message) 90% of our issue seemed to be local spawned NPC objects. Switched them all to signs temporarily, and it solved the majority of our issue.
There's still a bit of desync/server fps drops when people join, but its bearable as its just small spikes here and there at 150-155 people.
I appreciate everything you guys do for Arma and its servers, thank you.
 vernal root
im not sure what im seeing here^^


what is waituSens!?

sry for posting this in observations server instead of observations client, my fault
royal beacon
vernal root
im not sure what im seeing here^^
looks like some scope not getting closed properly
royal beacon
vernal root
should be the sync scope for the async AI thread - aka it waits in the main thread until the AI thread is complete