
1 messages · Page 1 of 1 (latest)
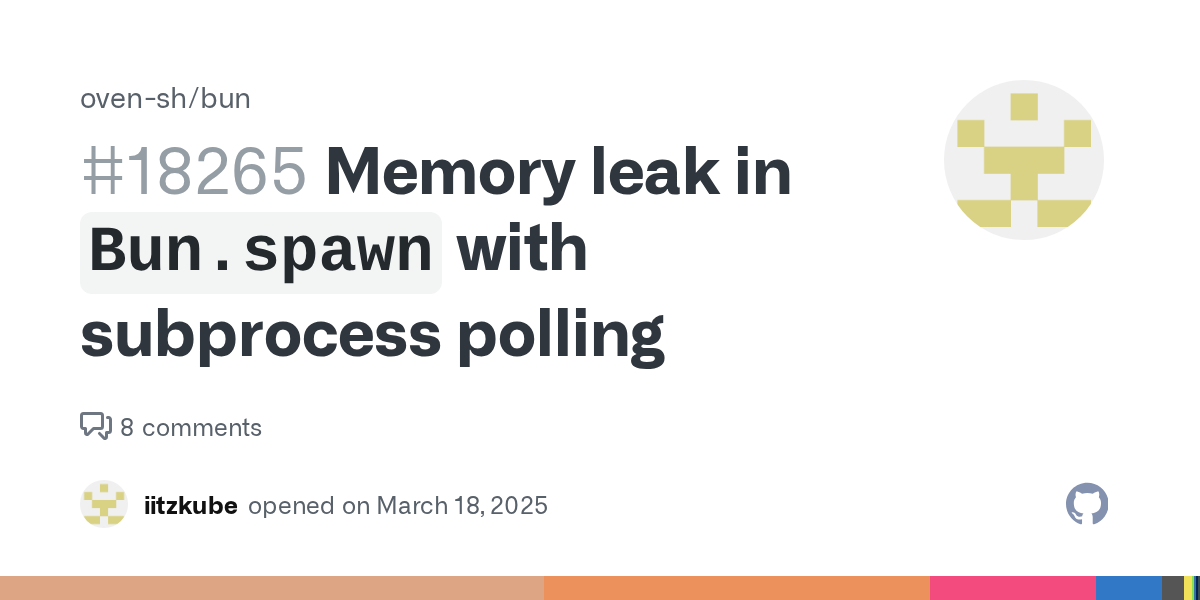
update: opened an issue on gh with a lot more details https://github.com/oven-sh/bun/issues/18265
I have been noticing an unusual increase in memory consumption with my app and I can't figure out if it's my code. Last night I started measuring process.memoryUsage() and this screenshot is how it went overnight. The app is stale and not doing anything really... that's on purpose to see how that would affect memory.
It's really hard to figure out what's going on because it starts out okay and you can see GC happening every now and then, but then suddenly few hours later GC just gives up. Again, the app is not doing anything for the entirety of this period.
I don't have any dependencies. I even removed most of the functionality to see if that would make a difference but it didn't. I tried --inspect but it hasn't been helpful as there isn't an immediate increase, it takes hours for this to happen. Any tips on how to get to the bottom of this? I need to know where/what to look for... has anyone had luck dealing with this stuff?
What version of Bun is running? 1.2.6-canary.74+74768449b What platform is your computer? Linux 6.1.62 x86_64 / Darwin 24.3.0 arm64 What steps can reproduce the bug? I have been noticing an unusual...
Here's a close up look at the first few hours before the usage increases for no apparent reason (the heap total is growing steadily though, is this normal?)

Then ~12 hours later this happens! The app didn't restart or crash it's still alive. If it hadn't drop at all I would think maybe it's my code, but because it eventually did i don't think that's the case

TBH, I experience similar behavior in more complex app, but without any Bun.spawn.
After my app reached some point of memory usage: the CPU went up high but it looks like GC is unable to set free any memory 🤔
My app is way more complicated, to just post it here... I'm waiting for the results of your problem... Maybe it will be somehow connected
I feel you! my app is somewhat complex but luckily i didn't have any dependencies so I knew it was either my code or something else in the runtime. It took me about a week of just debugging and profiling every code path in my codebase separately (and a lot of patience 😅 ) until i was able to narrow it down to Bun.spawn. It was a lot of work so hopefully it will be worth it haha.
btw, Jarred might have hinted yesterday that this could be related to the stdio streams (that's my interpretation at least) because when i disabled them everything was normal, so I wonder if it's just an issue with streams in general.
Hopefully he will find something 🙂
BTW: did you find any practical way of profiling? Profiler via bun web always hangs for me if I try to record sth like 5s of my app during request...
Probably the app is too big for profiling 🤔
I haven't had that exact problem, but bun's web inspector kept crashing whenever i hover over things, so i couldn't reliably use it. What i ended up doing is only record a snapshot, then export it and import back in Safari's devtools which was very stable in comparison, but the downside is you lose references to your code (no "source maps"/"stack trace" so to speak).
Also, another thing that was very helpful is to generate v8 heap snapshots from within your code (you can also it via the the web inspector console too - see option 2) and then use Chrome's devtools to import them. Keep in mind, this is just heap snapshots, not a memory timeline, but you can still compare two snapshots in Chrome devtools which is really nice.
// Option 1:

import { writeHeapSnapshot } from 'node:v8';

writeHeapSnapshot() // optionally, set a path to the output file

// Option 2 (you can call this from the bun's webinspector console):

Bun.write('path/to/file.heapsnapshot', Bun.generateHeapSnapshot('v8'))
https://nodejs.org/api/v8.html#v8writeheapsnapshotfilenameoptions
https://bun.sh/guides/runtime/heap-snapshot
tbh, memory profiling for this specific issue didn't help much but what I described above has definitely helped me catch memory leaks in my code in the past.
And lastly, for this specific issue, i had prometheus reading process.memoryUsage() every 5 seconds.
Lot's of advices 🙂 Thank you so much 🙂
Seems like some progress was made: https://github.com/oven-sh/bun/pull/18316
I'm going to verify my app asap the nightly comes out

What does this PR do?
Closes #18265
Fixes a memory leak in Bun.spawn when stdout or stderr were set to "pipe".
When spawned, we were creating a Readable with a buffered reader. Wh...
fyi, the latest canary has these changes now https://github.com/oven-sh/bun/releases/tag/canary
I'm going to give it a try!
Hi! I'm working with @fringe crown on the same project. I would put fresh light of what I've already noticed.
Possible points what I want to ivestigate what may cause Memleak on our application for today are:
Buffer (concatenation)
File access via 3rd party ffi (tailwindcss & lightnighcss)
React 18.3 renderToPipeableStream
This situation is bothering us only on x64 platform, locally tested on docker arm64 (Macbook M1 Pro) preassures the memory, but never spins the cpu by HeapHelper like that
We are going to build a healthcheck that checks if cpu is throttled in relatetion to throughput we handle. But first, we want to check if the problem occurs when we use alpine distro with bun
unfortunately alpine distros didn't helped, so the memory leak seems to be somewhere in Bun itself. Haven't found yeat 1.2.6 or even 1.2.7, will do next week probably.
yeah it's pretty bad tbh, it's def in Bun itself... after they merged the memleak fix i kept that test script i posted on my gh issue running for 2 days on a debian bookworm distro and it reached 1.2 GB, let alone a large app. I'm also noticing a very high memory usage locally on macos whenever i use the HMR devserver for a minimal react+tailwind app, it quickly reaches >2.5 GB within a couple of hours 😕 i'll probably post something about it in #bake
One thing that I can add, which seems to be important @scarlet cairn :
Our case originally has 1 req / 1s. New app based on bun start from 5% of that, now it's 75% of that traffic and the memory seems to grow in exactly the same timing 🤔
@fringe crown that's true, but for the bun defend, it has to be somehow consistent, for example our test instance does not grow same as production, where the main difference is traffic
Facing a similar issue. Didn't notice any problems in dev but reached an OOM error in prod after two days. It's a small site built with React Router v7 and Elysia (+ the bridging package elysia-react-router). No database, just reading some Markdown files using the Bun I/O API and fetch requests to other web APIs. It's running in k8s on Bun 1.2.5 with the alpine image.
No clue what is causing it or how to even debug it. If there's anything else I can contribute to this thread to help resolve the issue, please @ ping me. I'll probably switch to the Node runtime until it's resolved.
@naive kettle what specific I/O APIs are in use
Mainly reading (Bun.file()), checking if they exist (using .exists() method) and outputting them as a string (using .text() method). For example, I would do:
const filePath = path.join(import.meta.dirname, 'content', `${name}.md`);
const contentFile = Bun.file(filePath);
if (!(await contentFile.exists())) {
  throw new Error(`File '${myPath}' doesn't exist.`);
}

return await contentFile.text();
ah, doubt the leak is there - we have tests for that
@scarlet cairn for me, the most frustrating behaviour is a significant CPU usage when idle on swollen bun (where the almost all accessible memory is in use). It's due to internal HeapAnalyzer threads, that are trying to release memory. Maybe this would give a clue what may causes the issues, but definitely it'll not resolve the memory leak itself. Today we'll test bun 1.2.8 against the memory leak.
Added: The situation causes our HPA (Horizontal Pod Autoscaler) to add more instances cause it looks like a traffic is that heavy that we should add more instances.
Deployed yesterday with the latest 1.2.8 release, the memory leak is still there for me.
Well, it is the same for us too... The "thing" with CPU looks like on the screenshot below. At some point in time, when the memory increased - the CPU goes up high. Memory is not lowered and the CPU stays high. Eventually, after some time: all pods reach the "trigger" amount of memory and CPU's one by one goes up. The screenshot is made for 1.2.8
Time: 17:25 shows the first critical moment.

Ended up switching to Node, changed Elysia with Hono together with the bridging React Router package because the Elysia one was using Bun specific code (elysia-react-router -> react-router-hono-server), swapped out the Bun file calls with Node fs and in the entry.server.tsx file (used by React Router), I'm now using renderToPipeableStream from react-dom/server instead of renderToReadableStream from react-dom/server.bun. All other code is the same as previously deployed. And now the memory usage is stable with Node.
I tried using renderToReadableStream from react-dom/server.browser yesterday instead but the result was still the same. I'll keep runing it on Node for now until a fix is available. Happy to test canary versions or help with further debugging if needed, just ping me 🙂
I migrated a large app to bun in order to easily use a mixed ts / js repo while we migrate to ts
The memory leaks with files are killing us
Moving back to node is tempting but I am hopeful the bun team can fix...
For context: we are constantly at 30 pods even when theres little traffic due to huge ram usage. This never happened with node 🙃
The newest Node version can run TS natively with some caveats (like doesn't use tsconfig files): https://nodejs.org/en/learn/typescript/run-natively
Not sure if it works for your use case and how many Bun APIs you're using, but might be worth looking into if it's a big issue. Since I moved to Node earlier today, memory usage is stable, k8s isn't going crazy and the alerting is quiet. It was fairly painless as the app is pretty new and small. There's a handy docker image with Bun and Node, allowing you to still use Bun as a package manager so you can keep your lockfile intact and use the Node runtime: https://github.com/ImBIOS/bun-node
I'm going to add that even development with the fullstack server makes my computer sluggish after a few hours of work, and that's for a very small react app!
For example, this is the memory usage after about 100 saves/reloads (x113 hot reloads to be precise) for a clean slate react app (literally the entire thing is just App.tsx with tailwind, a few radix-ui components, and tanstack/react-query).
Vite on the other hand hovers around 80–100mb.
I am also hopeful the bun team can address these issues soon...

cc @lapis flicker
dev server currently doesn't release memory source map information because it needs to hold it as long as any tab is open, including any reachable hot updates.
if we used inline source maps would we be able to avoid that?
(since devtools will usually be able to read the original sources)
the server needs to read them
unless the logic for the error overlay can be ported to run entirely in the client. this would have to be able to extract, parse, and lookup the source map in the browser
This might help https://bun.sh/blog/debugging-memory-leaks

Use v8 heap snapshot API + Chrome DevTools to compare heap snapshots
I'll give it a try 🤞
Well, I'm looking at initial snapshots from test enviro and I can see:

however next snapshot shows that it is able to handle some of those:


when the traffic is low - looks like GC is able to handle such increases quite well 🤔
That looks more Ike high memory usage than a leak. Leaks go up without going down
Exactly, and the same application(build as docker image) deployed to production shows memory constantly goes up without going down: #1350929796477222973 message
The difference is: on production there is no "rest time" - traffic is permanent above some level
As I mentioned before: looks like the CPU works hard to free some memory, but (maybe because of high traffic and constant allocating memory during new requests) it fails, so memory is constantly rising and the CPU goes weird as well...
Actually there is a lot of empty (?) strings 🤔 There is no "one big" string or something, but a lot of small ones 🤔


Does Bun support flags similar to those from v8? https://nodejs.org/en/learn/diagnostics/memory/using-gc-traces
Node.js® is a JavaScript runtime built on Chrome's V8 JavaScript engine.
has this been resolved?
Seems like it is still in progress: https://github.com/oven-sh/bun/issues/17723#issuecomment-2800213733

I'm working on a branch to move from node to bun as our runtime. The docker container builds successfully, and on the surface the service seems to run without any errors. However, we're see...
try 1.2.10 im seeing improvements
will do 🙂
Nope... memory still rising...
rising vs leaking?
this is the difference in mine top vs bottom

Actually, no difference to that: #1350929796477222973 message
😭
this measures as a ~40% memory reduction locally: https://github.com/oven-sh/bun/commit/32c1dcb70d8e997187ac8182bb90cea767e05471
there's still another PR coming that should be a bigger reduction
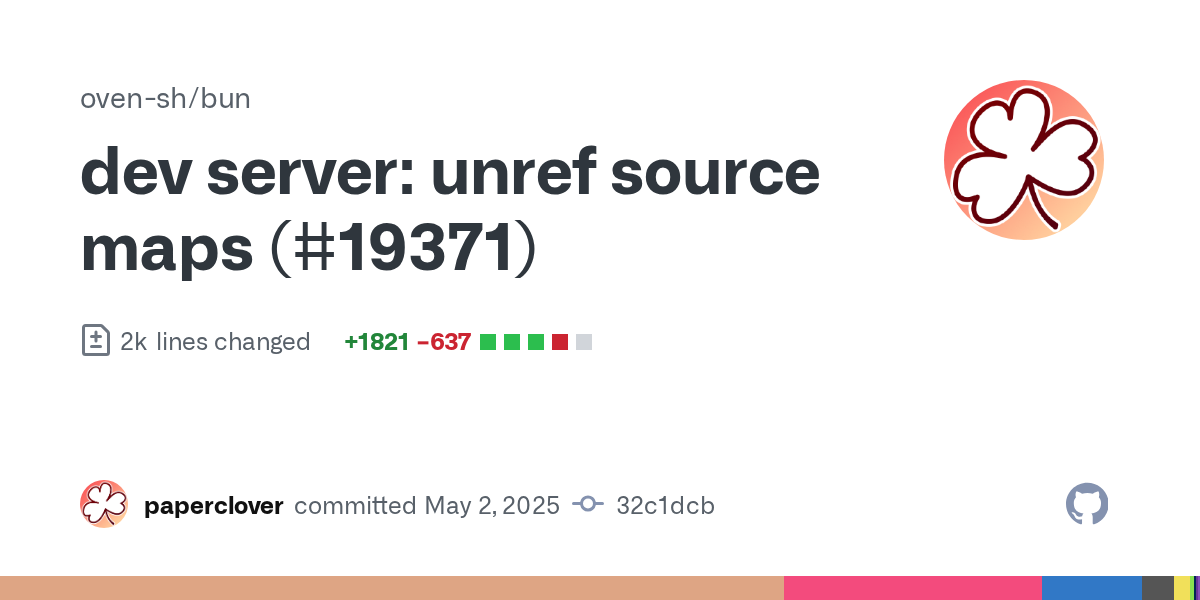
Co-authored-by: Jarred Sumner
Co-authored-by: graphite-app[bot] <96075541+graphite-app[bot]@users.noreply.github.com>
shouldnt something like this be top priority
this measures as a ~40% memory reduction locally
TBH I would rather use more memory, but constantly rather than have low usage which continuously grows 🤔
We developed an ugly workaround to just restart k8s pods whenever they reach certain level of memory usage - but it is still an issue.
@scarlet cairn do yo need more specific feedback for this? How can we be more helpful? This PR: https://github.com/oven-sh/WebKit/pull/84 looks some kind of freeze. So, I'm not sure, is there something that we (as users) can do?

This makes GC trigger based on allocation rate (which is updated on every allocation) more than relying on timers (which are infrequently run)
This makes it so we can delete our GarbageCollectionC...
We're seeing the same issue and ended up using the same solution for now (restarting pods on a schedule). 🙏
Our app in prod saw a reduction in ram going to 1.2.10 but our api services that aren't updated for a week at a time went back to the same old
So we also need to restart on a schedule...

our api servers use websockets a lot so maybe its that...
We run our NestJS server in a k8s environment. We have a lot of memory leaks in a specific server, so we restart it regularly. That server communicates a lot with external servers (fetch, axios).
Makes sense, with some testing some time ago Bun.serve websockets can just get high and not go down (maybe when connections close it doesn't indeed free that data)
this is what overnight looks like with only a health check being hit...

im finally starting to dig into this because its really killing my costing
i have an express app with NO middleware between app and healthcheck
i hit it 1k times and here are the areas blowing up
Headers: 2,680 (+2,401, +860% increase!)
NodeHTTPResponse: 2,675 (+2,401, +876% increase!)
Arguments: 2,754 (+2,407, +693% increase!)

What version of Bun is running? 1.2.14 What platform is your computer? Darwin 24.5.0 arm64 arm What steps can reproduce the bug? Demo repository Use the test scripts to show the growth of objects a...
At what point did bun start doing this version wise?
ive had leaks since i started at the 1.2.2 announcement
some were resolved with file uploads in 1.2.10 but this remains in latest
So before the rewrite of node:http in 1.2.5?
Curious if you run things with the last 1.1.x version and get same or different results
I'm unable to check that on prod :/ Not sure which, but some v=older version fixes important things - so if I go below it - production app will fail. I can''t allow that :/
Yeah 1.1 is a non starter for my prod app too
Oh, I didn’t mean for production, I meant for your test harness. Would be great to know if there is a specific version that introduced this behavior.
I’ll see if I can try tonight.
BTW: I saw some stuff for web sockets. Is that required to cause the issue in the test harness?
Actually, I'm unable to reproduce this on my test instances 🤔
My app does not use "bare" web sockets, only express + react stream rendering
Alpine does not work:
#10 [6/7] RUN bun install
#10 0.103 Error loading shared library libstdc++.so.6: No such file or directory (needed by /root/.bun/bin/bun)
#10 0.103 Error loading shared library libgcc_s.so.1: No such file or directory (needed by /root/.bun/bin/bun)
#10 0.103 Error relocating /root/.bun/bin/bun: _ZSt20__throw_length_errorPKc: symbol not found
#10 0.103 Error relocating /root/.bun/bin/bun: __cxa_thread_atexit: symbol not found
#10 0.103 Error relocating /root/.bun/bin/bun: _ZSt9terminatev: symbol not found
#10 0.103 Error relocating /root/.bun/bin/bun: _ZNSt18condition_variable4waitERSt11unique_lockISt5mutexE: symbol not found
#10 0.103 Error relocating /root/.bun/bin/bun: _ZdlPvm: symbol not found
#10 0.103 Error relocating /root/.bun/bin/bun: _ZSt13set_terminatePFvvE: symbol not found
alpine needs libstdc++ installed (node does too), it's something like apk add libstdc++ libgcc
that did it
I don't see the 8000% numbers in any of the cases though
I see some moderate things, but they went away when I added:
setInterval(() => Bun.gc(true), 1_000); // Every 1 seconds
I see websocket code in there that is not utilized, so wondering if what was published was only part of it
going to have some good news for this thread
TLDR: bun upgrade --canary and give it ago. it probably won't help with websockets. but it will help with reading from streaming files. and with spawned processes. and maybe file uploads in certain cases.
Over 12 hours on Bun 1.2.16-canary.57+ce8767cdc - Leak with bun spawn has definitely been resolved.
I'm gonna try 63+390798c17 now
63 should be a little bit better than 57
For me its the same, but i'm really glad process doesn't have to be restarted every hour for OOM errors anymore.
can anyone tell when i migrated my project back to node? 😭
hope to be back to bun soon 🙏

so you don't recommend using websocket with bun at this moment?
also is the issue with bun ? or bun + docker?
bun docker
my app is an api server
50% rest calls
45% ws
5% file upload
1.2.16 will be good
Tested for a short period of time, but it doesn’t seem to help much:

I'll be back after next couple of hours
Just for clarity: in my case, there are no problems with Bun.spawn, must be sth else then...
aww man
im under so much fire
ive costed my company thousands of dollars over the past couple months moving to bun 😭
was hoping this was it
but until today you saved them millions
lol how restarting your pods every hours cost thousands ?
we cant restart during peak hours - we get pinned at 40 high resource pods
someone else is doing the regular restarts
Generally speaking we are restarting pods, but steel: it is more like a workaround... Sth rather not suitable for prod ready runtime. I understand: Bun is young, but still, sth that needs to be fixed 🤞
Chart update:

Slowly, but rising 🤔
So it’s no better for you in 1.2.16?
This change will have to go through qa team etc
I can maybe test on a dev instance though
Currently working on some high priority features though
But I can give a response next week either way
For us, it's 100% production 🙂 SSR react 🙂
for us to help you, we need a way to reproduce the issue
So probably the repository on GH with the simplest setup will be fine?
Actually I am attached to an already existing one to not duplicate issues. But when I made a repo to reproduce - I could create a separate issue.
You have uncapped loop somewhere in code? I had this problem and it turned out to be my case. Throttle all while, and even actual tick logic, fixed for me
await Bun.sleep(sleepTime); in loops
yeah, open an issue, worst case it will be closed
what kind of code has uncapped loops?
while(true) { doStuff(); }
or
const TICK_RATE = 20;
const interval = 1000/TICK_RATE;
let nextTick = performance.now();
while(true){
const now = performance.now();
if (now>=nextTick){
doStuff();
nextTick += interval;
}
//needs below
const sleepTime = Math.max(0,nextTick-performance.now()(
await Bun.sleep(sleepTime);
}}
just my 2c, could be simple as uncapped loop, it will not yield and look like a memory leak. Even though logic is gated
Nothing I'm aware of :/ I would describe everything as precisely as I can in the issue, but in my case - memory issues shown under constant traffic. Same app hit locally with bombardier either goes into 500 or can handle responses properly (depends on parameters) - but in both cases is able to go back to normal memory limits when bombardier stops requesting.
Worth checking, just search for Bun.sleep in VS Code. If you don’t see any and you know you have loops running, that could very likely be the cause.
Even gated loops (based on time or logic) will spin at full speed unless you explicitly yield. Without await Bun.sleep(...), Bun will hammer the CPU, block GC, and prevent async tasks from running cleanly (cascading) which can cause timeouts, memory pressure, or 500s under load.
Wooo - something new for me - will do the search 🙂 Also I will examine loops - that might take some time. Thanks for sharing that info 😉
BTW (not important): using zed as code editor ;p
let t=Date.now();setInterval(()=>{let n=Date.now();console.log(Δ=${n-t}ms);t=n},1000);
Drop this in any loop, if delta (Δ) > 1000 (1s):
Something is blocking the event loop.
Your app isn’t yielding enough.
Tight or unslept loop somewhere.
I'll do my best with coworkers and be back with the feedback 🙂 Thanks for those ❤️
finally rolled out 1.2.17 - no change to ram
still pinned at 40 pods on gcp 🙃
we're going to need more of a reproduction for us to be able to help you
our app is fairly large. itd be difficult to track down where exactly things are going wrong
i can throw in a memory dump onto prod and get a readout periodically as a start
this week we’re making bun use up to 10x less memory in long-running servers
I was assigned a task to migrate us back to node. I put it on pause to wait for 1.3
Literally praying lmao
this week (7/21)
pls dont play with my heart this way 😭
if you run bun upgrade --canary do you notice a difference?
is this on docker for me to try sending to a dev instance? i can do that and get some simulated traffic
https://hub.docker.com/layers/oven/bun/canary
cool ill send this out
before pic - a dev instance crashes every few hours reaching 4gb ram and no traffic

@scarlet cairn our app is hanging because of this issue which occurs in 1.2.18+
https://github.com/oven-sh/bun/issues/20875

What version of Bun is running? 1.2.18+0d4089ea7 What platform is your computer? Darwin 24.5.0 arm64 arm What steps can reproduce the bug? When using the @google-cloud/firestore library with Bun 1....
the green is canary
theres literally no traffic other than healthcheck because we hang on any actual endpoint due to the grpc issue (so no one is using this dev instance rn)
definitely see that gc is able to happen so we arent crashing with oom but it still shouldnt rise like this
node is a flat 500mb

significant cpu difference (likely due to not needing to panic gc as we leak to oom)

the new vm spinning up at the end is due to a bun panic
filed report
https://github.com/oven-sh/bun/issues/21570

How can we reproduce the crash? Context: Running an express app using bun canary on gcp. It's getting hit by a health check via the load balancer. It hangs on visits by the user due to the grpc...
in about an hour, canary will be finished building with the fix for the crash
it might also end up fixing the gRPC regression but i'm not sure
ok. sending this out and will test in a moment
app loads now and the crash hasn't happened
is the rss still climbing?
yeah

Yeah that looks like a memory leak. For us to figure out where we will need some more info. If you could run heapStats() from bun:jsc that would be the easiest starting point - is there any non-default type that has a large number in either objectTypeCounts or in protectedObjectTypeCounts? The ideal would be a v8 heap snapshot but you may not want to post that publicly as it could have credentials in it
heap stats ^
snapshot. i can take another one after like an hour to see whats changed

its strange none of this really sticks out. i do think it's likely related to instrumentation though.
we are loading sentry via import
"start": "bun run --trace-warnings --import src/instrument.ts src/index.ts",
i don't think this will really help that much but maybe after these two PRs the snapshots might be a little more accurate:
my current guess is something is going wrong with the sockets being kept alive, as 200 of those sockets are alive and they should not be
also those 2000 maps - thats kind of a large number
if you were to not import sentry can we see if the RSS is improved
basically I’m wondering if sentry is keeping the requests alive forever
sure, I'll try without
with sentry on i waited like 30 mins and did comparison view of the snapshot

going to send out the sentry disabled version
what did it look like
I went scorched earth and created a new file that is just barebones express + bodyparser + health check
gonna slowly add things back
this is the comparison view after 8 hours and the ram view
its definitely not skyrocketing to 4gb in 2hrs, but it has an interesting pattern within a 5mb range
ill add sentry next


I tried getting the 'without sentry' one but the server crashes
I need to bump its ram in order to get it
Here is the heap stats before I ran the attempt
Strings rose from 400k to 1.6m
blue is without sentry, the green is the bare express

For barebones
I added back our react app that we serve with express static, no api routes so accessing it gives 404 to apis
I mounted our websocket server as well (green)

damn, guess it really is sentry @scarlet cairn
my previous attempt just marked it disabled rather than not import it at all

the blue one is without sentry?
yeah
ive iterated on an empty express app a few times and its been mostly flat until i finally added sentry in this last update and got the slope again
the bump at the end of the blue is running a memory dump before closing
likewise the green spike is doing a starting memory dump
is this with the node or bun sentry? (wait does bun even work with the node one?)
its with bun, and i think that just wraps the node one with some extras to support bun servers
we were using the node one a month or two ago and still had the issue
yeah, we dont have sentry node in our package.json (anymore) but its in the bun.lock as a dependency of sentry/bun
so took a diff for sentry start and end, im seeing strings rising, and it contains request input and output information
see the bearer tokens and stuff... 😬

the associated object

left it for a full day to be super sure

start script:
"start": "bun run --import ./src/instrument.ts ./src/index.ts" where instrument.ts initializes sentry
stripped out a little bit of company stuff but this is basically what i have on my local if it helps for reference:
https://github.com/MagsMagnoli/bun-express-sentry-leak/tree/main

Contribute to MagsMagnoli/bun-express-sentry-leak development by creating an account on GitHub.
Just jumping into this thread because we also had memory issues 😓
Still some small leaks left (which is probably Sentry as well)
BUT the biggest culprit was Bun.s3, with a peak of 83GB RAM across 3 replicas haha. After the fix it's pretty stable-ish with about 300-700MB RAM/instance.
See https://github.com/oven-sh/bun/issues/20487#issuecomment-3153362860

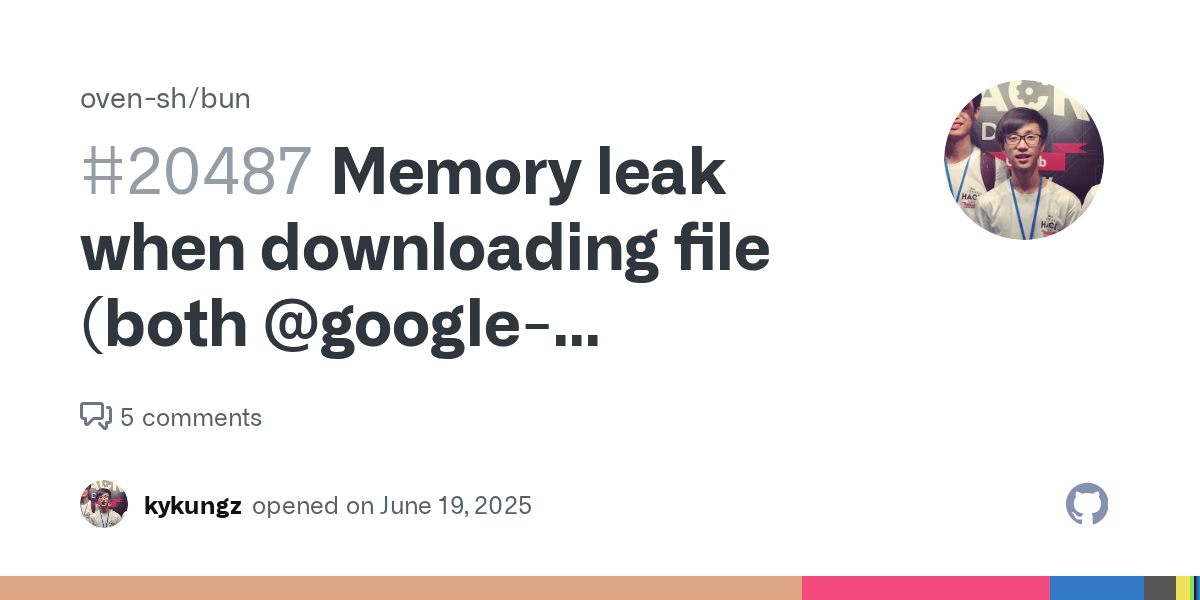
What version of Bun is running? 1.2.16+631e67484 What platform is your computer? Darwin 24.5.0 arm64 arm What steps can reproduce the bug? After downloading a file using the @google-cloud/storage S...
If you need more information, just tell me and I'll try to provide it 🫶 Love bun 
I am solving our issue by disabling the sentry default integrations which hook into http and fetch as well as removing tracing
defaultIntegrations: false
Let me know when if/when there is a patch to try 

damn. on my testing dev instance with low traffic this change fixed everything
however testing on the full app with this applied and a bit of traffic and we're still exploding
ahh my personal was using newer version on sentry and express 
updating sentry didnt fix it :c
OK! looks like sentry was a leak fix as confirmed on my smaller instance but for the other dev instance there was an additional issue where it was retrying a connection constantly and that caused an oom too. fixing that and we are flat ram on both!
looks like we're still leaking, just slower on 1.2.20 with sentry tracing + integrations disabled 🙁

(green is 1.2.20)
here's prod. need to figure out the cause of the spikes but otherwise still slowly increasing with just the sentry changes (currently on 1.2.17 with 1.2.20 under test)

mimalloc v3 upgrade intended to reduce memory usage further did not make it to the release due to causing crashes