
#box plot
1 messages · Page 1 of 1 (latest)
44 is the upper quartile as shown by the box plot
so find the upper quartile of 3000. Then subtract that from 3000
@fast jolt
Can u explain how to do it as i have not done it before @brisk shoal
I have but not these kind of questions
Lowest value lower quartile median upper q highest value
right
So let’s draw a line from 44
ah wait, our line from 44 is also the line representing the UQ!
Yes
so
People who waited more than 44 minutes, is also the UQ of 3000. Subtracted from 3000
so calculate UQ of 3000
but that is also just the LQ of 3000
so you can choose which ever one you are most comfortable with
have you not learnt how to calculate UQ
No
ok. Have you finished covering box plots in class
Almost but my mock is next week
yr 10 mocks?
Yh
in winter
bit weird
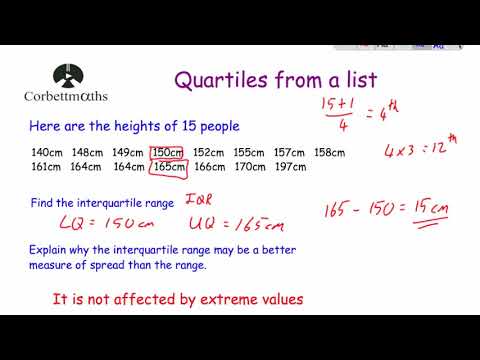
This video shows how to find quartiles from a list for GCSE Maths. It explains what the lower quartile, upper quartile and interquartile range are and also how to answer questions on them.
Watch smth like this
Ty
you are welcome


have you done histogram
Nope
ok well this topic is histograms.

GCSE Maths revision tutorial video.
For the full list of videos and more revision resources visit https://www.mathsgenie.co.uk