#archived-code-advanced
1 messages · Page 131 of 1
there's some simple and dirty strategies you could try if you don't have time to manage things properly, like if you know all these assets are being loaded for the duration of a level, make a static list of handles somewhere, throw the handle from every LoadAssetAsync call in there, and clear and release everything when you switch levels
yeah, that's what I started to do 1-2 weeks ago into an already existing Utils class, then I realized it wants parameters I can hardly provide from other classes.
So I will probably make a separate one
(you can release via the handle or the asset itself)
but this is a good idea
so its a good idea, but, can you help me one thing?
or rather answer me one thing?
if its related to assetbundles, then shouldn't be this solution worked temporarily?
because its allegedly clears up every addressable assetbundles
forcely
so then I shouldn't see any assetbundle reference in Memory Profiler after calling this, right?
this is a hack and will surely fuck other things
if it works as that person says i guess it should probably unload everything? i'm not going to try it myself though lol
right, but that's not the topic now
because its just a quick test
hey you do you
I have very limited time
correct Releasing can take weeks
which I don't have now
but I would invest time, if I would see it would work
because currently I'm not really sure it would
so... I wanted to use this to test IF the issue is with the addressables really
do I look like I don't listen for suggestions?
would you be able to do it in 1 month?
Anyone who confidently answers this without knowing the actual details of the project and the quantifiable goals here probably can’t 😛
Yea i dont know your project but as an outsider all i can do is suggest solutions and methods you should use with addressables and hope you can apply them where it matters most to make some impact.
I mean there most be a way to not sleep and live 0-24 in the office for the next 2-3 weeks
Objectively either the deadline changes, requirement changes or person doing the work changes
objectively the last one seems horrible
so can you check the code in here?
I did a quick test with it
shouldn't it clear up all possible assetbundle references?
just to know if its worth the time to make a manager and place handles there to release all of them when needed
Apologies if that came off rude, I say that just to mean there’s only so many answers (if any) that can fit in that venn digram of parameters. This server can help navigate those options but it won’t increase how many are actually available
If you look closely at your screenshot, you'll see that this is a different reference hierarchy to what you shared before, so your changes probably did have an effect.
If you investigate closer to the root of the cause it might be a lot easier to solve the issue, rather than modifying hundreds of other scripts that could be in the middle of the reference chain.
But you don't. You keep on ignoring the correct way of investigating and fixing this issue. How many times were you told to look at the root cause and read the profiler info? But you kept on trying to cut the references in the middle of the reference chain. The only time you did it right was a few days ago when you successfully get rid of some manager object at the root of the reference chain - you found the root cause, confirmed the profiler info that mentions the cause and eliminated it. But after that you gave up and started doing it the wrong way.
I don't see difference though. I have shown reference hierarchies of totally different things
I mean I don't see why it would be different to break references in the middle or solving the root cause. I don't see why is it better to null a root than the actual thing containing texture
but if you would explain me, then I would understand it

how do you track back its root cause?
its not really trivial
for example I can't find PickableMonobehavior[] anywhere in the project
I don't know where are those HashSet.Slot<...> things

this is a different one
it says its in an assetbundle
I have opened Asset Management - Addressables - Groups, typed this Tex_fx_Shoot&Hit_set name into the search bar, none of the addressable bundles contain a texture like this
I have selected this exact texture in the Project window, even the "Addressables" is disabled in the Inspector view for this
so it would be a great help if I could understand anything of the References Hierarchy
because currently I don't understand it
there's lots of resources online for learning addressables
what is a performant way to update indices in a mesh? theres no way to just pass in updates as a slice it requires you to get the entire index buffer update it then pass it back in which is not ideal
Shaders 😛
i need lighting and navmesh to update with it though
i tried:
            using (var input = Mesh.AcquireReadOnlyMeshData(mesh))
            {
                using (var output = Mesh.AllocateWritableMeshData(mesh))
                {
                    var indices = input[0].GetIndexData<int>();
                    var buffer = output[0].GetIndexData<int>();
                    buffer[start] = a;
                    buffer[start + 1] = b;
                    buffer[start + 2] = c;
                    indices.CopyTo(buffer);
                    Mesh.ApplyAndDisposeWritableMeshData(output, mesh);
                }
            }
but that didn't work
Start by selecting the net object controller and reading it's info.
As well as thinking whether it's supposed to be loaded at that point of time or not? If yes, then pick the next thing in the hierarchy - FXCollection. Is it supposed to be loaded? If not, then read the info. Understand why it is still loaded.
We've went over this many many times by now.
I just want to avoid this, because this seems extreme amount of time
by the way
FXCollection is not the root
Avoid how? By trying random changes? You're just gonna spend more time on that and not get closer to solution. Understanding the issue is the key.
and you wrote to investigate the root
I would deal with FXCollection, but its not the root at all
The root would be the last object that is not supposed to be loaded. I don't know about the ones you shared in the screenshot. You'll need to look at them. It could very much be that they are supposed to be loaded.
And if not, you'll need to read their info and understand why they are still loaded.
@untold moth now from 1369 textures, I could reach 1044 loaded textures

okay, so, can we go through this like if I would be a complete idiot?
first thing I don't understand
NetObjectController is not needed in the main menu, so I want to get rid of it
it says "referenced by 10"
I can only see 8 in here, so I'm already confused
where are these HashSet.Slot and other things?
Possibly, there are several instances of one of the 8 things that you see that reference it.
Referenced by some other object. Need to expand the hierarchy to see it.

Just need to set something to null, the object is already destroyed.
Which is potentially all of the things you are showing.
It's likely that most of these 10 references are cyclic and possibly would go away themselves if you eliminate the root of the issue. There can't be that many references to objects in another scene - only DDOL or static fields could be culprits.
and I can't see any of those 2
Then investigate until you find the cause. There might be other scenarios.

it says "PlayerManager has a static reference on type PlayerManager
but I can't see that anywhere in that class
maybe I'm blind or I would need a glass
no idea
Is that PlayerManager supposed to be loaded at that point?
yes. Only MultiplayerGame should not be there
but I already removed MultiplayerGame days ago
The fact that there's a delegate in between, probably sugests that the PlayerManager is subscribed to an event in the MultiplayGame.
Or the other way around.
OnUsablePlayerArrayChangedDelegate
sounds like a typical case of forgetting to unsubscribe from events.
and even this can cause leaking as well?
Yes. In the end it's holding a reference to the object.
fantastic
Is the PlayerManager even supposed to be alive in the menu scene?
That sounds like a bad decision to me. What exactly do you need it there for?
I was not the one writing that class
I only know 2% of code base
Anyways, try unsubscribing from whatever it's subscribed to on scene change.
in Game.cs, it unsubscribes from PlayerManager.OnUsablePlayerArrayChanged
and Game.cs is parent of MultiplayerGame
and the unsubscribe happens in OnDestroy (which seems valid, since MultiplayerGame gets destroyed)
What? Who unsubscribes where? The PlayerManager needs to unsubscribe. Not the other way around. If I get it right.
MultiplayerGame unsubscribes from PlayerManager, when MultiplayerGame gets destroyed
Ah, okay. Did you confirm that it's being called though?
Also that it doesn't subscribe more than once.
well, it subscribes in a way like -=, += in the awake
and -= in ondestroy
so only subscribes once
you were right, it doesn't get called
it might be worth verifying that in the debugger, if you inspect the value you should be able to see the subscribed delegate list
but the gameobject disappears in Hierarchy
so I guess the same thing happens again
only partially running the OnDestroy
An error?
Do you see any errors in the console/log?
yeah, these things are coming from since my first try of releasing addressables....
a week ago or something, I tried to do releasing addressables the "right way"
its NDA platform, I live with constant errors
Before doing anything else
there are a lot of them
That's not normal
I didn't have time to start with solving errors
But then you gonna spend more time investigating issues that these errors are causing😅
Like memory leaks
Not to mention that a game with errors is not ready for release.
Depends. I've got a few I can live with 😉
(I have a few debug shader passes that don't compile and cba to fix)
At the very least you should be fully aware of where they come from and what effects they have on your program
If the error is in the middle of a method and are not caught in any way, this means that they break some logic. This is like a no-no. If these are just error level logs without breaking the execution flow, it might be fine. Depends.
Like runtime exceptions? Yeah that's dangerous
They also break the entire call stack, so depending on how deep it is, it might break the whole game state.
I mean I have like tons of Debug.LogErrors
for things which could have been just logged normally
(I wasn't the dev of these logerrors)
because there are a lot of these, I got used to not looking at these
Are you testing with a debugger connected? It should break on real errors.
This sounds like something to go through for like 20 minutes and fix them
Because "error that's just a normal log" is... pretty undesirable
especially if you're seeing problems like OnDestroy methods not completing because of errors!
that's a pretty bad one
If that's the case then it's an exception, not an error log 😉
an exception is a type of error 😛
the context here is that they may be missing an error logged by an exception being thrown because there's so many other errors being logged, exceptions in the unity console appear like any other error
This has quite the On Error Resume Next energy.
Yea im sure there are some that need to be examined but if most are caught and logged things may appear to be working
@stuck plinth @untold moth @ebon abyss no, the OnDestroy was half-complete because of a real error I made 1 week ago, when I tried to collect AsyncOperationHandles by classes which makes Addressables.LoadAssetAsync calls. I just did it wrongly.
About 5 hours ago I made a separate class which collects AsyncOperationHandles from all classes whichcalls Addressables.LoadAssetAsync, and when I switch back to the main menu scene, I just unloads all which was part of the gameplay scene. This part works, this was freeing up like 100-200 mb of memory. But from my old solution when I tried to do things the right way (that "1 week ago" solution I mentioned) that broke things up.
And I just didn't see these relevant errors to this, because I have Debug.LogErrors for a lot of things to be able to print messages in NDA platforms visually.
so not the Debug.LogErrors made the OnDestroy stop working

I don't understand this, seriously
PhotonView has 3 static fields, I have cleaned up all 3
it doesn't have a static List<> field
okay, I could eliminate it from a fully different field I expected
okay, so I still need to read the same thing like 4-5 times to be able to actually find the reference
but maybe I can start to be able to use this "Referenced by" window
it was not really trivial
@untold moth are you here?
Why?


what could reside in the ALLOC_DEFAULT_MAN: TLSF Memory Block 44?
ALLOC_CACHEOBJECTS is also huge
but the Top Unity Objects Categories doesn't tell me that the issues would still be with those things
am I being ignored?
@untold moth
c'mon, don't spam ping individual people for replies
this is a volunteer help channel, nobody owes anyone anything here, it's also the middle of the working day lol
A bit busy now. will have a look when I can.
I have eliminated the texture leaking though
it seems
I will check the stability of the game though
This is all "reserved". It's likely memory that unity allocated and released before and it holds on to it to so that it can reuse it.
because I'm still annoyed by that 1 gb of "something" lurking in the memory
Requesting memory from the system is expensive, so engines usually allocate ahead of time or hold on to memory that was released in their allocators so that it can be reused later on.
Unity specifically mention how once the managed heap expands they rarely free some of it. It will often have lots of un used space
They talk about it here: https://docs.unity3d.com/6000.1/Documentation/Manual/performance-managed-memory-introduction.html

thanks
since then I tested the build on NDA
much more stable!
and now I get out of memory error, but in different way, its complaining about rendertextures now
so I can progress at least
now I have no idea how to free up a RenderTexture, if its not used anywhere in code, and if its only referenced by UnityEngine.Rendering.RTHandle
Sounds like it's GPU memory issue. At this point it might be better to use a native profiling tool.
Do you know if the project uses render textures anywhere?
I'm checking the native profiling tool, not sure what should I see here. Display Faults per minute is over 3000. Is that normal?
there are only 6 render textures in the project, but in the Memory Profiler it mentions render textures which are not in the Assets folder
they can be created at runtime so they wont always be an "asset"
Doesn't really make any sense outside of any context.
couldn't find any RenderTexture or RTHandler in code
could be a package or the render pipeline
It could be render textures that engine uses for it's features. Not sure if unity tracks them the same as user created RTs.
^ yea, i forget if things like the depth texture and normal texture (if enabled) are used as render textures or not
never mind, I have found RTHandles in the project
as these can be enabled to be made in urp for example on forward rendering
its just the solution grouped into many different projects
so I couldn't find them before
Sounds like separate assemblies, which isn't that uncommon.
that should be easily searchable with their ide
Yep

Most of it sounds like engine internal renter targets. The first one seems to be a render target for a custom pass, so it could be created by some kind of renderer feature or something.
I don't think you can remove any aside from the first one(which might break some custom rendering feature in the project).
wait a min
But maybe select one and have a look at it's info
since then I realized
I could free up memory only in the first level
the other levels are still leaking textures as well
today I tested a different level, and based on the error message, I thought I had a different issue
but apparently the issue is probably the same as before
only the message was different
I'd use a native memory analyzing tool and reproduce an OOM crash. Then look at the captured data.
I guess I won't be able to understand it
GPU and D3D stops sending values
Memory usage is around max
CPU 1 is at 100% constantly
this happens when out of memory error happens
You need to use the dedicated memory tools for the platform. On windows and Xbox it's PIX. PlayStation has memory analyzer.
Read your platform documentation. They usually explain in details how to use these tools.
so maybe I should not even optimize texture memory?
Use the mentioned tools to understand the cause of the issue before optimizing anything.
good to know this after wasting 1.5 weeks, and I'm almost around deadline
Well, you didn't really lead the conversation in this direction.
I mean, unity profiler might be useful to a degree I guess. But you need a capture closer towards the crash. I'm not sure unity can do a trace like capture like the native profiling tools.
If you need a quick hack to ship this, quality settings has "global mipmap limit". Setting that to half can save serious amounts of VRAM. Obviously at a quality loss
Read the documentation: determine the platform memory limitations. Then look at the tools data to confirm if it's actually an OOM and not some other issue.
Then use these tools to investigate further.
It's what I did for what I'm assuming is the same device.
I'm afraid not the VRAM will be the problematic now, but I'm not even sure anymroe
ok thanks
I will check it
Consoles usually use UMA, so reducing VRAM consumption might help even if it's not the main culprit.
oh its the texture resolution. Yeah, I already tried to set that, and even on lowest values it didn't solve the issue
this is why I called it texture memory leak
it helped though, didn't crash for a lot of time, but eventually it crashed for the same reason
Is it crashing in the main menu?
originally it isn't. 99% of time it crashes during gameplay or when I return from there to main menu
during loading
but even the main menu is full of huge textures
which I can't really decrease further
Are you loading scenes additively without clearing unused assets?
If using lower mip levels still causes a crash eventually, then it's definitely a memory leak. You need to investigate it using the native tools as I mentioned earlier.
its not what you want to hear but if asset loading and unloading was improved correctly from the start it would be easier to solve and manage.
If memory runs out when loading required assets then you know you need to scale back certain things (e.g textures used, max size, quality ect...)
I don't know if you went with the "nuke all addressables" solution but it wont provide reliable results
I think they jumped on the project in the middle and were not involved in most of it's developement.
I won't have time to refactor multiple hundreds or thousands of scripts
I would definitely do that
but there won't be time for that
correct
It sucks but i stand by what i said
other people made poor decisions and you have to do what you can to optimise it
There aren't that many ways to have a memory leak in Unity. Use the dedicated tools and you'll figure it out.
Perhaps should've mentioned that you have a leak earlier. Removing references in the main menu scene probably didn't really help with anything.
As soon as a scene where these references are reassigned, is loaded, the dangling objects would be released anyway.
I have started the whole conversation with this
anyway, I believe I have fixed the leak only on one level
I'm not sure
but maybe (based on Unity Profiler, the texture memory decreased a lot)
during the weekend I will read about the native profiling tools
but for now, I only know that for the other levels I still can see addressable bundles in the references
those are textures which otherwise not in any addressable bundles, so I guess they get loaded because of some dependency
how can I figure out which addressable bundles loads certain textures? because Addressable Groups window is unusable for me
(why? because memory profiler says its named as e62badcblablablabla, and in Addressables Groups there's no group named like that)
bundles and groups are two different things, you can turn on the build layout report in the addressables settings
the filenames and contents of each bundle are set up in the groups' schema settings
but the build layout report will show you exactly what's being produced in the build
but what can this e62badcblablablabla bundle be?
how to know when has this been loaded and what does it contain?
I haven't created ths
check the schema settings, it's probably based on the hash of the path or contents
where is that?
click on the group, the schema is what shows in the inspector
contiguous bundles is the thing, which packs then into blablah names?
look at the naming options, my unity is importing some big assets right now so i can't get a screenshot lol
it won't show you exactly where that particular bundle came from, that's more what the build report is for
it's in there somewhere haha
build path
unique bundle IDs (which is disabled btw)
monoscript bundle naming prefix (disable monoscript bundle build is setted)
shader bundle naming prefix? (setted to project name hash)
is it that?

I'm fully lost
so is it the Addressables Groups window?
oh ok
I found that hardly
I recommend "append hash to filename" so the group name is in the bundle name
but you only really need the hash versions for remote bundles or bundles not using the default local paths
should I rebuild addressables to make this work? with default build script?
Hi, is anyone familiar DOTS latios framework? I am trying to do something with it and facing some issues. Would really appreciate it
Yea you need to rebuild addressables or do a new game build for it to do anything...
new game build didn't do anything, this is why I asked
rebuilding addressables is in progress
then depends if addressables are built automatically with a new build then
still not there
the name
check the docs about this setting and what you are doing if this is not changing things
well, maybe only at home
I will still try to rebuild it with using only filename
nope
going home
since then I realized I was idiot
because I already solved the optimization
I've written the addressable releasing "hack" I made to work only with one gameplay level and forgot to expand it
with unity's mesh data api how do we update specific uvs or indices ? for the writable mesh data if you get the mesh buffer it doesn't come with the inital values of the mesh to edit
readonly cant be modified though
not entirely sure how do to use this api properly to update specific indices
This page specifies how you can create and assign new mesh data. If you want to update an existing mesh, you'll probably need to get it's read only data, init a new writable data with it, modify it, then apply to your mesh.
https://docs.unity3d.com/6000.0/Documentation/ScriptReference/Mesh.MeshDataArray.html
isnt that a lot of heap allocation though?
for me the user is adding/removing faces on mesh so im updating indices - if i have to keep grabbing the data updating and pushing it back won't that be a lot of performance hits
Acquiring the readme data doesn't seem to do any allocations according to the docs. Allocating writable data does, but there's no way around it. You can resize arrays or buffers. You can only create a new one and replace it.
I'd assume that unity is doing it the smart way and doesn't handle it in the managed memory.
is there a direct way to copy the readonly data to the writing buffer like a memcopy or do i have to go through it in a loop
I wonder if you can just modify the read-only data and pass it to the ApplyAndDisposeWritableMeshData
You'll need to play around with it and see what works, since it's not documented very well.
If you only just need to modify one mesh, I think just modifying it's triangles/vertices directly might be better.
@untold mothwould something like this make sense:
            using (var input = Mesh.AcquireReadOnlyMeshData(mesh))
            {
                using (var output = Mesh.AllocateWritableMeshData(mesh))
                {
                    var uvs = input[0].GetVertexData<float2>(channel);
                    var buffer = output[0].GetVertexData<float2>(channel);
                    for (int i = 0; i < uvs.Length; i++)
                        buffer[i] = float2.zero;
                    Mesh.ApplyAndDisposeWritableMeshData(output, mesh);
                }
            }
will use job system for the for loop aswell for extra speed
i assume this is how unity expects us to do it - makes no sense to me that the writable mesh data doesn't at least start with the data from the mesh
I don't think tat would even compile.😅
AllocateWritableMeshData doesn't take a Mesh
and you probably don't need to zero it out either.
It's not clear why you need to retrieve uvs either in your code. You never use them.
If you only need uvs for their length, there are probably better ways to do it.
I guess, you should start with explaining what exactly you're trying to achieve. Do you even need to do it via jobs at all?

In this case it might already contain all the mesh data.
yeh going to test it now with some logs
the vertices seem to be correct but indices are not v.odd
getting a weird error for this:
using (var output = Mesh.AllocateWritableMeshData(mesh))
{
    int start = GetTriangleStartIndex(column, row, triangleID, totalColumns);
    if (mesh.indexFormat == UnityEngine.Rendering.IndexFormat.UInt16)
    {
        var i16 = output[0].GetIndexData<ushort>();
        i16[start] = i16[start + 1] = i16[start + 2] = 0;
    }
    else
    {
        var i32 = output[0].GetIndexData<uint>();
        i32[start] = i32[start + 1] = i32[start + 2] = 0;
    }
    Mesh.ApplyAndDisposeWritableMeshData(output, mesh);
} //<--- error takes me here
ObjectDisposedException: The UNKNOWN_OBJECT_TYPE has been deallocated, it is not allowed to access it
oh wait im disposing twice i think
ok that was it ! never mind 🙂
everybody have memory allocation issues it seems xd
we are abusing memory
I only really worry about it in hot paths
Is there any way i can sample normals from a mesh using their UVs?
The context is a height map mesh (no overhangs) that has been decimated. Therfore there might be vertex, vertex, no vertex, vertex if we look at it like a grid of equal distance. There are no holes, just some triangles bigger than others.
Is there any way for me to sample a position and a normal directly using a UV coordinates?
The target is to create a texture with information about the height and the normal of each pixel in the texture
So baking world space / object space normals from a mesh? Yeah that’s possible. The information is all there
Thank you! This info is really helpful and really pinpoints some starting points!
Sorry man, I have no idea how to do it. Just that it's definitely possible 
Would start looking up how UV mapping works since you can't use the GPU's built-in pipeline here.
No problem. Yeah the the thing is, i know that a mesh can sample the UV, but I'm not sure I can access a mesh through the UV
I've seen methods using cameras to sample the mesh, but seems a bit overthetop
You've got three arrays of note on a mesh. Vertices, triangles (aka indices) and UV's.
Vertices = vertex coordinates
Indices = index of the vertices in the triangle
UV = UV coordinates of a vertex (index maps to index in vertex array)
So for each pixel on your texture you'd somehow have to sample which triangle it falls on, then blend between the vertices that make up said triangle.
Hello can some one help me to make an AI car to race
Anyone got any pointers on how i could more efficiently test colliders to see if they fall in the nodes of an Octree? Right now im using overlap box but unsuprisingly its very laggy, ive seen some things about using mesh vertecies to test against this but not quite sure how to go about it
are the nodes colliders?
no they're AABB bounding boxes
im using those to test colliders, the terrain
Have you profiled this? Does this make use of burst and/or jobs?
share some code if you can
well designed axis aligned box overlap checks should be quick
theres a lot of them though, i want it to be fairly high resolution for a* pathfinding
i profiled about 10k chekcs but honestly that seems a bit high so im not sure if it might be doing some unnecessarily
unfortunately not, i should look into this
jobs can help if you need to do many checks all at once and burst will make things quicker and force you to use unmanaged structures
its pretty basic


how many allocations occur for 1 check?
ill have to profile it again soon, i got dragged into some Overwatch 😅
im confused how building an octree can be async as well
unless you are using worker threads
yeah i was just trying things :(
async is not a magic thing, its a way to better handle code that may not "finished" right now and needs a callback to continue after
e.g file io, networking, waiting for some time
yeah i thought i could make it async so the game would still be playable while it generates, I did this for a different project with world generation, but im realising i used threading to have it run on background threads
yea you need to execute the code on another thread/worker thread and await the result to benefit from this
UniTask make this easy to do
you cannot use many unity functions on other threads however so may require some things to be done customly
yeah I had a lot of trouble with that
you would need to do it all with your own structures, 3d box overlap checking isnt hard so its doable
(i dont see a reason for Bounds to not be usable however)
Same thing with async
the thread is what matters, async can be on the main thread just fine
Awaitable + UniTask offer functions to easily "swap" back to the main thread
The problem with async is that it might call some things out-of-time.
Instead of during, say, the update loop
if you use awaitable or unitask to delay its safe
it all uses the update loop and the unity scheduler
to get something like this be fast, you first need to first make it structually and algorithmically optimal, then exploit data locality, then parallelize it via jobs or a custom approach. async (which is for synchronization not for distributing workload) will not really help you unless this is an offline baking process.
is there any particular reason why you are using an octree? is it optimal for something you want to do with your data? For AABB vs AAB lookups in a sparsely populated dataset a BVH is likely more suitable.
Haha yeah, I wanted to make a fun fishing game but I was bored of these games just having the fish be random things you pull out, I wanted to use octree and a* to create a 3D navmesh for the environment
im not sure, I think i may have bitten off more than i could chew, I dont like giving up though
the fastest most readily accessible spatial lookup you have in unity is the BVH of the physics system.
an octree based a* sounds interesting but likely a yearlong project in itself to get it perform well.
Yeah I wanted something fun and refreshing since I just finished university for the year, but im realising the error ive made haha
its always like that
ive got it set up so it generates an octree and a paths between nodes so something can navigate around it, but the octree takes about 8 seconds to generate and theres still issues with nodes being in inaccessible areas underneath the terrain and stuff
one viable approach could be to use A* Pathfinding Project as a base and implement a custom graph type for it that leverages the quite fast builtin recast generator (basically a scene voxellation engine) to create some sort of hierarchical/volumetric structure from that. Internally it can only understand 'area' of nodes, not volumes, but maybe thats also extensible.
this does sound interesting
i might have to shelve the idea though, I gave it a shot but i dont think ive got the goods to execute it
Thanks for all the input though, everyone!
does it make sense to have a separate script for functions such as screen shaking, frame freezing and other utilities like that? Then in one script, like a weapon script, whenever a critical hit is performed, I have a delegate which I can subscribe a shake screen function to from the utility script
Screen shake should probably be a Singleton or static class so you don't have to worry about getting a reference to everywhere.
thank you I’ll do that
Yes, that's a good way of doing it. Doesn't need to be a singleton (that introduces other issues), could literally just be a monobehaviour on your camera (or wherever relevant) that subscribes to what it needs to when it starts up
How would I go about creating a signed distance field from a 3D grid of density values? I tried making this myself but it's not working very well, and I figured I'd ask around if there's an established way before trying to reinvent the wheel.
What are you planning on inventing? You can write the values to a 3D texture to pass them easily to shaders/vfx and preview them in an inspector
When vertex optimisation is done on a mesh, how is floating point imprecision considered when comparing verts for re-use? Is Mathf.Approximately good enough?
Not sure if there's anything specific about vertex optimization, but generally Mathf.Approximately is a good generic implementation for checking with some reasonable tolerance.
I want to generate a mesh using either marching cubes or dual contouring. Haven't figured out yet which I'm going to go with, but I need to generate a signed distance field either way. Also, any solely inspector/editor based stuff won't work, as this needs to occur in real time in an update loop.
okay, so I still couldn't get rid of the optimization issues
any ide how to reduce D3D12GfxDevice memory consumption?
and ALLOC_DEFAULT
- Use the profiler/native profiling tools to check what consumes video/GPU memory. Do you have a leak or just loading too much stuff?
- Reduce the amount/resolution of textures.
- Make sure that the textures are using compression.
- Reduce the amount of meshes/LODs or their complexity.
- Use more aggressive scene separation.
- if possible implement texture/lod streaming.
- Check what render textures are being created. Make sure there is no redundancy.
- Check if there are any graphics/compute buffers created and that they are not oversized.
sry, I mean only ALLOC_DEFAULT
nothing is wrong with the D3D12GfxDevice memory reservation
I just always start to look at the memory profiler badly
Well, you'll need to figure out where it comes from. This sounds like just any arbitrary allocation.
my current idea is to checking every static fields if those are freed up correctly
but even collecting them takes like forever
although at least I've found some managers which needs temporary, and they had static instances inside them
which were not freed up when scene unloading happened
What's the point asking about ALLOC_DEFAULT then? This sounds like c++ side memory allocation.
How can i disable mipmap on a texture2d save as .asset ?
You probably can't. I think mips are generated when the texture is created. Normal assets regenerate the texture instance on import/reimport.
@untold moth can I load only the relevant TMP font atlases into memory? which I currently need. And the others could stay on the local storage
tmp fallback stuff may get loaded always but otherwise id expect them to be loaded/unloaded when needed (and again, addressables should handle this where able)
I don't know enough about tmp to answer that, but I'd assume that it should be possible to unload unused assets.
I would be happy if you could help me with that
because its not part of the leak itself, but a lot of font atlases are loaded unnecessarily into the memory

these are the references though
absolute zero idea how to resolve these
maybe its not even possible from here

do you know where's that fallback font asset table?
project settings > TMP
or check the tmp folder
i think that stuff is in a resources folder? maybe Assets/TextMeshPro/somewherehere?
yea its in a resources folder in there, you will find it
so I tried to remove fonts from fallback lists to free up memory
and it works quite well
but if I use the in-game language selector, even if I temporary load a font into the fallback font asset table
then it will stay in the memory
no matter if I clear up the fallback font asset table
do you have any idea how could it freed up?
Did you try Resources.UnloadUnusedAssets after it's not referenced by anything?
Typically this would also happen on scene load/unload, so unless you really need to free memory immediately it's better not to use it.
not yet, but that could work, especially now since I tried to load some fonts right now in a test class with Resources.Load
so that might work
well, 14 pieces of 4K and 8K textures would hold a lot of memory, so
I already tried to optimize those like a month ago, but then I didn't try to load only the necessary ones
I also added GC.Collect()
I tried to call that
and also GC.Collect()
but still it stays in memory
Check the memory profiler then. It must be referenced by something or set as DDOL.
that's quite impossible
I load those fonts in my testing class I just created
I load those only temporarily
Well, the profiler would tell you for sure.
memory profiler obviously show those
It would tell you why they are still in memory. Check the details.

that gameobject is created by the TMP itself
from the fallback list fonts
but since I clear that list
I don't really know why TMP won't recognize itself and just purge these things
Because it probably doesn't have such functionality
and I don't have access to all TextMeshPro components
That being said, I've never heard of tmp instantiating objects on it's own
maybe it was developed directly against me
I see that some kind of tweening coroutine is also referencing it. As well as TMPro.TMP_SubMeshUI array.
is that in editor or in build
Tmp does make sub game objects sometimes for drawing some text correctly, don't think its important here though
I never make snapshots from editor
How are you even loading the fonts?
Resources.Load
from paths
to avoid [SerializeField] TMP_FontAsset usage
And how are you unloading them?
there's a TMP_FontAsset variable, and I call its fallbackfontassettable.clear()
- Resources.UnloadUnusetAssets()
- GC.Collect()
(Also out of curiousity what unity version is this on?)
2022.3.61f1
I don't think that's gonna work with assets that you load manually.
Try Resources.UnloadAsset maybe.
newest TextMeshPro
any idea before I start to make a 30 min long build?
I've added these
nope
still doesn't clean up the memory
It could be just the managed shell that's still in memory. You need to look at the profiler.
a 64 mb shell would be huge
I'm constantly looking at the profiler
I don't even look elsewhere
Select the texture. What does the details say?
Does it say that it's loaded?
where would it be printed?
Similar to how it's printed here:
#archived-code-advanced message
status: used loaded asset
Then it's used.
obviously
I'd expect unload method to unload it anyway though. Are you sure it runs?
Pastebin
Pastebin.com is the number one paste tool since 2002. Pastebin is a website where you can store text online for a set period of time.
this is what I'm trying to do
It could be that a new instance is loaded when by the TMP though. I'd make sure it's not referenced by anything at all before unloading.
I mean its probably referenced
by those gameobjects I told you
but I can't really do anything with those
TMP generates those
there's a class called this:
https://docs.unity3d.com/Packages/com.unity.textmeshpro@1.3/api/TMPro.TMP_SubMeshUI.html
these are on those gameobjects
Can you not destroy this GameObject? Other than that, you'd need to research why TMP does it and whether there's a way to prevent it from doing it. Or a way to unload it's resources correctly.
not destroy?
what do you mean?
Can you not?
I'm not destroying anything
Or "can't you destroy it"?
That was a question asking if you can or can not destroy it.
I probably could, if I would have a reference to the TextMeshPro components
but since the project has multimillion TextMeshPro components, I would avoid placing scripts onto those
Can you inspect these objects in the hierarchy? What are they for?
From the docs page it sounds like just something that would be used to render text, so I'm not sure why it's created automatically
it takes a lot of time to be able to show that to you
will share an image in 1-2 min
I'm going to sleep now, but I'll have a look in the morning.
pls stay for 10 min
I will also go home
Ok...


I really doubt that's the default functionality of TMP. Maybe there's some code in the project instantiating these?
I don't know. ChatGPT says its TMP functionality
and its because of these are in fallbacks
Anyways, I'm off to sleep.
Nah i think it is from a couple threads online
what do you mean?
can't even find that method anywhere...
You may have to manually change your tmp to use the 3.2 pre release version:

"com.unity.textmeshpro": "3.2.0-pre.12"
yeah, since then I figured out
the whole TMP version doesn't work
can't render the characters
I can only see different sized colored rectangles
at least the original version worked
with the exact same fonts
I can only presume some materials are broken and perhaps need regenerating. I use 3.2.0 just fine in a few projects
don't really know how to do it
and I'm already working (again) for 9 hours
find the tmp font asset, if its static do "update atlas texture" and regenerate it
You can check the textures inside fonts too if you need to


this did absolutely nothing
the material must be half broken then. reset it and check again
I will switch back to the original TMP
maybe tomorrow, but I start to feel that this task won't be ready until deadline
I have only 1 month left, and I still would need to do some other things
but until now I don't really have too much results with this task
already invested ~2 weeks or more into it
in UIBuilder I'm able to bind a slider to a scriptableObject float value I have (volume),
and when confrigured with "two way" binding mode I see the value change in the SO when I change the slider, and I see the slider change when I update the value in the SO via the inspector.
but I don't understand how my volume service is supposed to "listen" for changes made to that value?
how can I "hook" my service to the value change like UIToolkit is doing?
(Unity 6.1)
Guys, have any updated documentation about Mediation Ads?
The documentation on their website is all obsolete
And their sample demo too =/
level play? that is updated often: https://developers.is.com/ironsource-mobile/general/mediation/#step-1
yep, but i've installed the new version released yesterday, but all my implementation using this doc:
https://developers.is.com/ironsource-mobile/unity/levelplay-starter-kit/
is obsolete
check this out


Oh yea this, you can leave the legacy formats array empty now as all types support placement ids
And you can correct the namespace for most things I think
Hopefully they do update this bit
I tried to see from their sample, but their sample still does it that way too
oh, my bad..
the problem is that
using Unity.Services.LevelPlay the obsolete disappears
thank you ma frendo 😄
Yea then do that, I did notice some as object events have the old one but should mostly work fine
So can i use that way: LevelPlay.Init("appKey", "UserId");
without legacy formats
If you don't need to use a legacy way of showing ads then yea
i'm working on this system for allowing certain actions the player can take to "occupy time" of the two first-person arms, and certain actions can only be completed given the left, right, or both arms aren't busy with another action. right now i'm just using static variables for the timers on the left and right arms, so it's pretty coupled with other scripts. i could spend some time to make it a slightly more complicated system but decoupled, or just leave it as is since not a ton of scripts are gonna be interacting with this

in the longrun is it more worth it to set up more clean but complicated architecture? or just kinda use what works if the scope isn't huge
Having a timer or delay to perform an action is a common thing but it may be easier if you simplify it and avoid using static variables for this state.
You don't need the bool as if the timer is <= 0 you know it has run out
Also if this is something related to an item/object then perhaps it can be stored and checked in the item itself?
my approach usually is: use a simple solution first, when the thing starts to go out of hand (be annoying) in any way - refactor
if you already know that something will need to cover some specific cases - it makes sense to plan for them, but otherwise - no point in trying to predict the future
Are you sure tinkering with the fonts is really gonna help? You never actually explained what the issue that you're trying to fix is and it's context. Was it am OOM crash? Then did you inspect the memory at the point of the crash? What's taking most of it? Is it actually an OOM? Or are you confusing some other issue with it?
Maybe I have too much blind faith but I feel like I kinda trust TextMeshPro to do a decent job at managing its own necessary memory?
(moreso the usage of assets rather than the developer provided assets themselves of course)
There are issues with the settings asset only working via Resources meaning it doesn't play nice with addressables but I think you can work around that by modifying it after its loaded
I can't inspect the memory at the point of the crash
even if there's a freeze, I can't make a snapshot from that time
the unity editor simply crashes during making snapshot, if I try to do that
yes, its OOM crash
previously the most of the memory was textures. but by fixing this font thing, now the shaders are taking the most of the place
and the game is much more stable than it was 2-3 weeks ago
there was a map I couldn't even loaded back then
then I could load that map, but I couldn't return to the main menu
now I can go back and forth without OOM crash
but when I played that map for a longer period of time, OOM happened again
with this font modification, I hope this will be solved finally

I doubt it
how tf does that font have 4 64MB textures
chinese
You can if you use the dedicated memory analyzing tools of the platforms..
Otherwise there's no point to your fixes. You might be fixing things that are not even related to the cause.
Check the details of the object. Does it say ddol or something?
if stabiliy got improved, I would highly suspect I'm doing something right, no?
Not necessarily. You might be applying bandaids that just delay the issue.
It really sounds crazy to me that you didn't do anything to investigate the root cause properly.
I assumed you're acting from the understanding of what exactly fills the memory at crash time.
well, the root cause is that its a spagetti code
there's no one single issue originating
I don't think so. That's a cheap excuse to not do proper diagnostics.
the whole code base would need a proper refactoring
I have checked the native diagnostic tools
and I couldn't really figure out anything useful from it
yes, maybe someone more experienced in profiling could figure out something
but I couldn't
and I can't share the screenshots from those, because its NDA tools
all I could see is that the memory usage was always around top
what is top
around the maximum available memory
(which is)
I don't remember
Did you read the platform documentation?
I didn't have time to read everything from A-Z unfortunately
In most of tlsuch tools you can see the callstack of each allocation. You can see what has been allocated and when and when it was released.
I couldn't see these infos
at all
You only need to read the section related to using the mentioned tools.
Then some config might be required. This should also be documented in the platform docs and unity NDA forums/docs(if there are)
well, there's one dedicated page about how to use the analytics tools made for the NDA platform, and how to check memory usage with it.
I've already read this, pretty short document, and I can only see L1 L2 caches, statistics, timelines, memory counters, etc.
and I couldn't get any useful info from it
I played with it like for a few hours, and I ended up nothing new
Caches are not even related to memory. Are you sure you're looking at the correct tools?
maybe the issue is that I'm not a native english speaker, and I struggle to understand words inside this profiler
I'm not sure anything anymore
Yes, timeline is usually what you need to look at. Then you can select specific points in the timeline to investigate further.
the title says memory performance
there are things like total accessible memory, total accessible optimal memory, peak used memory
etc.
I don't even know what these mean
total physical page allocations
Anyways, you could also try using the regular unity profiler(not the memory one) with the memory module and reproduce the crash. It should keep on recording until the very crash.
This should all be covered in the documentation.
maximum allocation size, minimum free depth, allocation count, free count
well, maybe somewhere, I couldn't find
Max allocation size sounds like a relevant metric.
really?
why?
I checked the doc again
this doc again assumes that I already know everything related to memory, and I should just use the tool
Because it's telling you the max allocated memory at a point of time?? I don't know for sure. This would be heavily context dependent and covered in the documentation.
it doesn't try to teach me the basics
I'm sure it at least explains what each metric is about and where to see the allocations.
well, that doesn't seem to be useful, because 99% the Memory Profiler also tells the same values. I didn't even check, because I'm sure they are the same
That is true for sure. But you can learn the basics separately.
memory profiler can at least identify unity related stuff
but this native thing won't be able to tell me those I think
Well, do check. The fact that it crashes after some time in a scene is clear indication of an ongoing memory leak.
It would be able to tell you where the allocations originate from. This is the most important part.
Is it possible one of the various testing measures to try and clear memory could also be problematic in certain varying contexts that might appear throughout longer sessions?
not to throw another potential problem in the mix, just a thought
so the native tools could identify even the unity objects generating more objects?
@untold moth there's a leak for sure, but not the leak is the worst. The game itself uses too much memory even when only any gameplay map gets started
so even the leak would not cause that much issue, if the overall memory reservation would be much less
what is too much
I won't be able to tell you concrete values from just my head
It could definitely tell you how many allocations there are and where they originate from. And if unity bothered doing some instrumentation, there would be even more info.
I didn't write those data down anywhere
I have 10 gb memory on a platform
and the game is constantly eating around 10 gb on all platforms
If it's a timed leak, it would accumulate over time and cause a guaranteed crash.
I know, but even when I start the game, the memory reservation shouldn't be right around 10 gb
Ok, then identify the category that eats most of the memory and optimize that.
it should not always lurk around the very edge
already did that with memory profiler
at least I understood memory profiler much better than the native tools
So far you were targeting very small things from what I've seen though.
How much memory is occupied by textures? By meshes?
These 2 usually eat most of the memory.
what happened to this

If there's something else, it's likely an issue.
that's what I try to decrease, yes
If it is textures, you can reduce the base min mip level. This is very common on consoles. And it would solve your issue immediately.
Consider texture streaming as well
already did that weeks ago
both texture streaming
mipmap resolution
and it did solve a lot about stability
but textures looked horrible, because it decreased resolution everywhere
then I only decreased resolutions where it was not recognizable
also disabled Read/Write
And you're still getting crashes, meaning it's a memory leak.
So either use the native profiling tools, or at least the timeline profiler(the regular one) with the memory module and reproduce the crash. Then look at the latest slice of data.
Or monitor the memory consumption and pause execution when it's about to reach the limit. Then make a proper capture.
zero idea how to do that
memory is not increasing by 1 kb each time
Well then monitor it and see how it increases. At what timings. Let the game run in the heavisets scene for some time, then look at the profiler timeline.
It shouldn't increase in the middle of a scene when you're not doing anything. If it does, that's the leak.
@untold moth what I've seen is that after I fixed 90% of texture memory leak (which was huge), I still had native Reserved memory leak (around 1 gb), that was the ALLOC_DEFAULT thing I mentioned days ago.
I think - but I'm not sure - this was because of the million static fields holding stuff in memory. There are gameplay related codes using static fields. But I couldn't identify 1 thing which holds a lot of memory. Instead there are literally like 100 or more which does this. And unfortunately I have no time enough to check and fix all of these. Especially since I can easily f*ck things up if I don't understand how and when to set something to null.
about texture memory, I measured that and the difference was not much after my optimizations
I mean I solved the texture memory leak
and it was mostly because of the addressable bundles were not released correctly
You can at least see the allocations by category and assume where the leak is coming from.
is it still leaking? yes. But that's not much anymore, and I don't really have any idea how to release those, because some of them were held by fields I have zero idea how to set to null without f*cking things up
Static fields by themselves are unlikely to cause a leak.
from the Native- Reserved?
I can only see its around 1 gb and nothing else in Memory Profiler
This is not a leak. This is reserved memory. It wouldn't cause an issue. Unity would just reuse it.
The issue likely happens when this reserved memory is all getting used and the project still needs more.
Which is why I'm telling you to profile at crash time.
but how? if I can't attach anything to it?
Use the regular profiler as I said many times by now. It records a timeline for as long as it can.
Or even better - learn to use the native tools
okay, then I wonder how much back and forth email will be needed with the devs of the NDA platform to be able to understand how it works
I really don't have time to learn everything about memory, because I should already know these
You don't need to send emails. You need to read the docs and google stuff that you don't understand.
You had like 1 month. This was more than enough time to learn properly
You can probably spend a day or two to learn all the underlying concepts properly
And then solve the issue quickly.
Indeed
The normal dev workflow is:
- investigate
- learn/research
- investigate
- fix
- evaluate
- repeat
You seem to have skipped several of the steps and got stuck in a counterproductive loop
There's no point panicking. The issue is not gonna solve itself. And the shortest path to success takes some time.
Cutting corners is only gonna make it worse.
do you think everything was counterproductive I did until now with this task?
Maybe not everything. But it does feel chaotic from the conversation so far.
There's a lot of details that we don't see, so it's hard to make any proper conclusion.
But it does feel like you never investigated the actual cause of the issue.
I could have explained everything better with images I made from memory profiler from the start
but its time consuming to make screenshots, because I don't have Discord installed on my company PC
And started jumping to conclusions based on only assumptions
so I usually just jump back and forth from company PC and notebook
Unconfirmed assumptions are the the worst enemy of a programmer.
I've investigated it as much as I could, there were a lot of things which were not straightforward for me in Memory Profiler even with the texts it writes. Most of those texts were very confusing to be honest (for a non-native speaker)
trust me I knew textures were leaking
those were not uncomfirmed assumptions
and I know for sure (from measurements) that they are still leaking
if they are not unconfirmed why do we need to trust you
but I found it extremely hard to fix all of the leaking textures from the References window
not unconfirmed = confirmed
also, no offense whatsoever, why would we trust you when you are very new to this
Like even now, you're saying that there is a leak for sure, but you never shared any definite proof
because its hard to make a screenshot fromthat screen
1000~ ish texture cound when I'm in main menu
1400~ ish, when I return from gameplay to main menu again
The first time you enter the menu?
and I cleared up the 400
What about the third time?
yes
This doesn't prove anything
that would be weird if it would not prove anything
It could stabilize after the second transition.
A leak is when it would increase every time you repeat that action
and it stabilizes almost entirely, yes, but by that time its already almsot too late
it gets increzing though
so its leaking
third time its leaking
forth time its leaking
not much, but its leaking
but even those 400 is too much, because it should be the same
it's not about how much in isolation, it's how much per same loop
Well, then it's not a leak. Many systems might initialize when you load the level and keep their state as is. This is normal.
okay, then I have zero idea by now what the hell is happening...
Then share a comparison of 2nd and 3d time.
you have made it very clear you don't even have close to enough insight on the codebase to say something like this so confidently. (This doesn't mean it's not true)
I compared snapshots with the Compare Snapshots button....
there was 1 gb difference in textures
The ones you shared were between 1st and 2nd load from what I understand
Yes, things that need to be loaded only once might have loaded. It doesn't mean that they would keep on loading.
since there were a week when I couldn't even return to the main menu from gameplay
that was already much
Then that was a separate issue: namely consuming too much memory for the platform.
isn't it a leak if main menu by default doesn't have FX and stuff, and when you return from gameplay, there is?
It is not great, but if these objects are gonna get reused or released on the next scene transition, it's not huge problem
This is not called a leak
I mean, technically it is, but not a permanent leak.
Now crashing in the middle of the scene after it's running for a while does sound like a real leak
in the beginning this much leak was already enough to break the game
and this is what I've solved until now
Fair enough. But I understand that you're dealing with a different issue now
dlich mentioned it before but very curious what the texture counts for in level/game 1, in level/game 2 and main menu 3 are
The way I understand it now there are 2 issues:
- you are in the middle of porting the game to a platform and just discovered that you are way over the memory budget.
- you have an actual leak over time in some scene.
The way you explained the issue initially mixed these 2 separate issues into one and made it difficult to provide you with a proper solution
I try to solve both at the same time
That's not correct. You don't try to solve both at the same time.
ok 😄
You shouldn't I mean
Im going to guess addressable issues have not been addressed fully so that doesnt help but if over memory budget then you have to cut down or remove things.
Chinese font too big? Lower its texture res and character size (to fit the same in a smaller texture)
Too many textures? remove some effects on this platform and suck up it looking worse or combine certain textures by using all channels (avoid RGB tex just for roughness/smoothness for example)
addressable couldn't be freed up any better
I created a separate manager to collect all AsyncOperationHandles
and I collect them based on the active scene
and I release all of them which were created on certain scenes
But what happens then if you keep loading things in a scene for ages?
at least I can't find any assetbundle references in the Memory Profiler for the textures left in memory
and 90% of them gets cleared
currently I just wanted to solve scene switching, not one scene loads
I only point this out in case you say show effects temporarily/rarely but their assets remain loaded
yeah, there are some
Then that illustrates that in some places, releasing loaded assets when destroyed/no longer used will help free resources
Is the heightmap data pulled from the Terrain's heightmapTexture field and GetHeights just poor?
Something like this
var data = terrain.terrainData; int tileRes = data.heightmapResolution; var heights = data.GetHeights(0, 0, tileRes, tileRes);
I've spent the past week fudging around with trying to map the terrain heightfield from unity, onto a physx scene.
On slopes I'd see differences of up to 0.5 + units.
Only after i created my own exporter that raycasts every point in the world, then generate my own heightmap from that did it end up matching. This takes quite a long time though.
Am I missing something with the heightmap? Does unity do something special to it when actually mapping it to physx? I know the sample height gets ran through bilinear interpolation, but I can find nothing about the actual heightfield collider that unity maps.
And the terrain in question was generated via the terrain tools in unity, not one I imported manually.
Curious, anyone else has worked on any server authoritive movement? What did you do for your terrain if not using the GetHeights/heightMapTexture?
Would it be an acceptable solution if the player needs to restart the game when language switching happened?
because I can't get rid of the unused 700 mb long font texture atlases other way
from memory
Sounds perfectly acceptable.
I think when I tried to play the last Call of Duty it restarted several times before I was able to play 😄
hmm ok
You should check the platform technical requirements. They might have a rule against doing something like that.
having a bit of an issue coding for my own game engine, so in one of my scripts called RagdollXEditor i have a namespace Ragdoll. in my Program.cs i’m having an error with using Ragdoll; that’s not my main problem, my main problem is this. “var editor = new RagdollXEditor(GameWindowSettings.Default, nativeWindowSettings);
editor.Run(); So for the RagdollXEditor thing above it’s getting an error saying it couldnt be found i’m using vs code. C# OpenTK and ImGUI.Net
why are you asking in a unity server 😆
i have no idea
i just need help😭
i’ve even tried the smartest C# ai as my last resort and he couldn’t fix it
If the smartest C# AI couldn't solve it, it means it's an impossible issue. /s
There is no off topic (non-related Unity) development questions allowed here.
So im working on a 2D game and I have a "public class ContextTrigger : MonoBehaviour" that i inherit to another class "StaticNPC" which is basicly a conversation starter when the player walks into a triggerzone and presses up.
here below is the ContextTrigger base. it sets a ACTION that gets called when the player steps into the trigger area. this action is ActivateInteraction();
BUT this does not Set the Override version of the ActivateInteraction(); is there a way of triggering the override version from the base script? or do i need to re-think parts of this code?
    {
        if(other.gameObject.CompareTag(TAG))
        {
            // Get the player reference for this specific trigger instance.
            _playerReference = other.gameObject.GetComponent<Player>();

            if (_playerReference != null)
            {
                _playerReference.ContextStore = () => ActivateInteraction();
                Fade(true);
            }
        }
    }

    public void OnTriggerExit2D(Collider2D other)
    {
        if(other.gameObject.CompareTag(TAG))
        {
            // If the player that is leaving is the one this trigger is tracking,
            // and that player's current interaction is set to this trigger, clear it.
            if(_playerReference != null && _playerReference.ContextStore != null)
            {
                _playerReference.ContextStore = null;
            }
            Fade(false);
        }
    }

    /// <summary>
    /// This method is called by the Player. Child classes will override this
    /// to define what happens on interaction.
    /// </summary>
    public virtual void ActivateInteraction()
    {
        Debug.Log($"Interaction activated on {gameObject.name}, but no action is defined in the child class.");
} ```the override for that instance will be called always so the base type can call ActivateInteraction() if you expect it to be overridden in sub classes.
Your lambda should still do this as it captures "this", it is not a function pointer like you can do in cpp. Have you debugged with a debugger and seen something else happen?
If i were to do this, id just assign the class ref instead of the function to a delegate. An interface may be a better choice for this.
I tried both wrapping in a anonymous method like in the code above and _playerReference.ContextStore += ActivateInteraction; but both ways do only call base class method. Which is funky... Maybe I'll just go with standard delegate instead of Action
Action is just a delegate type made for you, won't make a difference
Hnmmn
Did you use a debugger then to verify what you saw? virtual functions should not work as you described, Hidden functions can
I have not but will do as soon as I'm not about to fall asleep 🙃 thank you BTW. I will look at the debugger tomorrow
fixed it
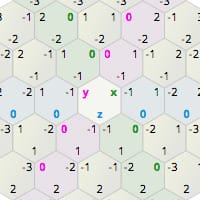
Hello unity community. I got stuck on something for 2 days so now I'm here asking for assistance.
I am using a unity hexagonal tilemap. I want flat-topped hexes, which I assume is my downfall, because unity uses really weird offset-coordinates, and also flips the x and y axis, since it isn't confusing enough.
Attached is a small preview of coordinates.
I now already managed to implement A* pathfinding somehow and it works, so I'm not touching it anymore.
The issue comes next. For projectiles, I want to implement a "line of sight". This function would receive a start and end position, and return a list of positions that are touched by a line drawn between them.
This does sound pretty easy, but a mix of unity confusion and skill issue led me here.
https://www.redblobgames.com/grids/hexagons/ this document helps in general with hex grids
https://zvold.blogspot.com/2010/02/line-of-sight-on-hexagonal-grid.html This document describes the exact behavior that I want, even has another source with some more descriptions of the algorithm, and even though I now understood how this adaptation of the Bresenham line-drawing algorithm is supposed to work, I cannot get it running.
Do you have any tips/more documentation on this problem?
Should I just cut my losses switch to a self-managed hex-grid? Any good versions of that?

Amit's guide to math, algorithms, and code for hexagonal grids

I too have gone through the pain of doing exactly what you're doing - translating redblob games hex algos into Unity's cell coordinate system. It sucked.
What you need basically is a function that takes a coordinate and can give you a specific neighbor tile in a chosen direction. Once you have that, then you can follow the redblob algoirthm exactly.
For example they have stuff like this in the code examples:
get UP_LEFT hex```
You need to write a function that can do that for all six directions (UpLeft, Up, UpRight, DownRight, Down, DownLeft) for a given hex, then just write the code as per their algoirthm using that functionThe way I managed to do things in my game was just to write functions to convert unity coordinates to redblob's cube coordinates and back. Then i was able to use the algorithms from redblob directly.
if you do that conversion - you can use the functions from the Neighbors section of redblob to get neighbors, do line drawing (which would work for LOS) etc..
something like this?
    private static readonly Dictionary<EDirections, Vector2Int> evenColDirections = new()
    {
        { EDirections.NW, new(0, -1) },  { EDirections.N, new(1, 0) },  { EDirections.NE, new(0, 1) },
        { EDirections.SW, new(-1, -1) }, { EDirections.S, new(-1, 0) }, { EDirections.SE, new(-1, 1) }
    };
    private static readonly Dictionary<EDirections, Vector2Int> oddColDirections = new()
    {
        { EDirections.NW, new(1, -1) }, { EDirections.N, new(1, 0) },  { EDirections.NE, new(1, 1) },
        { EDirections.SW, new(0, -1) }, { EDirections.S, new(-1, 0) }, { EDirections.SE, new(0, 1) }
    {


    private Vector3Int OffsetToCube(Vector2Int offset)
    {
        int x = offset.x;
        int z = offset.y - (offset.x & 1);
        int y = -x - z;
        return new Vector3Int(x, y, z);
    }
    private Vector2Int CubeToOffset(Vector3Int cube)
    {
        int col = cube.x;
        int row = cube.z + (cube.x & 1);
        return new Vector2Int(col, row);
    }
Maybe I need to redo the conversion functions, and then translate more closely. I've tried, but every time I get back really wired data, an then am unsure what the issue was. I guess I need to go a bit slower.
Not sure, I wouldn't be able to tell you off the top of my head. I recommend writing unit tests for it to make sure you are covering all the edge cases, this stuff can get very confusing.
ChatGPT may be helpful here too
Thanks. Did using unity hexes cause any more issues down the line?
nope, a bit too dumb to understand these coordinates unfortunately
Once I had the conversions set up (sorry it was an old project and I lost it) then I had no issues with the coordinate systems anymore
no worries. I will try again tomorrow...
Tryign to create a texture array for normals but the normals seem to change colour in the array, is that normal? They are marked as normals before adding them to the texture array, they are purple in my asset folder but in the array they are brown looking
i assume its just how unity displays texture arrays but im not sure
oh just noticed the albedo is also the wrong colour in the array 🤔
The texture array would need to have the same format/compression/srgb flag and other settings as the original texture/s.
Funny, but I'm working on a material merging tool that also uses texture arrays right now.
In unreal engine though
what is the correct format for normal textures? i fixed the albedo one by using RGBA32
which will be hard to find
Ideally, use the same format as the source textures. I think rgba32 should work. The compression format is more important for normals.
your job is hard, you still gotta do it 😛
@untold moth this is what i do
albedoArray = new(_textureSize, _textureSize, textureSets.Length, TextureFormat.BC7, true);

normalArray = new(_textureSize, _textureSize, textureSets.Length, TextureFormat.BC7, true, true);

for (int i = 0; i < textureSets.Length; i++)
{
    var set = textureSets[i];
    AssertIsValid(set);
    for (int mip = 0; mip < set.Albedo.mipmapCount; mip++)
        Graphics.CopyTexture(set.Albedo, 0, mip, albedoArray, i, mip);
    for (int mip = 0; mip < set.NormalMap.mipmapCount; mip++)
        Graphics.CopyTexture(set.NormalMap, 0, mip, normalArray, i, mip);
}

albedoArray.Apply(false, true);
normalArray.Apply(false, true);
albedo works fine, normals however the array does not show purple maps like you would expect its more orange looking
this is how it looks

I'm not sure bc7 is an appropriate compression format for normals
Compare to the original textures.
but thats what the normal map asset says in inspector

so im very confused
Hmm... Is it the missing UNorm that is the issue?
Maybe but I see no texture format for it so I'm unsure
Is there not format_UNorm format?
No seems not
There is in the docs:
https://docs.unity3d.com/ScriptReference/Experimental.Rendering.GraphicsFormat.html
Oh different enum, why do they have two enum types
The other one is very old afaik. Back from when unity didn't want you to mess with too low level stuff.
I'm trying to use Unity.Serialization to deserialize a JSON file
I have a custom IJsonAdapter for one of my types and inside of it I'm trying to trigger the default deserialization for another type, which is one the values inside a dictionary:
            SerializedMemberView firstVersion = versionsObject.First();
            if (!int.TryParse(firstVersion.Name().ToString(), out int firstVersionKey)) {
                throw new FormatException($"Invalid version key: {firstVersion.Name()}");
            }

            T? firstVersionValue = context.DeserializeValue<T>(firstVersion.Value());
and this is the JSON:
{
  "versions": {
    "1": {
      "attackAllowed": true
    }
  }
}
the firstVersionValue object is created, but not initialized with the correct value (attackAllowed = true)
any clues on what could be going on?

why this window always come up like 4-5 times, when I just try to write scripts?
its extremely annoying
and causes the whole sln to reload multiple times after each other
I don't think thats from Unity
that's from Perforce, but didn't think its taboo on this channel
id presume the connection settings are wrong so it keeps asking (or the connection fails/is refused/is blocked)
It's not a taboo. It's just that not many people use it. You likely have a VS or unity plugin that tries to log you in.
connection is not failing, this is why I'm surprised
if I make a build, it pops up
if I make a new script, it pops up
Is there some unity svn plugin triggering this, or it detecting file changes ?
I'd investigate if it comes from the ide or unity first. In both cases I'd avoid using the plugin(as I heard it's terrible) and just use the standalone client.
no idea
hey @echo coral do you know if i can test my ads with mediation in unity simulator?
Probably depends if the ad platform supports pc/mac/linux ads. levelplay probably does somewhat. Then it would depend on the platforms set up for the ad types. Guess you can try?
I'm using android simulator They have a test suit that already worked on the physical device and emulator (bluestacks), but I would like to have the debugger to do some tests so I wanted to run it on the Unity simulator.
This test suit don't work in simulator and I don't know if i've to do some additional configuration
what is "unity simulator"

there are android emulators
is that simulators
yea thats the unity editor my guy
simulator just changes the screen size + safe area emulation
I'm going to use Android's logcat and Bluestacks to test it, so it would be cool if these things worked in the "editor", it would save a lot of time.
You can use the level play test suite to show ads easier (if using it) and you can use logcat OR the unity console on dev builds to see logs
you can also enable debugger support for dev builds
yep, i'll do that on bluestacks, bcz in editor the test suite dont work
and sorry for my bad english haha
Yea dont expect any of this to work in editor unless it states it can show ads on desktop
i think im losing my mind or just being thick. i have StaticNPC assigned to a Gameobject in my unity scene StaticNPC inherits ContextTrigger and when my player passes into the collision2d trigger it should trigger the protected virtual void OnPlayerEnter(Player player) method which i have done a override on in StaticNPC. but it triggers the base class version... why is this?
So StaticNPC.OnPlayerEnter() is not called?
no it is not
to make sure you arent making a mistake, change it to abstract in ContextTrigger (will require ContextTrigger to be abstract too)
There is no good reason I can see why this wont work, its virtual so the override will be called (dynamic dispatch) for an instance of StaticNPC.
ok... found the issue. i load chunks of levels into the main scene and where i was trying the trigger the staticnpc trigger was not correctly set up and there was a base contexttrigger gameobject at almost the same place that i never noticed until i tried setting ContextTrigger to abstract class and got a error message when it was loaded into the scene. i was immensely confused about why things where not working correctly... #"%!)¤!&#))¤%/
@echo coral thanks you, managed to help me find my brain 😄
Glad to help, abstract is great for situations like this where you want to enforce a function override.
Also remember you can give a context object for logs to help you locate what prints it!
optional homework: read up on dynamic dispatch and "v tables" https://en.wikipedia.org/wiki/Virtual_method_table
woooh
will do
for regular models that are imported into a unity project, is it possible to write like an asset preprocessor script where I can actually modify the vertex attributes of an imported mesh?
for example, I have some mesh assets that I might want to make lighter weight in terms of memory

and for vertex attributes, I would like to take the mesh of this imported model and bump all of these from float32 to a half float16
but is that possible to do with this? and the imported mesh will have the specified vertex attribute precison? or is it a little more complex in that I would need to save an additional optimized mesh asset alongside this?
have a look at https://docs.unity3d.com/ScriptReference/AssetPostprocessor.html and specifically https://docs.unity3d.com/ScriptReference/AssetPostprocessor.OnPostprocessModel.html. You can modify the assets, including mesh data, on import as you like
It mentions on the docs you have full control, I am hoping that for example I don’t need to mark the model as Read/Write on import correct? I can just work with it directly in that case?
the mesh seems to be readable regardless of the read/write flag during this step, which makes sense to me
I’ll go ahead and give it a shot and give ya a holler in case not
I got a 150-line Python script that scrapes data from the Jikan API
can i post the whole thing here
Does this have anything to do with Unity?
Yes, it's for a card game i'm making in unity
Unless it's directly in editor, related to Unity, then it's not appropriate here. If you need python help, find a community for that.
I have most of my balancing information in the form of scriptable objects (some are on prefabs in the resources folder). To help my game designers, I want to ship them the finished binary of the game and have the balancing in a separate json file, that is used to change the scriptable objects (and probably the prefabs) data. This seems like a common problem. Are there standard strategies to handle this case? What is a good system? Addressables, or too much work for that? Or do I need to write a custom C# script, that runs before anything else? How do I set this up?
if you have a separate json file, something must process this json file. changing the SO's or prefabs isn't really something you'd want to do.
The easiest thing I could imagine would be loading all the scriptable object data to a collection and treating it like a database. If the json data is supposed to overwrite some scriptable object, then overwrite it in your collection.
What would speak against changing the SO's?
changes dont persist in a build and arent guaranteed to persist throughout one session. If your scriptable object gets unloaded, it will reset back to the values defined initially. At least thats how it works from what ive read.
I've never seen talk about doing this on prefabs so im not sure if this works the same.
it's best if you can avoid doing this
Oh, interesting. Thank you!
Hello there!
I started having an issue out of nowhere.
I am using the latest unity 6 lts. and when I click play, Unity just freezes and becomes non responding. No error messages, nothing. Just complete freeze to the point where I have to end the task on windows.
Any ideas???
Thanks!
Likely an infinite loop in your code. What have you done to debug it?
I tried debbuging and adding breakpoints and all... reseted unity a bunch of times... updated burst... ehehhe
at the end I just reverted to my last commit, which was fine.
luckily I commit very often and was much to redo.
thanks anyway.
well it does sound like you had an infinite loop somewhere if reverting fixed it, and just didn't put a breakpoint inside the loop so it never got hit
I don't know what you expected tbh, you provided virtually no info besides Unity version
not following... I even thanked you buddy. Its good.
Hello there
does anyone know a way to check how much memory each part of a projects code takes in a build?
We've run into a pickle on consoles where "faster runtime" causes the build to hit a memory limit
And since we cant really look into a console build that well we wanted to check on PC first
You might be able to see it in the Memory Profiler.
https://docs.unity3d.com/Packages/com.unity.memoryprofiler@1.1/manual/index.html
Newer Unity versions will show more details with this package.
2021 is limited, should all work 2022+
There are console native tools that should show you more info than unity. Assuming the project/engine is instrumented for them correctly.
i think this is asking about binary size rather than RAM, having run into the same problem lol. you may have to dip into your platform's native SDK tools if you want to get detailed info, but for a very rough guess you can see take a look at how much IL2CPP code unity spits out for each type
turning on "faster runtime" disables one huge optimization in how code is generated for generic type instantiations, so you'll likely see a huge increase from that
Note that when the “Faster (smaller) builds” setting is enabled only the single fully sharable version of generic code is compiled. This reduces the number of methods generated, reducing compile time and build size, but comes at the expense of runtime performance.
There is also IL2CPP metadata stored in memory for Reflection. I'm not sure if the IL2CPP build setting will affect how much is stored there, but it's conceivable.
yeah, but that's more a regular memory issue - due to [mystery console OS reasons] the binary size specifically is very important
Id guess other assets use more space in the built binary. Have you checked the build report (and addressable report if used) to check included asset sizes?
assets aren't included in the binary, just code
i'm pretty sure even on those platforms there's a separate binary, like android archives do have a binary file in them separate from the assets
things other than code will be loaded into memory such as audio so i dont see the problem with checking more than code
regardless they can use the tools avaliable to find out more regardless of what i say 🤷♂️
this is about a console platform though, and without getting too deep into it, i'm pretty sure this person is asking this question specifically because binary sizes matter on that console
it's not just a total memory usage or package size problem
Then my suggestion is to reduce il2cpp options such as stacktrace info level + what others said
It is possible to provide compiler options for other platform compilers too so this could also yield improvements by reducing in lining for example (or ensuring debugging info is stripped as this may not always be the case)
why is that incremental build takes 10+ minutes to finish?
I'm 100% sure I didn't change that much since the last build
Question using StaticBatchingUtility.Combine to combine meshes to boost the FPS

I already use chunk system, https://discussions.unity.com/t/why-is-staticbatchingutility-not-completely-combining-all-of-my-meshes/170156 according to the answer I might not benefit from staticbatching because I already used all the verticies count for a single batch call
I thought about using "Graphics.DrawMeshInstancedIndirect" to render each individual faces but I can't do it because I need to modify each vertex to smoothly express the terrain

I don't think I can further optimize these terrain unless I do some crazy compute shader thinging and maybe send terrain info to gpu and generate vertexs from there and stuff. Let me know if I am missing anything
2nd issue I have, entities, I have lots of entities in my game and they may MOVE or not (trees and plants do not move but birds might move)
I intend to use simple 3d models (as you see in the image) to represent objects in the game.
I believe in this case, the best approach is to use Graphics.RenderMeshIndirect for trees grass flowers and such (even for moving ones perhaps)

SOME entities have very individual distinct look (my game is basically 3D Rimworld/DwarfFortress) and I believe for those distinct entities, my best option is just rendering them without tricks.
Any feedback is appreciated, I really need to work on this because now I am appraoching like 3M tris (tears) @cobalt ember
Do you actually have a performance issue at this point?
Don't try to solve problems that you don't have
I don't see any problem from looking at the stats
let me re-do the rendering
In this case profile the real in game scenario and investigate what the bottleneck is
There is not much going on right now excepting rendering and it is eek
Rendering is not 1 solid thing. There are many moving things both on cpu and gpu. Many possible bottlenecks
Which is what you want to investigate.

this is only half of the world unfolded and 4 M tris and dropped 100 FPS from 600 FPS
my game is literally not much going on right now except this, this is the issue
So it sounds like there are a few issues:
- draw calls count
- vertex count
You'll need to profile properly to find out which one is the main bottleneck right now.
If you expect both of these to scale, you'll need to address both of them.
yes both of them are issues
and they are related to each
I feel like I am just re-stating the problem question I already did
Well, no. You started jumping to conclusions. And bringing up manual draw calls from code.
Anyways, if you're using urp 17+ with forward + rendering path, and have a lot of repeating models/materials, using the resident drawer feature would basically solve the draw call count issue. That's a CPU bottleneck.
Vertex count can only be solved by using some form of LODs or limiting the drawing distance(possibly by layer, so that smaller objects are not drawn after a certain distance). That's a GPU bottleneck.
How to minimize untracked memory? and what is it ?
It depends. I think usually it's just reserved memory that unity doesn't use for anything specific at that point.
ps4, untracked memory 55%, I use memory profiler snapshot, it same in main menu and gameplay