
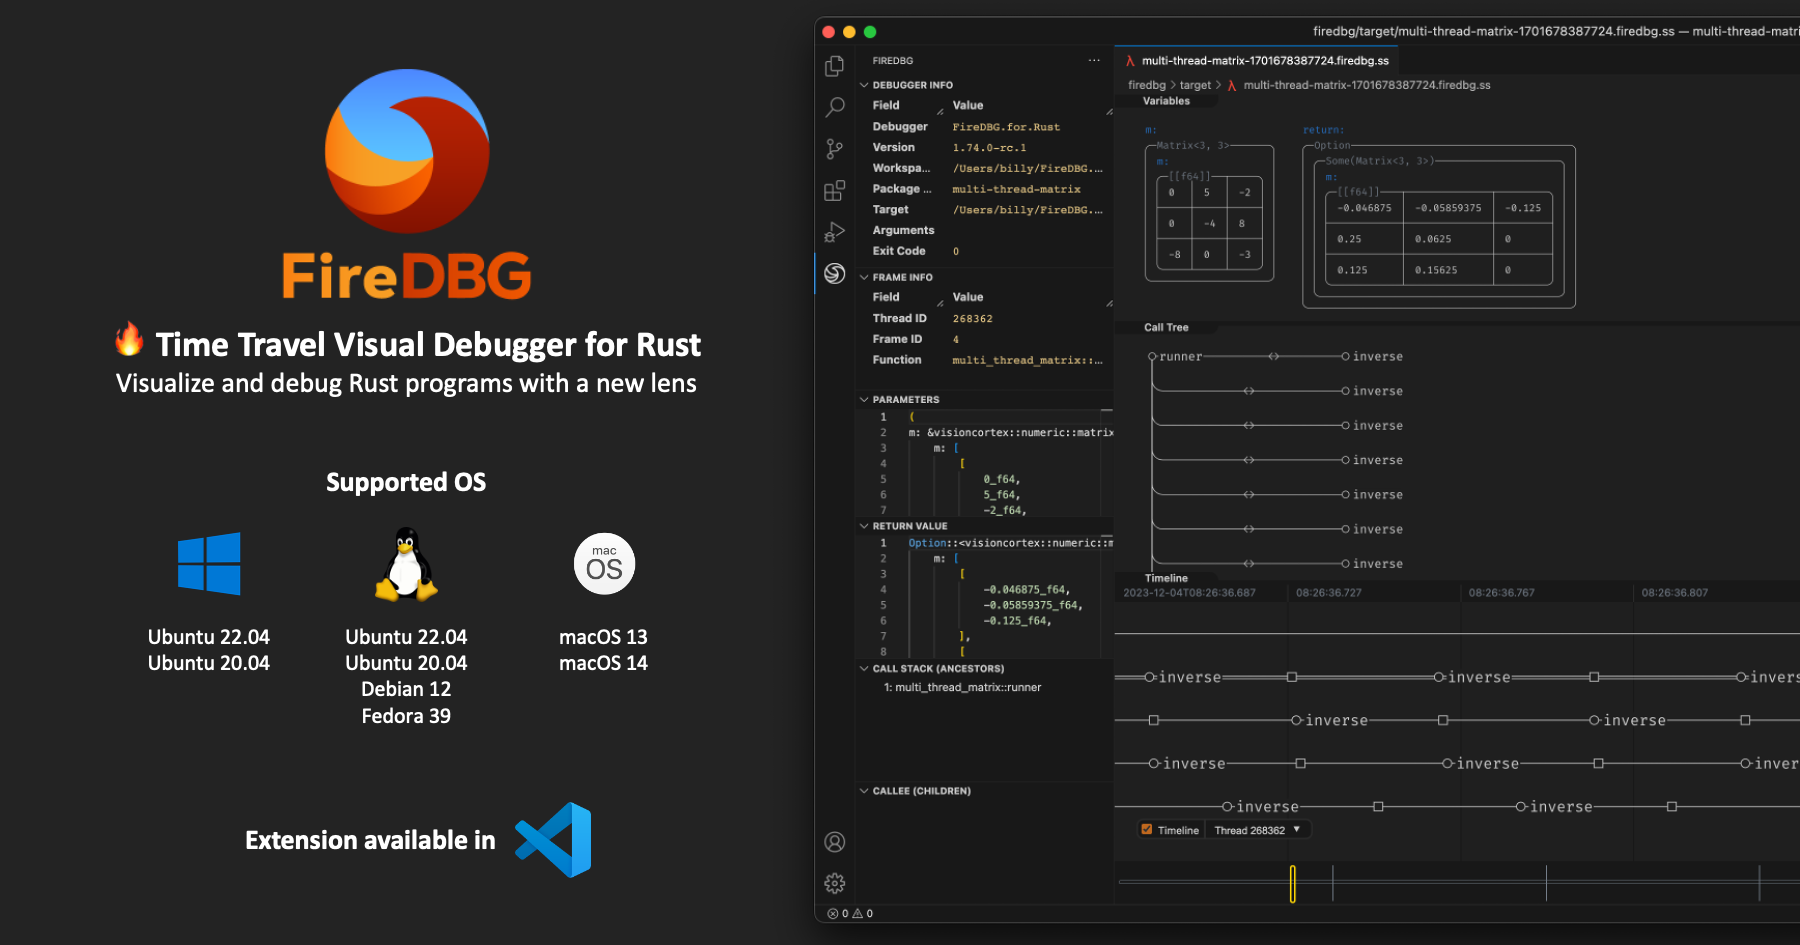
#FireDBG – A Time Travel Visual Debugger for Rust
67 messages · Page 1 of 1 (latest)
This looks really interesting
We’ve been working on this debugger just about a year now. Time travel debugging isn’t a new concept, the new idea here is to use call tree visualisation to help us navigate the debug trace.
It supports various Linux distros on x64 and macOS on x64 and M1. It’s only available for Rust right now, but we do want to bring this debugging experience to other programming languages. Please give it a try! Would love to know your thoughts.
I'm afraid I can't get it to work. The farthest I got was it complaining that my builds are optimised (which they are not)
In this blog post, we will cover the basic usage of FireDBG VS Code Extension ("the Extension") and FireDBG CLI ("the CLI"). By the end of this tutorial, you will learn:
Maybe try and download the Testbench?
followed that. it runs, it just doesn't work
warning: day11 was compiled with optimization - stepping may behave oddly; variables may not be available.
I get this and an empty ss file
Yes
Hmmmm this is odd
It does with in the testbench, but not in my projects
No async
Is it a binary, example, unit test or integration test?
A binary
Try executing RUST_LOG=trace firedbg run <BINARY>, it should show all the breakpoints info etc
Any breakpoints?
not that I can tell
I'll push the branch i mutilated for this so you can have a go and see if there's something weird
(mutilated because most of the code was on nightly, which you don't have a build for)
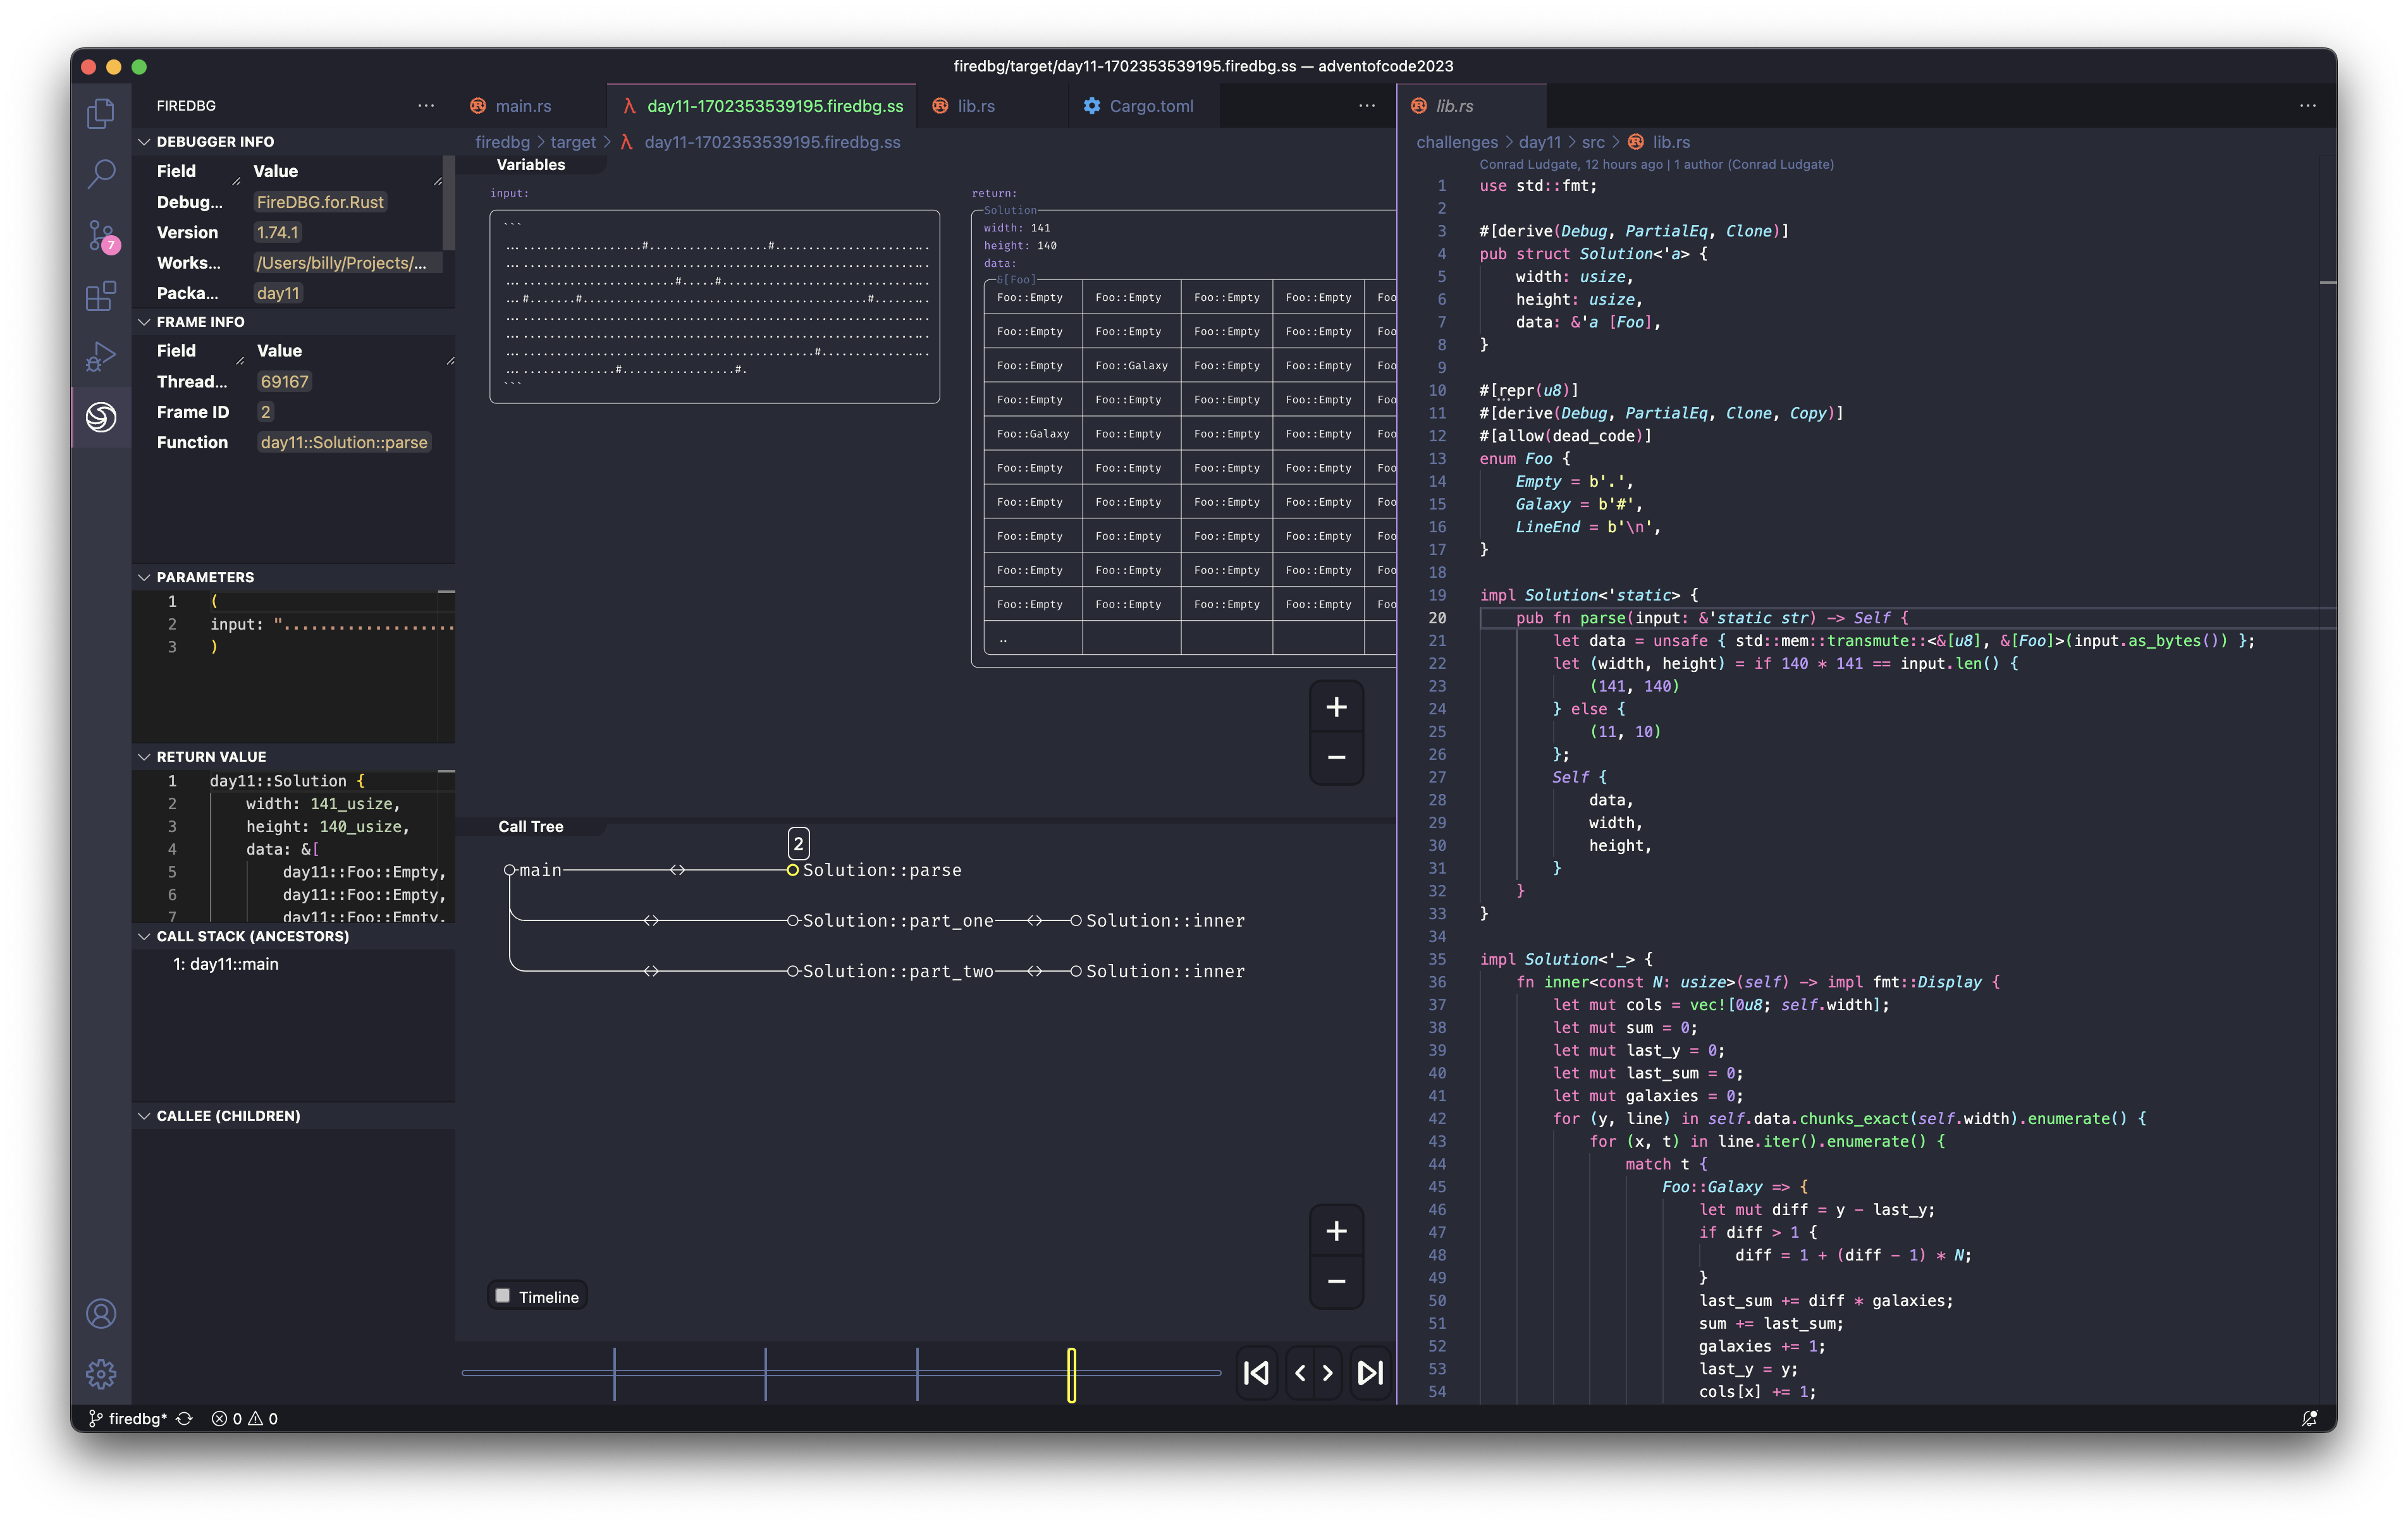
https://github.com/conradludgate/adventofcode2023/tree/firedbg spoilers for aoc within
looks cool!
it doesn't have a license, what are you planning here?
I gotta go, don't have time to debug further, but I really like the idea and best of luck in the future
Thanks!! Appreciated the help
We will get back to you
woooo amazing stuff!
This looks really interesting, I'm curious to see how far this can be pushed
That's really impressive, I will try it later today. Just a quick question, it only works for VS Code? @steady geyser
Hey @toxic coyote, thanks for helping! We found a small bug.
https://github.com/SeaQL/FireDBG.for.Rust/pull/5
Aha! Yay 😄
Hey @edgy hawk, you can use the CLI to drive the debugger. But you need the VS Code extension to view the graphics.
Hey @rotund dome,
It's licensed under either of
- Apache License, Version 2.0
(LICENSE-APACHE or http://www.apache.org/licenses/LICENSE-2.0) - MIT license
(LICENSE-MIT or http://opensource.org/licenses/MIT)
at your option.
Hey @fickle gate, try it and let us know what you think :)
Hey @toxic coyote, you can now download FireDBG 1.74.1 and try again!
curl https://raw.githubusercontent.com/SeaQL/FireDBG.for.Rust/main/install.sh -sSf | sh
Are there any plans to have FireDBG work with Windows using ETW or dtrace, both of which flamegraph can use?
awesome, thanks!
Thanks, it worked. I used it to debug an optimisation I wanted to implement for today's AoC and it made it very easy to understand a panic I was hitting
couldnt make it work on windows, its very problematic
Nice!! Glad to help :)
Hey @toxic coyote , I wonder what is the license of https://github.com/conradludgate/adventofcode2023 ?
Can the FireDBG team adapt it as test case? We will attribute the original work accordingly.
Hey @whole depot, can you elaborate? For Windows, you need to install the FireDBG in WSL 2 of Ubuntu 22.04 / Ubuntu 20.04
The code I will license as MIT, but the project binary and tests relies on the AoC input which is not mine to give a license for
it complains that theres no rust installed
The rustc command isn't in system path?
it is in PATH on windows but for some reason wsl cant see it
You should install Rust inside WSL 2
WSL is entirely separate from windows in that way
Yes
that's why the install script compliant Rust is missing
Shame I can't really use WSL2 at work 
i still cant make it work, i installed successfully on wsl2 but vscode still cant see it i guess because it's only on the wsl side and clicking "install firedbg cli" on windows doesn't work because it tries to install from windows terminal
U need to remote into WSL2 on your vscode
making some progress, now im stuck here, there's no option here shown in the guide

Hey @whole depot, check this https://firedbg.sea-ql.org/blog/2023-12-13-getting-started/#debug-targets-and-runs You should see the FIREDBG and FIREDBG RUNS panel at the bottom
i see them but they are empty
am i stupid or is this really that difficult to set up lol
Does this support windows?
i cannot get this to work. too complicated
This looks like a recolor of the seaorm logo 🤨
it's almost as if it's from the same project
How would a debugger be the same project as a database ORM?
check the organisation: https://github.com/SeaQL/FireDBG.for.Rust