#help-19
1 messages · Page 97 of 1
 warm nacelle

 odd edgeBOT
 Available help channel!
Send your question here to claim the channel.
Remember:
• Ask your math question in a clear, concise manner.
• Show your work, and if possible, explain where you are stuck.
• After 15 minutes, feel free to ping <@&286206848099549185>.
• Type the command .close to free the channel when you're done.
• Be polite and have a nice day!
Read #❓how-to-get-help for further information on how to ask a good question, and about conduct in the question channels.
 modest badge
ABCD trapezoid AB and DC legs cross in point E. Need BEC triangles perimeter if AB=4,BC=5,CE=7 and AD=12
odd edgeBOT
modest badge
ABCD trapezoid AB and DC legs cross in point E. Need BEC triangles perimeter if ...
 mystic saffron
modest badge
<@&286206848099549185>
mystic saffron
modest badge
<@&286206848099549185>
wait 15m
 viral forum
!help
odd edgeBOT
To ask for mathematics help on this server, please open your own help channel or help thread. See #❓how-to-get-help for instructions.
modest badge
.close
odd edgeBOT
Channel closed
Closed by @modest badge
Use .reopen if this was a mistake.
odd edgeBOT
Available help channel!
Send your question here to claim the channel.
Remember:
• Ask your math question in a clear, concise manner.
• Show your work, and if possible, explain where you are stuck.
• After 15 minutes, feel free to ping <@&286206848099549185>.
• Type the command .close to free the channel when you're done.
• Be polite and have a nice day!
Read #❓how-to-get-help for further information on how to ask a good question, and about conduct in the question channels.
 late wasp
 late wasp
(i) help
late wasp
too hard gonna come back to it i guess
 icy kindle
what is (2a)^3?
late wasp
sorry ill do this tmrw
odd edgeBOT
@late wasp Has your question been resolved?
Channel closed
Closed by @late wasp
Use .reopen if this was a mistake.
Available help channel!
Send your question here to claim the channel.
Remember:
• Ask your math question in a clear, concise manner.
• Show your work, and if possible, explain where you are stuck.
• After 15 minutes, feel free to ping <@&286206848099549185>.
• Type the command .close to free the channel when you're done.
• Be polite and have a nice day!
Read #❓how-to-get-help for further information on how to ask a good question, and about conduct in the question channels.
mystic saffron
 odd edgeBOT
mystic saffron
mystic saffron
odd edgeBOT
mystic saffron
mystic saffron

I feel like ive done something wrong because idk how to solve that integral
<@&286206848099549185>
odd edgeBOT
@mystic saffron Has your question been resolved?
odd edgeBOT
@mystic saffron Has your question been resolved?
odd edgeBOT
Channel closed
Closed due to timeout
Use .reopen if this was a mistake.
Available help channel!
Send your question here to claim the channel.
Remember:
• Ask your math question in a clear, concise manner.
• Show your work, and if possible, explain where you are stuck.
• After 15 minutes, feel free to ping <@&286206848099549185>.
• Type the command .close to free the channel when you're done.
• Be polite and have a nice day!
Read #❓how-to-get-help for further information on how to ask a good question, and about conduct in the question channels.
 wintry summit
How to do cot(15pi/4)+csc(19pi/6)
ive gotten to (cos/sin)(2pi+7pi/6)+(1/sin)(2pi+7pi/6) but do not know where to continue
odd edgeBOT
wintry summit
How to do cot(15pi/4)+csc(19pi/6)
ive gotten to (cos/sin)(2pi+7pi/6)+(1/sin)(2pi...
@wintry summit Has your question been resolved?
 desert marlin
wintry summit
How to do cot(15pi/4)+csc(19pi/6)
ive gotten to (cos/sin)(2pi+7pi/6)+(1/sin)(2pi...
desert marlin
wintry summit
How to do cot(15pi/4)+csc(19pi/6)
ive gotten to (cos/sin)(2pi+7pi/6)+(1/sin)(2pi...
now you can use the 2pi periodicity to remove the 2pi from the inside, since it will be equal with or without it.
also your parenthesis are still not great
but I can tell what you mean so I guess it's fine
once the 2pi is removed, then just use the unit circle
wintry summit
would the answer be 1
cause cos(7pi/4)/sin(7pi/4) would be (-sqrt2/2)/(sqrt2/2) or -1 and 1/sin(1pi/6) would be 1/(1/2) which is 2 which would be -1+2=1
desert marlin
show your work for how you got 1
wintry summit
wintry summit
cause cos(7pi/4)/sin(7pi/4) would be (-sqrt2/2)/(sqrt2/2) or -1 and 1/sin(1pi/6)...
^
desert marlin
no you made a mistake
it should be 1/sin(7pi/6)
not 1/sin(1pi/6)
you can remove multiples of 2pi, not just pi
wintry summit
i thought it would work with standard position
desert marlin
sin(7pi/6) does not equal sin(pi/6)
desert marlin
yes
wintry summit
which is -2??
desert marlin
yes
wintry summit
so answer is -3
desert marlin
yes
wintry summit
okk
desert marlin
good work
desert marlin
no problem
odd edgeBOT
@wintry summit Has your question been resolved?
Channel closed
Closed by @wintry summit
Use .reopen if this was a mistake.
Available help channel!
Send your question here to claim the channel.
Remember:
• Ask your math question in a clear, concise manner.
• Show your work, and if possible, explain where you are stuck.
• After 15 minutes, feel free to ping <@&286206848099549185>.
• Type the command .close to free the channel when you're done.
• Be polite and have a nice day!
Read #❓how-to-get-help for further information on how to ask a good question, and about conduct in the question channels.
 glacial pewter
 odd edgeBOT
glacial pewter
odd edgeBOT
glacial pewter
 clever fjordBOT

 mint marten
clever fjord
mint marten
clever fjord
QS/QR = 8/12 = 2/3
QT/QP = 10/15 = 2/3
odd edgeBOT
mint marten
QS/QR = 8/12 = 2/3
QT/QP = 10/15 = 2/3
As a helper, please do not give out answers that could be copied as a homework solution. Have the student work through the problem themselves and guide them along the way.
glacial pewter
 mint marten
QS/QR = 8/12 = 2/3
QT/QP = 10/15 = 2/3
mint marten
mint marten
QS/QR = 8/12 = 2/3
QT/QP = 10/15 = 2/3
you can also write the angles and see the similarity
odd edgeBOT
@glacial pewter Has your question been resolved?
odd edgeBOT
Channel closed
Closed due to timeout
Use .reopen if this was a mistake.
Available help channel!
Send your question here to claim the channel.
Remember:
• Ask your math question in a clear, concise manner.
• Show your work, and if possible, explain where you are stuck.
• After 15 minutes, feel free to ping <@&286206848099549185>.
• Type the command .close to free the channel when you're done.
• Be polite and have a nice day!
Read #❓how-to-get-help for further information on how to ask a good question, and about conduct in the question channels.
 shell stirrup
 odd edgeBOT
shell stirrup
shell stirrup
odd edgeBOT
shell stirrup
shell stirrup
this is correct right?
bcs when I work this out I turn out completely wrong, except im pretty confident that the steps after are correct.
 worldly parcel
Yes
 brittle beacon
(can you explain how you "turn out completely wrong" please? Worth noting that any solutions you find, you will need to discard x = 3 if you happen to find it, because dividing by zero and all)

 torpid owl
aren't you multiplying (x - 3)(14 - x), not (x - 3)(4 - x)
 fierce kindle
shell stirrup
bruh, im tired, i didnt even catch that, let me retry...
fierce kindle
shell stirrup
bruh, im tired, i didnt even catch that, let me retry...
lol I feel that
that 9 really looks like y lol
torpid owl
or g
shell stirrup
yep... well that solved the issue
A level maths and I cannot solve an easy equation, guess it's time to go to bed
Thanks for the help!
.close
odd edgeBOT
Channel closed
Closed by @shell stirrup
Use .reopen if this was a mistake.
odd edgeBOT
Available help channel!
Send your question here to claim the channel.
Remember:
• Ask your math question in a clear, concise manner.
• Show your work, and if possible, explain where you are stuck.
• After 15 minutes, feel free to ping <@&286206848099549185>.
• Type the command .close to free the channel when you're done.
• Be polite and have a nice day!
Read #❓how-to-get-help for further information on how to ask a good question, and about conduct in the question channels.
 heavy flax
 odd edgeBOT
heavy flax
heavy flax
odd edgeBOT
heavy flax
heavy flax
answer key
i’m wondering why the dy bounds are from 0 to 4
and not x^2 to 4

same with this
why isn’t dy bounds from 0 to sqrt(9-x^2)
because the maximum and minimum y value is changing, shouldn’t it be expressed as a function then
 forest sky
the outer bounds of a double integral are always constant, only the inner bounds can be functions
heavy flax
but why does it not include a function when the y is changing
like at x=1 versus x=0 the y will be different
is this already accounted for in the inner integral?
forest sky
that's already accounted for by the x bounds being a function of y
heavy flax
then how would i determine the bounds for the outer integral
the maximum and minimum y can be?
forest sky
the maximum and minimum y values on the entire region, yes
heavy flax
alright thanks
odd edgeBOT
@heavy flax Has your question been resolved?
odd edgeBOT
Channel closed
Closed due to timeout
Use .reopen if this was a mistake.
Available help channel!
Send your question here to claim the channel.
Remember:
• Ask your math question in a clear, concise manner.
• Show your work, and if possible, explain where you are stuck.
• After 15 minutes, feel free to ping <@&286206848099549185>.
• Type the command .close to free the channel when you're done.
• Be polite and have a nice day!
Read #❓how-to-get-help for further information on how to ask a good question, and about conduct in the question channels.
 short plume
could anyone help me with 7a pls?
 odd edgeBOT
short plume
could anyone help me with 7a pls?
mystic saffron
odd edgeBOT
short plume
could anyone help me with 7a pls?
mystic saffron
! status
odd edgeBOT
What step are you on?
1. I don't know where to begin.
2. I have begun but got stuck midway.
3. I got an answer but I was told that it's wrong.
4. I got an answer and would like my work checked.
5. I have a question about someone else's work/solution.
6. I have completed the problem and don't need help anymore. Thank you.
7. None of the above
1
mystic saffron
So
Can you restate
What we know
In a way that might help us answer the question
?
@short plume ?
God dammit
odd edgeBOT
@short plume Has your question been resolved?
odd edgeBOT
Channel closed
Closed due to timeout
Use .reopen if this was a mistake.
Available help channel!
Send your question here to claim the channel.
Remember:
• Ask your math question in a clear, concise manner.
• Show your work, and if possible, explain where you are stuck.
• After 15 minutes, feel free to ping <@&286206848099549185>.
• Type the command .close to free the channel when you're done.
• Be polite and have a nice day!
Read #❓how-to-get-help for further information on how to ask a good question, and about conduct in the question channels.
 distant socket
for (b), i stated that it was neither disjoint or independent since, both events overlap each other. as for the probability, for event A believed it should be 1/2 since half the numbers are even, and for event (b) the probability is 1/3 since only a third of the numbers are actually divisible by 3, thus the probability of both events occurring would be 1/6
however, the wording is throwing me off does either account for both dice landing on an even number, example or does it mean either one of the side?
so i justed wanted to check if my current work is correct or if there's more to it. thank you!
 odd edgeBOT
distant socket
for (b), i stated that it was neither disjoint or independent since, both events...
torpid owl
odd edgeBOT
distant socket
for (b), i stated that it was neither disjoint or independent since, both events...
torpid owl
They're independent? So how are you calculating the probability of A and B
odd edgeBOT
@distant socket Has your question been resolved?
distant socket
well i put neither disjoint or independent cause both events can happen when you roll the dice and that the first dice can affect if it's divisible by 3? and this is how i ended up finding the probbaility of events a and b after for the probaility of both i just multiplied.. im not sure if that's correct
 odd edgeBOT
@distant socket Has your question been resolved?
distant socket
.close
odd edgeBOT
Channel closed
Closed by @distant socket
Use .reopen if this was a mistake.
odd edgeBOT
Available help channel!
Send your question here to claim the channel.
Remember:
• Ask your math question in a clear, concise manner.
• Show your work, and if possible, explain where you are stuck.
• After 15 minutes, feel free to ping <@&286206848099549185>.
• Type the command .close to free the channel when you're done.
• Be polite and have a nice day!
Read #❓how-to-get-help for further information on how to ask a good question, and about conduct in the question channels.
 fair oriole
Correct?
 odd edgeBOT
fair oriole
Correct?
mystic saffron
odd edgeBOT
fair oriole
Correct?
mystic saffron
✅
 odd edgeBOT
@fair oriole Has your question been resolved?
 undone rose
fair oriole
undone rose
fair oriole
Is #3 the central angle of a 21-gon?
If so, then yes
By the way, you can do CTRL + . to get superscript in Google Docs
and then just use the letter o or something for the degree symbol
fair oriole
 fair oriole
undone rose
Is #3 the central angle of a 21-gon?
fair oriole
undone rose
Is #3 the central angle of a 21-gon?
wait wym
undone rose
?
undone rose
fair oriole
wait wym
I am not sure what the setup for this problem is
And I don't know what "compartments" are in this context

 undone rose
Can I see the full problem?
 undone rose
The full setup
Does the worksheet have a description?
Or does it really just say Diameter: ... Number of compartments: ... and then the table?
fair oriole

Then its the questions after
You find the central angle by using the formula
360/# of items
IN this case
Compartments are the items
undone rose
fair oriole
Okay, this helps a lot
undone rose
fair oriole
This is correct, however the instructions state to "round all answers to the nearest hundredth"
undone rose
Your answers appear to be fine other than that
undone rose
fair oriole
It goes tenth then hundredth right ?
Yes
fair oriole
So if it was 15.65
undone rose
Round to hundredths = num.xx
fair oriole
undone rose
Two numbers after the decimal place

For numbers with 3 digits
I would still round up the .57
right?
undone rose
Hundredths just means two digits after the decimal place
fair oriole
undone rose
Hundredths just means two digits after the decimal place
So it would be 345.6 meters, 9503.3 meters, 17.1^o, 16.3, and 448.8?
Sorry for the pings I just wanna get a good grade on this
😭
undone rose
fair oriole
So it would be 345.6 meters, 9503.3 meters, 17.1^o, 16.3, and 448.8?
You need two digits after the decimal places for it to be rounded to the nearest hundredth
fair oriole
Ik
Some of arent there because they're 0

Like for this one
OH
WAIT
AM I TRIPPING
I just realized
alr ill fix it rn
So like this

?
undone rose
fair oriole
So like this
This is rounded a bit strangely
undone rose
You can just say that since $2*\pi*55=345.58$, the circumference is 345.58 meters
clever fjordBOT
otheol
 undone rose
Looks good
odd edgeBOT
Channel closed
Closed by @fair oriole
Use .reopen if this was a mistake.
odd edgeBOT
Available help channel!
Send your question here to claim the channel.
Remember:
• Ask your math question in a clear, concise manner.
• Show your work, and if possible, explain where you are stuck.
• After 15 minutes, feel free to ping <@&286206848099549185>.
• Type the command .close to free the channel when you're done.
• Be polite and have a nice day!
Read #❓how-to-get-help for further information on how to ask a good question, and about conduct in the question channels.
 spice quiver
Hey, I'm confused about how mathematical induction works. I have 2 questions:
- In the inductive step, we say that P(k) -> P(k+1) as a conditional, but it assumes that P(k) is true for any particular by arbitrary k. How is P(k) not the same as assuming that P(x) for any x is true, which is what we're trying to prove? Aren't P(k) and P(x) the same thing? It's almost as if we're assuming the statement is true in order to prove that it's true.
- For the inductive step to be useful, we have to prove that P(k) is true at some point, or in other words, to prove that P(k) is true for any particular but arbitrary k, in order to use the conditional P(k) -> P(k+1), but that's never proven. The base step proves that P(1) is true, but that's not the same as proving P(k) true (for any k), so how come can the inductive step set in motion the base case in such a scenario?
odd edgeBOT
spice quiver
Hey, I'm confused about how mathematical induction works. I have 2 questions:
- ...
undone rose
Mathematical induction works by proving a base case then proving an inducive case
So, for example, if we have our statement P, we can first say that for n = 0, P(n) = P(0) is true
Our inductive step is that if P(n), then P(n+1) for any n >= 0
The reason why this works is because P(n+1) has a dependency on P(n)
which in turn has a dependency on P(n-1)
which in turn has a depedency on P(n-2)
All the way down until P(0)
Which was shown to be true
You can think of it like a building
Where proving that base case is like providing a foundation
and then the P(n) -> P(n+1) gives the method for building up from there
Because by P(n) -> P(n + 1), if you know that P(0) is true, then P(1) is true
and so on and so on
spice quiver
I'm not sure how this answers my 2 questions above
 gritty oar
if you prove the inductive step and the base step then p(0) implies p(1) implies p(2) implies p(3)...
gritty oar
I did
that's the answer to your second question
p(0) is true, p(0) implies p(1) so P(1) is true, p(1) implies p(2) so P(2) is true etc
spice quiver
But proving P(1) true is not the same as proving P(k) is true, which is what you need in order to use the P(k) -> P(k+1)?
gritty oar
p(1) is true, p(1) implies p(k), p(k) is true
undone rose
spice quiver
But proving P(1) true is not the same as proving P(k) is true, which is what you...
If you let k = 1 in P(k) -> P(k + 1), then you have the statement if P(1) -> P(2)
P(1) is true, so therefore P(2)
apply same reasoning for k = 2 (since you now know P(2) is true), then k = 3, then k = 4, then continue
Which eventually proves for all k >= 1
spice quiver
But showing that P(1) is true for k=1 is not the same as showing that P(k) is true for any k
undone rose
spice quiver
But showing that P(1) is true for k=1 is not the same as showing that P(k) is tr...
Showing that P(k) -> P(k + 1) is a kind of "template"
That you expand with real values of k
gritty oar
spice quiver
But showing that P(1) is true for k=1 is not the same as showing that P(k) is tr...
The inductive step holds for every k
gritty oar
gritty oar
p(0) is true, p(0) implies p(1) so P(1) is true, p(1) implies p(2) so P(2) is tr...
.
undone rose
The "expansion" is implied, since we don't want to write down explicitly for each value of k that if P(k), then P(k+1)...
spice quiver
To use the inductive step P(k) -> P(k+1), you need to prove that P(k) is true for any k, is that right?
gritty oar
no
undone rose
I think you might be overly connecting k between statements
gritty oar
youre proving p(k) implies p(k+1)
The entirety of the proof gives you p(k) is true for every k
the inductive step is not the entirety of the proof
spice quiver
But the inductive step assumes the entirety of the proof is true?
gritty oar
no
spice quiver
If P(k) is the entirety of the proof, P(k) -> P(k+1) assumes it?
gritty oar
Weak inductive step makes no claims whether p(k) is true or not
it is quite literally if p(k) then p(k+1)
nowhere does it assume p(k)
spice quiver
I mean, to prove P(k) -> P(k+1), you're using P(k) as given as true, in order to substitute it into P(k+1), isn't that right?
confusing stuff lol...
undone rose
spice quiver
I mean, to prove P(k) -> P(k+1), you're using P(k) as given as true, in order to...
P(k) is true if P(k-1)
which is true if P(k-2)
which is true if P(k-3)
...
which is true if P(2)
which is true if P(1)
which is true if P(0)
P(0) is true
Or whatever the base case is
So therefore going back all the way up, P(k) is true
gritty oar
spice quiver
I mean, to prove P(k) -> P(k+1), you're using P(k) as given as true, in order to...
yes but what if p(k) is false? The inductive statement would still be true if you could prove it
spice quiver
I'm confused about what I'm confused about at this point..
undone rose
I think you were confused about what an inductive step does
spice quiver
So P(k) -> P(k+1) can be true regardless of whether P(k) is true, because it's a conditional that can be true if the hypothesis is false?
undone rose
spice quiver
So P(k) -> P(k+1) can be true regardless of whether P(k) is true, because it's a...
No
A conditional means that, for example in A -> B, that B requires A to be true for B to be true
undone rose
If A -> B and A is false, then B is unknown
gritty oar
Ok I have example for. U
IF I am 6 foot 5 gigachad then I am at least 6 ft tall
is that statement true
spice quiver
It's false only if you're 6 foot 5 gigachad and you're not at least 6 ft tall, in all other cases, it's true
 half fulcrum
:0
undone rose
How can you be 6'5 and not at least 6' tall
gritty oar
... Ok but can I be 6 feet 5 without being atleast 6 feet...
spice quiver
p -> q is false only if p is true and q is false
gritty oar
Forget math
think about real life and English
if some random person is 6 feet 5, are they at least 6 feet
spice quiver
yeah
spice quiver
where are you going with this, why no math?
gritty oar
now what if I'm a 4 feet 20 inch pepeman
does that invalidate the conditional statement I made
undone rose
gritty oar
now what if I'm a 4 feet 20 inch pepeman
(= 5'8)
spice quiver
You told me to ignore math, and now you're asking me about conditional statements
gritty oar
gritty oar
if some random person is 6 feet 5, are they at least 6 feet
does me being shorter than 6 feet 5 make this an incorrect statement?
spice quiver
spice quiver
p -> q is false only if p is true and q is false
.
undone rose
Which means
spice quiver
Let's get back to mathematical induction?
gritty oar
so you agree the answer is it does not correct
gritty oar
spice quiver
If P(k) is the entirety of the proof, P(k) -> P(k+1) assumes it?
.
IF p(k) implies p(k+1) is the induction step
IF
you're proving a conditional statement
you're not proving that the statement p(k) is true within the induction step
when you have both base and inductive steps, which is the entirety of the proof, only then do you obtain p(k) is true for every k
spice quiver
In the inductive step, aren't we trying to prove that for every k, if the statement holds for k, then it holds for k+1?
gritty oar
yes
spice quiver
But at the same time we don't know if P(k) is true or not, we only know that if it is true, then P(k+1) will also be true?
undone rose
Yes
gritty oar
yes
spice quiver
Proving that P(k) is true for any arbitrary particular k is the same as proving that P holds true in general, which is what we're trying to prove with the mathematical induction?
Is there a difference between proving P true for all k and between proving P(k) for any arbitrary particular k?
spice quiver
What are we actually trying to prove with this mathematical induction?
gritty oar
Both base and inductive steps combined yield p(k) is true for every k
spice quiver
Yeah, so P(k) true for every k is what we're trying to prove. Now, in the inductive step we say P(k) -> P(k+1), is that P(k) the same as the P(k) we're trying to prove with mathematical induction?
I understood so far that we can say that P(k) -> P(k+1) is true despite not knowing whether P(k) is true or not, is that right?
Thanks for the help
.close
odd edgeBOT
Channel closed
Closed by @spice quiver
Use .reopen if this was a mistake.
odd edgeBOT
Available help channel!
Send your question here to claim the channel.
Remember:
• Ask your math question in a clear, concise manner.
• Show your work, and if possible, explain where you are stuck.
• After 15 minutes, feel free to ping <@&286206848099549185>.
• Type the command .close to free the channel when you're done.
• Be polite and have a nice day!
Read #❓how-to-get-help for further information on how to ask a good question, and about conduct in the question channels.
fair oriole
Is this correct?
 odd edgeBOT
fair oriole
Is this correct?
fair oriole
odd edgeBOT
fair oriole
Is this correct?
fair oriole
The formua for central angle is
360/ number of items (21)
and arc length is
2PiR x (central angle/ 360)
odd edgeBOT
@fair oriole Has your question been resolved?
odd edgeBOT
Please only use the <@&286206848099549185> ping once if your question has not been answered for 15 minutes. Please do not ping or DM individual users about your question.
fair oriole
<@&286206848099549185>
Is this correct?

The formua for central angle is
360/ number of items (21)
and arc length is
2PiR x (central angle/ 360)
If you need any other info lmk
odd edgeBOT
Channel closed
Closed by @fair oriole
Use .reopen if this was a mistake.
odd edgeBOT
Available help channel!
Send your question here to claim the channel.
Remember:
• Ask your math question in a clear, concise manner.
• Show your work, and if possible, explain where you are stuck.
• After 15 minutes, feel free to ping <@&286206848099549185>.
• Type the command .close to free the channel when you're done.
• Be polite and have a nice day!
Read #❓how-to-get-help for further information on how to ask a good question, and about conduct in the question channels.
 remote bough
Hey ! I'm a biologist working on network analysis, and following the paper Molecular ecological network analyses of Deng YJiang YYang Y et al. (free online, 10.1186/1471-2105-13-113), page 14-15 'Algorithms of detecting the threshold value', I'm blocked on the step (f) saying:
To get unfolded eigenvalues, replace λi with ei = N_{av}(λ_i), where N_{av is} the continuous density of eigenvalues and can be obtained by fitting the original integrated density to a cubic spline or by local average.
So i tried but refering to this paragraph:
In order to reveal the fluctuations of eigenvalues, the average eigenvalue density has to be removed from system so that the average eigenspacing is constant. Also, this procedure to generate a uniform eigenvalues distribution is called unfolding. The unfolded eigenvalues will fall between 0 and 1, and its density does not depend on the overall level distribution. Consider a sequence of eigenvalues λ1; λ2; . . . λn from adjacency matrix, and those eigenvalues have been ordered as λ1≤λ2≤. . .≤λn .
In practice, we replace eigenvalues λi with ei = N_{av}(λ_i) where Nav is the continuous density of eigenvalues obtained by fitting and smoothing the original integrated density of eigenvalues to a cubic spline or by local density average.
I should have obtained values between 0 and 1 but i didn't got values in this range. I don't know what I did wrong but if anyone knows how to explain either the method 'fitting the original integrated density to a cubic spline' or 'local average' i'm taking it. If you have other scientific ressources I'm taking them too. Thanks in adavance for your help !
odd edgeBOT
remote bough
Hey ! I'm a biologist working on network analysis, and following the paper Molec...
@remote bough Has your question been resolved?
odd edgeBOT
@remote bough Has your question been resolved?
remote bough
<@&286206848099549185> please, i'm not in a rush but if someone can check it it'll be super cool !
odd edgeBOT
@remote bough Has your question been resolved?
odd edgeBOT
@remote bough Has your question been resolved?
remote bough
So far, here is what I did:
hist, bins = np.histogram(eigenvalues, bins=len(eigenvalues), density=True)
bin_centers = (bins[:-1] + bins[1:]) / 2
integrated_density = np.cumsum(hist) * (bins[1] - bins[0])

# Fit the integrated density to a cubic spline
cs = CubicSpline(bin_centers, integrated_density)
unfolded_eigenvalues = cs(eigenvalues)```

The problem with this is that i have a part of my matrix who are exactly the same number and this cause problem later, idk what to doOk so the thing I don't understand is that they quoted another paper where we can see this graph (focus on the A)

In this graph we can see that the spacing of the unfolded eigenvalues goes up to 3
HOWEVER in the paper I use it's specifically written
Also, this procedure to generate a uniform eigenvalues distribution is called unfolding. The unfolded eigenvalues will fall between 0 and 1, and its density does not depend on the overall level distribution
so the spacing can't be bigger than 1
The other paper is named "Constructing gene co-expression networks and predicting functions of unknown genes by random matrix theory" by Feng Luo, Yunfeng Yang, et al
odd edgeBOT
@remote bough Has your question been resolved?
odd edgeBOT
@remote bough Has your question been resolved?
odd edgeBOT
@remote bough Has your question been resolved?
 meager juniper
Oh, this is actually a really interesting question. I'm reading up on random matrix theory now as a result, and if I feel confident I'll help a little later.
@remote bough have you found this resource yet? It seems to address your exact questions: https://robertsweeneyblanco.github.io/Computational_Random_Matrix_Theory/Eigenvalues/Wigner_Surmise.html
Wigner's Surmise from sympy import *import scipyimport numpy as npimport matplotlib.pyplot as pltimport seaborn as snsimport syssys.path.appen...
That being said, the unfolded eigenvalues created by the procedure above does not seem to be between 0 and 1. Instead they seem to be about 1.
And that's the intended purpose of eigenvalue unfolding, to make the spacing "about 1."
Rather than strictly on the interval [0, 1]
At least, this is my naive, only-having-looked-at-this-area-of-math-for-like-20-minutes, understanding of the situation.
remote bough
I'm gonna read this, thank you
remote bough
remote bough
Hey ! I'm a biologist working on network analysis, and following the paper Molec...
Ok so I checked the unfolding they talk about but the thing is
As seen above, these level distances will tend to 0 as the dimension of the Gaussian Ensemble gets large
And, later in the paper they say
(g) Calculate the nearest neighbor spacing distribution of eigenvalues, P(d), which defines the probability density of unfolded eigenvalues spacing,
d_i = (e_{i+1} - e_i):
(h) Using the χ2 goodness-of-fit test to determine whether the probability density function P(d) follows the exponential distribution of Poisson statistic, exp(-d).
H0: P(d) follows the Poisson distribution.
H1: P(d) does not follows the Poisson distribution.
But if we unfold with Wigner's Semicircle law, then we assume that it's following a GOE and not Poisson right?
meager juniper
Oh, I missed that your distribution was Poisson?
That certainly might change things
remote bough
Because in the paper they talk about Nav which is the original integrated density to a cubic spline.
And ngl, I can't understand what is an original integrated density and chat gpt didn't helped. In the end I followed the code he gave me but I'm not sure it's right
Lemme get my laptop
Ok so i just calculate the probability of every unique eigenvalues
btw is this normal that i have duplicates in my eigenvalues?
I use a symetric matrix since i'm working on coocurences
Ngl, if it's not obvious yet, I am completly lost in this xD. My referents throw me this paper to me and said make it work but so far the only thing that I made with it is a lot of headache and empty expresso shell
meager juniper
remote bough
btw is this normal that i have duplicates in my eigenvalues?
That should almost never happen by chance. I'm not sure what to do about that!
Like, two eigenvalues can share a bin.
But they ought to be distributed via a continuous distribution.
At least from what little I know.
Sorry to cut and run, but I need to get prepped for a (hopefully) once in a lifetime event, and I probably won't be available for the next few days at least. If this is still pending then, I'd be happy to look at it some more though. The eigenspectrum of random matrices seems like a really deep and interesting topic to learn about.
remote bough
meager juniper
Sorry to cut and run, but I need to get prepped for a (hopefully) once in a life...
I wish you the best man, I need to write my report anyway so I'll get back to it in around a week. See you and good luck !
I'll post what I'll do here so we can continue on it later
And for duplicate eigenvalues I just added some random noise at like 10^-10 power so it's almost non visible
odd edgeBOT
@remote bough Has your question been resolved?
odd edgeBOT
@remote bough Has your question been resolved?
 karmic pecan
remote bough
karmic pecan
remote bough
I'm gonna do a little summary of what has been talked here before
My problem
I have a list of eigenvalues, I want to unfold them following the method of the paper I use:
To get unfolded eigenvalues, replace λ_i with e_i = N_{av}(λ_i), where N_{av} is the continuous density of eigenvalues and can be obtained by fitting the original integrated density to a cubic spline or by local average.
In the paragraph just before, the authors say:
In order to reveal the fluctuations of eigenvalues, the average eigenvalue density has to be removed from system so that the average eigenspacing is constant. Also, this procedure to generate a uniform eigenvalues distribution is called unfolding. The unfolded eigenvalues will fall between 0 and 1, and its density does not depend on the overall level distribution. Consider a sequence of eigenvalues λ1; λ2; . . . λn from adjacency matrix, and those eigenvalues have been ordered as λ1≤λ2≤. . .≤λn .
In practice, we replace eigenvalues λi with ei = N_{av}(λ_i) where N_{av} is the continuous density of eigenvalues obtained by fitting and smoothing the original integrated density of eigenvalues to a cubic spline or by local density average.
After this I have to realise a Chi² test to test if the distribution of the spacing of the unfolded eignvalues are following a Poisson distribution. So I can't fit them to a Wigner's Semicircle for exemple. If anyone knows how to explain either the method 'fitting the original integrated density to a cubic spline' or 'local average' i'm taking it. If you have other scientific ressources I'm taking them too. Thanks in adavance for your help !
The paper: https://doi.org/10.1186/1471-2105-13-113 p:14,15 -> Algorithms of detecting the threshold value

BioMed Central
Background Understanding the interaction among different species within a community and their responses to environmental changes is a central goal in ecology. However, defining the network structure in a microbial community is very challenging due to their extremely high diversity and as-yet uncultivated status. Although recent advance of metage...
meager juniper
@remote bough thanks for the link to the paper. I'm impressed that the paper is actually freely available.
ah, I think I understand what they are doing.
let me generate some sample data and show rather than tell.
remote bough
Yeah sorry I would love to share the data I work with but it's not mine
meager juniper
So step 1, generate this CDF logically by sorting the sampled eigenvalues, and then generating a list of pairs of points {x, y} where x is the nth eigenvalue, and y is n/(n_tot-1). (zero indexed)

Step 1.2, add in a point less than the lowest eigenvalue, with values {x1 - r, 0}, and a point larger than the highest eigenvalue {xn + r, 1} where r is some constant.
Step 2, to all of these points, fit a cubic spline.
@remote bough does this make sense?

Here's it with the spline overlayed on the data
And just the spline alone

Let me know if I'm off base, and if this isn't what you're asking.
There are other methods of attempting to do changing a bunch of samples points into a pdf or cdf, this is one easy way, you can also try a non-parametric method like Kernel Density Estimation, where you treat the points as a series of delta functions and convolve a kernel (maybe a rect or a unit gaussian) with it, and the output is an estimate of your pdf. There are more complicated Kernel Density Estimation schemes that I was looking into for a previous project as well, which attempts to do an adaptive kernel based on the density (because generally in higher density regions you want your kernel to be narrower and in lower density regions you want it to be wider.
remote bough
meager juniper
<@354188969472163840> does this make sense?
yeah it does
I'm gonna try this tommorow (hard day today ngl), I keep you in touch
meager juniper
roger
 unreal plinth
Hello, sorry to bother i wantedt to sleep over at my girlfriendsplace, but my parents said no because i was pissed because i had to help them build smt on the house but instead of rebelling and not work i did everything they said. but their problem was that i was pissed. i dont understand whats the matter here, i did all of work like the dishes and cleaning ... (for context i am 15 live in germany and have middle good grades)
please i need help asap
torpid owl
unreal plinth
Hello, sorry to bother i wantedt to sleep over at my girlfriendsplace, but my pa...
take it to #discussion
remote bough
In the end I started working on it and well

I'm gonna rest and do this tommorow I think xD
remote bough
Like i got things like this
 meager juniper
@remote bough and how does that compare via chi^2 to the cdf of a poisson distribution vs the wigner surmise distribution?
remote bough
This is where I do something wrong I think because if I compare to this paper https://doi.org/10.1186/1471-2105-8-299 , which is the paper that they use for the treshold algorithm calculation, they have this figure in it (nw the paper is free too)
Look only for the fig A, The x-axis is the level spacing s and the y-axis is probability of NNSDs but what i don't understand it's that we have multiples points with around 0.8 and correct me if I'm wrong but the sum of the point of a distribution should be 1 right?


BioMed Central
Background Large-scale sequencing of entire genomes has ushered in a new age in biology. One of the next grand challenges is to dissect the cellular networks consisting of many individual functional modules. Defining co-expression networks without ambiguity based on genome-wide microarray data is difficult and current methods are not robust and ...
And mine look like this sooo, I clearly did something wrong

 remote bough
This is where I do something wrong I think because if I compare to this paper ht...
remote bough
remote bough
This is where I do something wrong I think because if I compare to this paper ht...
The closest thing I have from this paper is this then
 meager juniper
@remote bough
correct me if I'm wrong but the sum of the point of a distribution should be 1.
The integral of the PDF should be 1. You're looking at a PDF not a PMF. The points that are near 0.8 have a "width" (if we were to properly discretize this function, rather than sample it), of around 0.1 or so, so looking at this as a PMF the value of that point would be about 1/10 of 0.8, which is suddenly much more reasonable to think that everything sums to 1.
n.b. your graph of the cubic spline vs cdf looks entirely reasonable, albeit rather strangely scales with the x-axis.
Well, it is unreasonable to think that there would be negative spacings though, which upon closer inspection seems to be indicated.
Did you remember to sort before taking the differences?
remote bough
yup I sorted just before making the difference
sorry it's the last straight line before giving back my interniship report, I'm probably gonna go back on this next week. Even next week I need to make a presentation of my intership so I won't be too much on it.
mystic saffron
10 days 💀
remote bough
Nw it's just the threshold algorithm there is still the module detection after this 😉
(it should be ok tho I'm just a bit stupid with RMT)
I give my report today so I'll work on this tonight
remote bough
@meager juniper here I multiplied my eigenvalues by the CDF, was it what I'm supposed to do?

I admit i'm a bit lost because Nav is my CDF so what I'm supposed to do when tehy say Nav(eigenvalues)
like is it a function or some sort?
remote bough
remote bough
<@173636598150332416> here I multiplied my eigenvalues by the CDF, was it what I...
The gif is false, here is the real version

If I do 100 bins instead of 20

And finally with 'auto' as the number of bins (quite literraly hist, bins = np.histogram(spacing, bins='auto', density=True))

But yeah the thing is, ther best p-value I obtain is 0
meager juniper
I don't understand what the threshold is supposed to represent in this case
remote bough
Ho sorry, so to calculate the pairwise Pearson correlation matrix we first create a presence matrix. To build the presence matrix you look at your abundance matrix and put a 1 if the abundance is superior or equeal to the threshold and 0 if it's less. So basically our pairwise Pearson correlation matrix changes every time we change the threshold because there are less and less 1 the more the threshold increase
Then after this it goes to the unfolding process we discussed together
meager juniper
So your random matrix is a set of Bernoulli random variables?
remote bough
Well it's not really a random matrix but yeah the matrix on which I do the pairwise Pearson correlation is a set of Bernoulli random variable
remote bough
Ok nvm I'm a moron I calculated my expected values wrongly
Now i get this
Threshold: 0.79, p-value: 0.014588826866330229
Threshold: 0.8, p-value: 1.2355947265341172e-08
Threshold: 0.81, p-value: 0.016623357257685822
Threshold: 0.82, p-value: 0.9051908072796523
Threshold: 0.83, p-value: 3.775139852391085e-06
Threshold: 0.84, p-value: 0.9793064632678917
Threshold: 0.85, p-value: 0.9964949967725274
Threshold: 0.86, p-value: 0.9972341111918464
Threshold: 0.87, p-value: 0.9965058468455078
Threshold: 0.88, p-value: 0.9939764232141998
Threshold: 0.89, p-value: 0.9934387260854152``` remote bough
Ok so the paper tells me to take as a threshold the first with p-value < 0.01 so I just take a treshold of 0.8
 pastel pollen
i'm so confused
remote bough
Me too don't worry
pastel pollen
so the orange curve is a distribution that you're trying to estimate from the given eigenvalues?
Is that the core question? How we estimate this distribution?
Or maybe you've already made some progress on that one lmao
remote bough
So bassically, everything on the paper is explain to how to estimate it, I do a Chi² test nw
the part where I blocked is how to unfold the eigenvalues
but now this part is solved
normally
pastel pollen
wahoo
remote bough
because in the paper they they that Nav is the continuous density of eigenvalues
and the unfolded eigenvalues is e_i = Nav(d_i) for d_i, each eigenvalues
So now I have my cdf, wich is Nav if I understand correctly, but I don't know what to do with it
I mutiplied every values of CDF by my eigenvalues so basically did Nav_i * d_i but it's not what is written in the paper
pastel pollen
i thought you were done once you have your unfolded eigenvalues
pastel pollen
remote bough
Ok nvm I'm a moron I calculated my expected values wrongly
Now i get this
```
T...
is the orange line N_av
even at threshold 0.8 this still doesn't seem like it fits the observed data too well
sad
remote bough
Nop, is the expondential Poisson distribution as P(x) = exp(-x)
pastel pollen
ah!
so N_av is the "continuous density of eigenvalues & can be obtained by fitting the original integrated density to a cubic spline or by local average"
remote bough
yes
pastel pollen
not sure i get the local average part, but the cubic spline sorta makes sense
but we've done that now
pastel pollen
yea now you have a list of unfolded eigenvalues & now the next step is to calculate the spacing
and now finally we want to do a \chi^2-test to see if the spacing fits an exponential distribution
ok i'm just getting up to speed where you are now
remote bough
thx
pastel pollen
remote bough
I mutiplied every values of CDF by my eigenvalues so basically did Nav_i * d_i b...
so why are you doing that part
pastel pollen
fair
remote bough
I obtain Nav by fitting to the cubic spline
but then I have to use Nav as a function and input my eigenvalues
but how the hell do I do this, Nav is a list of fitted values
pastel pollen
what's wrong with taking the paper at face value & then just saying "N_av(lambda_i) is e_i"
so you get a list of unfolded eigenvalues
remote bough
like look
pastel pollen
hmm i think Nav should indeed be a function
i get your problem
wondering why you get a list of values instead
i'm sure whatever tool you're using can use your fitted model as a function as well
this looks like python, how are you creating the cubic spline?
remote bough
What i do is that I calculate the original integrated density cdf = norm.cdf(eigenvalues), I fit it to a cubic spline , ei = CubicSpline(eigenvalues, cdf)(np.linspace(eigenvalues[0], eigenvalues[-1], len(eigenvalues))), and now I'm lost xD
pastel pollen
https://docs.scipy.org/doc/scipy/reference/generated/scipy.interpolate.CubicSpline.html this guy i'm guessing
remote bough
from scipy.stats import norm
import numpy as np
from scipy.interpolate import CubicSpline

# calculate the eigenvalues
eigenvalues = np.real(eig(adj_matrix)[0])
# add noise
eigenvalues += np.random.normal(0, 1e-10, len(eigenvalues))
eigenvalues.sort()

# Calculate the integrated density where x is the nth eigenvalue, and y is n/(n_tot-1)
cdf = norm.cdf(eigenvalues)

# Fit the cubic spline
cs = CubicSpline(eigenvalues, cdf)
x = np.linspace(eigenvalues[0], eigenvalues[-1], len(eigenvalues))
ei = cs(x)```yes
pastel pollen
oh ok, but you're using your CubicSpline as a function when you plug x into cs
in the very last line
so you should be able to plug anything you want into Nav
remote bough
indeed, but the thing is that ei and eigenvalues are exactly the same
like I calcultaed the difference and it's like 1e-14
it's basically the same thing
pastel pollen
oh! that makes sense if you're fitting the cubic spline to the eigenvalues
is there maybe something we've misunderstood here
remote bough
probably because it unfortunately doesn't make sense
pastel pollen
ok i'm at the same level of confusion as you are now
from my point of view, this is progress
remote bough
welcome ! xD
pastel pollen
now i'm gonna look at the paper until i can see what the issue is
 lament halo
im very sorry to interupt this but where can i get fast help rn?
pastel pollen
lament halo
thank you
remote bough
If it can help you, here is the paper on which this paper is basing itself for calculating the threshold value
it's free online too nw
ho
nvm
wrong one
this one
pastel pollen
hm, but we shouldn't be fitting the cubic spline to the eigenvalues, but to the cumulative distribution function of the eigenvalues
hmmmmmmmmm lemme think
remote bough
pastel pollen
hm, but we shouldn't be fitting the cubic spline to the eigenvalues, but to the ...
that's actually what I do
pastel pollen
ye i see it in the code
one point of criticism is that i don't think you want the normal cumulative density function? the eigenvalues themselves, if ordered, define a cumulative density function
idk if that's intended or a shortcut you're taking in the code right now
remote bough
yeah because normal cumilative or not when fitted to the cubic spline it does'tn change anything
remote bough
Ho ! I tried doing it like n/(n_tot-1)
 pastel pollen
looks spooky
it sounds to me like the idea of the "unfolding" is just to normalize the eigenvalues to a level between 0 and 1
i don't know what purpose is fulfilled by fitting the whole ass density function Nav to the data
remote bough
Me too, just following the orders 
If i go straight to calculating the spacings of the eigenvalues I got this
 pastel pollen
but unless your original eigenvalues already all lie between 0 and 1, it's very unlikely that you're going to get the exact same values back after fitting
remote bough
yeah that's what I mean
Maybe I should like
fit to a cubic spline
and then fit an array between 0 and 1 to this spline I just made
well that was dumb apparently

ok I found the problem

wth is this fitting
ok so using the linespace function was dumb

and now we're back to square one
 meager juniper
remote bough
ok so using the linespace function was dumb
meager juniper
remote bough
ok so using the linespace function was dumb
Based on this you definitely definitely have something buggy going on, these two graphs should essentially be the exact same graph.
Also your cdf is over spacings between eigenvalues, these should never be negative.
So if you have positive cdf values before x = 0 there's something wrong, as I mentioned previously.
remote bough
so like the calculation of eigenvalues are wrong?
meager juniper
No, the calculation of the spacings between them is
remote bough
I see, I use a already existing function to do it, I'm gonna remake it myself
remote bough
meager juniper
So if you have positive cdf values before x = 0 there's something wrong, as I me...
About that, I calculate cdf eigenvalues / (n_{eigenvalues} - 1) like you said and I obtain this

but I still have positive values before 0
meager juniper
So, either I mis-expressed my intent, or you misinterpreted my statement. Either way, my bad for either not being more clear or screwing up the explanation.
So unfolding eigenvalues is entirely about the density of eigenvalues.
remote bough
I'm not very good with understanding this ngl, I'm really thankful you're helping me already 🙏
meager juniper
Let's say we have the following eigenvalues as an example: [1, 2, 2.5, 2.75, 3.25, 4]
These are sorted, but your list won't be.
We want to figure out how dense the eigenvalues appear, so we do running difference between successive values in the list. We get: [1, 0.5, 0.25, 0.5, 0.75]
Where 1 comes from 2-1, 0.5 comes from 2.5-2, and so on
remote bough
yes indeed, I got this too
meager juniper
So then we use these values as the source of the cumulative distribution function
So we again sort them
[0.25, 0.5, 0.5, 0.75, 1]
And now at 0.25 we go from 0 to 1/5, at 0.5 we go from 1/5 to 3/5 and so on
You can see that because these are spacings they should always be positive. Your cdf should only be non-zero after the smallest spacing, and because that spacing is positive, it shouldn't be non-zero for negative inputs
remote bough
ok there was a misunderstanding of my part
the plot I just showed was the cdf of the eigenvalues, not the cdf of the spacings
so I was ploting the cdf in y and the eigenvalues in x
I hear you, but on the paper we use the CDF of eigenvalues to unfold, then we use the PDF of the spacing to "Calculate the nearest neighbor spacing distribution
of eigenvalues, P(d), which defines the probability density of unfolded eigenvalues spacing".
meager juniper
This might be a symptom of either my not understanding eigenvalue unfolding, as I will readily admit I'm attempting to guide you through it after only having learned it for myself, or the paper is being less than careful about explaining the process, because they assumed the reader is already familiar with the technique.
remote bough
meager juniper
nonono, like the unfolding is good I think because I got what you got basically if we look at what you did here
I think it's the following part of what to do with it because if we compare our plots, they are basically the same
meager juniper
So in my plots, I was only illustrating the cubic spline portion
I generated points sampled from a unit random distribution to give data
I didn't calculate spacing between points or anything else because I thought it wasn't germane to the demonstration.
remote bough
yes, I understand that, what I'm saying is that my spacings are positive everywhere, I think it's the way I do my PDF that is wrong
meager juniper
Ah! Fair enough!
remote bough
Well, tell me if i do it wrongly, I do an histogram of my data, take the centers of the bins for my x and I do hist / sum(hist) for my y
meager juniper
Depends on if the data in the histogram are the eigenvalues themselves, or the spacings.
remote bough
it's the spacing since I'm searching the pdf of the spacings now
meager juniper
Ok, then hist[n] / sum(hist) should get you a properly normalized PMF
remote bough
but it's not supposed to look like this right?

I'm plotting the pdf in y and spacings in x
meager juniper
I wouldn't imagine so
remote bough
ok so it's clearly my pdf the problem
meager juniper
Can you provide a sample of what your spacing vector looks like?
This graph seems to imply that most of your spacings are very close to zero
remote bough
[5.33427469e-16 1.30451205e-15 2.11636264e-15 4.46864767e-15
 4.69155964e-15 4.79217360e-15 6.76975836e-15 6.93889390e-15
 7.84528692e-15 8.93382590e-15 9.80205500e-15 1.13320811e-14
 1.64226271e-14 1.78737233e-14 1.84271001e-14 2.02164674e-14
 2.40181139e-14 3.26093319e-14 3.29423988e-14 4.32692077e-14
 4.84291426e-14 5.78842529e-14 5.80811441e-14 5.95790778e-14
 6.00396469e-14 6.62447527e-14 7.31151251e-14 8.19552759e-14
 9.54149953e-14 1.19289127e-13 1.40304435e-13 2.23020387e-13
 2.29008652e-13 1.41032085e-05 1.69623495e-05 2.05931790e-05
 3.05410514e-05 4.05124399e-05 4.90341543e-05 5.10993049e-05
 5.22703646e-05 5.46774345e-05 5.86708896e-05 6.34217830e-05
 6.67087620e-05 7.92958477e-05 8.32592173e-05 8.41914212e-05
 8.84053972e-05 8.97394412e-05 9.12123446e-05 9.38677957e-05
 9.75783230e-05 9.83996077e-05 1.01246911e-04 1.01633291e-04
 1.02013663e-04 1.02491977e-04 1.02492592e-04 1.03418149e-04
 1.10569374e-04 1.11217243e-04 1.12285269e-04 1.15743647e-04
 1.15854071e-04 1.16181010e-04 1.18064780e-04 1.21868537e-04
 1.22401227e-04 1.24170672e-04 1.28938233e-04 1.30114436e-04
 1.33479184e-04 1.34138721e-04 1.38329199e-04 1.41828264e-04
 1.43557565e-04 1.44168918e-04 1.52149478e-04 1.54986450e-04
 1.58076283e-04 1.61586469e-04 1.64324521e-04 1.67710696e-04
 1.69181327e-04 1.70191102e-04 1.70274418e-04 1.70627980e-04
 1.71912257e-04 1.72590859e-04 1.76347483e-04 1.80191341e-04
 1.80245809e-04 1.80937095e-04 1.83171558e-04 1.83173914e-04
 1.84185037e-04 1.86608158e-04 1.90175639e-04 1.91896798e-04
 1.92508638e-04 1.95414219e-04 1.99408825e-04 2.00516689e-04
 2.02493402e-04 2.03325037e-04 2.04508563e-04 2.04537399e-04
 2.07402776e-04 2.07421074e-04 2.07901101e-04 2.11166795e-04
 2.11455428e-04 2.15353392e-04 2.16619988e-04 2.24703288e-04
 2.25512348e-04 2.31899465e-04 2.41375388e-04 2.41402631e-04
 2.42418908e-04 2.45755814e-04 2.47628724e-04 2.48856648e-04
 2.50831262e-04 2.54456462e-04 2.54786985e-04 2.61904310e-04
 2.74966984e-04 2.75537353e-04 2.80877676e-04 2.84566998e-04
 2.89086914e-04 2.97235310e-04 3.07905841e-04 3.09822825e-04
 3.12353874e-04 3.14311855e-04 3.16758556e-04 3.17392754e-04
 3.17455356e-04 3.21245791e-04 3.21268503e-04 3.22696549e-04
 3.24967867e-04 3.26229678e-04 3.26310691e-04 3.34584290e-04
 3.35189333e-04 3.38121120e-04 3.41933602e-04 3.42529089e-04
 3.74660735e-04 3.78670804e-04 3.85953405e-04 3.87408275e-04
 4.10011947e-04 4.14632448e-04 4.17031513e-04 4.28941498e-04
 4.42184317e-04 4.49927732e-04 4.60916355e-04 4.66069613e-04
 4.67231542e-04 4.71745361e-04 4.92109603e-04 5.14317351e-04
 5.20917169e-04 5.21849546e-04 5.30651842e-04 5.36990390e-04
 5.38038280e-04 5.58004060e-04 5.63751335e-04 5.72221557e-04
 6.07929844e-04 6.28129387e-04 6.34972431e-04 6.35196543e-04
 6.58533729e-04 6.58713234e-04 6.60301302e-04 6.83726529e-04
 6.90207673e-04 6.95872738e-04 7.21534231e-04 7.43642696e-04
 8.50617090e-04 8.72193069e-04 8.76212650e-04 8.84316481e-04
 8.90005712e-04 9.20314119e-04 9.83175038e-04 1.01519494e-03
 1.11917309e-03 1.12281128e-03 1.12819177e-03 1.16407832e-03
 1.20418188e-03 1.23692463e-03 1.62146689e-03 1.64429239e-03
 1.71721149e-03 1.79044549e-03 1.97485951e-03 2.20962127e-03
 2.31333182e-03 2.37403090e-03 2.91090426e-03 3.19936545e-03
 3.37843081e-03 7.89096736e-03 8.88151257e-03 1.53544194e-02
1.11094760e-01]```Ok most of your spacings are indeed extremely close to zero
remote bough
It probably has to do by the fact that I have duplicated eigenvalues so I add noise at 10e-10 so my program can work, but the paper doesn't seems to mind the duplicated eigenvalues
meager juniper
If this were a truly random matrix then duplicate eigenvalues would have probability 0.
remote bough
It's a symetrical random matrix
meager juniper
Is it a discrete random matrix?
Symmetric wouldn't change that tbh
Or at least I think it shouldn't, but it's 4AM here, and I could just be wrong.
Discrete meaning that the random variables that exist inside of the entries of the matrix are discrete random variables.
remote bough
wait lemme recapitulate
I have a symetrical matrix composed of 1 and 0
I do a pairwise pearson corelation to it
meager juniper
So it is discrete and Bernoulli
remote bough
yeah
remote bough
meager juniper
Or at least I think it shouldn't, but it's 4AM here, and I could just be wrong.
btw don't ruin your sleep schedule for me 🙏
meager juniper
My sleep schedule isn't ruined due to you, but my own stupid video game habits.
I'm not really sure that random matrix theory, or at least the parts that I've read, are applicable to a problem like this
The fact that your matrix is Bernoulli explains how it could possibly have repeated eigenvalues.
remote bough
but like, even if i do pariwise pearson corelation after this?
meager juniper
So you're running this on the covariance matrix?
remote bough
yes
I tried using kde for the pdf of spacing and I obtained something more promissing but I don't understand why it goes up to 200 so I have to dig down a bit
 meager juniper
Ugh sorry I'm fading. So your matrix isn't actually Bernoulli, it's just from Bernoulli variables
remote bough
Yeah I'm sorry I'm waking up so I'm not at my best too but let me recapitulate everything to you
meager juniper
Time zones are the worst
remote bough
hooo
nvm you were right
I do a pearson corelation then I filter everything to a certain threshold and so I end up with a matrix of 0 and 1 with no columns or row filled with 0
because if a value is above or equal to the trehold it's remplaced by 1
else 0
meager juniper
Can you do a soft version of that? Like maybe use tanh or something?
remote bough
Even in the paper they say that eigenvalues can be equal
To test NNSD distribution, order the eigenvalues as λ1**≤λ2≤. . .≤**λp
remote bough
meager juniper
Can you do a soft version of that? Like maybe use tanh or something?
wdym by soft
meager juniper
Sorry, thinking about "softmax" and trying to come up with an analogous process.
I should be up again in a few hours.
I'll explain better then, if it makes any sense at all to my morning mind.
meager juniper
@remote bough ok I'm awake now.
The idea of a max function is to run a bunch of values through a function and pick the highest, but what if always picking the highest value isn't as good as some sort of randomization scheme? What if you just "exaggerate" the differences a little and choose randomly?
softmax is a function which does this. It converts an array of numbers into a probability distribution where the highest input value becomes the most likely to be picked, the second highest the second most likely, and so on, the strength of this preference depending on a parameter β called the temperature which will make the differences sharper or less sharp between the options.
So for you, what if instead of a hard threshold function, what if you ran your inputs through the sigmoid function instead? (Sigmoid and tanh are properly similar functions, but sigmoid is slightly easier to adapt for this purpose.)
The idea is it maps values above the threshold closer to 1, values below the threshold closer to 0, and it does so in a smooth way.
σ(x) = 1/(1 + e⁻ˣ) normally, if we let b be a temperature parameter, and if we let t be a threshold, then we can transform all values in the matrix using the parameterized function:
σ(x; b, t) = 1/(1 + e⁻ᵇˣ⁻ᵗ)
The softmax function, also known as softargmax: 184 or normalized exponential function,: 198 converts a vector of K real numbers into a probability distribution of K possible outcomes. It is a generalization of the logistic function to multiple dimensions, and used in multinomial logistic regression. The softmax function is often used as the l...

A sigmoid function is any mathematical function whose graph has a characteristic S-shaped or sigmoid curve.
A common example of a sigmoid function is the logistic function shown in the first figure and defined by the formula:
    σ
    (
    x
    )
    =


        1

    ...
So if I understand it correctly, instead of putting 1 if above threshold and 0 else, I put them into a sigmoid function to make my similarity matrix
I remember using softmax when I was trying to learn machine learning
For like an array defined like
[[0.1, 0.2, 0.3],
 [0.2, 0.5, -0.1],
 [0.3, -0.1, -0.2]]```

with a temperature of 100 i get
```py
[[9.99962831e-01 9.99999998e-01 1.00000000e+00]
 [9.99999998e-01 1.00000000e+00 5.54485247e-05]
 [1.00000000e+00 5.54485247e-05 2.51749871e-09]]```
maybe I should lower the temperature to be sure not having duplicates right?
But the thing is that even if I use a softmax function, since my matrix is symetrical, I will alway get duplicates
 meager juniper
Duplicate values are fine
You're trying to avoid duplicate eigenvalues, which tend to involve involve many duplicate values
I would recommend a temperature of, like maybe 2 to start out with?
remote bough
let's try
meager juniper
Just so I'm clear though, why exactly are we thresholding this matrix?
remote bough
The structure of relevance network strongly depends on
the threshold value, st. In some network analysis, the
threshold value is chosen arbitrarily based on known
biological information or set by the empirical study [8].
Thus, the resulting network is more or less subjective
[19,20,85,87]. However, it is difficult to select appropriate
thresholds, especially for poorly studied organisms/communities.
In MENA, we use the random matrix theory
(RMT)-based approach, which is able to identify the
threshold automatically based on the data structure itself
[22,46] to select the final threshold parameter, st.
remote bough
exactly
because we basically use 0.95 as a treshold but like... for matrix like I show above we have noit a lot (liek 2% connectivity) and so our networks are literally garbage
the RMT approach looks super cool like, having objectlively good treshold instead of overkilled ones used subjectively
meager juniper
But it's weird that you have so many eigenvalues that are identical
remote bough
it's just probably because the matrix is semetrical and the shape of the matrix is big
meager juniper
Symmetric random matrices generally don't have identical eigenvalues though. This is something else with your data.
meager juniper
Wait wait, are the eigenvalues that are the same just the null space? @remote bough
meager juniper
If so, you might be able to reduce the rank of the matrix, then do all of these calculations.
 mystic saffron
dude why cant i be smart wtf is this
meager juniper
If I were smart I would have figured this out already lol
we're just idiots with an education 🙂
remote bough
meager juniper
it really looks like what I expoect, I'm gonna try this tommorow, thx for your help already
remote bough
meager juniper
Wait wait, are the eigenvalues that are the same just the null space? <@35418896...
Sorry I have a lot of things to do (I need to finish a presentation for this monday), I forgot to respond to this. No we remove all the zero only lines and rows
mystic saffron
direct variation is like when one variable changes exactly in proportion to another variable. imagine u get 25 hp when u use a medkit in fort then 2 will give 50 and 3 will give 75. u can write this as y = 25x where y is how much health u will gain and x is the amount of medkits
partial variation is the exact same thing but u have an initial value alr lets say everytime u start a match in fort u always find a small pot. so u will always start with 25 shield. and each small pot adds 25 shield, so the total shield u have isnt dependent on how many pots u pop but it also depends on how much shield u initially have. since we start with 25 shield and each small pot adds 25 shield we can write this as y = 25x + 25
in short; direct variation: no initial health, just calculating how much hp u will gain from x medkits. partial variation: initial shield, plus calculating how much shield u get from shield pots. also next time ask in an open channel not a taken one
 mild prism
bro usd fortnite lol
 coral linden
bro asked twitch chat lol
meager juniper
@remote bough I was a little skeptical that a bernoulli random matrix would make the same distribution of eigenvalues as a GOE, so I tested it, and it seems to actually.
 remote bough
yeah it looks very similar
meager juniper
I'm testing smaller values for p to see where the behavior changes.
remote bough
ok I just finished my last bachelor exam (🎉) I can work fulltime on this now
Ok i'm rewriting all my code for a fresh start with everything we talked before and I want to be sure of something about the CDF.
When you say n/(n_tot-1) you're talking about n being one eigenvalue among the vector and n_tot the sum of all eigenvalues right?
@meager juniper I just realise that we were stupid. We're not searching the right thing. It's not CDF for cumulative distribution function that we needed to do but CDF for continious density function
meager juniper
yes.
remote bough
What we have to fit to a cubic spline is the integrated density of the eigenvalues, idk if it's the CDF tho maybe it is
meager juniper
integrated density is the cdf
meager juniper
0.2 seems fine.
remote bough
I just realised, here are my pearson corelation table
meager juniper
thanks
remote bough
I can give you that, I mean you don't have my data just the corelation
sorry I could I've done that earlier
meager juniper
😄
remote bough
I'm literally so stupid I can't give you data but this is unexploitable 😭
good luck stealing my paper xDD
meager juniper
@remote bough is that the xlsx file you're using?
Because if so, you have some non-numerical values in your cells, by accident.
or at least, it's being parsed by mathematica as non-numeric
remote bough
I'm gonna do a script to export it correctly, rn it was a copy past from an other file
meager juniper
(I have the following: -5 - 8.3402 e, -5 - 7.4498 e, -5 - 1.14894 e, -5 + 1.21479 e, -5 +
4.42153 e, -5 + 4.69435 e, -5 + 4.8631 e, -5 + 5.62076 e)
which seem to be due to exponential notation going screwy
meager juniper
These seem to be all positive. Your last matrix was similar, but there were negative numbers.
remote bough
Yes because it's coming from my code and in the paper they say they take the absolute value of the pearson corelation so here I just passed everything into it's absolute value
 remote bough
ok so maybe the problem is there since the begining
meager juniper
This is the version with the negative numbers
remote bough
ok so I'm probably building my corelation matrix wrongly, I'm gonna redo this part of the code first thing in the morning
I keep you in touch, I hope it was the problem all along
meager juniper
oh one second, this might wind up being dumb
still iffy

As I mentioned before, I thought it might be the nullspace of your matrix. You said you deleted the rows and columns that are completely zero, but that's not enough to eliminate the nullspace.
remote bough
I actually get the same first histogram as you do
meager juniper
When you notch out what is effectively the null space of this matrix, you get a much smaller sample of eigenvalues, which might be following the rules you want, the fits are definitely iffy though, especially the semicircle.
meager juniper
yeah, but this is just me testing your unscrewed with matrix, before thresholding and all of that, to see if it even follows what you would expect from a random matrix.
remote bough
So if I understand correctly, the matrix is fine, it's my program that doesn't work great
remote bough
that's very strange
meager juniper
however, after removing the nullspace your matrix is also quite small
only 57
so we could be looking at noise making the shapes unclear.
remote bough
that's the main goal of this paper, finding the threshold at the point were you don't have noise anymore
meager juniper
I think you misunderstand my point?
when you have a small sample size like this, you can get situations where patterns you expect to see sometimes show up too noisy to be confident of, because of the nature of random sampling. I'm not trying to make a larger statement about the conclusions of your paper.
remote bough
I see
I have my data in triplicates, I do the mean of them, maybe I should just let them in as it
I can triple the number of point I should prob do this
remote bough
Ok during showering I realise I actually can't do a matrix bigger than this without it being false. So I guess the answer to my problem is that it's not solvable for my case
In this paper they get 1,417 OTUs compared to my 281 ASVs it's indeed very few
Well, thank you for your help @meager juniper even if it concluded the worst way possible
I'll close this if you don't have anything more to say, sorry for making you lose your time
meager juniper
remote bough
Ok during showering I realise I actually can't do a matrix bigger than this with...
What do you mean by "false"?
remote bough
like
I could add my differents community for each samples, that triples the numbers of things in the matrix. However we're not comparing the differents OTUs after this but the different OTUs in differents communities
so it's not following what the paper says
meager juniper
What is an OTU?
remote bough
think like a specie
it's not really that but for understanding the matrix it's the same
an individual if u want
meager juniper
So, as I understand it, because I'm not an expert, and this is stuff half remembered from over a decade ago, in evolutionary biology, there are measures like G_{ST} to measure differences between individuals in a group and/or groups in a larger population.
Your measurements are then of 3 individuals in a group?
Or 3 groups in a population
Or 3 individuals from 3 different groups within a population?
remote bough
so I have 3 different oxygen condition, here I'm studying one
In it I have 3 different microbial communities A, B and C
In every communities I have around 280 different individuals
The matrix you see here is the mean of every communities for each different individuals
meager juniper
And because they are three different communities, you expect them to behave differently under the same conditions?
remote bough
Yes but in this case I want a global view so I mix the individuals of each communities
meager juniper
So why wouldn't using all three communities be kosher then?
remote bough
Because it means that I will compare the relative abundance of an individual of one community to another and the goal of those procedures is to compares individuals in general. If we add the community factor, it's not what the paper is trying to do
We can do 3 matrixes, one for each community but we can't separate them in the same one
It's like we're trying to compare John, Martin and Jake in the house but to do this we compare Jack in the kitchen to Martin in the bathroom
We have to do the mean of all the rooms to have the view of the whole house
meager juniper
Well, run the problem and idea by your advisor and explain this proposed fix and your reservations about it. They'd be in a good place to judge and give you the thumbs up or down on it
I personally still don't see the problem given that you mentioned that the conditions were similar between the populations
But I'm also not privy to the specifics
remote bough
Alright, they're not here for now i'll talk to them as soon as I can, thx again for your help
remote bough
Ok I'm back, so the 3 differents communities are grown in 3 differents reactors, we can't do coocurences between them since they're not physically at the same place
so no I can't triple my matrix
remote bough
I guess this is the end of our little adventure
 wanton musk
find x
remote bough
@meager juniper I started a fire in the lab, I should have around 3000 individuals but they did the study ona wrong table
it's making like 5 papers wrong
everyone is working to get the data right now xD
I'm juste here for an intership that ending friday
torpid owl
better to find out now so they can submit corrections, before more people cite the incorrect papers
 rocky slate
These guys solving a problem for a week 💀
meager juniper
Well, tbh it doesn't look like there's anything left to solve
@remote bough you comfortable with closing this thread?
remote bough
rocky slate
These guys solving a problem for a week 💀
3 actually
remote bough
meager juniper
<@354188969472163840> you comfortable with closing this thread?
Yup, thanks for your help and sorry for making you lose time on this
rocky slate
🫡
remote bough
.close
odd edgeBOT
Channel closed
Closed by @remote bough
Use .reopen if this was a mistake.
meager juniper
remote bough
Yup, thanks for your help and sorry for making you lose time on this
I lost nothing. Instead I learned about an interesting part of math that I was unaware of previously, and that is valuable to me
Gonna double tap this thread really quick, otherwise it'll be a zombie for a week
.reopen
odd edgeBOT
✅
meager juniper
.close
odd edgeBOT
Channel closed
Closed by @meager juniper
Use .reopen if this was a mistake.
Available help channel!
Send your question here to claim the channel.
Remember:
• Ask your math question in a clear, concise manner.
• Show your work, and if possible, explain where you are stuck.
• After 15 minutes, feel free to ping <@&286206848099549185>.
• Type the command .close to free the channel when you're done.
• Be polite and have a nice day!
Read #❓how-to-get-help for further information on how to ask a good question, and about conduct in the question channels.
 orchid python
hey my question is given here:
https://math.stackexchange.com/questions/4927393/question-on-tangent-planes-and-normal-lines
Any help would be much appreciated.

Mathematics Stack Exchange
PFA the question I am looking at. For this one, I computed that the point P is $(1,1,1)$. Then I find the gradient to the surface and compute it at $(1,1,1)$ which gives me the normal vector to the
odd edgeBOT
orchid python
hey my question is given here:
https://math.stackexchange.com/questions/4927393/...
@orchid python Has your question been resolved?
orchid python
<@&286206848099549185> bump
meager juniper
@orchid python it would be helpful for the helpers (as therefore more likely for them to actually help) if you copy the question into this thread
orchid python
oh ok sure
meager juniper
I haven't read your solution yet, just the question. Here would be my approach. First, find the normal vector of the plane, and find the direction of the line at the point of intersection. Then we know that the dot product between these two values is the cosine between them. So arccos(n.a/(||n|| ||a||)) = pi/2- θ
orchid python
lemme just paste my approach:
I computed that the point P is
(1,1,1). Then I find the gradient to the surface and compute it at
(1,1,1) which gives me the normal vector to the surface as
<1,1,4>.
After this, I find an equation that describes the curve
r(t) which is 𝑧=𝑥𝑦. Then, I find the gradient to this at P as
<−1,1,1>. The angle between the two gradients computed here should be the angle between the curve and the surface but the answer I get from this isn't the right answer.
orchid python
what normal vector are you referring to?
the normal vector to the tangent plane of the surface?
orchid python
ok but wouldn't the curve also have a tangent plane associated with it at the point?
meager juniper
Which is the normal vector of the surface at the point in question
orchid python
yep
meager juniper
orchid python
ok but wouldn't the curve also have a tangent plane associated with it at the po...
You're computing a tangent plane to the curve?
orchid python
yes
i figured that the angle between the two normal vectors of the two tangent planes would give me the answer
meager juniper
It should
orchid python

ye but apparently for the curve r(t), my equation z=x/y is not riight
like ig what im having trouble with is figuring out how to get from the parametric equation of the curve to the cartesian one
meager juniper
Sorry, I needed to go afk suddenly, (dentist) still there
odd edgeBOT
@orchid python Has your question been resolved?
odd edgeBOT
@orchid python Has your question been resolved?
odd edgeBOT
@orchid python Has your question been resolved?
remote bough
meager juniper
I lost nothing. Instead I learned about an interesting part of math that I was u...
I'm glad to hear that
odd edgeBOT
@orchid python Has your question been resolved?
 rain relic
i know that if i want to put 3 things into 4 boxes that can only fit one thing each, there are 4! ways to do this. This is because there are 4 things that can go into box 1 (thing 1, thing 2, thing 3, or nothing), 3 things that can go into box 2, and so on. However, when I try to obtain this answer using another method, I get a nonsensible answer. Please point out to me exactly where the logic is faulty. (I will use the notation (n k) to represent n choose k). First, out of the 4 spots, choose 1 spot. For this spot, choose 1 thing out of the 3 things to go there. This mathematically corresponds to the quantity (4 1) (3 1). Now, we also need to choose 1 spot out of the 3 remaining spots. From there, we need to choose 1 thing out of the remaining 2 things to go there. This corresponds to the quantity (3 1) (2 1). Then we have 1 spot left to pick from 2 spots and only one thing left to put there, leaving us with (2 1)(1 1). Since all these events "build" up on each other (that is the word "and" joins the events), we multiply these quantities together to obtain our final answer. Evidently this answer is wrong when we compute it. But why?
to clarify, assume each thing can be differentiated
nvm I understood why the miscount occurs
Lets say you after running through the first step you place ball b in spot 2. Then, on the next step you put ball a in spot 1. This is equivalent to placing ball a in spot 1 on step 1 and ball b in spot 2 on step 2.
So several steps are going to be duped
odd edgeBOT
Channel closed
Closed due to timeout
Use .reopen if this was a mistake.
Available help channel!
Send your question here to claim the channel.
Remember:
• Ask your math question in a clear, concise manner.
• Show your work, and if possible, explain where you are stuck.
• After 15 minutes, feel free to ping <@&286206848099549185>.
• Type the command .close to free the channel when you're done.
• Be polite and have a nice day!
Read #❓how-to-get-help for further information on how to ask a good question, and about conduct in the question channels.
 jolly zephyr
 odd edgeBOT
jolly zephyr
jolly zephyr
odd edgeBOT
jolly zephyr
jolly zephyr
can someone help
idk how to proceed and find C
i’m so lost
i mean C in trig
like a sine function
 dark kraken
jolly zephyr
i mean C in trig
dark kraken
jolly zephyr
i mean C in trig
You mean cosine?
 dark kraken
Yeah, so you know most of those things, in fact you don’t even need C, you can solve for X when C=0
odd edgeBOT
@jolly zephyr Has your question been resolved?
jolly zephyr
dark kraken
Yeah, so you know most of those things, in fact you don’t even need C, you can s...
how so?
dark kraken
jolly zephyr
how so?
What do you know?
odd edgeBOT
@jolly zephyr Has your question been resolved?
Channel closed
Closed by @jolly zephyr
Use .reopen if this was a mistake.
Available help channel!
Send your question here to claim the channel.
Remember:
• Ask your math question in a clear, concise manner.
• Show your work, and if possible, explain where you are stuck.
• After 15 minutes, feel free to ping <@&286206848099549185>.
• Type the command .close to free the channel when you're done.
• Be polite and have a nice day!
Read #❓how-to-get-help for further information on how to ask a good question, and about conduct in the question channels.
 pine drift
Hey guys
odd edgeBOT
pine drift
Hey guys
pine drift
Is it ok to do it my way? Or should I follow the teachers way?


I mean for the future will it be bad to practice it this way
 latent scaffold
I think I see what you're trying to do, and you do get the right answer, but you might as well just do as is shown
It's not particularly different from the teacher's method
And in particular, the line where you say 225^2 = 15 just isn't right
latent scaffold
Yeah that could work
But they show this step with the factor of 225, so they might require that you use more detail in the computation of the root
latent scaffold
Yeah just safer that way
odd edgeBOT
@pine drift Has your question been resolved?
Channel closed
Closed by @pine drift
Use .reopen if this was a mistake.
odd edgeBOT
Available help channel!
Send your question here to claim the channel.
Remember:
• Ask your math question in a clear, concise manner.
• Show your work, and if possible, explain where you are stuck.
• After 15 minutes, feel free to ping <@&286206848099549185>.
• Type the command .close to free the channel when you're done.
• Be polite and have a nice day!
Read #❓how-to-get-help for further information on how to ask a good question, and about conduct in the question channels.
 solid umbra
Excuse me, does anyone have 'Formations of Finite Groups' by Shemetkov
latent scaffold
Is that a book? A paper?

 low locust
well you can go pirating but this server doesnt like people sharing pdfs of copyrighted (I assume) books
latent scaffold
I can hardly find any reference to the existence of the guy, let alone his book, and most of it is in Russian, so idk if it would be translated
Not saying it doesn't exist, just might not really be available online. There seems to be a few of his papers on arxiv though you might be able to find info there regarding what you want to learn about
odd edgeBOT
@solid umbra Has your question been resolved?
odd edgeBOT
Channel closed
Closed due to timeout
Use .reopen if this was a mistake.
odd edgeBOT
Available help channel!
Send your question here to claim the channel.
Remember:
• Ask your math question in a clear, concise manner.
• Show your work, and if possible, explain where you are stuck.
• After 15 minutes, feel free to ping <@&286206848099549185>.
• Type the command .close to free the channel when you're done.
• Be polite and have a nice day!
Read #❓how-to-get-help for further information on how to ask a good question, and about conduct in the question channels.
Channel closed
Channel closed due to the original message being deleted.
If you did not intend to do this, please open a new help channel,
as this action is irreversible, and this channel may abruptly lock.
Available help channel!
Send your question here to claim the channel.
Remember:
• Ask your math question in a clear, concise manner.
• Show your work, and if possible, explain where you are stuck.
• After 15 minutes, feel free to ping <@&286206848099549185>.
• Type the command .close to free the channel when you're done.
• Be polite and have a nice day!
Read #❓how-to-get-help for further information on how to ask a good question, and about conduct in the question channels.
 tranquil summit
Is there a value of x that would make (tan(x))^2 = tan(x)?
 lavish tulip
assuming tan(x) doesnt equal 0
you can divide both sides by tan to obtain: tan(x) = 1
so tan inverse of 1 is a solution
but we need to check the case when tan(x) = 0 too
tan(x) is equal to 0 when x = 0
so (tan(0))^2 = tan(0)
0=0 so x=0 is also a solution
tranquil summit
Ohhh that makes sense! Based on the answer key I have, I think I need both tan(x)=1 and tan(x)=0. Thank you!!!
lavish tulip
so the only two solutions are $x=\frac{\pi}{4}$ and x = 0
clever fjordBOT
proofAd
 lavish tulip
tranquil summit
Ohhh that makes sense! Based on the answer key I have, I think I need both tan(x...
lavish tulip
tranquil summit
Ohhh that makes sense! Based on the answer key I have, I think I need both tan(x...
yeah that should yeild the same answers
dont forget .close
odd edgeBOT
Channel closed
Closed by @tranquil summit
Use .reopen if this was a mistake.
odd edgeBOT
Available help channel!
Send your question here to claim the channel.
Remember:
• Ask your math question in a clear, concise manner.
• Show your work, and if possible, explain where you are stuck.
• After 15 minutes, feel free to ping <@&286206848099549185>.
• Type the command .close to free the channel when you're done.
• Be polite and have a nice day!
Read #❓how-to-get-help for further information on how to ask a good question, and about conduct in the question channels.
 misty zinc
Can we show that the right branch of hyperbola is decreasing?
 misty zinc
It is an rotated hyperbola.
$r_{x}\ x\ +\ r_{y}\ y\ -r_{x}\ x^{2}\ -\ r_{y}\ y^{2}\ -\ \left(c\ r_{x}\ +\ d\ r_{y}\right)\ xy\ =\ 0$
clever fjordBOT
Vedant
 odd edgeBOT
@misty zinc Has your question been resolved?
odd edgeBOT
Channel closed
Closed by @misty zinc
Use .reopen if this was a mistake.
odd edgeBOT
Available help channel!
Send your question here to claim the channel.
Remember:
• Ask your math question in a clear, concise manner.
• Show your work, and if possible, explain where you are stuck.
• After 15 minutes, feel free to ping <@&286206848099549185>.
• Type the command .close to free the channel when you're done.
• Be polite and have a nice day!
Read #❓how-to-get-help for further information on how to ask a good question, and about conduct in the question channels.
 idle void
Is the answer B?
 odd edgeBOT
idle void
Is the answer B?
odd edgeBOT
idle void
Is the answer B?
 haughty scaffold
something u need to be wary of is the unit conversion that is given to you
it tells you that 1 mile = 1760 yards, but youre not working with miles, youre working with square miles
its not a matter of distance, its a matter of area
so since 1 square mile = 1 mile* 1 mile
then 1 square mile = 1760 yards* 1760 yards
and now that you know the conversion for square mile into square yards, (1 sq.mile = 3097600 sq.yards), you can do the conversion that is asked of you
sneaky question, but its something you gotta watch out for
odd edgeBOT
Channel closed
Closed by @idle void
Use .reopen if this was a mistake.
odd edgeBOT
Available help channel!
Send your question here to claim the channel.
Remember:
• Ask your math question in a clear, concise manner.
• Show your work, and if possible, explain where you are stuck.
• After 15 minutes, feel free to ping <@&286206848099549185>.
• Type the command .close to free the channel when you're done.
• Be polite and have a nice day!
Read #❓how-to-get-help for further information on how to ask a good question, and about conduct in the question channels.
 honest kraken
 odd edgeBOT
honest kraken
odd edgeBOT
honest kraken
 summer cradle
?
summer cradle
do i know you?
 robust pollen
honest kraken
robust pollen
honest kraken
kinda, but I forgot lol
 vernal yacht
honest kraken
vernal yacht
honest kraken
You haven’t solved it?
odd edgeBOT
Channel closed
Closed by @vernal yacht
Use .reopen if this was a mistake.
Available help channel!
Send your question here to claim the channel.
Remember:
• Ask your math question in a clear, concise manner.
• Show your work, and if possible, explain where you are stuck.
• After 15 minutes, feel free to ping <@&286206848099549185>.
• Type the command .close to free the channel when you're done.
• Be polite and have a nice day!
Read #❓how-to-get-help for further information on how to ask a good question, and about conduct in the question channels.
 forest palm
I need help in multiple subjects
odd edgeBOT
forest palm
I need help in multiple subjects


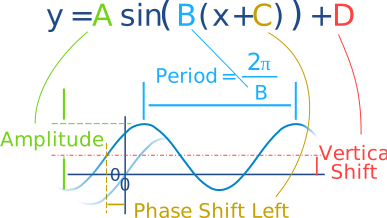
 gilded vector
forest palm
i perhaps need explanations through vc if possible
gilded vector
forest palm
i perhaps need explanations through vc if possible
which ones specifically?
forest palm
i need to it broken one by one, if possible from the basics and all
odd edgeBOT
@forest palm Has your question been resolved?
forest palm
<@&286206848099549185>
odd edgeBOT
@forest palm Has your question been resolved?
odd edgeBOT
@forest palm Has your question been resolved?
 hard rain
forest palm
<@&286206848099549185>
hard rain
forest palm
<@&286206848099549185>
You've posted a picture with multiple questions and another picture of an entire exam.

Narrow it down a bit 👍
odd edgeBOT
Channel closed
Closed due to timeout
Use .reopen if this was a mistake.
Available help channel!
Send your question here to claim the channel.
Remember:
• Ask your math question in a clear, concise manner.
• Show your work, and if possible, explain where you are stuck.
• After 15 minutes, feel free to ping <@&286206848099549185>.
• Type the command .close to free the channel when you're done.
• Be polite and have a nice day!
Read #❓how-to-get-help for further information on how to ask a good question, and about conduct in the question channels.
 burnt current
I cant find this derivative I end up with [2(x(-sech(x)tanh(x) + sech(x)] what am i doing wrong?
 odd edgeBOT
burnt current
I cant find this derivative I end up with [2(x(-sech(x)tanh(x) + sech(x)] what a...
odd edgeBOT
burnt current
I cant find this derivative I end up with [2(x(-sech(x)tanh(x) + sech(x)] what a...
 true garnet
never mind
burnt current
what happens to the other sech?
Im pulling out 2 as a constant and using prosuct rule
true garnet
x is factored out which is confusing
x should only be on the sechx tanhx term
2[-xsech(x)tanh(x) + sech(x)] is correct
burnt current
I get that I just end up with one extra sech
ok but is that the same as the asnwer in my question?
The correct one in green^
true garnet
2[-xsech(x)tanh(x) + sech(x)] = 2sech(x)[-xtanh(x) + 1 ] = 2sech(x)[1 - xtanh(x)]
true garnet
that's why i usually dont write paranthesis unless i have to. it gets overwhelming when theres too many
burnt current
ok thank you so much
true garnet
burnt current
in the answer its seperated right?
2sech(x)[1 - xtanh(x)] is the answer they gave
burnt current
I see now thank you!
How do I find the critical points? I know the derivative and I need to set it to 0 and solve for x, but how do I do that using hyperbolic equations
Is it a calculator question?
odd edgeBOT
@burnt current Has your question been resolved?
Channel closed
Closed by @burnt current
Use .reopen if this was a mistake.
Available help channel!
Send your question here to claim the channel.
Remember:
• Ask your math question in a clear, concise manner.
• Show your work, and if possible, explain where you are stuck.
• After 15 minutes, feel free to ping <@&286206848099549185>.
• Type the command .close to free the channel when you're done.
• Be polite and have a nice day!
Read #❓how-to-get-help for further information on how to ask a good question, and about conduct in the question channels.
mystic saffron
 odd edgeBOT
mystic saffron
mystic saffron
odd edgeBOT
mystic saffron
mystic saffron
So I cant solve it
use set notation
Used it
did you translated correctly words to notation?
I think so
i mean , just looking it you have to solve an equation

Z are all who failed
yeah , i see
I got -95/2
Equations made were

a=5/3
mystic saffron
mystic saffron
yeah , i see
U der?
yes
I am trying to find were the error was
Found smth?