#🔒 2d Graphs in python
37 messages · Page 1 of 1 (latest)
 ember stirrup
 bleak mauveBOT
ember stirrup
I already have matrix wich represents 2d coordinates can somone help me visulali...
bleak mauveBOT
ember stirrup
I already have matrix wich represents 2d coordinates can somone help me visulali...
@ember stirrup
 Python help channel opened
Remember to:
- Ask your Python question, not if you can ask or if there's an expert who can help.
- Show a code sample as text (rather than a screenshot) and the error message, if you've got one.
- Explain what you expect to happen and what actually happens.
:warning: Do not pip install anything that isn't related to your question, especially if asked to over DMs.
Closes after a period of inactivity, or when you send !close.
 half jackal
ember stirrup
I already have matrix wich represents 2d coordinates can somone help me visulali...
half jackal
ember stirrup
I already have matrix wich represents 2d coordinates can somone help me visulali...
like x, y?
ember stirrup
yes
half jackal
a tuple of ints?
half jackal
ember stirrup
so basically a 3d graph
Not sure which graph you want, here's a gallery: https://matplotlib.org/stable/gallery/mplot3d/index.html
 supple sun
2d plots in python
ember stirrup
what package is it
supple sun
matplotlib
you can also refer to this (even though they should be called "plots" or "data visualizations") https://python-graph-gallery.com/
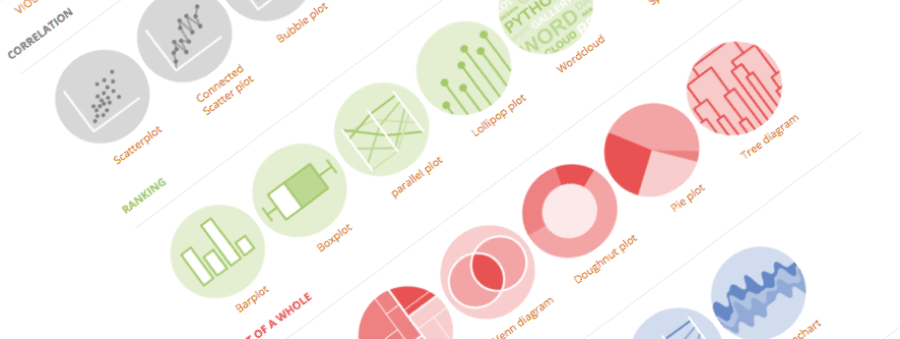
The Python Graph Gallery
The Python Graph Gallery displays hundreds of charts made with Python, always with explanation and reproduciible code
 supple sun
ember stirrup
how to create a list of list indexes
supple sun
ember stirrup
how to create a list of list indexes
what is a "list of indexes", in this case?
supple sun
you can do np.arange(30)
ember stirrup
so i need to be able to acess its elemnets
supple sun
!e
import numpy as np
arr = np.arange(30)
print(arr)
@supple sun :white_check_mark: Your 3.12 eval job has completed with return code 0.
001 | [ 0  1  2  3  4  5  6  7  8  9 10 11 12 13 14 15 16 17 18 19 20 21 22 23
002 |  24 25 26 27 28 29]
if i do like in example

it works
if i do this with my own function

which is

then is get this error
 bleak mauveBOT
 Python help channel closed
This help channel has been closed and it's no longer possible to send messages here. If your question wasn't answered, feel free to create a new post in #1035199133436354600. To maximize your chances of getting a response, check out this guide on asking good questions.