#pyqtgraph
1 messages · Page 4 of 1
 fervent vale
so yeah, RawImageWidget worked out of the box on RPI3 Bullseye 32-bits using distro-provided PyQt5 5.15
Bullseye comes with Python 3.9 though
it supports VAO because it has the GL_OES_vertex_array_object extension
fervent vale
ha.. RawImageGLWidget can be implemented with QOpenGLTextureBlitter (in a new branch called texture-blitter). All the effort in modern_opengl branch was just a learning exercise...
 rough furnace
still a worthwhile learning exercise no doubt! I don't imagine all these different methods have notably different performance
rough furnace
A while back you linked to a gist showing how to pass cupy arrays to opengl directly on the GPU (I could be remembering wrong) do you think that would be an effort worth trying on RawImageGLWidget? I can certainly help test on windows.
fervent vale

GitHub
Hi, I'm trying to display/visualize an image that is of type cupy.ndarray. The project I'm working on loads an image using PIL Image.open and converts it to a PyTorch torch.tensor on the CU...
rough furnace
going through the numpydoc linter, wow, this thing is picky! I mean, it will make the docs better, but I thought I had ImageItem docs in decent shape but yeah... it has other opinions lol
rough furnace
...what on earth, made a documentation change, now triggering segfaults all over the place
self._xp = cp.get_array_module(image) if cp else numpy```

instead of `numpy` it should have been `np` but wow, what a test failure!For setLookupTable, we don't want to advertise that the library permissively accepts ndarrays that are not uint8
rough furnace
I'll say the docs require it...
fervent vale
Either that or coerce it with np.asarray
Although then you have to consider np or cp
rough furnace
pyright is really not happy about the self._xp bit, as it could be None
how's this?
        Parameters
        ----------
        lut : array_like or callable
            `lut` can be a callable that accepts the current image as an argument and
            returns the lookup table to use.  If using a np.ndarray, ensure the dtype
            is `np.uint8`
The Callable part seems to be a feature exclusively for use with HistogramLUTItem
rough furnace
you think I should not advertise callable in the docs?
I could remove it from the docs as an accepted type and leave a blurb about it in the Notes section.
rough furnace
fervent vale
Although then you have to consider np or cp
actually, this is handled in _ensure_proper_substrate method, I could coerce to self._xp.uint8 there...
fervent vale
Based on my read of HistogramLUTItem, Callable exists to provide different lut lengths depending on image dtype
But HistogramLUTItem has now been changed to return 256 by default, I think
rough furnace
I'm good w/ not advertising callable in the docs.
fervent vale
I was reading about Array API and it says that it considers asarray to be an anti-pattern
rough furnace
fervent vale
I was reading about Array API and it says that it considers asarray to be an ant...
huh...
fervent vale
For interoperability between libraries besides np and cp
NEP 47
It's also the rationale for moving away from numpy scalars
They should be single element numpy arrays instead of numpy scalars
rough furnace
numpy scalars likely break various things in our library, I know ksunden ran into some issues there a while back
fervent vale
So in the future, array agnostic code should use array api
So regarding asarray, the array api NEP says that inputs should just be ndarray. Don't allow python lists or any other convertible type
In the future anyway...
For getLevels, I'm not sure that it returns an ndarray. I think it returns whatever was set. The library coerces it to ndarray on use, if only to check whether it was multidimensional
That's the reason for the slowdown in numpy 2.0
User sets it using python list. Library coerces it to ndarray (double). Values are used as scalars. Ends up the image data gets upcasted to double
I think the Callable thing predates setColorMap
Or in any case, there's some kind of coupling between ImageItem and HistogramLUTItem
rough furnace
fervent vale
In the future anyway...
I'm good w/ putting warnings in the docs to only accept ndarray and that future support for array_like will be phased out
rough furnace
"let me add the sphinx spelling extension and run it"
2000 spelling mistakes later
"ok... maybe I won't push this one to CI just yet"
Have to hit the hay, I'll incorporate your other feedback here shortly, I'm good w/ trying to phase out array_like and mandating ndarray ... I can put that on the docs, and add a section in the Notes or Warning about it currently working w/ array_like but that won't work indefinitely. Actually, I would even be good w/ emitting a warning.
fervent vale
I think setLevels just leave it. The internal conversion to ndarray is to check whether it was 2d and is an implementation detail
rough furnace
the type of levels is confusing, but as long as self._xp is not None (which it gets set to cp or np after the first call to setImage with an image, it gets set to np), it should either be None or ndarray: https://github.com/pyqtgraph/pyqtgraph/blob/master/pyqtgraph/graphicsItems/ImageItem.py#L148-L154
 runic umbraBOT
pyqtgraph/graphicsItems/ImageItem.py lines 148 to 154
if self._xp is None:
    self.levels = levels
    self._defferedLevels = levels
    return
if levels is not None:
    levels = self._xp.asarray(levels)
self.levels = levels```the fact that self._xp can be None is really annoying, should just default to np and rotate to cp is present.
similarly if autoLevels is provided, it uses self._xp.asarray to set the levels to.
rough furnace
WARNING: Found 1066 misspelled words
😬 (many of the words identified as misspellings are not, it's still like ymax , setText and things like that. setText should have been grabbed by my script to build out dictionaries tho...)
fervent vale
I don’t think I understood why there is a need to defer levels
But the large amount of statefulness in the name of caching makes the code complicated
Refactoring the fast path functions out to be stateless actually made it easier to reason and to optimize
rough furnace
I think I'm done w/ this PR, I'll let it sit for a bit and see if other folks have suggestions. There are some other annoyances I have about ImageItem (the self._xp bit being None being the main one), but that is a an issue for a separate PR.
rough furnace
also taking recommendation for what page should the docs improve for next.
rough furnace
ok, discovered other stuff I don't like in this PR looking at the rendered output, .... this PR will never end 😅
rough furnace
because I can't leave it alone, decided to incorporate an inheritance diagram. It handles switching between light and dark mode well.
 runic umbraBOT
 :ok_hand: applied timeout to @brave rock until <t:1716751712:f> (10 minutes) (reason: emoji spam - sent 34 emojis).
The <@&831776746206265384> have been alerted for review.
rough furnace
started working on the docs for PlotDataItem last night, and ugh, ... this one is going to be a doozy. so much code to handle arguments coming in in any way shape or form. Definitely will have some API breakage... also using the opportunity to remove MetaArray support from PlotDataItem.
so yeah, not strictly working on the documentation, also redoing the function signatures ...way too much reliance on *args and **kwargs with a mountain of code to handle every combination of arguments/data-structures...
anyway thinking the next release may be 1.0.0 ... tired of zero-ver 😛
fervent vale
It would be at least 0.14.0 to remove MetaArray anyway
rough furnace
i'm not doing another patch release, I've gotten no reports of any other regressions
rough furnace
wow, I'm going to break PlotDataItem in so many ways here. So little is documented, already encountering bugs just doing a close look-over...
also really hating self.opts
fervent vale
If api is to be broken, one good one to break may be GraphicsItem::pos whose only role is to wrap the QPointF into a Point
It is one of the things requiring python inheritance to work
The mixin on the left or on the right issue
In the library, only ROI relies on it returning a Point.
rough furnace
Make a PR, I’ll merge it
Make a solid description for Why tho, Luke will complain
Maybe give Martin (outofculture) a heads up too
 fresh garnet
I made an perfect download manager in python using requests
 rough furnace
fresh garnet
I made an perfect download manager in python using `requests`
rough furnace
fresh garnet
I made an perfect download manager in python using `requests`
Looks great but this is not the right channel for this content
rough furnace
this is so nice, see Phil announce a new pre-release on the riverbank pypi server, a couple of mouse clicks later, the CI is running that wheel...
should have done this years ago
rough furnace
suppose this is getting better...
the fact that all these arguments are under **kargs is driving me up the wall.
 fervent vale
I think the library itself uses a boolean array for the connect argument.
rough furnace
heh, finding other mistakes in the docs, but i'll correct that one ... numpydoc linter is actually... not as unhappy as I thought it would be... still nowhere near "complete" ... going to push a draft PR tonight tho
fervent vale
It's not so much that it was supposed to be a boolean array
It's that boolean arrays convert to the int32 value required when building the serialized format
So an uint8 would work fine too
fervent vale
as an exercise, I am implementing PCMI in OpenGL
fervent vale
many years ago, I implemented something similar in OpenGL < 2.0
The QtOpenGL classes are really quite helpful: VAO, VBO, Texture, Shader
rough furnace
what's PCMI?
fervent vale
PColorMeshItem
rough furnace
Oh right
The thing that really sucks with the OpenGL, at least modern OpenGL is doing thick lines… that I imagine will involve some work
rough furnace
Right but doesn’t PCMI have an edge pen parameter allowing you to specify a thick line?
fervent vale
That's not the useful part for me. With high density data, drawing any edges would blot out the image
rough furnace
do you have a preference towards the bullet list, or the table format for the arguments?
rough furnace
not sure what's w/ the extra bold font in the bulleted list... but I'm thinking I prefer the bulleted list vs. the table.
 rough furnace
 low hemlock
Hi, I am trying to plot serial data that is voltage and current obtained from arduino using python's library PyQt using the graph widget - PlotWidget from PyQtGraph in real time.
So, data is continuously getting acquired based on the sample rate.
Let's say sample rate 10 ms (milli second), that means every 10 ms, data will be acquired and the same has to be plotted in real time.
So, PlotWidget want us to send data in list in setData method:
self.data_line.setData(x, y)
where x is a list containing timestamps and y is a list containing voltage values and the size of x and y has to be same for PlotWidget.
so, as data keeps on coming, these lists will get exceptionally large affecting the memory. Can we do something so that x gets the latest timestamp only and y gets the list of all the voltage values that we are obtaining from arduino, so that memory gets saved.
Is there any other method or library in which this is possible????
rough furnace
You'll have to prune x and y yourself, the library won't (and shouldn't) make guesses on how much data you want to plot or how far back you want to go.
you could append the new data to a Queue (https://docs.python.org/3.12/library/queue.html#queue.Queue) and specify the maxsize to something reasonable, that way old data will fall off on its own.
 onyx saddle
rough furnace
you could append the new data to a Queue (https://docs.python.org/3.12/library/q...
onyx saddle
rough furnace
you could append the new data to a Queue (https://docs.python.org/3.12/library/q...
queues don't drop extra data, it blocks puts instead
You might be thinking of deque
rough furnace
oh, yeah...deque... was going to say, one of those data structures drops old data
fervent vale
You could decouple the plot update from the sampling rate. Have the acquisition append to some list. Have a QTimer set to the desired screen update rate. Whenever the timer fires, keep the last N newest samples and draw them
rough furnace
was just running your PR, and can't help but feel silly for having the workflow
qimage = QImage("filename.png")
image = pg.functions.ndarray_from_qimage(qimage)
...
imageItem = pg.ImageItem(image)
...
wonder if it would be worth it for ImageItem to accept a QImage as its input, not just a numerical array.
fervent vale
depends, is it to be considered a pre-rendered QImage with no more adjustments possible?
that violates many design assumptions of ImageItem
maybe the user would be better served by QGraphicsPixmapItem
rough furnace
about to nump up min numpy to 1.24...
fervent vale
in functions_qimage.py, there are 2 calls to xp.ascontiguousarray that would no longer be needed on numpy >= 1.24
don't know whether cupy is matching numpy behaviour there
rough furnace
I'll remove those calls and test on my windows box before it gets packed up
fervent vale
actually, that feature only requires numpy >= 1.23
rough furnace
oh, even better, I'll try and test tonight
fervent vale
i think it was the colorMaps example running with numba enabled that would fail on numpy < 1.23 if those lines were removed
i.e. it is actually a non-recommended usage that would be needed to hit that codepath
i.e. a combination of col-major and 512-length lut
rough furnace
going back to API breakages, I guess I would need to do another release before 1.0.0 to slap warnings on future API breakages where no warnings currently exist.
fervent vale
In order for the RawImageGLImage to display the peegee image (that makes use of translucent pixels) properly, we would need to add glClearColor and glBlendFunc
rough furnace
Are they only available via pyopengl?
fervent vale
It's available through the self.glfn
fervent vale
It's a bit strange, the peegee image. The transparent pixels are white (255,255,255,0)
The drop shadow is implemented using alpha
rough furnace
@wide prism ☝️
which peegee image specifically?
(chatting w/ Nils in another channel, discord is blocked by his proxy)
rough furnace
 fervent vale
The 512@2x png. But it should be the same for the rest
rough furnace
Nils requested you ese if these two are any different.

 fervent vale
looks too blurry to tell
the drop shadow is not visible against a dark background
ok, I have pushed a PR with the blending enabled. w/o blending enabled, the drop shadow gets rendered as a black border
The image below is w/o blending

alpha is ignored. thus the white transparent pixels show up
the drop shadow is implemented with black pixels with some non-zero alpha e.g. (0, 0, 0, 50)
and was intended to get mixed with the background to achieve the drop shadow effect
this one is with blending, the drop shadow is faintly visible

the white parts are now not from the image but from the background (which was set to white)
rough furnace
oh wow, that looks ...much better
fervent vale
there's a bleed through effect under WSL2 wayland

the translucent portions used to implement the drop shadow effect will show the contents of things behind the window
rough furnace
if it's only on WSL2 Wayland, I would say categorize it as an upstream issue and move on... (or maybe leave a comment somewhere)
fervent vale
It's fixed now
rough furnace
🎊
rough furnace
looking at the diff between your commits and the gl docs, looks like the difference is you specifying the dstAlpha value, and not using the default GL_ZERO?
rough furnace
ugh, so many undocumented classes, I need to run sphinx apidoc to build the basic files... future documentation work I suppose
fervent vale
glBlendFunc uses the provided settings for both the rgb colors and the alpha. It does not leave srcAlpha and dstAlpha as GL_ONE and GL_ZERO.
rough furnace
in unrelated news, netflix seems to use pyqtgraph: https://github.com/Netflix/OpenVPCal
GitHub
Contribute to Netflix/OpenVPCal development by creating an account on GitHub.
rough furnace
I think plotdataitem docs are done… next up, removing MetaArray
rough furnace
any preference on how to breakup functions.py?
I was thinking of starting with two files.
numpy_to_qt.py where it's functions for coverting numpy arrays to Qt objects, and conversely a qt_to_numpy.py for the opposite direction.
that won't get all the methods out of functions.py but would likely trim down a lot of it.
fervent vale
isosurface, isocurve and traceImage probably belong in their own separate file
rough furnace
also low-key terrified of how broken flowchart/library/*.py is... there must be no test coverage there at all.... (but that's another problem)
fervent vale
Canvas was marked to be removed after 2023/09
rough furnace
Forgot about that one… will take that one out next.
fervent vale
I have managed to port the long experimental opengl code in PlotCurveItem to use OpenGL 2.0 shaders in my own branch "curve-qtopengl".
Still uses GL_LINE_STRIP, which is available even in modern opengl
similar to RawImageGLWidget, it uses QtOpenGL only
rough furnace
nice!!!!!!!
if you merge that, I'd like to give a shot at implementing thick lines using a geometry shader: https://github.com/mhalber/Lines?tab=readme-ov-file#geometry-shader-lines
There are some fantastic resources posted for webgl, which i'm hoping could be adapted: https://mattdesl.svbtle.com/drawing-lines-is-hard ...I'd like to give that a shot at some point
fervent vale
is it only macos that does not implement thick lines for opengl?
it is "optional" to support thick lines
rough furnace
I'm not sure what the limitation on thick lines across platforms, but broadly speaking, I remember the specification of thick lines not being consistent or working as expected...
definitely "optional" to support thick lines ... this is mostly something I was thinking would be a good thing for me to try to implement at some point
fervent vale
while testing, I found that PlotSpeedTest changes the GraphicsView viewport widget for any change in settings
due to Interact
any change in any setting will result in a call to useOpenGL(bool)
rough furnace
ugh
fervent vale
which results in a fresh QWidget or fresh QOpenGLWidget being assigned as a viewport
rough furnace
that doesn't seem ideal!
back to opengl merging criteria, I'm going to take a page from the matplotlib mentality regarding merging docs, "if it's an improvement, it gets merged" ... I won't block a PR because it's not "feature complete"
fervent vale
the life-cycle of opengl objects is even less well-defined when using QGraphicsView
My main testing script for PlotCurveItem + opengl is the MouseSelect example
rough furnace
sounds like as good of a place as any. Looking at the diff in the PR, should all the stuff you have in plotcurveitem remain there, like the OpenGLState and GLC dict, or should that go in a more generic location?
fervent vale
OpenGLState is just a class to hold the opengl objects specifically needed for PlotCurveItem
the GLC dict is largish... but the intent is not to duplicate PyOpenGL
if there's a common need in the future, it could be factored out
rough furnace
if the lifecycle is really confusing, especially across platforms/qt-bindings, would help to have a test suite that checks if buffers are destroyed and so on?
fervent vale
there's no mechanism to do a cleanup on termination
On PySide, cleanup does not get called on termination
rough furnace
oh, that doesn't sound ideal!
fervent vale
the issue is that cleanup must be performed with the same QOpenGLContext that was used to create the objects
if that context is destroyed before the cleanup, the cleanup will fail
rough furnace
curious what test coverage will go up to when we remove the canvas module 😂
rough furnace
And 47% test coverage, oooof
 mortal panther
hey there
rough furnace
mortal panther
hey there
Want to make a PR improving the test code coverage? 😂
rough furnace
pijyoi, you have any thoughts on un-vendoring colorama and just adding it to our setup.py/pyproject.toml as a dependency? Years ago it was more common to take the pyqtgraph directory and embed it in a project, but I've been trying to change the project structure to conform to more standard practices.
mortal panther
rough furnace
Want to make a PR improving the test code coverage? 😂
what do u mean
rough furnace
mortal panther
what do u mean
I just set up test coverage to PyQtGraph, it gives a percentage of how much of the codebase is run during the test suite. The number is quite low. If interested in contributing to the project, expanding the test coverage would be a great place to start!
fervent vale
rough furnace
pijyoi, you have any thoughts on un-vendoring colorama and just adding it to our...
Was it only used for some debug output? I only recall it used for the remote graphics. Is there a way to express that it is not needed for normal usage of pyqtgraph?
rough furnace
I thought it was used in the console module too
Yes, we can make it optional, but it’s a bit annoying, would be something like pip install pyqtgraph[something]
If we really want it optional, best would be to emit a warning when colorama is not installed but could be used, but have a valid codepath absent colorama.
rough furnace
Actually may not even need a warning, just document colorama would be utilized if present
rough furnace
We have precedent with doing the same thing with scipy
fervent vale
If it's a small dependency, then just add it unconditionally
Actually the vendored version of colorama is long overdue for update. Windows 10 terminal has native support for ansi sequences
fervent vale
Gist
demonstrate bug in PyQt5 versionFunctions getting deleted - pyqt5_opengl_functions_deleted.py
I have an MRE which I think demonstrates an issue with PyQt5
it seemingly only manifests itself for QOpenGLWidget used as a viewport to QGraphicsView
to summarize the issue: if two (or more) QGraphicsItem separately store the result of versionFunctions(), all except one of the returned versionFunctions() instances will get deleted
rough furnace
I see no reason not to merge pyqtgraph/pyqtgraph#3061 but as you've worked w/ ImageItem way more than I have, I'll let you chime in 😛
 supple leafBOT
 fervent vale
The has_nans keyword is not propagated into the multiple axes codepath. Maybe also make the new argument keyword-only
rough furnace
now that I've unvendored colorama, debating if I want to undo cprint as well, and just try and use colorama elsewhere... probably not.
rough furnace
Last time I heard from bbc131 he said he wasn’t doing much work with PyQtGraph but he was still active. Hopefully he’ll chime in.
fervent vale
the other thing is that paintGL casts the coords to float32
so that's yet another trade-off that the unsuspecting user may not be willing to accept
rough furnace
True, but I think that's a thing for opengl somewhat across the board no? I would be good putting a warning in the docs next to the useOpenGL option.
fervent vale
how about decoupling the decision to make paintGL non-experimental from the paintGL PR itself?
rough furnace
I’m good with that
rough furnace
I'm thinking more about expanding the test suite, but I'm struggling to think of how to test GraphicsItems are displaying as intended in ways other than pixel by pixel comparisons, which I would love to get away from. I mean, I can check attributes easily enough, I can check that plots are rendered correctly, but perhaps doing more image comparison won't be the worst thing in the world...
@plush fulcrum how do you all manage that for matplotlib?
 plush fulcrum
It’s a mix of strategies, though a fair number of image comparisons… which have drawbacks (we have to add tolerance because sometimes different cpu architectures do things slightly different, we are stuck on an old version of freetype because upgrading changes how text is drawn, so all of our test images would need to be regenerated)
rough furnace
pyqtgraph has image comparisons, we got the tolerance down quite a bit by disabling anti-aliasing but yeah, we still have to have some fuzziness (or we could of course save images on each platform, which is something I really don't want to do lol)
rough furnace
Some changes in guvectorize in numba 0.60.0
https://numba.readthedocs.io/en/stable/release/0.60.0-notes.html#new-features
fervent vale
Extremely long thread about debian Qt arm32 using GLES vs arm64 using Desktop OpenGL
In short: there's only enough resources (time and effort) to provide either GLES or Desktop Qt packages for a particular architecture
Many existing desktop programs are coded to OpenGL, providing Qt as Desktop OpenGL allows those programs to run
Using RPI5 and pyqtgraph as an example: because Qt is provided as Desktop OpenGL on arm64, the old pyqtgraph opengl examples run out of the box on Raspberry Pi OS 64-bits
rough furnace
I read through a bit of that, I’m surprised that the effort level is so high to try and include both but as it’s not my field I certainly won’t judge. Also surprised the situation hasn’t changed in 6 years.
rough furnace
I think I'm misunderstanding something, if we're stuck with desktop opengl 2.0 on the Pi, then it's not feasible to write/compile our own shaders, right?
rough furnace
huh, ok I did misunderstand, I thought we needed OpenGL 3.3 to write our own shaders.
oh looks like w/o opengl 3.3, we need to use fixed-mode pipeline
fervent vale
No
#3055 doesn't make use of the fixed pipeline at all
OpenGL 3.3 Core profile enforces that fixed pipeline features are removed. So it's convenient to be sure you didn't slip in any old code
fervent vale
pyqtgraph has some old shaders that make use of fixed pipeline
rough furnace
Phil replied to me on the opengl issue w/ the example you provided:
 fervent vale
context has to be cached because all OpenGL objects (VAO, VBO, Shaders) are tied to the context in which they were created
if the context changes, all the objects have to be recreated
conversely, if the context remains the same (the common case), you can then continue using the objects
In a "normal" application, the context wouldn't ever change
In Qt, re-parenting causes a change in context
It's possible to not cache glfn and simply re-requesting it each time paintGL is called
The assumption is that Qt caches it under the hood and that it is cheap to re-request it
rough furnace
Could we implement setParentItem (or whatever that method is) and recreate the context after super().setParentItem(parent) is called?
rough furnace
I think just throwing a warning in the docs is with limitations on pyqt5 in that regard should be sufficient and assume we are dealing with “normal” applications
fervent vale
Maybe calling keeping a reference to "context" as caching is the wrong term
What #3055 is doing by keeping a reference to "context" is merely to detect a change in "context"
Reparenting is just one way that a context could change
The reference to "glfn" could properly be called caching
Creating a list of function pointers to opengl functions could well be an expensive operation
And Qt is likely to cache it itself
In addition to the function pointers, PyQt populates the returned functions object with a HUGE bunch of opengl constants
So if PyQt doesn't cache the functions object itself, it would be expensive to re-request it each time
rough furnace
If we need to keep a reference but not a Python reference, could we call QObject.setProperty(“context”, context) and retrieve it that way as well?
I would test myself but I’m not at a usable computer for a while…
fervent vale
There's no issue with keeping a reference to context
The issue is that calling context.versionFunctions() kills any previous returned functions
And we don't know if subsequent calls to versionFunctions is cheap due to internal caching
#3055 already has a workaround by manually instantiating the opengl functions
rough furnace
looking over your PRs, should I request glMultiDrawArrays be included in PyQt{5,6}?
rough furnace
anything else you plan on adding to that PR? I'm good w/ merging as is; although I wouldn't mind more comments inserted so I can perhaps follow along a bit more (and maybe try and implement some simple graphicsitems in opengl in the future)
fervent vale
The QOpenGLFunctions class provides cross-platform access to the OpenGL ES 2.0 API.
glMultiDrawArrays isn't listed there
That could explain why it's not included by PyQt
Which parts of the PR need more commenting?
fervent vale
actually, for PySide2, if the functions were obtained via context.functions(), glMultiDrawArrays isn't inside too
context.functions() returns a set of functions that are availble in both GLES and OpenGL
it helps to ensure that you are writing code that work for both GLES and OpenGL
rough furnace
Before the bit about the stenciling and quantization (you referenced the issue) works be good to see the bit of code intended to work around that issue
I don’t imagine there is an easy way to test the code as being compatible with gles and OpenGL
fervent vale
Could you elaborate?
The original solution suggested in the issue was not general enough
It assumed there was only one ViewBox in the window
The idea is to find the drawable area in window coordinates
The old code transforms the drawable area to world coordinates, which in the vertex shader gets transformed back to window coordinates
Due to float32 precision, this back and forth transformation is lossy
In the current code, as you pan your plot, the stencil coordinates remain constant
In the old code, as you pan your plot, the stencil coordinates will change
rough furnace
Ahh, that makes more sense
fervent vale
Using Windows ANGLE was the easiest way to test that it works on GLES
The other change suggested in the issue was to move the origin for the data. However that is something that has more corner cases than I would be comfortable implementing in this PR, which is large enough as it were
The current code should be quite understandable, in my opinion
If you have existing applications, it should run with useOpenGL and enableExperimental
rough furnace
Yeah I need to sit down and read through the diff more closely when I don’t have a cross-continental move looming
fervent vale
I think the only parts that still look similar are the stencil function calls
rough furnace
I do agree the code is clearly written. The suggestion for more comments was for my own benefit when I attempt to add OpenGL support for a simpler GraphicsItem i could read about intent and gotchas a bit better. Not a lot of examples of “modern OpenGL” to work with in the library that represent how we want/should have the implementation work. So comments pointing out edge cases that are being addressed, or gotchas along the way would be quite beneficial imo
rough furnace
that float32 quantization issue is the same thing the SVG exporter sees, I attempted to do a similar thing by moving the data about the center (I also rescaled the data to fit between [-1, 1] but I couldn't get it working right w/o having to call .setData()
fervent vale
Scaling doesn't change the precision of floating point
rough furnace
No, but the way the svg writter worked it was truncating values and appending e+00<whatever> to the string being written to the SVG file.
fervent vale
in the last svg example in #2661, adding 1e7 was sufficient to break svg
for OpenGL (w/o the origin shift applied yet), it needs 1e8 and more to trigger the quantization effects
for me, the applications where OpenGL curve plotting used to break down were those using DateAxisItem since the "now" offset is 1.7e9
rough furnace
are you planning on adding anything else to your plotcurveitem PR? I'm good w/ merging as is, but you've kept adding stuff 😂
(don't get me wrong, the functionality/fixes you've added are great, they weren't things I was even aware of is all)
fervent vale
It's done
it's almost at parity with the non-opengl codepath
no step, no filling
connect and pairs have different behavior in the presence of non-finites
that's fine, because in my opinion, having non-finites in those modes is undefined behavior
in other words, I consider the non-finite behavior that the non-opengl codepath has for those two modes to be undefined behavior
rough furnace
i have a lingering method memory of drawing text in opengl didn't use subpixel aliasing or something like that...
fervent vale
yes, the text rendering looks less sharp
rough furnace
googling around about that a while ago, seems like freetype is the typical solution there, I am open to adding freetype as an optional dependency but you certainly don't need to add support to that for this PR
fervent vale
the thick lines mode implementation for the non-opengl codepath was trying to mimick bug-for-bug the thin lines mode implementation
particularly for the connect and pairs mode
rough furnace
As I was going through the docs for PlotDataItem, I sort of developed a hatred for how pyqtgraph tries to handle every conceivable scenario of data coming in in a variety of ways (dicts of lists, lists of dicts, recarrays) and having defined behavior for how we handle NaN's in every way .... yeah I'd love to reduce the code complexity and improve correctness at the expense of not handling every possible case and making the users have to do potentially more work...
rough furnace
<@&831776746206265384> 👆
 proper summit
!ban 370195313140695044 spreading malware
runic umbraBOT
:ok_hand: applied ban to @thorn obsidian permanently.
 haughty quartz
How would I have two plots on the same graph but two different datas? As in, one line would be runtime (in ms) and the other line would be frames per second
So there would be a label on the left for runtime (ms) and label on the right for fps
- line


if that makes sense
Like a hydrograph from geography - https://mammothmemory.net/images/user/base/geography/River landscapes/hydrograph-3a-in-river-landscapes-geography.3a8257c.jpg
 rough furnace
If you can reuse the same axes/scale this is pretty easy as you can call a number of different plot item methods https://pyqtgraph.readthedocs.io/en/latest/api_reference/graphicsItems/plotitem.html#pyqtgraph.PlotItem.plot
(Also check out the multidataplot method)
rough furnace
@torn coyote https://jupyterlite-sphinx.readthedocs.io/en/latest/
Numpy has a PR to add interactive examples to their docs (I guess SciPy already does that?)
We should experiment if we can get Jupyter-rfb to work with this and see if we can do interactive examples as well

GitHub
Description
This PR adds support for WASM-powered interactive examples with JupyterLite and jupyterlite-sphinx in the NumPy documentation.
A similar enhancement was made for the documentation for S...
rough furnace
Hmm Jupyter lite doesn’t have server interaction, so I guess this runs via pyiodide and webassebly which I don’t think qt bindings support (yet?)
haughty quartz
rough furnace
If you can reuse the same axes/scale this is pretty easy as you can call a numbe...
Yes but I don't want to reuse the same axes
rough furnace
haughty quartz
Yes but I don't want to reuse the same axes
You can add a right hand axes I think but the values will be the same. To have different scales on the same plot is quite tricky. The library doesn’t help you out there, there are some PRs intended to implement that but we haven’t merged either of them
rough furnace
@fervent vale I'm about to merge pyqtgraph/pyqtgraph#3068 unless you plan on other changes
supple leafBOT
fervent vale
no more
I was looking at the PlotCurveItem regular paint() path. There's some redundant logic on avoiding creation of shadowPen added there by #816. setPen, setShadowPen ensure that the pens are either only None or a QPen.
I already removed mkPen, mkBrush from the paintGL path
rough furnace
nice,... so much of that code has just been addition after addition (largely done by me 😬 ) if you see the opportunity add some test code to add coverage, I highly encourage that,. ... our test coverage is < 50% 😬
Still not sure how to vastly increase the test coverage of the test items w/o doing more image to image comparisons which I'm not particularly keen on...
if you hve thoughts on how to improve test coverage on the graphic items, please share!
almost too bad we are stuck w/ the fill stuff and can't convert PlotCurveItem to use drawPolyline
fervent vale
The QPainterPath is also used by the mouse click detection
rough furnace
oh! yeah, that's needed 😬
fervent vale
so in a model where everything (curve, fill, mouse shape) revolves around QPainterPath, anything else becomes extra overhead.
rough furnace
last I checked, the .drawPainterPath usage was almost as fast as .drawPolyLine ...if the mouse interaction is dependent on QPainterPath, staying w/ that makes the most sense.
Now I'm curious about mouse interaction and thick lines (since that uses .drawLines)
fervent vale
if you use thick lines, then a QPainterPath is still generated for mouse shape
it's lazily created only if mouse shape is needed
okay i have refactored the pen / shadowpen thing
rough furnace
unrelated to pyqtgraph but you have much experience w/ wifi mesh networks? In our assigned housing, running ethernet cabling is out of the question unfortunately, and the walls are pretty thick, so I'll likely need something w/ a whole lot of wifi-mesh APs... I have some ubiquiti network equipment, but haven't really used it in mesh mode before (does it work well?) open to other recommendations.
fervent vale
rough furnace
unrelated to pyqtgraph but you have much experience w/ wifi mesh networks? In ou...
No, I don't have any WiFi mesh at home. I do have 2 APs connected using ethernet over power though.
rough furnace
fervent vale
No, I don't have any WiFi mesh at home. I do have 2 APs connected using ethernet...
That’s the setup I had at my home in the states. It worked great.
 untold matrix
what channel is there for help?
rough furnace
 slender mortar
python help needed
slender mortar
python help needed
wrong channel, look at #❓|how-to-get-help
slender mortar
mb
fervent vale
HistogramLUTWidget hardcodes useOpenGL=False (instead of using whatever was configured in the config options) since the beginning of git history.
PlotCurveItem paintGL has implemented enough to render the stuff used by HistogramLUTItem
So it would be possible to change HistogramLUTWidget to useOpenGL=None
There are 2 bundled examples: ImageAnalysis and ImageView
The former uses HistogramLUTItem so will use whatever OpenGL config was set. The latter uses HistogramLUTWidget so disregards OpenGL config
rough furnace
Setting useOpenGL to none makes sense to me
rough furnace
<@&831776746206265384> ☝️
 vivid crescent
!ban 1156042416919429210 upwork scam
runic umbraBOT
:incoming_envelope: :ok_hand: applied ban to @lean lava permanently.
 young vessel
rough furnace
young vessel
rough furnace
not going to lie, was curious when a opengl implementation of PCMI was going to pop up 😄
fervent vale
The bundled PColorMeshItem example doesn't really lend itself to benchmarking. Increasing the number of quads does not increase the density, but rather lengthens the data, which makes the output look not nice
rough furnace
I'd like to keep that example (it does look nice) but definitely up for adding another more suitable example to the benchmark section.
although I am struggling to think of what would be a good example for benchmarking...
fervent vale
I think the equation needs to be normalised so that increasing the size should only change its density
fervent vale
2 million quads at 25 fps (only Z varying), that's good enough for my use case
rough furnace
That’s a lot of quads! Nice work!
 half jewel
@alpine token Please don't advertise your trading bot on the server. It isn't on topic (we aren't a crypto server). I've removed your message.
 alpine token
hi lol thanks for not banning me. As you can see, my name says it all. And luckily that link is expired anyways...
fervent vale
Surprisingly, pyqtgraph is in the top ~4000 pypi downloads?
half jewel
That's pretty impressive 🎉
rough furnace
I knew we were top 1% since pypi required my account have 2FA
fervent vale
A monthly dump of the 8,000 most-downloaded packages from PyPI
pyqtgraph is at rank 4082
rough furnace
Thanks for the link, was going to ask for the source!
On reddit, i saw a thread asking about niche Python packages and PyQtGraph was one of the highest upvoted packages listed haha
fervent vale
The new implementation now goes to 4 million quads at 50 fps
rough furnace
by "new implementaiton" I assume you mean the diff from the 2nd commit in your PR about IBO and "flat shading"? Saw that commit as I was getting ready to go to bed last night, ...
oh, also love the use of the enum flags.
what's IBO short for? is this where you reuse the points in the triangle that overlap?
fervent vale
Index Buffer Object. Another name is Element Buffer Object. Mesh is specified as indices, so shared vertices can be reused
However, sharing vertices is not enough, because colors are interpolated from the color of each vertex of the triangle
rough furnace
that i did know from the little tinkering I did w/ opengl a while back... got some nifty gradients which I was confused by but then realized why it was happening
fervent vale
So in the old implementation, vertices can't be shared for this reason
You need the flat shading feature
So that the colour of each triangle comes from only 1 vertex
So previously you needed 6 vertices per quad, I.e. you needed to upload 6 times the number of Z values
rough furnace
ahh ok, so performance boost in that last commit is largely from not having to compute gradients across 6 vertices
fervent vale
Not wasting cpu time creating a luminance buffer that is 6x bigger
rough furnace
I have zero feel for opengl related performance optimizations, I just imgine just lessening buffer sizes and moving computation into the shader code whenever possible is the primary sort of thing to do.
fervent vale
So for 4 megapix, that's 16 MB to upload per frame. (or 96MB if without IBO)
Moving rescale data into shader was a big win too
For a static image, you could effectively do change in levels and lut with no uploads
rough furnace
how are you testing your branch? disregard just saw the initial post in your PR
fervent vale
My real use case is visualisation of live sensor data that is not rectangular
rough furnace
Can you describe what you're measuring? Most of the "live" sensor data I've worked with I either want to treat as line plots, or convert to a frequency domain and view as a spectrogram or power density of some kind ...
fervent vale
Say a plot where the grid is polar
rough furnace
really wish Qt gave some way to handle non-linear transformations...
fervent vale
I can't find any open source data, so I can't make a freely available example
rough furnace
it's fine, I've worked w/ some polar plot data (radars/fire-control systems) before long ago
fervent vale
#3093 is puzzling
I mean, sure, on a non-Qt based OpenGL app, it's up to the developer to create either a Desktop or a ES context
But on a Qt app, surely Qt should do the right thing and create whatever context the library was compiled against to begin with?
rough furnace
sounds reasonable to me, wonder if this issue is new... are you able to reproduce the issue yourself?
fervent vale
The "right" thing occurs on my systems
rough furnace
Guess it’s a PySide bug?
fervent vale
It would be a Qt bug
One thing I noticed from the user's eglinfo output is that for the Nvidia device, "EGL client APIs" list OpenGL_ES before OpenGL
so it could be that Qt's default surface is "DefaultRenderableType", which probably chooses the 1st item it finds from the system
after all, the 1st item "probably" is considered the "preferred" selection
I had hopes that one might be able to toggle to GLES in order to test out GLES on a Desktop system
but it doesn't work, it will crash
fervent vale
A new finding: on Linux and using pypi provided PySide6, it is possible to use either OpenGL and OpenGL ES by setting the RenderableType beforehand. It crashes on Windows if you ask it to use OpenGL ES.
That simplifies testing of the GLES codepath greatly.
It probably wouldn't work on macOS
There are some other issues to resolve though: the versionFunctionsFactory does not work for GLES and an alternative has to be found
- is this only true for the wheels provided on pypi (I.e. Compiled by the Qt company). How about distro provided versions.
rough furnace
suppose we should check conda packages, ... would this be something that we could/should do in CI since we already test conda/pypi on each platform?
fervent vale
It's something that you would just check offline rather than using the CI
rough furnace
sure, but I don't have access to the 3 major platforms and with conda/pypi distributed packages in each right now 😛 was thinking CI might be able to verify that quicker since that's already setup (I know it doesn't test the linux distro variants of Qt)
fervent vale
it doesn't work with PyQt bindings
it's a PyQt limitation, not a Qt limitation
or rather the issue can be broken down into 2 parts: 1) does Qt allow creation of GLES surface; 2) does the binding include the OpenGLFunctions
PyQt's issue is with (2)
It assumes that ES2 and Desktop are mutually exclusive
Unless conda or distros patch PyQt for this niche use-case, I think it's safe to assume that PyQt doesn't have this feature across the board
rough furnace
conda definitely does patches on PyQt and PySide
not sure if they would patch this case or not...
even more confusing is the patches on the conda defaults channel will be different from the conda-forge channel
fervent vale
The other niche use-case is that of using Qt's OpenGLFunctions
in Python
ah... the CI has already failed for conda PySide6
rough furnace
for additional context, pyside2 is dead to me... if you get to the point that something works except on pyside2, ... yeah skip that test, or disable that functionality for pyside2...whatever is easier
fervent vale
on a macOS running Qt, what version of OpenGL do you get?
rough furnace
isOpenGLES: False
VENDOR: Apple
RENDERER: Apple M2 Max
VERSION: 2.1 Metal - 88.1
huh, ... what's w/ 2.1, macOS can run OpenGL 4.1
fervent vale
that's what I saw in some forums too
but the CI macOS runners also show 2.1
So by right, the pcmi peegee wavy script was not using the more optimized flat shading path on macOS
rough furnace
Run python -m pyqtgraph.util.glinfo
openGLModuleType: 0
isOpenGLES: False
VENDOR: Apple Inc.
RENDERER: Apple Software Renderer
VERSION: 2.1 APPLE-21.0.19
GLSL_VERSION: 1.20
pyside shows the same thing...
except openGLModuleType: OpenGLModuleType.LibGL
fervent vale
0 == LibGL
rough furnace
yeah I don't think I'm seeing the performance optimizations for the flat shading; man this is a bummer
fervent vale
I read that macOS supports OpenGL 4.1 Core, not OpenGL 4.1 Compatibility
So the default might be 2.1, but possibly special setup is needed to get 4.1 Core
 drifting perch
yeah its flat shading
 tawny silo
hi
i am using pyqtgraph with pyside, it works fine for sometime but later the graphs freezes because i am updating them on a different thread, any other way to use threading with pyqt
rough furnace
The general guidance is you need to update the graph on the gui thread (main thread), you can use threading to prep our collect the data to plot but you need to plot on the main thread.
There is a remote plot in the library that does allow for plotting on smother thread but it’s got other complexities and i wouldn’t recommend it
fervent vale

GitHub
Is it okay to use setData() on another thread? I digged in the docs and nothing about thread-safety was written in there.
tawny silo
rough furnace
The general guidance is you need to update the graph on the gui thread (main thr...
thank you
rough furnace
Wow, what a good day to not work at Crowdstrike (or be a customer of crowdstrike)
runic umbraBOT
:incoming_envelope: :ok_hand: applied timeout to @alpine lance until <t:1721489305:f> (10 minutes) (reason: duplicates spam - sent 4 duplicate messages).
The <@&831776746206265384> have been alerted for review.
rough furnace
huh, this might be the first time I've seen this failure (it does look familiar so maybe just the first time i've seen it in a while) https://github.com/pyqtgraph/pyqtgraph/actions/runs/10042142913/job/27751887171?pr=3107

GitHub
Fast data visualization and GUI tools for scientific / engineering applications - Bump pytest from 8.2.2 to 8.3.1 in /.github/workflows/etc · pyqtgraph/pyqtgraph@68f3911
_____________________________ test_timeslide_snap _____________________________

    def test_timeslide_snap():
        count = 31
        frames = np.ones((count, 10, 10))
>       iv = pg.ImageView(discreteTimeLine=True)

tests\imageview\test_imageview.py:22:
_ _ _ _ _ _ _ _ _ _ _ _ _ _ _ _ _ _ _ _ _ _ _ _ _ _ _ _ _ _ _ _ _ _ _ _ _ _ _ _
pyqtgraph\imageview\ImageView.py:136: in __init__
    self.ui.setupUi(self)
pyqtgraph\imageview\ImageViewTemplate_generic.py:32: in setupUi
    self.histogram = HistogramLUTWidget(self.layoutWidget)
pyqtgraph\widgets\HistogramLUTWidget.py:22: in __init__
    self.item = HistogramLUTItem(*args, **kargs)
pyqtgraph\graphicsItems\HistogramLUTItem.py:107: in __init__
    self.vb = ViewBox(parent=self)
pyqtgraph\graphicsItems\ViewBox\ViewBox.py:230: in __init__
    self.updateViewLists()
pyqtgraph\graphicsItems\ViewBox\ViewBox.py:1752: in updateViewLists
    nv = sorted(ViewBox.NamedViews.values(), key=view_key)
_ _ _ _ _ _ _ _ _ _ _ _ _ _ _ _ _ _ _ _ _ _ _ _ _ _ _ _ _ _ _ _ _ _ _ _ _ _ _ _

view = <[RuntimeError('Internal C++ object (ViewBox) already deleted.') raised in repr()] ViewBox object at 0x1ccd029f500>

    def view_key(view):
>       return (view.window() is self.window(), view.name)
E       RuntimeError: Internal C++ object (ViewBox) already deleted.

pyqtgraph\graphicsItems\ViewBox\ViewBox.py:1749: RuntimeError
Gist
PyQt glDrawElements binding issue. GitHub Gist: instantly share code, notes, and snippets.
An MWE demonstrating a PyQt OpenGL binding issue
The equivalent in PySide6 works but involves a few changes other than just changing the binding import
The issue is in PyQt5 too, but for the sake of brevity, the script isn't compatible with PyQt5
 terse hearth
Can I ask a question about pyqtgraph here? I need help with implementing something
fervent vale
Sure
rough furnace
thanks for modernizing the GL stuff @fervent vale 🙏
is the usage of GL_SELECT problematic/difficult to replace with a non-fixed pipeline equivalent?
fervent vale
Yes, it looks difficult
I thought GLVolumeItem would be difficult, but in the end it wasn't
Didn't even need to understand the core logic...
rough furnace
not sure if you've chatted w/ the folks on the modern gl discord server, but they are super helpful for opengl related questions (not just specific to moderngl)
fervent vale
The first one (GLMeshItem) to be converted was the most difficult
I think the question people would ask is why even go to OpenGL 2.1 programmable pipeline only
rough furnace
There's incentive for both wanting to write our own shaders, and for running on the most amount of hardware we can
fervent vale
BTW, the GLSurfacePlot animated example already looks different across different desktop gpus
On Intel, you will see a purplish colour on the negative amplitudes
On nvidia and amd, it appears black
rough furnace
This reminds me of something I read in the OpenGL subreddit about different default values on different OpenGL drivers… anyway not a big deal
fervent vale
it's use of undefined behavior
pow(x, y) is undefined for x < 0
and the 3d sinc function goes from -10 to +10
rough furnace
oh, right... yeah makes sense
fervent vale
so on one driver, it probably does pow(abs(x), y) instead, since x couldn't possibly be < 0
and on another it may just return a 0
oh, I didn't notice before. GLScatterPlotItem (and by extension GLGraphItem) didn't use to work on the RPI5. And also the grid lines used to be not visible
now they all work!
rough furnace
nice!!!!!
something about high performance visualizations on really weak hardware like that is super slick
fervent vale
Only the GLLinePlot example looks bad by default on the RPI5. Need to turn off anti-aliasing to look good

The grid used (on master) to have the same sort of look, and would only be visible if I disabled antialiasing
But now that GLGridItem uses GLLinePlotItem under the hood, I am not sure why the grid is visible but the curves still look the same
terse hearth
terse hearth
Can I ask a question about pyqtgraph here? I need help with implementing somethi...
I have a very quick question idk if it's possible but is there a way to make these grid lines less transparent

I have a class subclassing PlotWidget with the pen lines as ```py
x_grid_pen = pg.mkPen(color=grid_color, width=3)
y_grid_pen = pg.mkPen(color=grid_color, width=3)
plot_item.getAxis('bottom').setPen(x_grid_pen)
self.plot_left_axis.setPen(y_grid_pen)
``` grid_size is "g" by the way
nevermind I got it I had to add alpha=1 in showGrid
another quick question, is there a way to make the border between the graph and ticks a different colour? Right now it's green but I want it to be yellow
 terse hearth
I meant the thicker green lines that show as a border so the vertical and horizontal line that shows the level (not the grid)
fervent vale
I have a private branch "check-core-profile" to test what needs to be straight out eliminated in order to run under Core Profile
minimally, what's left that needs to be eliminated are gl{Push,Pop}Attrib()
the rest like itemsAt() don't get activated if you don't use them
I am not sure what the side effects of removing gl{Push,Pop}Attrib() will be
much of the code just enables states that it needs w/o disabling them at end of use
part of that may have relied on gl{Push,Pop}Attrib to restore the state to a clean slate
all the OpenGL examples are standalone, meaning we don't get to see any bad interactions between GLGraphicsItems
(the exception being GLGridItem which gets used in almost all the examples)
rough furnace
terse hearth
another quick question, is there a way to make the border between the graph and ...
I don't think there is a way to do this easily off the top of my head; pretty sure the paint method draws all those with the same color...maybe a way to do it if you subclass AxisItem and override the paint method.
i'm not sure about gl{Push,Pop}Attrib ....my first thought would be to ask the modernGL folks, usually if you can link them to some existing code they're super helpful
rough furnace
for NaN stuff, looks like SciPy is about to roll out an API, which I wonder if it would be helpful to look at mirroring that: https://docs.scipy.org/doc/scipy/dev/api-dev/nan_policy.html
fervent vale
My all-in-one opengl testing script
 rough furnace
Missing the grid item? 😛
fervent vale
Volume isn't inside. Anything else not inside are just derivative classes
rough furnace
oh, I can see the grid now that i'm on my desktop, on mobile, it downsampled the resolution so much I couldn't see the lines in the background
fervent vale
now volume is represented too
 fervent vale
woot, pyqtgraph now runs on OpenGL ES
rough furnace
Nice work!!!!!!
fervent vale
apparently GL_SELECT picking doesn't work with shaders
so it's not a question of whether GL_SELECT is modern or not
it no longer works with the programmable pipeline
so even if the code is left behind, it no longer works
I had an example in #2650 that demonstrates picking of GLImageItem(s)
it no longer works once the commit to draw GLImageItem using shaders is included
rough furnace
ugh....
fervent vale
even the example in #2650 is contrived
I am not sure if it worked before at all before for the other GLGraphicsItem
fervent vale
That's strange, even though Matplotlib 3.9.1 has been yanked, Windows CI runners still manage to download the source tarball and build it (and fail during the tests)
rough furnace
wonder if there is some caching going on ... i'm assuming that's the source of the windows CI failures?
fervent vale
I was wrong about the GL_SELECT not working with shaders
It stopped working with shaders on my Windows AMD gpu laptop
However it still works on 3 other (Linux) systems that I tested on: WSL2 llvmpipe, RPI5, Intel Iris Plus
rough furnace
I can test on macOS and windows with a NVIDIA GPU (and windows with amd GPU on my MacBook running boot camp)
fervent vale
If you are testing, the script from #2650 needs the makeCurrent() added.
fervent vale
rough furnace
wonder if there is some caching going on ... i'm assuming that's the source of t...
GitHub
Fast data visualization and GUI tools for scientific / engineering applications - pyqtgraph/pyqtgraph
Because of dependabot, pyqtgraph has pinned matplotlib 3.9.1 even though it got yanked
fervent vale
OpenGL GL_SELECT
rough furnace
alright, merged the change lowering the matplotlib version, feel free to rebase from master to make CI green again
 digital void
/me for calculator science engineering script
terse hearth
I have a quick question when I make a pen using pyqtgraph, how do I set the line style at a later stage in code? I figured that since pyqtgraph returns a QPen object, I can call setStyle on it but this doesn't work; it doesn't do anything: ```py
self.x_grid_pen = pg.mkPen(color=grid_color, width=1)
self.y_grid_pen = pg.mkPen(color=grid_color, width=1)
and a little bit later in the code: ```py
        self.performance_tab.memory_grid_widget.x_grid_pen.setStyle(Qt.DotLine)
        self.performance_tab.memory_grid_widget.y_grid_pen.setStyle(Qt.DotLine)

        self.performance_tab.cpu_grid_widget.x_grid_pen.setStyle(Qt.DotLine)
        self.performance_tab.cpu_grid_widget.y_grid_pen.setStyle(Qt.DotLine)
``` am I missing something? Is this enough information?nevermind I got it just had to re-set the pen using setPen for the plot axes
terse hearth
I have another question, how do I make these ticks have a label such as Mb/s, B/s, Gb/s for network usage tracking:

for the left plot axis
Also how do I prevent there from being TOO many ticks, I don't want it to look like this when a bunch of values happen
 rough furnace
Can’t remember off the top of my head how to do the units bit but I know that’s supported. What you have with the overlapping numbers shouldn’t be happening tho
terse hearth
rough furnace
Can’t remember off the top of my head how to do the units bit but I know that’s ...
Is this a bug?
right now I have to run this function to prevent all these ticks from happening but I'm not sure if I like this way of doing it, I was hoping there was something natively supported in pyqtgraph ```py
def set_equal_tick_spacing(self, n_ticks):
min_y, max_y = self.viewRange()[1]
if 0 <= max_y <= 32:
return # too small for change
    interval = (max_y - min_y) / n_ticks
    ticks = [(min_y, str(min_y))]
    for i in range(1, n_ticks + 1):
        tick_value = min_y + i * interval
        ticks.append((round(tick_value, 3), str(int(tick_value))))

    self.plot_left_axis.setTicks([ticks])```
If you can create a minimum example showing that, definitely make an issue.
terse hearth
terse hearth
I have another question, how do I make these ticks have a label such as `Mb/s`, ...
well for now if anyone knows how to do this let me know
rough furnace
terse hearth
well for now if anyone knows how to do this let me know
Do none of the examples do this?
terse hearth
rough furnace
Do none of the examples do this?
I've tried searching I couldn't find it
terse hearth
terse hearth
right now I have to run this function to prevent all these ticks from happening ...
when I try to do it manually with this function (setTicks) using the correct unit labels the graph works for a little bit then breaks and shows nothing for the tick values
for reference this is the newly updated function I'm talking about ```py
def set_equal_tick_spacing(self, n_ticks):
min_y, max_y = self.viewRange()[1]
min_y = 0 if min_y < 0 else min_y
if 0 <= max_y <= 32:
return # too small for change
    #print(min_y, max_y)
    interval = (max_y - min_y) / n_ticks
    ticks = [(min_y, str(min_y))]
    for i in range(1, n_ticks + 1):
        tick_value = min_y + i * interval
        tick_value_speed, tick_value_speed_label = sys_utils.get_memory_size_info(
            int(tick_value)
        )
        tick_value_speed_full = f"{tick_value_speed} {tick_value_speed_label}/s"
        ticks.append((round(tick_value, 3), tick_value_speed_full))

    print([ticks])
    self.plot_left_axis.setTicks([ticks])``` `tick_value_speed_label` should be something like MB or GB or something like that
to make it easier to understand, it's basically settings the ticks to something like py [[(0, '0 B/s'), (1739.582, '1.74 KB/s'), (3479.163, '3.48 KB/s'), (5218.745, '5.22 KB/s'), (6958.326, '6.96 KB/s')]]
perhaps the labels on the right are the problem? When I remove them and just set the number and label to be equal it works just fine but it's not what I'm going for py (1739, "1739")
fervent vale
Are you asking how to set units? There's a setLabel method for that that automatically prepends SI prefixes

GitHub
hi, I have been trying to get a reference list of all the acceptable values for units such as example>> units ='s' there are a few examples of some letters used however without explan...
terse hearth
If I do that as an example py self.setLabel("left", units="MB/s") I get this

but I was more going for something like

is this possible?
fervent vale
Not to my knowledge, I don't think that's built-in functionality. For your case, I suspect that the library code hasn't taken into account that the custom string could be longer than the length of the digits
terse hearth
terse hearth
for reference this is the newly updated function I'm talking about ```py
def...
but it's weird because this function works, it does exactly what the second picture is showing but only shows the correct values SOMETIMES otherwise it doesn't show it at all
which means it should be possible to do
terse hearth
terse hearth
to make it easier to understand, it's basically settings the ticks to something ...
I think the problem is just the fact that it doesn't understand how to handle floating point numbers for the labels, so you can't have something like 3.45 KB/s, it must be rounded to 3 KB/s
terse hearth
terse hearth
I think the problem is just the fact that it doesn't understand how to handle fl...
actually nevermind that's not the issue at all
terse hearth
fervent vale
Not to my knowledge, I don't think that's built-in functionality. For your case,...
I think that this is right
actually nevermind I'm really not sure
I think the problem actually might be that the left axis width is too small for the tick to display, so pyqtgraph just doesn't draw it at all
yep that was the problem making it thicker fixed it

I really wish there was a native way to do this in pyqtgraph though, adding a custom unit for the actual ticks instead of a label would be really cool
one thing that just bothers me is when something like this happens, I'm really not sure why it happens, I think it might be when a large sudden jump of values gets plotted maybe? Like from 0 to 10 to 1000000 in a very short amount of time

anyways that just gets fixed when I call setTickSpacing with major and minor values
terse hearth
One extra thing how do I make the plot go ABOVE the grid, not behind
 terse hearth
(fyi this is how the grid is being set) ```py
self.x_grid_pen = pg.mkPen(color=grid_color, width=1)
self.y_grid_pen = pg.mkPen(color=grid_color, width=1)
plot_item.showGrid(x=True, y=True, alpha=0.9)
self.plot_bottom_axis.setPen(self.x_grid_pen)
self.plot_left_axis.setPen(self.y_grid_pen)
also the plot item is being set Z Value as wellpy
plot_item.setZValue(10)``` but this doesn't work
anyone know?
rough furnace
This comes up a fair amount so do a search on the issue tracker, you may need to set the z value of the axis items to something lower
terse hearth
rough furnace
This comes up a fair amount so do a search on the issue tracker, you may need to...
Will do, I’ll search the issues on the repository and see if I can find something there
rough furnace
Maybe the Si unit functionality im thinking about is only for SpinBoxes and doesnt exist for AxisItem
rough furnace
@terse hearth sorry you're running into so many issues 😅 ...the grid issue keeps coming up. GridItem is made the way it was for performance reasons, but that was a long time ago, since then, PyQtGraph has had major performance improvements (thanks pijyoi!) so we could probably take a performance penalty and make GridItem behave like other GraphicsItems, and not have it coupled to AxisItem as tightly
rough furnace
https://github.com/pyqtgraph/pyqtgraph/actions/runs/10285073379/job/28462499843?pr=3122
nothing like an unusual version number to break your custom handling code; at least I know that I have access to the packaging library in the test suite so I should be able to fix this
terse hearth
rough furnace
<@940691242495385722> sorry you're running into so many issues 😅 ...the grid i...
Thanks I really appreciate the work you guys are doing for pyqtgraph it's a very useful tool. The performance penalty for GridItem and GraphicsItems should maybe be an option in the future
rough furnace
I’m not clicking that lol; post a GitHub gist
 pulsar sinew
Deleted as a precaution. Post GitHub.
rough furnace
Pijyoi, you done with 3109?
fervent vale
rough furnace
Pijyoi, you done with 3109?
Yes it's done.
half jewel
!cban 928416998285787156 Cryptocurrency marketing is not allowed.
runic umbraBOT
:incoming_envelope: :ok_hand: applied ban to @umbral hare permanently.
rough furnace
https://aus.social/@virtualwolf/113033965970498667
If I had a 1TB memory machine would love to test PyQtGraph performance on this image:
Holy shit, the Rijksmuseum used a 100MP Hasselblad camera to take almost eight and a half THOUSAND photos of the whole of Rembrandt's The Night Watch, for a total image size of 717 GIGAPIXELS. 😳
It's on their website as a zoomable image and you can zoom in so far you can see the individual cracks in the paint: https://www.rijksmuseum.nl/en/stor...
fervent vale
The file size is 5.6TB, so 1TB may not cut it...
rough furnace
ahh you're right, I read the gigapixels as gigabytes... silly me!
 craggy bobcat
what is pyqt used for
rough furnace
craggy bobcat
what is pyqt used for
making gui's using the Qt bindings in python
 agile pebble
Short question, is is possible to directly access the pixelbuffer of an scene object?
rough furnace
agile pebble
Short question, is is possible to directly access the pixelbuffer of an scene ob...
Not as far as I know, probably need to convert the widget to a QImage, and then you can access pixels, but it would be a copy so changes won’t take effect on the screen.
 sacred oriole
rough furnace
https://aus.social/@virtualwolf/113033965970498667
If I had a 1TB memory machin...
sacred oriole
rough furnace
https://aus.social/@virtualwolf/113033965970498667
If I had a 1TB memory machin...
wow that is one of the most zoomable digital images I have ever seen, the king though is google earth
wow pyqtgraph looks amazing I would like to give it a try today
rough furnace
sacred oriole
wow pyqtgraph looks amazing I would like to give it a try today
if you do find it fills a niche in your work, would love to know more about what kind of tasks you have pyqtgraph do... the library seems to appeal to people in experimental science or engineering, but I'm sure it has way more uses outside of those spaces.
fervent vale
It seems to be used by people plotting stock market prices
rough furnace
I've seen some mention of it being used for stock ticker stuff, but ...actually haven't seen that recently... (of course that doesn't mean it's not being used as such)
fervent vale
#3141
rough furnace
heh... ok I stand corrected 😄
fervent vale
#2927
sacred oriole
fervent vale
#3141
what is this
rough furnace
pyqtgraph/pyqtgraph#3141
supple leafBOT
 rough furnace
pijyoi was referencing an issue to show a recent example of the library being used in the financial domain
sacred oriole
rough furnace
if you do find it fills a niche in your work, would love to know more about what...
I only tried their example, looks good

hey where can I get some stock market data?
rough furnace
<@&831776746206265384> 👆
vivid crescent
!cban 658989146488176640 advertising a roblox cheat
runic umbraBOT
:incoming_envelope: :ok_hand: applied ban to @thorn stone permanently.
rough furnace
<@&831776746206265384> 👆
vivid crescent
!compban 638193267216875530
runic umbraBOT
:ok_hand: applied ban to @sick warren until <t:1725701057:f> (4 days).
agile pebble
Hmm, any hints on how to the debug a pyside6 application crashing silently on windows (only very irregular, no traceback, heavy use of pyqtgraph). i have a feeling the crashs have some interaction with the parameter tree system but not sure yet
rough furnace
Are you running the application from the console? If not I would so you might get a traceback (or maybe get a segfault notice in which case the debug will be far tougher)
You could wrap your whole application inside a try/except and when catching the unhandled exception log is to disk or something
If you’re getting an intermittent segfault, that’s going to be a lot tougher to debug. If you’re using qtpy you could also switch bindings to pyqt6 and see if you still get the crash, but first order of business is get a trace back or figure out if it’s a segfault
agile pebble
It is latter :-(. And threads are involved :(. Good Idea with using PyQt6 for testing! But since I was annoyed by typing issues I switched from qtpy to pyside6 directly making it slightly harder.
Any experience with attaching a debugger to a python-qt process?
By the way, the recent change of values to items in pyqtgraph lead to a lot of silent breakage.
Maybe raising an exception directly when values is given would be preferable.
rough furnace
Is that in parameter trees? I honestly haven’t used them that much, sorry for the breakages tho 😦
You think you’re getting a segfault? If so first order of business is make it easy to reproduce which I know is easier said than done
agile pebble
It is seemingly random, but especially after interaction with some parameter trees, but this may be completely accidental. Sadly the python debugger does not catch anything, also the clean up events connected to app.aboutToQuit are not fired and the shell does not print any error
https://github.com/pyqtgraph/pyqtgraph/issues/2954 this one here, while the change is understandable, I think it should raise after it encouters an values key in the dict
GitHub
Documenting some behavior changes to Parameter list types since 0.13.4. Previously, it was possible to use values. Now limits must be used. (limits was added in 0.12.3) Previously, it was possible ...
If there interest I can do a PR for that
rough furnace
definitely interest! I've been a bit slow to review PRs, I just had an international move and the kids have been home with short summer camps, they just started school again so I should be getting more time to work on the library.
but you don't catch anything even when you do something like
try:
    qApp.exec()
except Exception:
    print("cause some unhandled exception")
else:
    print("Exited the event loop cleanly")
?
agile pebble
I use an exception handler which raises the exception from the main loop
agile pebble
(all of numerous bugs show a nice error diaglog and show up in the log).
I may try the python faulthandler module
BTW Huge thanks for taking over the maintance of the pyqtgraph package, it powers all of our lab. And do not worry about being slow, since this is open source nobody has the right expect anything
rough furnace
If you think you’re running into an intermittent segfault, those are the worst to debug certainly. The faulthandler is not a bad place to start, it might give you some insight. Also sometimes different platforms can give a little more information when being run from a console
rough furnace
Was just thinking we eliminated a segfault in some of the conda package bindings but I can’t remember if it was pyside6 or what; but it involved QImage creation… not sure if that fix was in the latest release or not. That segfault only occurred in conda installed versions of the bindings (so another thing to try is to use a wheel binding if using a conda package)
fervent vale
Yes, that fix is in 0.13.7
rough furnace
@agile pebble the only other suggestion I have for debugging this segfault is create a log handler that writes to a file (or streams to a console) and just completely cover your library/application with log messages about what method is being executed/etc... and potentially evne use QSignalSpy to trace the emission of Signals ... eventually you will notice a method that is being run, but isn't being finishing... And let's just hope it's occurring in the same place 😄
agile pebble
I had a already logging, but to be honest not very deep. Faulthandler helped me quite a lot.
I still not fully understand what happened, but somehow a call to cffi.cast() lead to the crash. But in ran fine like in like 99.99999% of all calls
agile pebble
Working around that call seemed to fix the issues, and while it would be nice to know exactly what went wrong I sadly do not have to time to further debug this
Maybe some threadsafty issue
rough furnace
Wow, you zero’s in on it, nice! Wonder if there was something different about the value you were casting that triggered the segfault.
 coral maple
Hi. I.need some one for help . Statistic and econometrics with python
rough furnace
coral maple
Hi. I.need some one for help . Statistic and econometrics with python
Look in #❓|how-to-get-help
rough furnace
<@&831776746206265384> 👆
fervent vale
With regards to issue #2062, what is the purpose of an AxisItem responding to mouse events only to forward them to its linked ViewBox? Why not just remove the mouse event methods in AxisItem and let the events get naturally delivered to the ViewBox?
The downside is that the area occupied by the AxisItem no longer responds to mouse events, whereas previously those events get delivered to the underlying ViewBox
But that area is small
So a regular user would normally just click on some empty area to interact with the ViewBox rather than on the axes
rough furnace
I have previously used mouse events on the axis item to zoom/pan one specific axis only, and have found that to be a good workflow.
(Away on a trip to Petra right now so I’ve only skimmed the comments in the issue, so I could be missing something).
Maybe less so for panning but more so for wheel events
fervent vale
So it might make sense to just remove mouse click and drag events for Axisitem, but to retain wheel events
rough furnace
That feels awkward as well, I need to spend a little time and read the issue more closely.
fervent vale
The phenomenon is that drawing grid lines increases the bounding rect of AxisItem, which together with ViewBox having a zValue of -100, makes mouse events get delivered to AxisItem ahead of other items.
ViewBox having a zValue of -100 was surprising and had the effect of making its children stacked behind AxisItem
The user is unaware of these implementation details and only knows that enabling grid lines causes some mouse events to seemingly not get delivered to their item
fervent vale
In PlotItem, there's a line that sets the zValue of AxisItem to 0.5 together with an erroneous comment about setting other items' zValue to greater than 1 in order to stack them above the AxisItem
That line is unaware that the base zValue of other items is in fact -100. A zValue >= 101 is needed to stack them above AxisItem
rough furnace
GridItem/AxisItem interaction strikes again!
 wide prism
Would there be a point in filtering events by position? AxisItem knows where it draws the actual axis line. Having it handle any event ON or OUTSIDE of that line seems like it might be an understandable rule.
 rough furnace
Probably the best intermediate solution’s
rough furnace
That’s not PyQtGraph code, not sure what it is, but I think you have the wrong channel.
fervent vale
Does the following look like the right statement to insert into AxisItem's mouse event handlers?
if not self.mapRectFromParent(self.geometry()).contains(event.pos()):
    return
I gather from the code in boundingRect() that self.mapRectFromParent(self.geometry()) is supposed to be the axis sans the grid lines
wide prism
From sticking color bars into the plots, I seem to remember that there is an internal gridlayout with the main plot area in the middle, and each axis in an adjacent grid cell. So if that's where the 'geometry' comes from, that seems like it might make sense?
fervent vale
Now if you put it that way, then that means that AxisItem draws outside of its layout.
fervent vale
I think the more elegant thing to do would be to override the shape() method.
wide prism
See the docs on ```
hideOverlappingLabels
True (default for horizontal axis): Hide tick labels which extend beyond the AxisItem’s geometry rectangle.
False (default for vertical axis): Labels may be drawn extending beyond the extent of the axis.
(int) sets the tolerance limit for how many pixels a label is allowed to extend beyond the axis. Defaults to 15 for hideOverlappingLabels = False.```
Both x- and y-axis will overdraw into the bottom left "quadrant". This option is used to manually remove labels on the y-axis that are expected to do that. Otherwise the text from both axes just piles up there 🙂
I think I am trying to say that the current methods are not particularly elegant and that it could be quite reasonable to try out any alternative ideas you have.
fervent vale
I did try out overriding shape() and it seems to work
The boundingRect of AxisItem includes the area covered by ViewBox
The default implementation of shape() is just boundingRect()
So overriding shape() allows us to specify that the grid doesn't belong
Qt uses shape() to determine collisions
So with the right shape, the AxisItem doesn't get a "hit"
wide prism
That does sound very reasonable and, indeed, more elegant than collecting the events and then rerouting them.
Possible problems I could imagine are
- things breaking with auto-expanding the ticklabel space
- things breaking when rejecting tick labels that exceed a limited ticklabel space
(- things breaking with setting tickTextWidth / tickTextHeight)
But that should just be a matter of making sure they check for the right property (e.g. boundingRect(), not shape())
fervent vale
boundingRect() is still used for paint damage detection
shape() seems to be dedicated to collision detection and mouse selection
wide prism
I am sure Qt will be good, if there's any headache, it is in generateDrawSpecs, but it looks like that is correctly checking for the boundingRect():
br = self.boundingRect()
if not br.contains(rect):
   continue
textSpecs.append((rect, textFlags, vstr))
The logic gives me a bit of a headache: If you've already overdrawn your assigned box to include this space, then you can ALSO use that space to draw label text in.
But I see nothing in your fix to shape() that would obviously change behavior, sooooo.... that looks like a good idea to me?
Hmm. One possible issue:
I seem to remember that there were some previous experiment with collision boxes before. There may have been a use case where someone was drawing the labels on the inside of the y-axis, which works because of the weird bounding box.
Doing that might collapse shape() to be just one (or worst-case zero) pixel wide, which isn't helpful for interacting with the axis.
Is it worth considering giving shape a few pixels that overlap into the plot?
...keeping it non-zero width no matter what happens?
fervent vale
shape() is just the mapRectFromParent(self.geometry())
wide prism
...is that the cell it is originally supposed to be contained in ?
fervent vale
Yes
It's the area given to it by the QGridLayoutItem
It's also the default bounding rectangle in the absence of grid lines and text over painting
def shape(self):
    rect = self.mapRectFromParent(self.geometry())
    qpath = QtGui.QPainterPath()
    qpath.addRect(rect)
    return qpath
That sounds like a very good starting point.
I am deep into hair-splitting and nit-picking here:
When zooming in and out, you can interact with a single axis by 'pointing the mouse at that axis' and scrolling the wheel.
But is the intuition for that to point at the axis line? In that case, having a few pixels of buffer into the main plot might avoid some frustration.
Or is it easily understood that you are scrolling the numbers?
Maybe we start with your elegant solution and then add as needed. 😄
fervent vale
Actually I only learnt very recently about mouse wheeling over the axis
But my intuition was just to position the mouse over the numbers
Or clear of the boundaries anyway
wide prism
If we get around to adding that to the docs, that might be a good way to describe it.
https://pyqtgraph.readthedocs.io/en/latest/user_guide/mouse_interaction.html
rough furnace
The last batch of visitors have left, we just went to the major tourist sites within the country, and the kids are in school. I no longer have excuses (besides I need to catch up on some sleep). @wide prism would you be so kind to open an issue for the suggested docs change? As I go through converting docs to numpydoc I should see that issue and at the very least patch it then
rough furnace
wide prism
Done. Sorry to just file an issue instead of a PR.
rough furnace
ha, I really don't mind
sometimes we come across a "oh we should do this one thing" and I don't want to get that lost to the ether, and I want to keep the suggestions coming, so that can mean the middle ground is just opening a small issue with it
 gusty bear
crazy
fervent vale
PyQt glDrawElements binding issue
 olive ivy
..
 gilded dawn
 haughty brook
Sorry to put the message here. I want to do open source in python based projects. Can anyone help me with that. Guide me which is easy and where should I start, or like help me get started.
I really want to be part of this but I don't know where to begin from.
rough furnace
haughty brook
Sorry to put the message here. I want to do open source in python based projects...
Usually pick a project you want to contribute to, read the contributing guide and look for issues tagged with "good first issue" and go from there.
rough furnace
have a few hours to spare this morning, gonna start chipping away at that PR queue!
rough furnace
Ok that was a lot of PRs merged… haven’t even looked at the issue tracker yet… another PR I want to take a closer look at too
rough furnace
@wide prism if you get bored, mind giving this a once over? I'd feel better if it had a test, but expanding the tests of PlotDataItem to accomodate this would likely invove introducing parametrization where there currently isn't any ... low-key hate having to ask contributes to add that much in the way of testing...
rough furnace
Man getting pings every 12 hours to merge two PRs from the same person is sure really motivating me to get right on it!
runic umbraBOT
:incoming_envelope: :ok_hand: applied timeout to @undone sonnet until <t:1730219492:f> (10 minutes) (reason: emoji spam - sent 24 emojis).
The <@&831776746206265384> have been alerted for review.
rough furnace
<@&831776746206265384> 👆
@wide prism just came across this lecture on color theory, can't help but think about your work in this space.... talking about HSL, HSV, Lab and so on... https://www.youtube.com/watch?v=6T_4mVZcozs&list=PL7ddpXYvFXspUN0N-gObF1GXoCA-DA-7i&index=13

This is one of 18 videos representing lectures on digital photography, from a version of my Stanford course CS 178 that was recorded at Google in Spring 2016. A web site that includes all 18 videos, my slides, and the course schedule, applets, and assignments is http://sites.google.com/site/marclevoylectures
To help caption this lecture, follow...
 sweet comet
🤔
 eager stirrup
 dapper yarrow
I have an application where I need to embed an pg.ImageView in a QGraphicsScene, where the ImageView becomes part of a node-based processing pipeline.
I can do this just fine, but when I do I cannot interact with the ImageItem or HistogramLUTWidget using the left mouse button.
Got any ideas?
Minimal example: https://paste.pythondiscord.com/HN3A
rough furnace
Huh, are you integrating into a QGraphicsScene or pg.GraphicsScene? I’ll try and take a look after I wrap up my work today.
dapper yarrow
into a QtWidgets.QGraphicsScene
The use case is this kind of thing (image from internet), but with an pg.ImageView in one of the nodes
 rough furnace
I know in our GraphicsScene (which we inherit from QGraphicsScene) we add some niceties for mouse-interaction but mouse stuff should still largely work with a QGraphicsScene
I believe the issue is ultimately that ImageView is a QWidget, and not subclassed from QGraphicsItem .
A while ago I did this UML diagram of pyqtgraph's major classes and how they relate to Qt's classes we inherit from.
https://pyqtgraph.readthedocs.io/en/latest/api_reference/uml_overview.html
Appreciate the minimal example, I would change the ImageView to an ImageItem and see if you get the mouse behavior you're wanting (even though it's not exactly what you want).
hmm.. but QGraphicsScene has the addWidget() method...
perhaps try scene.addItem(image_view..imageItem) ?
dapper yarrow
rough furnace
Appreciate the minimal example, I would change the `ImageView` to an `ImageItem`...
The thing I really want is the HistogramLUTItem (because it is great!), so just the ImageItem does not really get me to where I want.
I find it interesting that the mouse wheel works in the HistogramLUTItem but click+drag does not
rough furnace
dapper yarrow
The thing I really want is the `HistogramLUTItem` (because it is great!), so jus...
I assume ColorBarItem https://pyqtgraph.readthedocs.io/en/latest/api_reference/graphicsItems/colorbaritem.html#pyqtgraph.ColorBarItem won't do it for you? Can you not add the HistogramLUTItem directly? also maybe consider making GraphicsLayout of HistogramLUTItem/ImageView (that isn't a Widget) and adding that, as a GraphicsLayout can be added like any other GraphicsItem
dapper yarrow
hmmm, I'll have to think about it.
The framework I'm working in has nodes on a QGraphicsScene and the nodes are widgets (with layouts etc.) using QGraphicsProxyWidget.
I would really like to have pyqtgraph visualizations inside nodes, which I think means they have to exist as widgets inside the node, and not on the QGraphicsScene directly (although this is otherwise a good idea).
I'll look more at it tomorrow. I'm thinking I will try to figure out why the mouse click events are not registered, and alternatively see if I can capture the events in a parent and then forward them to the right place.
rough furnace
There was another instance of odd behavior w/ QGraphicsProxyWidget ...but can't remember the specifics. It's quite possible (likely?) that the library has not implemented something correctly causing some incompatibilities w/ QGraphicsProxyWidget ... I wouldn't be surprised if use of it drags down performance significantly though. If you're wanting the histogramLUTItem and the ImageItem next to each other, I would consider adding them in a pg.GraphicsLayout and adding the layout via scene.addItem(layout) instead of trying to get the whole ImageView in there.
rough furnace
<@&831776746206265384> 👆
pulsar sinew
!cban 1272239087415201824 Discord link spam
runic umbraBOT
:incoming_envelope: :ok_hand: applied ban to @grizzled rain permanently.
 opaque jacinth
wait was a library banned or a user?
rough furnace
opaque jacinth
wait was a library banned or a user?
this channel for some reason seems to be major target of spam on this server, so it's quite common for a user to come into this channel, post spam, I flag the moderators and the user is banned. It's unfortunate but jjust how it goes I sometimes
opaque jacinth
rough furnace
this channel for some reason seems to be major target of spam on this server, so...

noice
 idle pulsar
all is one and one is all
 hazy trout
I just want to follow the thread; it's too far up to scroll. Is there a follow button?
hazy trout
idle pulsar
all is one and one is all
❤️ the slogan
 lost fractal
help
rough furnace
Pijyoi thanks for reviewing that xml PR
 runic sphinx
I guess that works fine
fervent vale
As I understand the PR, there's 1) serialization and 2) an xml format. Every current Parameter present in the library is already serializable, if you want to save it to disk, you could pickle it without using xml. The issue seems to be that the author has other new and more complex Parameters that may not be easily serialized with the current pyqtgraph infrastructure.
rough furnace
@mortal grotto feel like reviewing that PR?
rough furnace
oh no, linux CI is ❌ due to
E: Unable to locate package libegl1-mesa
It seems to work if you change libegl1-mesa to libegl1
rough furnace
Thanks for the tip. I’ll make the change in a little bit
 rugged ruin
hey guys is there any repo on github or any website that showcases what we can do with pyqtgraph in the fields of image processing and signal processing ? Thanks in advance. i just knew about this library and I am trying to find useful tutorials on the specified fields
rough furnace
rugged ruin
hey guys is there any repo on github or any website that showcases what we can d...
I havent seen tutorials specifically aimed at those fields but my signal processing work is what brought me to pyqtgraph to begin with. I used pyqtgraph to render spectrograms, power spectral density, all while having interactive components so users can tweak regions they’re interested in.
Pyqtgraph’s origins are from being able to analyze images taken from microscopes and perform various processing tasks.
Truth is we have a variety of examples. Some simple, some more complex, but we don’t have written up tutorials.
rough furnace
Thanks to @torn coyote for bringing this to my attention, but pyqtgraph is being used at NASA as a front end for their trajectory simulation toolbox. A large component being the performance. Thanks @fervent vale for your work on improving performance of the library over the years!
Link to the paper: https://ntrs.nasa.gov/citations/20240014320

Recent improvements for the Program to Optimize Simulated Trajectories II (POST2) have included the development of an application programming interface (API). This API allows POST2 simulation inputs to be directly manipulated from other applications (such as MATLAB or Python), and the outputs from POST2 are streamed directly to the external appl...
 calm hound
Hello Everyone
I am new here need the information about what this PROJECT is all about ?and how can I involve in there to contribute anything in my capacity?
Can somebody explain or provide me document to review and study please.
rough furnace
you're going to have to be way more specific. What are you looking to contribute to specifically? Our documentation isn't hidden.... and neither is our issue tracker.
calm hound
rough furnace
you're going to have to be _way_ more specific. What are you looking to contribu...
Actually it am new to discord so I am exploring here , but anyway I found the docs
runic umbraBOT
You are not allowed to use that command here. Please use the #bot-commands channel instead.
half jewel
This is not the right channel. Also, the rules explicitly prohibit recruitment and also paid work.
 clear abyss
Appologies!
rough furnace
@wide prism I'm using a lot of your colormap work in converting colormaps into best fit polynomial curves as I'm trying to add support for a lot of these colormaps for a work thing, but I can't use lookup tables, I have to provide an algebraic equation ... feels a little ridiculous in some cases to use a 9th order polynomial just to express a color, but what can you do 😅
fervent vale
Could you check for macOS whether the GLGraphItem example draws the nodes? I suspect it doesn't get drawn on the master branch
rough furnace
original and zoomed in results on macOS

 fervent vale
Thanks. So it works on macOS. There's a bug in GLScatterPlotItem in its decision to enable GL_POINT_SPRITE. By right, CompatibilityProfile can only be present for OpenGL >= 3.2. Since macOS defaults to OpenGL 2.1, that should have been NoProfile.
The reason it works for most systems is that the driver can provide a higher GL version than that requested. I.e. Qt defaults to requesting 2.0 and most drivers would then just provide a 4.x version with CompatibilityProfile
But since macOS only has CoreProfile for anything above 2.1, I would have thought that the provided context on macOS would be 2.1 NoProfile
rough furnace
Happy to test, appreciate the explanation!
fervent vale
Okay, finally found out why things were “working” despite the bug. In some version of Qt after 6.5, QOpenGLWidget’s backend was switched to QRHI (OpenGL). This backend has already enabled GL_POINT_SPRITE for versions of OpenGL where it is needed. So I tested with PySide 6.5 with a NoProfile context, and indeed the nodes were not drawn. And with PySide 6.8, the nodes were drawn.
This was quite puzzling, because I could have sworn enabling GL_POINT_SPRITE was required a few months back
PR3236 does get the nodes drawn on PySide 6.5
 karmic kernel
rough furnace
original and zoomed in results on macOS
karmic kernel
rough furnace
original and zoomed in results on macOS
Woah! Cool!
 vernal owl
@fervent vale @rough furnace does pyqtgraph have a discord server
rough furnace
vernal owl
<@862941683460210688> <@369662814488363009> does pyqtgraph have a discord server
no, we just use this channel
vernal owl
oh i see
rough furnace
vernal owl
oh i see
I don't have time to admin/moderate a server 😂 ... the mods here have been wonderful hosts for us.
vernal owl
rough furnace
I don't have time to admin/moderate a server 😂 ... the mods here have been won...
tht makes sense
rough furnace
@fervent vale I had identical FPS results on my (macos) laptop, 15 FPS to 120 FPS. I always get a little weirded out when performance improvements like that are identical across platforms.
fervent vale
There was a further simplification to the calculations that I abandoned as I thought that would need more verification. gl_Position.w is already a z distance between the camera and a vertex. That would allow not sending the camera position and the view transform to the shader
For now, it's hopefully just a pure translation of cpu code to shader code
rough furnace
linux-arm64 CI runners are available on github actions, probably should add those:
rough furnace
@fervent vale I'm considering bumping the minimum Qt6 version up from 6.2+ to something ...much newer. I'm open to suggestions on suggested versions.
Ubuntu 24.04 looks to send PyQt6 6.6.1 with apt. 22.04 doesn't seem to have a python3-pyqt6 package.
fervent vale
The very latest pyqt6 and pyside6 wheels for aarch64 are for glibc 2.39, which means ubuntu 24.04 and fedora
RPI5 OS which is debian 12 can't use them
rough furnace
hmm..both my apple and windows machines have little endian byte order, i'll check the linux-24.04-arm64 runner, unless they're big endian, I'm not sure there will be any benefit to testing pyqtgraph on there.
 copper lily
o
rough furnace
<@&831776746206265384> 👆
fervent vale
Reading through your 2021 conversation in Modern OpenGL discord channel, some of the issues mentioned there have since been overcome. The OpenGL code no longer uses fixed pipeline, it runs on OpenGL ES, shaders have been updated to GLSL 120.
rough furnace
4 years ago, I can't remember 4 days ago 🙃
you've done amazing work making pyqtgraph's opengl functionality actually work much better!
fervent vale
It’s still OpenGL 2.1, not OpenGL 3.x. Would require some big refactoring to go to OpenGL 3.x.
Intel drivers on Windows require a #version directive if you are on OpenGL 3.x context even if your shader is OpenGL 2.0 only
One bigger obstacle is actually the use of QPainter over painting
rough furnace
QPainter over painting?
rough furnace
oh oh oh, now I follow
fervent vale
QPainter clobbers some OpenGL state
The requirement of #version directive means you need to prepend a different version string if you want to support OpenGL ES
The current shaders.py doesn’t support such a usage
OpenGL 3.x requires use of VAO. The current code relies on VAO not being required.
One trick of migrating to OpenGL 3.x is to create 1 single VAO, bind it, and forget about it. That satisfies the VAO requirement
However, QPainter clobbers the OpenGL state. So you can’t do the above VAO trick
rough furnace
when I asked that of modernGL a few years back, it was mostly wondering if it would be worth the effort to use moderngl as a dependnecy, as it would likely be easier to use that raw opengl which I didn't know the first thing about.
fervent vale
trimesh could actually replace the MeshData class
rough furnace
I’d be good with that, if it can reduce our codebase and expands functionality… suppose the trick would be to make it an optional dependency
rough furnace
pijyoi, you closed your distance to camera PR? You find an issue with it? (was about to start going through PRs and notice you closed that one).
fervent vale
I am going to start making some GLGraphicsItems work with strict Core Profile. I will fuse the closed PR with that change
Strict Core Profile will not understand GLSL lower than 140. That includes macOS
Maybe in a future release, minimum OpenGL version can be bumped up to 3.1
That would require requesting a non-default version on macOS
rough furnace
I'm good w/ doing that whenever, I doubt there are that many platforms that pyqtgraph is used on that can't run OpenGL 3.1.
Regarding macOS I'm still not understanding the underlying issue. macOS supports up to OpenGL 4.1 (granted it's been deprecated forever)
I believe you've tried to explain to this to me before 🙃
(is this one of those "but Qt for macOS is built with OpenGL 2.1?)
fervent vale
On Linux and Windows, the default behavior is that the driver will give you the highest version it can. On macOS, the default is 2.1
rough furnace
I don't imagine opengl gives you a way to search for the underlying platform and conditionally set the version based on that?
fervent vale
On Linux and Windows, you will probably get at least OpenGL 4.3 Compatibility Profile
On macOS, if you request for it, you can only get OpenGL 4.1 Core Profile
Compatibility profile lets you use old shaders from OpenGL 2.x. Core Profile is not required to support OpenGL 2.x shaders
So for macOS, you can't incrementally upgrade your shaders. If you want to use newer features, all your old shaders need to be updated
rough furnace
Is the thing holding us from going to a Core profile the amount of work involved, or were the Qt compatibility issues as well?
fervent vale
So Qt's recommendation is that the OpenGL profile be set at an application level
Rather than on a per-widget level
We could set the profile just for GLViewWidget, but if someone embeds it into their other QWidget, I don't know what happens
rough furnace
or was it that the version of Qt we would run on embedded devices wouldn't work w/ Core profile? ... (my apologies, I know you've explained this to me before, no doubt it would do me good to get more familiar w/ working w/ OpenGL)
fervent vale
As a library, it shouldn't be pyqtgraph that sets the profile globally
rough furnace
fervent vale
We could set the profile just for GLViewWidget, but if someone embeds it into th...
maybe we set it in mkQApp? that's usually where I set the Application level settings usually which I don't want conflicting w/ other people's usage of the library.
fervent vale
So for embedded devices, specifically RPI5 and RPI4, they support OpenGL ES 3.1, which is close to OpenGL 4.3
On RPI5 , the best result is obtained by using the ES profile
So if you were to set it in mkQApp, the advice for macOS users who don't want to use mkQApp would be for them to manually request a 4.1 profile
rough furnace
I think that's a perfectly viable thing to do put in the documentation.
Hell, I can even put it inside a fancy "warning" box 😄
fervent vale
Compute shaders actually works on the RPI5
That's a requirement of OpenGL 4.3 and OpenGL ES 3.1
Furthermore, OpenGL 4.2 is required to be compatible to OpenGL ES 3.0
(See how macOS just missed the mark...)
rough furnace
...yeah macOS's support of only 4.1 is a real bummer for sure
Keep wondering if this would be suitable for an eventual replacement: https://doc.qt.io/qt-6//qrhiwidget.html
The QRhiWidget class is a widget for rendering 3D graphics via an accelerated grapics API, such as Vulkan, Metal, or Direct 3D.
fervent vale
On Linux desktop systems, requesting an OpenGL ES context also works
rough furnace
(granted couldn't do that until we kill off Qt5 support)
of course not sure if that works w/ our own shaders...
https://doc.qt.io/qt-6//qshader.html#details
could use that (again, won't work w/ Qt5)
Contains multiple versions of a shader translated to multiple shading languages, together with reflection metadata.
fervent vale
So what I'm going to do is to move the shader code out of shaders.py and into their respective GLGraphicsItem source files
Except for the GLMeshItem shaders, not sure what to do with them yet
Then each GLGraphicsItem needs 2 versions of the shader code
1 legacy for OpenGL 2.x
rough furnace
are the differences between versions substantial?
fervent vale
1 for Core / OpenGL ES 3
You can see the difference in texture3d and texture3d-es3 shaders
So texture3d-es3 will be changed to be used by Core and ES3
Just need to prepend the correct version string depending on whether we are Core or ES3
fervent vale
I have just pushed the first implementations for GLLinePlotItem and GLScatterPlotItem
rough furnace
alright, got my son setup with an Ori and the Will of the Wisps randomizer... should have some time to merge some PRs 😂
I assume you're still working on pyqtgraph/pyqtgraph#3246 ?
supple leafBOT
fervent vale
I need to test out the new changes
rough furnace
let me know if you need me to test on macOS
fervent vale
Well, I could make the various examples default to OpenGL 4.1 Core on macOS.
rough furnace
the last mac that didn't support OpenGL 4.1 Core is absolutely ancient...
Mid-2010 models started supporting 4.1. Those versions of macOS don't support anything newer than macOS 10.13... which has been unsupported for some time now. tl;dr on macOS I think we can safely assume 4.1 (although if we wanted to support older devices, we would have to support 3.3)
fervent vale
Okay you should be able to try out some examples
Actually, we are not using any features newer than OpenGL 3.2 Core
rough furnace
not sure if it's your branch/PR but I got this error when testing the 3d image example:
/Users/ogi/Developer/pyqtgraph/pyqtgraph/opengl/GLViewWidget.py:260: RuntimeWarning:
Traceback (most recent call last):
File "/Users/ogi/Developer/pyqtgraph/pyqtgraph/examples/GLImageItem.py", line 60, in <module>
pg.exec()
...
File "/Users/ogi/Developer/pyqtgraph/pyqtgraph/opengl/GLViewWidget.py", line 221, in paintGL
self.paint(region=region, viewport=region)
File "/Users/ogi/Developer/pyqtgraph/pyqtgraph/opengl/GLViewWidget.py", line 233, in paint
self.drawItemTree(useItemNames=useItemNames)
File "/Users/ogi/Developer/pyqtgraph/pyqtgraph/opengl/GLViewWidget.py", line 265, in drawItemTree
self.drawItemTree(i, useItemNames=useItemNames)
File "/Users/ogi/Developer/pyqtgraph/pyqtgraph/opengl/GLViewWidget.py", line 260, in drawItemTree
debug.printExc()
--- exception caught here ---
File "/Users/ogi/Developer/pyqtgraph/pyqtgraph/opengl/GLViewWidget.py", line 257, in drawItemTree
i.paint()
File "/Users/ogi/Developer/pyqtgraph/pyqtgraph/opengl/items/GLImageItem.py", line 134, in paint
program = self.getShaderProgram()
^^^^^^^^^^^^^^^^^^^^^^^
File "/Users/ogi/Developer/pyqtgraph/pyqtgraph/opengl/items/GLImageItem.py", line 113, in getShaderProgram
compiled = [shaders.compileShader([glsl_version, v], k) for k, v in sources.items()]
^^^^^^^^^^^^^^^^^^^^^^^^^^^^^^^^^^^^^^^^^^^
File "/Users/ogi/.pyenv/versions/pyqtgraph-pyqt_607-py312/lib/python3.12/site-packages/OpenGL/GL/shaders.py", line 235, in compileShader
raise ShaderCompilationError(
OpenGL.GL.shaders.ShaderCompilationError: ('Shader compile failure (0): b"ERROR: 0:11: Invalid call of undeclared identifier \'texture2D\'\\n"', [b'#version 140\n', b'\n        #ifdef GL_ES\n        precision mediump float;\n        #endif\n        uniform sampler2D u_texture;\n        in vec2 v_texcoord;\n        out vec4 fragColor;\n        void main()\n        {\n            fragColor = texture2D(u_texture, v_texcoord);\n        }\n    '], GL_FRAGMENT_SHADER)
  debug.printExc()
confirmed 3D Image works on master
fervent vale
Oops. Cut and pasted too much
It's the GLImage2D example
It actually worked on my system without error
rough furnace
confirming it works
fervent vale
Only means my driver was not strict

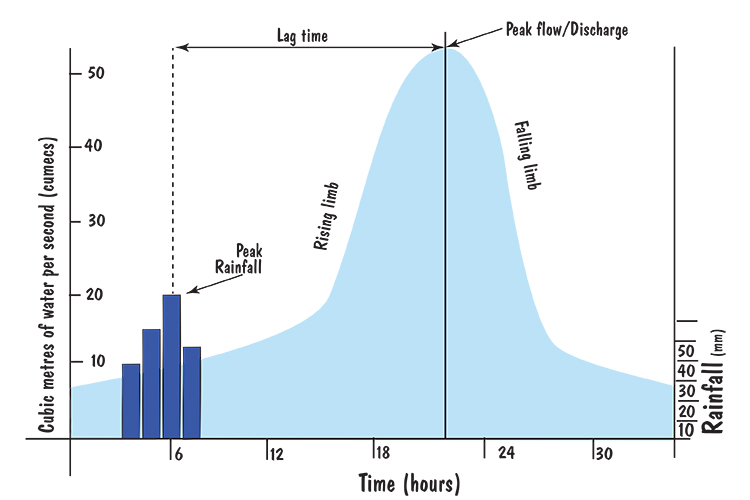 fervent vale
VideoSpeedTest is not affected
rough furnace
huh macos failing in CI, let me see if I can reproduce locally...
fervent vale
The error has to do with line width
Core is stricter on what line widths it accepts
Core is only obliged to support line width of 1
We could remove the 4.1 profile for the GLLinePlotItem example for now
rough furnace
I'm good with that
fervent vale
I fixed it the "right" way by querying the device line width limits
fervent vale
Okay I have tested it out on OpenGL ES 3 too...
rough furnace
the codeql error about buf not being used, I assume that's a false positive as while we don't use the variable we still need to select the buffer?
fervent vale
I am not sure if it's needed. But I didn't want to change the original code
That code path is not much exercised
It actually still works on nvidia drivers
Even with the code upgraded to use shaders
That path is most certainly not a Core feature
rough furnace
fair enough... i'll merge momentarily
rough furnace
noticed I'm getting a segfault on exit of ConsoleWidget.py example
fervent vale
Could you try the GLMeshItem and GLSurfacePlot examples?
Oops. Didn't realised you had merged
rough furnace
no problem, i'll give those a try on 3256 shortly
both of those examples run w/o error
rough furnace
should I merge 3256 or you plan to add more to it?
fervent vale
Can merge.
fervent vale
So macOS got OpenGL 4.1 Core in 2013. So all supported systems have it. The issue that I mentioned is that you likely can't mix and match widgets using different context versions
So it probably wouldn't work to instantiate an application using pyqtgraph in one widget and vispy in another
Or less far fetched, would PlotCurveItem opengl path currently even work with 4.1 Core?
Probably can just leave this question to be solved for the future
I think the library is in a good spot now that GLViewWidget can run on both OpenGL 2.1 and 4.1 Core
It sure took a long time to get there!
rough furnace
wouldn't have happened w/o your effort pijyoi, thank you!!!!
fervent vale
Ok, I have also fixed up PlotCurveItem and PColorMeshItem
rough furnace
I'll test on macOS right now
hm... PColorMeshItem ... I need to change the example to set useOpenGL= True and enableExperimental = True right?
hmm...with those flags set to true, on macOS I'm getting slower FPS than w/o setting them, is that expected?
fervent vale
I think the library example dimensions may need to be bumped up for OpenGL to be useful
I had an example before with much larger dimensions
rough furnace
With useOpenGL=True and enableExperimental=True I'm getting 60 fps, without it I'm getting ~80 fps
 fervent vale
60 would be the vsync
fervent vale
The non-OpenGL will choke
rough furnace
dialed density to 5, on CPU it came to a grinding halt, opengl still at 60 fps
wow...
fervent vale
To test out on Core, you would need to add the surface format code
MouseSelection example is set up to use the opengl path
rough furnace
if 'darwin' in sys.platform:
    fmt = QtGui.QSurfaceFormat()
    fmt.setRenderableType(fmt.RenderableType.OpenGL)
    fmt.setProfile(fmt.OpenGLContextProfile.CoreProfile)
    fmt.setVersion(4, 1)
    QtGui.QSurfaceFormat.setDefaultFormat(fmt)
set this on the PColorMeshItem.py example before mkQApp?
fervent vale
Yes. You could even set it for all platforms
rough furnace
ok, with that blurb, I'm getting significantly better performance. With density=20 not forcing Core 4.1 I'm getting 18 FPS. I'm getting 35 FPS with forcing the 4.1 Core
(this is on a Macbook Pro M2 Max)
fervent vale
I heard that macOS has 2 different codebases. One for OpenGL 2.1 and the other for OpenGL 4.1 Core
rough furnace
man, pijyoi, I imagine your train of thought is something like "let me add hardware acceleration for PColorMeshItem and improve performance ~1000x ...oh wait let me improve it another 2x" 🤣
rough furnace
fervent vale
I heard that macOS has 2 different codebases. One for OpenGL 2.1 and the other f...
you know, I may actually be able to find this out ... xcode let's me look at library code ... might not to get to it today tho
fervent vale
Oh wait...
PColorMeshItem does have a different codepath for newer OpenGL
The flat shading thing
A lot less vertices to upload
macOS was the only one not using that path by default
So at least there's a real benefit now to supporting 4.1 Core
There was an example that I made in the github comments that lets you display a large image using PCMI and then waves it around
That should be faster on macOS now
fervent vale
The example is in PR3090
rough furnace
i'll try it now... (sorry had to help w/ a kid project)

on master it blows up (expectedly)
QOpenGLShader::compile(Vertex): ERROR: 0:1: '' :  #version required and missing.
ERROR: 0:2: 'attribute' : syntax error: syntax error

*** Problematic Vertex shader source code ***
#define lowp
#define mediump
#define highp
#line 1
attribute vec4 a_pos; void main() { gl_Position = a_pos; }

***
QOpenGLShader::compile(Fragment): ERROR: 0:1: '' :  #version required and missing.

*** Problematic Fragment shader source code ***
#ifdef GL_KHR_blend_equation_advanced
#extension GL_ARB_fragment_coord_conventions : enable
#extension GL_KHR_blend_equation_advanced : enable
#endif
#define lowp
#define mediump
#define highp
#line 1
void main() { gl_FragColor = vec4(1.0); }
hmm...probably need a bigger image commenting out the code forcing the Core 4.1 profile doesn't show a difference in performance
rough furnace
ok, found some larger images to use, sure enough, forcing the Core 4.1 profile yields > 2x improvement.
fervent vale
I think it should be safe to enable 4.1 Core Profile for macOS in mkQApp
fervent vale
Actually macOS requires 4.1 Core Profile with Forward Compatibility bit enabled. Not setting DeprecatedFunctions in Qt is equivalent to enabling Forward Compatibility bit
Enabling Forward Compatibility means only line widths of 1.0 are supported
fervent vale
There is an unfiltered call to glLineWidth in PlotCurveItem. That would fail for widths other than 1 if 4.1 Core was enabled for macOS
Not sure what kind of failure, since the call is made through QOpenGLFunctions (as opposed to PyOpenGL)
PyOpenGL raises an exception for when a GL calls returns an error code
I tested it out on the MouseSelection example on Windows, 4.1 Core with no DeprecatedFunctions enabled. So it doesn’t blow up.
The user visible effect is that clicking on the curves does not make them thick
rough furnace
fervent vale
Enabling Forward Compatibility means only line widths of 1.0 are supported
Booooooooo
rough furnace
FINALLY FOUND IT!!!!
Came across this website a little over a year ago but I couldn’t find it each time I searched. It talks about drawing thick lines in webgl but has wonderful images/animations explaining all the issues:
https://sudonull.com/post/69577-Drawing-thick-lines-in-WebGL

Wait this isn’t the site I remembered
This is still good…

Scott Logic
Connecting points on a chart with a line is one of the most basic uses of a charting library. When drawing that line in WebGL, however, it's not as straightforward as you might think.
This is the website: https://wwwtyro.net/2021/10/01/instanced-lines-part-2.html
That’s the website I remembered 🤣 (I’m in a waiting area and decided to try and find this)
fervent vale
Incidentally just last week I managed to draw my first triangle in webgl2
Probably might be the lowest barrier to playing with opengl
I read that all 3 major browsers support webgl2 since a few years ago
rough furnace
Yeah
rough furnace
Yeah webgl2 I would think is safe to assume at this point. Nice thing about browsers is they have a tendency to be updated fairly quickly.
fervent vale
Would have been a good target: #version 300 es
rough furnace
Is there a platform we want to support that can’t do ES 3.0?
fervent vale
macOS
If you have OpenGL 4.2, you will have the extension ARB_ES3_compatibility
So you can just write es3 shaders
It's possible to have the extension while being less than 4.2, but that's not the case for macOS
RPI5 is only OpenGL desktop 3.1 but it has OpenGL ES 3.1
So while in GLES3 context, it is feature-wise very close to Desktop 4.3
Which includes compute shaders
rough furnace
Ugh was afraid macOS would be the answer
rough furnace
pyqtgraph/pyqtgraph#3257 ready for merging?
supple leafBOT
fervent vale
rough furnace
pyqtgraph/pyqtgraph#3257 ready for merging?
Yes
rough furnace
back under 50 open PRs 😅
rough furnace
@torn coyote do you have an issue with this PR?
https://github.com/pyqtgraph/pyqtgraph/pull/3240
these context menu options, they're all the rage it would seem
GitHub
Hello Team,
this PR introduces a new plot transformation that subtracts the mean value of a dataset from all samples.
This makes plotting / analyzing two signals with different offsets much easier ...
fervent vale
Managed to trigger a new bug by setting pxMode=True in the GLGraphItem example. The parent-child relationship in GLGraphicItem has always been problematic
It was papered over in the original implementation of GLGraphItem by making GLScatterPlotItem "know" that it could be used as a child
That bit of seemingly innocuous workaround code got removed in the recent PRs.
Will fix it properly (hopefully!) later
rough furnace
decided to brush the dust off off of my branch to numpydoc-ify some of our docs (I was working on this ~8 months ago) ...picking up something that you set down so long ago, you instantly remember stuff you hated about it. In this case, the extensive use of kwargs ... I finally figured out the best way to have rendered output when you want to document a whole bunch of kwargs but ...wow, I hate it 🙃
rough furnace
to get a decent list of supported args and their explanation, I have to embed a table into the kwargs parameters. The rendered output...isn't great, but it was the best I could do.

 fervent vale
Finally figured out a random-ness issue: GLGraphicsItem stores its children in an unordered set
If you run the GLViewWidget example multiple times, the rendered output can be different from run to run
rough furnace
oof, that must have been annoying to debug
get AxisItem in docs to build w/o errors/warning, run numpylint, another 58 issues 🙃
fervent vale
Ok, the fixes are in
More like puzzling
I noticed it many months ago
But just brushed it off as a driver issue
rough furnace
fervent vale
Ok, the fixes are in
love the usage of the walrus operator
fervent vale
The GLGraphItem example looks more 3D now that node size is scaled to distance
GLScatterItem and GLVolumeItem are the 2 items that need some camera parameters from GLViewWidget
fov and width sounds like something that could have been extracted from the modelView transform
rough furnace
yeah I would think it does too
rough furnace
Just saw this library referenced on reddit, author in the comments says he sees his library as a successor to pyqtgraph (shots fired!) https://fastplotlib.org/ver/dev/index.html
rough furnace
"it's done" /meme https://github.com/pyqtgraph/pyqtgraph/pull/3261

GitHub
Convert the docstrings of PlotItem.py and AxisItem.py to conform to numpydoc codestyle.
Due to the extensive use of *args and **kwargs, the best way I could figure out to render the supported optio...
if I could never edit a docstring again, that would be wonderful.
oh wait, I blew up the test suite through one of my "minor" changes 🤦♂️
fervent vale
Ugh, messed up the commits. A change for the set-to-list for GLGraphicsItem went to the wrong commit
rough furnace
Saw that, it’s fine
If it’s going to bother you, I can drop those commits from master
fervent vale
Got to stick to the no-rewriting-public-git-history rule
rough furnace
new dependency support timeline just dropped: https://scientific-python.org/specs/spec-0000/ (and by just, I mean I just noticed it, not sure how long ago it was released)
Description# This SPEC recommends that all projects across the Scientific Python ecosystem adopt a common time-based policy for dropping dependencies. From the perspective of this SPEC, the dependencies in question are core packages as well as older Python versions.
All versions refer to feature releases (i.e., Python 3.8.0, NumPy 1.19.0; not Py...
per this spec, we should drop support for Python 3.10 🎊
fervent vale
We don't even have a version released for 3.10
rough furnace
fervent vale
We don't even have a version released for 3.10
last release was 3.10+ ?
If we go to 3.11+ I think it means we drop support for PySide2?
fervent vale
0.13.7 was for py39
rough furnace
was it? per the tag on the repo, the README shows 3.10+ https://github.com/pyqtgraph/pyqtgraph/tree/pyqtgraph-0.13.7
fervent vale
I am looking at the git history
Immediately after the 0.13.7 tag, pyproject.toml was bumped to 310
rough furnace
huh, must have jumped the gun w/ the README or something, doesn't really matter, I think the library worked ...but I am excited to drop support for PySide2
fervent vale
There was some churn between 0.13.4 and 0.13.7
rough furnace
yeah some regressions made it in, wonder who caused those 🙃
certainly appreciate the diplomatic phrasing!
fervent vale
If you still follow NEP 29, one last release for 3.10 can be made by 2025-04
Then you switch policy to SPEC 0
rough furnace
I'm fine w/ that, are you stuck on 3.10 for some reason? ... I remember you having to support a much older version of python for a project