#data-science-and-ml
1 messages · Page 422 of 1
 scarlet siren
 serene scaffold
In [10]: arr[:5, :].max(axis=1)
Out[10]: array([0.95932669, 0.79657714, 0.91492026, 0.88157004, 0.60701124])
@wooden sail seems like it's just an alternative to ndarray.max?
 wooden sail
i think so. i'm under the impression that when i started using numpy in python 2, they used to do different things, but i might be mistaken. they're currently just aliases of each other
wooden sail
scarlet siren
oh ok I see
and as a bonus for you, whenever you want to do quick checks with matlab code, this website is great https://octave-online.net/ that's where i tested max(max(...)) just now
scarlet siren
wooden sail
and as a bonus for you, whenever you want to do quick checks with matlab code, t...
I also found it recently but I didn't know how to do 2D matrices on MATLAB and the website wasn't loading so I was stuck 💀
Website as in the mathworks docs
wooden sail
octave:1> M = [1,2,3; 5,6,7]
M =

   1   2   3
   5   6   7
in matlab, one uses [] to define matrices. separating elements by a , puts them in the same row, while ; starts a new row. working with higher dimensional arrays is not natively supported. you can generate high dim arrays via ones and zeros, and then you fill in the slices by looping. that's the one play numpy outshines matlab, and it does so amazingly. native n-dimensional arrays and einstein notation can't be beat
 smoky sapphire
in tensorflow keras, where is the healthiest place to place the Dropout layers? in between every layer? and also what dropout rate is most commonly used? thanks
scarlet siren
wooden sail
```m
octave:1> M = [1,2,3; 5,6,7]
M =
1 2 3
5 6 7
```
in matlab, ...
Numpy ftw
Tbh
It's easier to understand numpy than matlab
Ig cause I already know python
 steady basalt
can anyone help me fix my fucking env?
ModuleNotFoundError: No module named 'pandas
why does this even happen?
Requirement already satisfied: pandas in ./miniforge3/envs/thesis/lib/python3.9/site-packages (1.4.3)
I check and i DO have it
 brave sand
do you guys know what vulnerability prediction is?
steady basalt
this all started when i tried install shap
wooden sail
it does, but you can't create them without using functions. nesting of brackets doesn't add extra dimensions in matlab
smoky sapphire
steady basalt
can anyone help me fix my fucking env?
u should maybe create a channel for it since here u will just get ignored
wooden sail
are you using vs code or pycharm?
smoky sapphire
do you use notebooks
steady basalt
jupyter
smoky sapphire
conda usually comes with pandas installed i think
steady basalt
doesnt matter where i go, im opening FROM INSIDE my env
smoky sapphire
try install with pip if u havent tried yet
wooden sail
you're opening as jupyter notebook from the terminal? or?
steady basalt
it all started when i tried to install shap and it wudnt work. now i can no longer find libraries inside any env
terminal
im panic, this has never happened before ever
wooden sail
what does conda env list show
wooden sail
can you paste here what conda env list shows
steady basalt
#
base                     /Users/william/miniforge3
ml                       /Users/william/miniforge3/envs/ml
ml3                   *  /Users/william/miniforge3/envs/ml3
thesis                   /Users/william/miniforge3/envs/thesis
oh wtf
ive createed env inside an env
wooden sail
that's telling you ml3 is active.
steady basalt
even still, ml3 shud work and it doesnt
 rough fossil
can you show the list of packages in ml3
rough fossil
did you launch the juputer from the cmd?
steady basalt
#
# Name                    Version                   Build  Channel
bzip2                     1.0.8                h3422bc3_4    conda-forge
ca-certificates           2022.6.15            h4653dfc_0    conda-forge
libblas                   3.9.0           15_osxarm64_openblas    conda-forge
libcblas                  3.9.0           15_osxarm64_openblas    conda-forge
libcxx                    14.0.6               h04bba0f_0    conda-forge
libffi                    3.4.2                h3422bc3_5    conda-forge
libgfortran               5.0.0.dev0      11_0_1_hf114ba7_23    conda-forge
libgfortran5              11.0.1.dev0         hf114ba7_23    conda-forge
liblapack                 3.9.0           15_osxarm64_openblas    conda-forge
libopenblas               0.3.20          openmp_h2209c59_0    conda-forge
libzlib                   1.2.12               ha287fd2_2    conda-forge
llvm-openmp               14.0.4               hd125106_0    conda-forge
ncurses                   6.3                  h07bb92c_1    conda-forge
numpy                     1.23.1           py39h7df2422_0    conda-forge
openssl                   3.0.5                ha287fd2_0    conda-forge
pandas                    1.4.3            py39hd2dba81_0    conda-forge
pip                       22.1.2             pyhd8ed1ab_0    conda-forge
python                    3.9.13          h96fcbfb_0_cpython    conda-forge
python-dateutil           2.8.2              pyhd8ed1ab_0    conda-forge
python_abi                3.9                      2_cp39    conda-forge
pytz                      2022.1             pyhd8ed1ab_0    conda-forge
readline                  8.1.2                h46ed386_0    conda-forge
setuptools                63.2.0           py39h2804cbe_0    conda-forge
six                       1.16.0             pyh6c4a22f_0    conda-forge
part1```hmmm...there it is
steady basalt
tk                        8.6.12               he1e0b03_0    conda-forge
tzdata                    2022a                h191b570_0    conda-forge
wheel                     0.37.1             pyhd8ed1ab_0    conda-forge
xz                        5.2.5                h642e427_1    conda-forge
zlib 1.2.12 ha287fd2_2 conda-forge``` part 2and to launch jupyter you just do jupyter notebook, yeah?
steady basalt
yes
wooden sail
hmm
steady basalt
ive never ever had this issue before
rough fossil
ok post a shot of the error in the notebook?
steady basalt
ModuleNotFoundError                       Traceback (most recent call last)
Input In [1], in <cell line: 1>()
----> 1 import pandas as pd
      2 import numpy as np
      3 from matplotlib import pyplot as plt

ModuleNotFoundError: No module named 'pandas'
i remove pandas and it will say that about numpy
wooden sail
try uh... closing that terminal, ending jupyter and all
steady basalt
i feel as though its conflicing with a pip versionsomewhere, SOMEHO)W
wooden sail
and opening a new terminal and running jupyter notebook again
steady basalt
closed i will try a 4th time
wooden sail
also yes, mixing pip and conda is a bad idea
steady basalt
sometimes its required because of bloody tensorflow
on mac
restarted
doesnt work. I have 1 week left to code my thesis project
I made the env as such: conda create --name env_tf python=3.9
and i remove to retry liek this
conda env remove -n ENV_NAME
brave sand
how can I visualize background networks?
steady basalt
environ({'__CFBundleIdentifier': 'com.apple.Terminal', 'TMPDIR': '/var/folders/8v/ysyf8h5d2x15l43gw_6g27280000gn/T/', 'XPC_FLAGS': '0x0', 'TERM': 'xterm-color', 'SSH_AUTH_SOCK': '/private/tmp/com.apple.launchd.B7C9cMOKZw/Listeners', 'XPC_SERVICE_NAME': '0', 'TERM_PROGRAM': 'Apple_Terminal', 'TERM_PROGRAM_VERSION': '445', 'TERM_SESSION_ID': '18D234C6-955E-481E-A0EC-B85F47C1E209', 'SHELL': '/bin/zsh', 'HOME': '/Users/william', 'LOGNAME': 'william', 'USER': 'william', 'PATH': '/Users/william/miniforge3/envs/ml3/bin:/Users/william/miniforge3/condabin:/usr/local/bin:/usr/bin:/bin:/usr/sbin:/sbin', 'SHLVL': '1', 'PWD': '/Users/william', 'OLDPWD': '/Users/william', 'CONDA_EXE': '/Users/william/miniforge3/bin/conda', '_CE_M': '', '_CE_CONDA': '', 'CONDA_PYTHON_EXE': '/Users/william/miniforge3/bin/python', 'CONDA_SHLVL': '2', 'CONDA_PREFIX': '/Users/william/miniforge3/envs/ml3', 'CONDA_DEFAULT_ENV': 'ml3', 'CONDA_PROMPT_MODIFIER': '(ml3) ', 'CONDA_PREFIX_1': '/Users/william/miniforge3', 'LANG': 'en_GB.UTF-8', '_': '/usr/local/bin/jupyter', '__CF_USER_TEXT_ENCODING': '0x1F5:0:2', 'JPY_PARENT_PID': '6637', 'CLICOLOR': '1', 'PAGER': 'cat', 'GIT_PAGER': 'cat', 'MPLBACKEND': 'module://matplotlib_inline.backend_inline'})
brave sand
brave sand
do you guys know what vulnerability prediction is?
does anyone here know?
rough fossil
hmmm
wooden sail
and if instead of jupyter you just open a terminal, then type ipython, and try to import pandas there? does it work there?
steady basalt
/Library/Developer/CommandLineTools/usr/bin/python3
serene scaffold
rough fossil
import sys
print(sys.executable)
this is the surefire way to figure out what Python environment that process is using
rough fossil
ok so that's not the environment ml3
rough fossil
you have to start conda promt
steady basalt
i have never had to use this i use mac
rough fossil
conda activate ENV
steady basalt
its not a thing its terminal based
trust me i used this for a long time always launch the env using the terminal
rough fossil
we'll you have to activate the correct environment
steady basalt
i have it activatedf
wooden sail
doing conda env list showed it as being active though, i find that weird
steady basalt
[I 14:55:19.806 NotebookApp] Serving notebooks from local directory: /Users/william
[I 14:55:19.806 NotebookApp] Jupyter Notebook 6.4.12 is running at:
[I 14:55:19.806 NotebookApp] http://localhost:8888/?token=a6c7eb4de9947ac7d0be25291491c75c3fabae0b39483fec
[I 14:55:19.806 NotebookApp]  or http://127.0.0.1:8888/?token=a6c7eb4de9947ac7d0be25291491c75c3fabae0b39483fec
[I 14:55:19.806 NotebookApp] Use Control-C to stop this server and shut down all kernels (twice to skip confirmation).
[C 14:55:19.808 NotebookApp]
i swear its activate
i am launching the notebook from inside the active env
rough fossil
don't think so. its there if you run jupyter-notebook from the active instance you should be alright.
steady basalt
It has always worked like that
 grizzled tinsel
Hey guys, I have some information in .whl file. How do i load it in pandas, Jupyter notebook? Any help appreciated.
steady basalt
python -m ipykernel install --user --name myenv --display-name "Python (myenv)" is this what i need to do?
nb_conda_kernels
rough fossil
yes try that
steady basalt
...
think im going to need to be safely guided through nuking python and miniforge3 off of my laptop
im not really sure what else to do
like this is really really bad
rough fossil
its sounds like it. Does mac have the ability to create another user on your laptop?
steady basalt
yes
rough fossil
start from scratch there? maybe?
steady basalt
Hold on a minite
lookat this
# conda environments:
#
base                  *  /Users/william/miniforge3
ml                       /Users/william/miniforge3/envs/ml
ml3                      /Users/william/miniforge3/envs/ml3
thesis /Users/william/miniforge3/envs/thesis```after deleting thesis and ml2 envs
now look at my miniforge folder

why is ml2 there
ml2 shud have been removed when i told it to remove it
when i used conda remove --name ml2
wooden sail
indeed, but julia is also meant to be more progressive. numpy also largely looks like matlab
steady basalt
I HAVE pythno 3.8, 3.9 and 3.10 in an env
wtf is going on..
is it safe to delete env folders
and see what happens
my base has pythno 3.9 and 3.10 also
rough fossil
well the problem is starting the jupyter-notebook in the environment
steady basalt
i think the problem may be solved by knowing why my deletede env is still in my envs folder
is it safe to just delete all of miniforge
rough fossil
I'm not familiar with miniforge. stackoverflow that
I
d go with the if you need to run one thing. do the new user and set it up there and see what happens.
steady basalt
deleting the entire folder
lets see
ok opening terminal no longer says base so i assume its gone
here goes nothin
trying a install
How
Curious
i installed miniforge after deleting its entire folder. launching jupyter notebook from inside activated environment STILL has the error
legit need to wipe my hard drive?
https://stackoverflow.com/questions/65373063/sys-path-and-sys-executable-is-incorrect-in-jupyter-but-no-applied-fix-is-worki this guy as similar problem

Stack Overflow
I've configured jupyter to be used from a remote computer and set a password to it while initial anaconda setup. Then after fixing this issue, I am trapped in another one. sys.path and sys.executab...
fixed
im gona cry
smoky sapphire
model = Sequential()
model.add(Dense(32, activation='relu', input_shape=(10, 14)))
model.add(Dropout(0.1))
model.add(Dense(64, activation='relu'))
model.add(Dropout(0.1))
model.add(Dense(3, activation='softmax'))
history = model.fit(X_train, y_train, epochs=500, batch_size=10)
ValueError: Input 0 of layer "sequential_8" is incompatible with the layer: expected shape=(None, 10, 14), found shape=(10, 14)
rough fossil
Supermoom, so did it get fixed?
steady basalt
Yes
basically you need to install jupyter in order to get it to recognise ur environment
in that env
even if u have jupyter insalled already
weird
 lapis sequoia
Guys, is there a difference between:
df.loc[df['Column'].isna()]
df.loc[df['Column'].isin({pd.NA, np.nan, pd.NaT})]
?
I am trying to built a flexible data validation function
Writing out a separate handler for nullables would be tedious...
Am I losing efficiency or precision by not relying on isna()?
serene scaffold
lapis sequoia
Guys, is there a difference between:
`df.loc[df['Column'].isna()]`
`df.loc[df[...
the external behavior might be the same, but I would just use isna
lapis sequoia
serene scaffold
the external behavior might be the same, but I would just use `isna`
The problem is that my validation options that I would have to handle in my functions then explode from 2^3 to 2^5
serene scaffold
lapis sequoia
The problem is that my validation options that I would have to handle in my func...
what are you trying to do where you have different null representations, and the difference matters?
lapis sequoia
I am basically trying to create a conditional check function that asks for three input parameters:
- What range of values do I expect in field 1
- Given a match, which values then do i expect in a field 2
- If there isn't a match, can value in a field 2 be populated or not?
Return statement of this function is return not df.empty
As you can see, all of this is pretty much df.isin(HASH_SET)...
Though I wonder if it would be possible to tell pandas "okay, so df.isin in this case, but df.isna is another" without writing down a massive 2^5 if-else tree of possibilities
serene scaffold
lapis sequoia
Though I wonder if it would be possible to tell pandas "okay, so `df.isin` in th...
but again, in what circumstance do you expect df.loc[df['Column'].isin({pd.NA, np.nan, pd.NaT})] to have a different result than df.loc[df['Column'].isna()]?
lapis sequoia
Let's say I expect my dataframe to follow three rules:
-
"If COL_1 is empty, COL_2 must be populated with any value from
{'eggs', 'spam'}. If COL_1 is not populated, COL_2 must remain blank" -
"If COL_3 is populated with with any value from
{'foo', 'bar'}, COL_4 must be populated with any value from{'eggs', 'spam'}. If COL_3 is not populated with these two values above, COL_4 must remain blank" -
"If COL_5 is populated with with any value from
{'foo', 'bar'}, COL_6 must be populated with any value from{'eggs', 'spam'}. Otherwise I don't care.
So it's trivial to do check my use case with three parameters - expected value in the column 1, expected value in column 2, and if I expect the column to be true otherwise
But adding two more arguments would require me to make a different decision on the basis of whether I want to invoke isin or isna... Which is boilerplate that I want to avoid
So I was kind of wondering if there are any downsides to abuse isin to effectively act as isna?
 tired wasp
Hiya.
I'm super interesting in this subject
Would love to speak with anyone who are trainers or tutors in Python.
Glad to be here otherwise and learn.
Thank you for any and all.
scarlet siren
I_lrr2 = X2.dot(Z2)
I_saliency2 = L2.dot(X2)
I_lrr2 = maximum(I_lrr2, 0)
I_lrr2 = minimum(I_lrr2, 1)
I_saliency2 = maximum(I_saliency2, 0)
I_saliency2 = minimum(I_saliency2, 1)
I_e2 = E2

F_llr = (I_llr1 + I_lrr2) / 2

F_saliency = (I_saliency1 + I_saliency2) / 2

F = F_llr + F_saliency

figure(1)
imshow(I_saliency1)
figure(2)
imshow(I_saliency2)
figure(3)
imshow(F)

imwrite(fuse_path, F)
I get this error on the last line:
Traceback (most recent call last):
  File "/home/arshia/.local/lib/python3.10/site-packages/imageio/v3.py", line 161, in imwrite
    encoded = img_file.write(image, **kwargs)
  File "/home/arshia/.local/lib/python3.10/site-packages/imageio/plugins/pillow.py", line 322, in write
    primary_image.save(self._request.get_file(), **save_args)
  File "/home/arshia/.local/lib/python3.10/site-packages/PIL/Image.py", line 2320, in save
    save_handler(self, fp, filename)
  File "/home/arshia/.local/lib/python3.10/site-packages/PIL/PngImagePlugin.py", line 1257, in _save
    raise OSError(f"cannot write mode {mode} as PNG") from e
OSError: cannot write mode F as PNG
python-BaseException

Process finished with exit code 1
 wooden sail
<@&831776746206265384> i think something has to be done about this
tired wasp
@cobalt imp I was in the vc with you for a moment and really like how you were assisting others. Are you a regular tutor by chance and have a group?
serene scaffold
tired wasp
<@378279228002664454> I was in the vc with you for a moment and really like how ...
this is the data science channel, so perhaps you meant to ask in #voice-chat-text-0. Mustafa is one of our staff members, though
 cobalt imp
tired wasp
<@378279228002664454> I was in the vc with you for a moment and really like how ...
cobalt imp
tired wasp
<@378279228002664454> I was in the vc with you for a moment and really like how ...
I don't have a group or whatever but I do tutor people occasionally.
tired wasp
serene scaffold
this is the data science channel, so perhaps you meant to ask in <#4123574301863...
I was there and thought to link here pertaining to my original post above, however in the future i'll keep specific as to not fill the channels unnessaraly indeed. Thank you for the marvellous tip.
tired wasp
cobalt imp
I don't have a group or whatever but I do tutor people occasionally.
I would love to see how I could perhaps join. I'm starting out but pretty eager and can explain myself to you and my schedule should that be at all possible. Thanks for the reply too.
 tardy epoch
Looking for feedback in this project (repo)[https://github.com/Shayan-Raza/Cryptocurrency-data-web-app]
It is a webapp tht uses the coinmarket cap API and displays the data in a streamlit webapp.
scarlet siren
scarlet siren
```py
I_lrr2 = X2.dot(Z2)
I_saliency2 = L2.dot(X2)
I_lrr2 = maximum(I_lrr2, 0)
I...
So I looked the error up
Stack Overflow
I am taking a jpg image and using numpy's fft2 to create/save a new image. However it throws this error
"IOError: cannot write mode F as JPEG"
Is there an issue with CMYK and JPEG files in PIL?...
But now while the code runs with no errors
It returns a blank image 💀
Literally

imwrite(fuse_path, Image.fromarray(F).convert('RGB'))
Last line of code is
Cause using skit-image's grey2rgb didn't work
ValueError: the input array must have size 3 along `channel_axis`, got (496, 632)
ur learning python?
tired wasp
steady basalt
ur learning python?
I am. It is the basis of the course I am taking.
steady basalt
what fundamentals are u learning right now
tired wasp
Hi there.
steady basalt
do u know java or c++ or anything else
tired wasp
Right now literally bare bones not much.
tired wasp
steady basalt
do u know java or c++ or anything else
Nope.
So I'm starting from scratch.
tired wasp
Gotcha.
steady basalt
I have some good learning excersises
do you know about if statements and for loops yet?
tired wasp
I have been following some courses on the logic part from Youtube but only been about a week.
Yeah statements were part of it and loops.
steady basalt
could you write a simple function to print something if a number is odd or even
if inputs an int
tired wasp
steady basalt
could you write a simple function to print something if a number is odd or even
Yeah i think I can. But like I said still pretty basic. Are you learning too?
tired wasp
ah super.
steady basalt
what if you were given a list of intergers and u had to print for each of them
tired wasp
Could we plan a meeting and discuss how you grew and such? I would love to hear about making a proper procedure for learning within a year indeed.
Since you are more experienced I would lot to jolt it down
steady basalt
go right now and try to make a function that will take in a list of integers and print odd or even for each in the list one at a time
show the result
i know this is the best method ever, just do it
tired wasp
steady basalt
show the result
I can'do that rn or keep the conversation going as I just started with work. However when I am done I can input here over like ten hours.
You okay with that
?
I'll do it if alright.
steady basalt
ur in west coast?
tired wasp
No. I live in Europe.
steady basalt
lol nice shift

 odd meteor
tired wasp
Since you are more experienced I would lot to jolt it down
odd meteor
tired wasp
Since you are more experienced I would lot to jolt it down
Welcome to the life-long journey champ 💪🏿💪🏿
steady basalt
blood sweat n fuckin tears
tired wasp
odd meteor
Welcome to the life-long journey champ 💪🏿💪🏿
hak you kindly. I am here for the long haul. Glad to meet you too.
steady basalt
unironically the most difficult undertaking ever, except perhaps math catchup
tired wasp
steady basalt
blood sweat n fuckin tears
ain't so bad rn. After a while we can celebrate together
steady basalt
once u get the stage when u can do leetcode easy questions but NOT medium or much dsa
is when it gets the most painful
give it a year
tired wasp
steady basalt
once u get the stage when u can do leetcode easy questions but NOT medium or muc...
So you are saying this stage is intermediate. Gotcha
A year is great. I got the time.
Did you have a step by step process that you followed @steady basalt
tired wasp
Would love to setup a chat with you when you and I are more viable and go at it?
Would you be up for it?
steady basalt
no mic
tired wasp
No worries.
Chatting like this is fine
Just want to take sources, guides, and exercises
 gleaming osprey
my model seems to output the same value every time
no matter the input
and my accuracy is only 25%
scarlet siren
Guys feel free to take a look in #help-mushroom to see if you have any idea
welp it died
But tldr
steady basalt
so its the probability of 6 firms with the 6th being a fiddler?
scarlet siren
I_lrr2 = X2.dot(Z2)
I_saliency2 = L2.dot(X2)
I_lrr2 = maximum(I_lrr2, 0)
I_lrr2 = minimum(I_lrr2, 1)
I_saliency2 = maximum(I_saliency2, 0)
I_saliency2 = minimum(I_saliency2, 1)
I_e2 = E2

F_llr = (I_llr1 + I_lrr2) / 2

F_saliency = (I_saliency1 + I_saliency2) / 2

F = F_llr + F_saliency

figure(1)
imshow(I_saliency1)
figure(2)
imshow(I_saliency2)
figure(3)
imshow(F)

imwrite(fuse_path, F)
Last line errors:
Traceback (most recent call last):
  File "/home/arshia/.local/lib/python3.10/site-packages/imageio/v3.py", line 161, in imwrite
    encoded = img_file.write(image, **kwargs)
  File "/home/arshia/.local/lib/python3.10/site-packages/imageio/plugins/pillow.py", line 322, in write
    primary_image.save(self._request.get_file(), **save_args)
  File "/home/arshia/.local/lib/python3.10/site-packages/PIL/Image.py", line 2320, in save
    save_handler(self, fp, filename)
  File "/home/arshia/.local/lib/python3.10/site-packages/PIL/PngImagePlugin.py", line 1257, in _save
    raise OSError(f"cannot write mode {mode} as PNG") from e
OSError: cannot write mode F as PNG
python-BaseException

Process finished with exit code 1
Values are here
 steady basalt
audit 6 firms to find one that fiddles
oh nvm
its until they find 3
so it can be 3 non fiddlers, then 3 fiddlers in a row, or any such combination
until they hit 3/6
scarlet siren
Checking the error in google shows I gotta change scale to rgb but grey2rgb on skit-image gives this:
Traceback (most recent call last):
  File "/home/arshia/.local/lib/python3.10/site-packages/PIL/Image.py", line 2953, in fromarray
    mode, rawmode = _fromarray_typemap[typekey]
KeyError: ((1, 1, 3), '<f8')

The above exception was the direct cause of the following exception:

Traceback (most recent call last):
  File "/home/arshia/PycharmProjects/pythonProject/src/main.py", line 71, in <module>
    imwrite(fuse_path, gray2rgb(F))
  File "/home/arshia/.local/lib/python3.10/site-packages/imageio/v3.py", line 161, in imwrite
    encoded = img_file.write(image, **kwargs)
  File "/home/arshia/.local/lib/python3.10/site-packages/imageio/plugins/pillow.py", line 311, in write
    pil_frame = Image.fromarray(frame, mode=mode)
  File "/home/arshia/.local/lib/python3.10/site-packages/PIL/Image.py", line 2955, in fromarray
    raise TypeError("Cannot handle this data type: %s, %s" % typekey) from e
TypeError: Cannot handle this data type: (1, 1, 3), <f8
yes basically, isnt it just finding the probability that it goes 3 non fiddlers in a row, or 3,5,6th fiddle? but wudnt that have differnet P ?
thats quite confusing
i think they dont want this considered but simply its going to be 3/6 0.1s
else thats a hard question
wats the answer?
probability of 1 being a fiddler from 2 firms its 0.2 right?
so by extension 1 of six would be 0.6?
hows that calculated
wow thats cool
in this case how many n x is it
4,5,6, 3,4,6 2,5,6 etc
 mint palm
where are decision tree used??
i mean where it would be beneficial over other classification
saw some videos and seemed pretty lame to me lmao
steady basalt
i wud never use it over rf
wooden sail
yes
ah, but now that i think about it. that considers all ways of making 3 mistakes, and some are not valid, e.g. 111000
scarlet siren
Is it normal for cv2 not to have any imread, imwrite etc?
steady basalt
its a real brain teaser
wooden sail
i think you can keep the last one fixed as a mistake, then take 5 choose 2 as the total number of ways you can make those mistakes. then weigh each one by the probabilities. something like (5 choose 2) (0.1)^3 (0.9)^3? can you try that?
@charred egret :x
0.00729
scarlet siren
I've put my question on #help-chocolate as to not clutter the channel
wooden sail
😌 did you get the logic?
 quick eagle
I have rows with mostly NaN values. From time to time, I get two or three rows with values, then back to NaN. is there a way to keep just the first value and make the 2nd/3rd ones NaN? Trying with shift(-1), etc but not sure...
Basically, go from: . . . . . . . x x . . . . . . x x x . . . . . .
to: . . . . . . . . . x . . . . . . . .x . . . . .
(. is Nan, x is a value)
https://stackoverflow.com/questions/70100401/delete-a-row-from-a-pandas-df-if-the-previous-row-is-equal-to-some-value That seems close, but I down't want to delete the row, just replace the value with NaN in those following rows
Stack Overflow
I have a df
index id action
1 A crawl
2 A walk
3 A run
4 B crawl
5 B run
6 B walk
7 B jump
8 B walk
I want to delete a certain row ...
serene scaffold
quick eagle
I have rows with mostly NaN values. From time to time, I get two or three rows w...
how did you end up with this in the first place? it sounds like you tried to load data that was improperly formatted, and the parser did the best it could without giving up.
quick eagle
I have an analog data stream from a sensor and doing a threshold/transition detection. my samplign rate is high, so it will get 2-3 values on the 'falling' side
serene scaffold
@quick eagle can you give an exact example from your data of the input and desired output?
wooden sail
so that's the key observation. if we let 1 be when the company makes a mistake, we note that the binomial probability formula gives you the probability of observing an event n times if you repeat it N times. in this case, they way they audit N = 6 times and find n = 3 mistakes. HOWEVER. they say that the person auditing STOPS at the third one. that means that strings of successes like 111000 are not valid, and same with 101100, for example. so what do we do? we notice that this means that the 6th event needs to be a mistake necessarily. so we're fixed in at xxxxx1, where we don't know the x's. but we notice there are 5 slots left, and 2 of them, any two, can be a mistake. we also don't care about the order, i.e. making mistakes 11, it doesn't matter if you swap those two 1's around. that means there are a total of (5 choose 2) ways of making the first 2 mistakes, and the third one NEEDS to be made at the 6th position. this gives us the number of ways that we can make 3 mistakes, such that the auditing person stops exactly at the 6th audit. now we need the probability. well, the probability of each of these can be computed by simply multiplying the probability of each event (making a mistake or not), since they're independent. we know ahead of time that in all scenarios, we have 6 trials, and 3 have mistakes. the probability of that happening is 0.1^3 * 0.9^3. we finish by multiplying this by the total number of ways in which we can do this, which was (5 choose 2). i think my explanation is kinda bad, but hopefully you get the idea. counting problems are always hard, sadly. at least for me, at any rate
quick eagle
not too easy to see, but there are several orange dots on the 'falling side', where I just want to keep the first one (using it to get timing)
 scarlet siren
So I've used opencv instead and it doesn't require me to convert back to rgb
However I get a blank black image now
steady basalt
do u mean 5^2 by five choose two?
wooden sail
.latex no, i mean $\binom{n}{k} = \frac{n!}{k!(n-k)!}$
 strange elbowBOT
 steady basalt
strange elbow
steady basalt
strange elbow
lol nice formula
why does everyone have their results table in the exact same style every time
wooden sail
you did indeed. but then you can make the result succinct by using that to modify the binomial distribution. i'm pretty sure this has a name btw but i can't for the life of me remember it
it's probably a latex template
 scarlet siren
Current opencv code is:
from os.path import join
# from imageio.v3 import imread, imwrite
from skimage.color import rgb2gray, gray2rgb
from time import time
from cv2 import imread, imwrite, cvtColor, COLOR_RGB2GRAY, COLOR_GRAY2RGB
from latent_llr import latent_llr
from matplotlib.pyplot import imshow, figure
from numpy import maximum, minimum

index = 2  # Can be from 1-16

path1 = join('./images/IR' + str(index) + '.png')
path2 = join('./images/VIS' + str(index) + '.png')
fuse_path = join('./images/fused/fused' + str(index) + '_latllr.png')

image1 = imread(path1)
image2 = imread(path2)


if len(image1.shape) == 3 and image1.shape[2] > 1:
    # image1 = rgb2gray(image1)
    # image2 = rgb2gray(image2)
    image1 = cvtColor(image1, COLOR_RGB2GRAY)
    image2 = cvtColor(image2, COLOR_RGB2GRAY)

image1 = image1.astype(float)
image2 = image2.astype(float)

lambda_value = 0.8

print('LatLLR: ')

tic = time()

X1 = image1
Z1, L1, E1 = latent_llr(X1, lambda_value)
X2 = image2
Z2, L2, E2 = latent_llr(X2, lambda_value)

toc = time()

print(f'Elapsed time = {toc - tic} seconds.')

print('LatLLR: ')

I_llr1 = X1.dot(Z1)
I_saliency1 = L1.dot(X1)
I_llr1 = maximum(I_llr1, 0)
I_llr1 = minimum(I_llr1, 1)
I_saliency1 = maximum(I_saliency1, 0)
I_saliency1 = minimum(I_saliency1, 1)
I_e1 = E1

I_lrr2 = X2.dot(Z2)
I_saliency2 = L2.dot(X2)
I_lrr2 = maximum(I_lrr2, 0)
I_lrr2 = minimum(I_lrr2, 1)
I_saliency2 = maximum(I_saliency2, 0)
I_saliency2 = minimum(I_saliency2, 1)
I_e2 = E2

F_llr = (I_llr1 + I_lrr2) / 2

F_saliency = (I_saliency1 + I_saliency2) / 2

F = F_llr + F_saliency

# figure(1)
# imshow(I_saliency1)
# figure(2)
# imshow(I_saliency2)
# figure(3)
# imshow(F)

imwrite(fuse_path, F)
Result image is this

the imshow functions showed nothing either
(Before being commented ofc)
 iron basalt
steady basalt
iron basalt
steady basalt
"Also, IEEE often uses tables with “open sides,” (without vertical lines along each side...": https://ctan.math.washington.edu/tex-archive/macros/latex/contrib/IEEEtran/IEEEtran_HOWTO.pdf
 steady basalt
iron basalt
"Also, IEEE often uses tables with “open sides,” (without vertical lines along e...
steady basalt
iron basalt
"Also, IEEE often uses tables with “open sides,” (without vertical lines along e...
Bcs i dont use latex, i made my own style in word that uses double and thick top line
plus helvetica
iron basalt
Manuscript templates providing a consistent format for composing and formatting conference papers.
iron basalt
IEEE makes conventions / standards.
wooden sail
ieee papers are usually double column. they look super cluttered if you fully box the table in. but more than that, they just made up a style. if you want your paper published in ieee, you need to at least somewhat adhere to their format. and you probably do want that, since ieee is well known and that makes it likely that your stuff will be read and cited
iron basalt
Like IEEE 754 floating point format used in most modern machines.
I don't agree with the paper style. I prefer less clutter and more flexibility in not following a strict format.
steady basalt
I do in microsoft word: caption then a triple line that has two thick ones, then headers, then a thickish line, then thin lines per row (no side lines or col lines) then a double line at the bottom with one bneing thick to end it
oh no its just doubler not 3
iron basalt
I also prefer papers with "childish" drawings / diagrams in them. Makes it not as serious / much fun to read.
steady basalt
what font do u use
and spacing?
i use 1.15 spacing i find it obnoxxious when people use 2+
font size 12, 11 for tables and helvetica is now my flavour so i look like a mac os app
gleaming osprey
can somebody help me
my model is garbage
this is the model:```py
tf.config.run_functions_eagerly(True)
model = Sequential()
model.add(Conv2D(1, 2, activation='relu', input_shape=(48, 48, 1)))
model.add(Conv2D(1, 2, activation='relu'))
model.add(Conv2D(1, 2, activation='relu'))
model.add(Conv2D(1, 2, activation='relu'))
model.add(Conv2D(1, 2, activation='relu'))
model.add(MaxPooling2D(2))
model.add(Conv2D(1, 2))
model.add(Conv2D(1, 2))
model.add(Conv2D(1, 2))
model.add(Conv2D(1, 2))
model.add(Conv2D(1, 2))
model.add(Flatten())
model.add(Dense(256, activation='relu'))
model.add(Dense(128, activation='relu'))
model.add(Dense(64, activation='relu'))
model.add(Dense(32, activation='relu'))
model.add(Dense(7, activation='softmax'))
model.summary()```
wooden sail
why are you doing so many convolutions
steady basalt
ive never seen
anything like that
just copy someones model for similar problem
this wont work very well at all
wooden sail
ah you're doing convs with 2x2 filters, and only 1 of each. that should be the same as just one conv2d(5,2). 2x2 is pretty small though
steady basalt
change relu to linear?
scarlet siren
So I've been trying to track down the issue using debuggers
If the result image is black
It means the ndarray is all zeroes right?
Here's the funny thing tho
The final array, F
is not zero-filled

However E1, E2 are zero-filled
So I go back to the latlrr function to see if something is mistranslated
And tbh
I can't find any mistranslation
scarlet siren
The right approach would be learning matlab and then reading the matlab code
processing it and coming with a solution
however I cannot do that due to a very short deadline for the project
 tidal bough
scarlet siren
tidal bough
scarlet siren
Perhaps you need to multiply by 255 to convert from a representation where brightness goes from 0 to 1, to one where it goes from 0 to 255.
total guess, but I had this problem once
scarlet siren
tidal bough
Perhaps you need to multiply by 255 to convert from a representation where brigh...
Multiply F (the final matrix)?
tidal bough
The thing you're converting to an image, yeah.
 wooden sail
that looks reasonable for a low rank matrix, but what was the original
 wooden sail
the easiest test you can do is that if the threshold is set to 0, you should get the original image back. if you set it to 1 (or however you scaled the algorithm), then you should get a black image
scarlet siren
threshold of what tho
wooden sail
your algorithm is thresholding singular values
scarlet siren
the svd function?
wooden sail
so, which part of the algorithm are you testing, first of all?
because the alg does some svd's, then thresholds them, and then merges two or more images together based on the thresholded singular values
scarlet siren
Technically I finished the code translation and just trying to match final images
It's the worst way to go about it but I don't know how to process the matrices ops
wooden sail
well, that's exactly what you have to do to debug this 😛
scarlet siren
My logic is
If the matlab code is functional
An exact translation should be as well
wooden sail
the question is, what are you translating?
scarlet siren
As in the algorithm?
wooden sail
you're running into functions that cannot be translated in a single step, so you're left with understanding the math behind the code, and rewriting the math in another lang 😛
gleaming osprey
my model is overfitting rlly hard
l2 regularization is doing nothing
on train data I get 96%, but on test data 49-50%
scarlet siren
wooden sail
you're running into functions that cannot be translated in a single step, so you...
I'd run the code on matlab and try to do a debug as well
However 1. I'm on linux
wooden sail
there's matlab on linux
scarlet siren
Paid I suppose?
wooden sail
all matlab is paid
if you have a license already, you can just transfer it
there's free octave though
scarlet siren
octave as in the website or an app version?
wooden sail
both
steady basalt
gleaming osprey
on train data I get 96%, but on test data 49-50%
add dropout
start w 0.2
gleaming osprey
steady basalt
add dropout
ok
gleaming osprey
steady basalt
start w 0.2
whats that? the probability of dropout?
steady basalt
yes
gleaming osprey
one more question
does a dropout layer act as a dense layer?
should I replace my dense layers with dropout layers
wooden sail
no, you add them in between layers
gleaming osprey
then?
gleaming osprey
wooden sail
no, you add them in between layers
only dense layers or can it be Conv2D and MaxPooling layers too?
wooden sail
anywhere you like. note that pooling layers have no trainable parameters though
gleaming osprey
ok!
steady basalt
look man stop doing 1,2 conv just do one conv layer
then add a 0.2 dropuot once aftr that
gleaming osprey
steady basalt
look man stop doing 1,2 conv just do one conv layer
?
steady basalt
u have stacks of these useless code
gleaming osprey
oh I changed my model since
steady basalt
add 0.2 dropout after the conv and also add it after each dense
i bet you will suddenly get +10% acc
gleaming osprey
here it is:```py
model = Sequential()
model.add(Conv2D(8, 2, activation='relu', input_shape=(48, 48, 1)))
model.add(MaxPooling2D(2))
model.add(Conv2D(16, 2, activation='relu'))
model.add(MaxPooling2D(2))
model.add(Conv2D(32, 2, activation='relu', kernel_regularizer = keras.regularizers.l2(0.001)))
model.add(MaxPooling2D(2))
model.add(Conv2D(64, 2, activation='relu', kernel_regularizer = keras.regularizers.l2(0.001)))
model.add(Flatten())
model.add(Dense(256, activation='relu', kernel_regularizer = keras.regularizers.l2(0.001)))
model.add(Dense(128, activation='relu', kernel_regularizer = keras.regularizers.l2(0.001)))
model.add(Dense(64, activation='relu', kernel_regularizer = keras.regularizers.l2(0.001)))
model.add(Dense(32, activation='relu'))
model.add(Dense(7, activation='softmax'))
On the topic of matlab, what do I need to learn for this?
I have a very short deadline and Idk how to not get in trouble
gleaming osprey
steady basalt
add 0.2 dropout after the conv and also add it after each dense
ok
wooden sail
if this is still for mnist, you're doing something very wrong, it's not this difficult
wooden sail
like VERY wrong
steady basalt
yes u shud get 97% on msnist with 0 effort
gleaming osprey
steady basalt
yes u shud get 97% on msnist with 0 effort
i do
it is emotion detection
i think its a bit harder
steady basalt
also
just do 5 epochs and show if its reducing the overfitting
ull be able to see the curve insatntly drop down
u shud be able to see in live time though after 1 epoch the valoidation
 unique flame
scarlet siren
On the topic of matlab, what do I need to learn for this?
I have a very short de...
unique flame
scarlet siren
On the topic of matlab, what do I need to learn for this?
I have a very short de...
google some matlab live docs? they're similar to notebooks
scarlet siren
unique flame
google some matlab live docs? they're similar to notebooks
Searching the term just brings up the live editor which does not show up on my browser
scarlet siren
So I just tried to run each line of code in the octave script editor
As soon as I did imread(path1)
The resulting matrix was
gigantic
>> disp(size(image1))
   496   632
How am I gonna keep track of the matrix 💀
The idea would be to write a python app that can compare the values between two codes
brave sand
does anyone have any tips for graphing excel data? and formatting?
serene scaffold
brave sand
does anyone have any tips for graphing excel data? and formatting?
you can open the excel file in pandas and then use the plotting methods, or use seaborn.
keep in mind that in computer science, a "graph" is a model for entities and their relationships, whereas "plot" unambiguously refers to data visualizations.
brave sand
serene scaffold
you can open the excel file in pandas and then use the plotting methods, or use ...
sorry, I meant plot. I loaded the excel file and printed it fine. Could I manipulate the data in python? is seaborn the library you recommend?
serene scaffold
brave sand
sorry, I meant plot. I loaded the excel file and printed it fine. Could I manipu...
I don't actually make plots outside helping people make them here. you can manipulate the data with pandas and then use the plotting methods. but I don't know what the data is, what you're trying to plot, or how the data would need to be manipulated to accomplish that. so I'm not sure how to advise you.
if you make the plot "with pandas", it just uses matplotlib under the hood. I often find matplotlib confusing, and some people think seaborn is an improvement.
brave sand
https://docs.google.com/spreadsheets/d/1WjOCJjWLKQ2lJIZ1tmfvHZfim2gQqOKy/edit#gid=1869176421
here is the dataset, do I fill the missing data with the median or 0s? I want to plot it as a function of time vs departments

Google Docs
CultivosIlicitos
CULTIVOS ILÍCITOS
Coca (Valores en hectáreas)
CODDEPTO,DEPARTAMENTO,CODMPIO,MUNICIPIO,1999,2000,2001,2002,2003,2004,2005,2006,2007,2008,2009,2010,2011,2012,2013
1,91,AMAZONAS,91263,EL ENCANTO (Cor. Departamental),,,191.82,264.00,164.00,270.00,382.00,233.00,186.00,349.00,109.00,...
gleaming osprey
steady basalt
u shud be able to see in live time though after 1 epoch the valoidation
I don't have validation, should I?
steady basalt
im pretty sure you do have validation
keras has that built in bro
read what it says on the outpout as u train
serene scaffold
brave sand
https://docs.google.com/spreadsheets/d/1WjOCJjWLKQ2lJIZ1tmfvHZfim2gQqOKy/edit#gi...
I would start by copying the actual data into some minimal format (just the data with no images or formatting), and then you can open it and do fillna with whatever technique you want.
brave sand
serene scaffold
I would start by copying the actual data into some minimal format (just the data...
wouldn't copying it over be a pain? what is fillna?
gleaming osprey
steady basalt
read what it says on the outpout as u train
loss and accuracy
brave sand
I want to graph the total from each department vs time
gleaming osprey
ok I now have validation data but I still cant see it
gleaming osprey
brave sand
wouldn't copying it over be a pain? what is `fillna`?
fillna im pretty sure is like predicting what would be there if it wasn't null using say averages, and filling it
gleaming osprey
steady basalt
im pretty sure you do have validation
ok i have validation
now EXPLAIN how my validation accuracy IS BETTER than my training accuracy at 5 epochs
serene scaffold
brave sand
wouldn't copying it over be a pain? what is `fillna`?
it looks like you can just copy and paste from this excel file? or are there a bunch of pages like this one?
!docs pandas.DataFrame.fillna
 arctic wedgeBOT
DataFrame.fillna(value=None, method=None, axis=None, inplace=False, limit=None, downcast=None)```
Fill NA/NaN values using the specified method.I don't have access to this.
did you do pd.read_excel?
serene scaffold
brave sand
yes I did
do print(df.head().to_dict()) and put it in the paste bin
brave sand

Google Docs
Sheet1
1999,2000,2001,2002,2003,2004,2005,2007,2008,2009,2010,2011,2012,2013,2013,2014,2015,2016
TOTAL AMAZONAS,0,0,508.16,783,625.26,783,897,692,541,836,278,338,122,98,110,173,111.17,166.77
TOTAL ANTIOQUIA,3643.85,2546.93,3386.3,3029,4264.71,5165,6414,6156,9926,6096,4553,5350,3105,2725,991,2293...
serene scaffold
!paste
arctic wedgeBOT
Pasting large amounts of code
If your code is too long to fit in a codeblock in Discord, you can paste your code here:
https://paste.pythondiscord.com/
After pasting your code, save it by clicking the floppy disk icon in the top right, or by typing ctrl + S. After doing that, the URL should change. Copy the URL and post it here so others can see it.
brave sand
try this
serene scaffold
that works, I guess
serene scaffold
well, I did this df.fillna(0).plot.line()
and I got this

so that's something, I guess
brave sand
am I not able to see this graph in the command line?
serene scaffold
I'm using IPython and I did python -m IPython --matplotlib
brave sand
yeah I don't have that
serene scaffold
you can do pip install IPython to get it.
brave sand
what is the pros and cons?
serene scaffold
pros: you have it
cons: none
brave sand
are you running a python file?
serene scaffold
it's an interactive session
steady basalt
gleaming osprey
loss and accuracy
it says loss and accuracy and vlaidation loss and accuracy dont u make it up
u dont split into valid urself keras does it
steady basalt
gleaming osprey
now EXPLAIN how my validation accuracy IS BETTER than my training accuracy at 5 ...
welcome to probability
welcome to statistics heheheh
brave sand
any idea how to plot is with time as the x? and the points as the y?
 prime hearth
hello , im trying to classify text for sentimental analysis, but my dataset is imbalance. for example
number of good reviews 6863 vs number of bad reviews 1676
``` thats myresult and histogram above or below. Whats best way to handle imbalance dataset for string? Should i use random sampling where i pick random index from bad reviews and duplicate it in my dataset to make it balance?
whats the best way to handle imbalance dataest for string?
prime hearth
i was thinking over sampling
 golden olive
Hello. I have this code and it works. I'd like to add another column to the xlsx file but have to_sql ignore that column. This extra column will be used for the code to perform other actions, but doesn't actually exist in the db. So I need to ignore it during my insert. Is there a way I can do that? Thanks. This is in regard to Pandas.
cnx = config.connect()
df = pd.read_excel('/tmp/test.xlsx', index_col=0)
df.to_sql('joke', con=cnx, if_exists='append')
Answer:
df[['A', 'B']].to_sql('joke', con=cnx, if_exists='append')
 chilly abyss
Hi all, pls what could be wrong, my plot is not showing?
 brave sand
chilly abyss
Hi all, pls what could be wrong, my plot is not showing?
brave sand
chilly abyss
Hi all, pls what could be wrong, my plot is not showing?
do you have the code for that plot?
I'm trying to do a similar plot
chilly abyss
chilly abyss
Hi all, pls what could be wrong, my plot is not showing?
sorted. My error was in the data selection.
Thanks @brave sand 🙂
brave sand
chilly abyss
Thanks <@765319974469238814> 🙂
i meant like I need to see the code
I want to do something similar
lol my plot isn't work
@chilly abyss
chilly abyss
ok
brave sand
can you send the code?
chilly abyss
plt.style.use('ggplot')
fig,ax = plt.subplots(figsize = (10, 5))
ax.set(xlabel= 'Date-time', ylabel = 'power (w)',title = 'load vs local enrgy generation for site21')
#ax.plot()
plt.plot(dt["load"], 'blue', label= 'load')
plt.plot(dt["local generation"], 'green', label = 'local gen')
plt.legend()
plt.show()
brave sand
could I see what your data looks like?
Google Docs
Sheet1
1999,2000,2001,2002,2003,2004,2005,2007,2008,2009,2010,2011,2012,2013,2013,2014,2015,2016
TOTAL AMAZONAS,0,0,508.16,783,625.26,783,897,692,541,836,278,338,122,98,110,173,111.17,166.77
TOTAL ANTIOQUIA,3643.85,2546.93,3386.3,3029,4264.71,5165,6414,6156,9926,6096,4553,5350,3105,2725,991,2293...
i need help plotting this data
any help is appretiated
 brave sand
yeah I do
@chilly abyss
I'm thinking of a bar graph
bar graph? since there isn't an y axis right?
yeah
it's from 1999-2019
so I don't want to hard code it
yeah
how'd u do that lol
what the shit
why the black line?
do you have the code? I want to modify it for districts too
not just time
alright thanks
i am not unfortunately
hm
yeah I realized that rn lol
looking at the data
there isn't a way to do it by district right?
yeah
a bar graph can't do that
do you think it's possible to do that?
yeah that's what I'm thinking about
are there other graphs that could do that?
or could we have bar graphs overlap eachother?
do you know how to?
yeah, I get what your talking about
would a line graph with multiple lines work?
each line for each district?
the x is still the time
or would that graph be unclear
@charred egret what do you think?
@charred egret ?
how would I do it?
multiple lines?
u know how to do that? I’m not familiar with seaborn. sorry if your busy
so I changed the code to a lineplot
and I got this:
@charred egret so the idea is there

just have to change the times to districts
wdym
ah i see
yeah rn the dataframe is wonky
very janky per se
lemme send a ss

maybe I loaded the data wrong?
but thanks anyways for all your help
i appreciate it
I don't think so. I'm graphing this to see which district is more vulnerable, as in I assume this data is amount of cocaine or something smuggled in that year. all the districts are different so the districts with the highest values are the most vulnerable ones
wait
so this is correct
the graph
putumayo has 60k
just gotta move the "legend" elsewhere
i could figure that part out
thanks bro, I really appreciate it
oh man I feel bad
u should've let me know lol
gn bro
cobalt imp
tired wasp
I would love to see how I could perhaps join. I'm starting out but pretty eager ...
You can DM me about it if you'd like.
 celest scaffold
Hi, I am trying to string together sift keypoints so that I track certain keypoints throughout a video and show them on a picture. I have currently done so with a sequence of 3 images but cant form the logic that will work on a whole video frame by frame
arctic wedgeBOT
Hey @celest scaffold!
It looks like you tried to attach a Python file - please use a code-pasting service such as https://paste.pythondiscord.com
celest scaffold
If someone can help me translate this logic to a video instead of an image sequence of 3 I would very much appreciate it
smoky sapphire
i have this keras model:
model = Sequential()
model.add(Dense(32, input_shape=(X_train.shape[1],), activation='relu'))
model.add(Dropout(0.1))
model.add(Dense(32, activation='relu'))
model.add(Dropout(0.1))
model.add(Dense(3, activation='softmax'))
```that has 3 classes. i compiled it using:
```py
model.compile(loss='categorical_crossentropy', optimizer='adam', metrics=['accuracy'])
```and tried training it with:
```py
history = model.fit(X_train, y_train, epochs=800, batch_size=10)
```everything looked good until suddenly the accuracy (while training) dropped to 0.43 from 0.72 and then got stuck at 0.5677 for the rest of the training... are my layers wrong or what is it?
 steady basalt
Just check validation
G guys I have a interview today where I chose pandas over sql how do I NOT forget syntax for joins and stuff
gleaming osprey
my model validation is stuck on 55%
how can I fix this
this is my model ```py
tf.config.run_functions_eagerly(True)
model = Sequential()
model.add(Conv2D(8, 2, activation='relu', input_shape=(48, 48, 1)))
model.add(Dropout(0.2))
model.add(MaxPooling2D(2))
model.add(Conv2D(16, 2, activation='relu'))
model.add(Dropout(0.2))
model.add(MaxPooling2D(2))
model.add(Conv2D(32, 2, activation='relu', kernel_regularizer = keras.regularizers.l2(0.001)))
model.add(MaxPooling2D(2))
model.add(Conv2D(64, 2, activation='relu', kernel_regularizer = keras.regularizers.l2(0.001)))
model.add(Flatten())
model.add(Dense(256, activation='relu', kernel_regularizer = keras.regularizers.l2(0.0005)))
model.add(Dropout(0.3))
model.add(Dense(128, activation='relu', kernel_regularizer = keras.regularizers.l2(0.0005)))
model.add(Dropout(0.3))
model.add(Dense(64, activation='relu', kernel_regularizer = keras.regularizers.l2(0.001)))
model.add(Dropout(0.3))
model.add(Dense(32, activation='relu'))
model.add(Dropout(0.2))
model.add(Dense(7, activation='softmax'))
model.summary()```
gleaming osprey
steady basalt
also remove relu and add linear
y should I
gleaming osprey
steady basalt
u sure ur data actually lets u predict
i think so
im getting 55% validation
96% training
@steady basalt
steady basalt
0.96 and 0.55 on what epoch
gleaming osprey
steady basalt
0.96 and 0.55 on what epoch
50
 atomic tide
For future reference, this is the negative binomial distribution: https://en.wikipedia.org/wiki/Negative_binomial_distribution
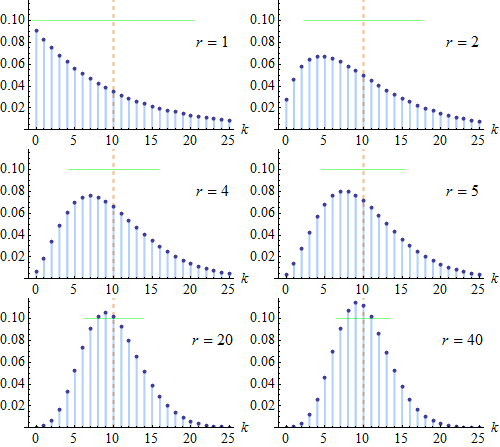
In probability theory and statistics, the negative binomial distribution is a discrete probability distribution that models the number of successes in a sequence of independent and identically distributed Bernoulli trials before a specified (non-random) number of failures (denoted r) occur. For example, we can define rolling a 6 on a die as a su...
wooden sail
lovely, that's exactly the name i had forgotten
 finite kayak
Hello, can I ask a question? I kinda asked this question yesterday but I changed my mind and will rephrase it differenty?
atomic tide
finite kayak
Hello, can I ask a question? I kinda asked this question yesterday but I changed...
Sure, go ahead
atomic tide
wooden sail
lovely, that's exactly the name i had forgotten
Yeah, I'm not sure why it's called that 🤔
finite kayak
I will study “data science and artificial intelligence” and don’t have much knowledge about laptops. I am going to buy a laptop for the university. I have 2 options on my mind. These are;
1-) https://www.saturn.de/de/product/_apple-macbook-pro-m1-2020-myd82d-a-2701416.html
2-) https://www.notebooksbilliger.de/acer+nitro+5+an515+45+r97h+gaming+730225
Some people say that buying a laptop with rtx is better because it allows you to access the cuda library, whereas some people say it is better to use MacBook. As I said, I don’t know very much about the laptops. Can someone help me?

Saturn
APPLE MacBook Pro (2020) MYD82D/A, Notebook mit 13,3 Zoll Display, Apple M1 Prozessor, 8 GB RAM, 256 GB SSD, M1 GPU, Space Grau
The laptop I have has the processor i5-3320M and since I want to specialise in this area, I want to buy a laptop. At least that is my thought
wooden sail
they're correct in that m1 gpu support is still in diapers. on the other hand, you won't run into any coursework that will have you run super large models on your own laptop: any heavy load will usually run on something like colab or your university's cluster. i'd more say it depends on whether you want to game or not, or whether you already use mac vs windows
 spring mortar
You will usually have the chance to run on CPU anyway
serene scaffold
finite kayak
I will study “data science and artificial intelligence” and don’t have much know...
at this point, I would ask the department where you're going to be studying if you actually have to run ML code on your own computer. because like I said yesterday, they will probably provide you with an environment for that.
spring mortar
Also ask if what they do is available on Windows, macOS and Linux
steady basalt
finite kayak
I will study “data science and artificial intelligence” and don’t have much know...
omg not the 2020
spring mortar
We have software in our department that only works on windows because it's very niche and has never been ported to somewhere...
steady basalt
i already told u about this
spring mortar
Also don't buy anything outside of an M1 mac if you are going down the apple route
steady basalt
if ur gona get one it has to be the 14 inch m1pro
finite kayak
I know but I contacted the university. Unfortunately they said they won’t provide anything. And normally I decided to use my old laptop but I want to specialise in this area. Therefore, I thought it is good to have a good laptop since I will also try to improve myself by self-learning
And while I am learning something, it might be disappointing to see that my laptop cannot do the tasks
serene scaffold
finite kayak
I know but I contacted the university. Unfortunately they said they won’t provid...
when they said they "won't provide anything", what was the question, exactly? because "anything" is very context-dependent.
did you ask very specifically if you would need to run ML code on a CUDA-enabled device that you own?
steady basalt
dont bother with a old 2020
wait for november to get the m2pro
theres 0 need for one in first semester theyre gona teach u how to do things first without doing hard tasks
wooden sail
flashbacks to my first semester task of vector quantization that took like 5 hrs to run
spring mortar
finite kayak
I know but I contacted the university. Unfortunately they said they won’t provid...
Start off with your current laptop and in week 2 you will have a better idea and can ask the teaching staff for their opinion.
finite kayak
The university I am going to apply for has opened this “data science and artificial intelligence” recently. Therefore, they also don’t know exactly. I asked “will the university help us with hardware if it is needed?” And they said “the university does not provide any hardware for the first semester”
steady basalt
ask them what hardware YOU need
spring mortar
My hot take would be that you don't need any specific hardware in first semester. Is it a bachelors or masters programme?
finite kayak
Bachelor
steady basalt
lol...
spring mortar
Don't worry at all
steady basalt
u dont even need a gpu
spring mortar
Use your current laptop until you know more
steady basalt
just use co lab
serene scaffold
finite kayak
The university I am going to apply for has opened this “data science and artific...
even if they don't give you a computer with a GPU, they might have cloud VM with a GPU that students and log into. That's how my university did it. so no student ever had to purchase a GPU, ever.
and if there's a cloud VM with a GPU, they're making hardware available to you without "giving it to you".
but I'd be surprised if you were even doing GPU computation during your first semester.
finite kayak
Okay then. Sorry for asking it again just to make it clear. Normally I was planning to study molecular biology but since the plan has changed, I found myself in an area where I almost have 0 knowledge.
steady basalt
since when are there AI bachelors tho
this field bout to get hella saturated and automated i can feel it coming
spring mortar
finite kayak
Okay then. Sorry for asking it again just to make it clear. Normally I was plann...
Don't be sorry, it's all fine :) Just enjoy the opening phase, try to get an understanding on what you will be doing for a year.
serene scaffold
finite kayak
Okay then. Sorry for asking it again just to make it clear. Normally I was plann...
No problem. I just don't want you to waste money on something you don't need because of a misunderstanding.
finite kayak
It is called as “data science and artificial intelligence”. Only a few universities offer this Bachelor. The known universities usually offer “computer science” bachelor and then “artificial intelligence” in master.
steady basalt
id recommend to you comp sci 100000%
i regret not doing it
ur gona need the skills u learn there to perform well in interviews imo
i have coding interviews in some ds jobs
and its hard af
serene scaffold
steady basalt
id recommend to you comp sci 100000%
if they want to be a data scientist/AI developer, getting a DS/AI specific degree will probably serve them better than a CS degree
steady basalt
i disagree when they get asked to quicksort or sum leaves in a binary tree in their first interview
but i suppose thats maybe a regional meta
serene scaffold
steady basalt
i disagree when they get asked to quicksort or sum leaves in a binary tree in th...
I work as an AI developer, and I was never asked a single programming question in any of the interviews for the job I currently have. it was all theory and general problem solving skills.
steady basalt
if i cud go back it wud be comp sci bachelros then ds masters
steady basalt
serene scaffold
I work as an AI developer, and I was never asked a single programming question i...
i guess my current interviews more leaning towards DE
spring mortar
serene scaffold
I work as an AI developer, and I was never asked a single programming question i...
Can you share some of the questions or types of questions you were asked? I'm very curious since I also work in the field but almost haven't been asked any questions.
steady basalt
At junior level they will show no mercy in London
Coding, probability, general competence
 ripe forge
You don't need a degree to learn how to get through interviews. Treat it like a separate skill to learn
serene scaffold
spring mortar
Can you share some of the questions or types of questions you were asked? I'm ve...
"what is the difference between precision and recall"
"what is the difference between supervised and unsupervised learning? give an example of each."
"what are techniques for dealing with missing data?"
"what are the advantages and disadvantages of neural networks?"
steady basalt
lmfao, if they asked that in junior interviews it wud be TOO easy
ripe forge
Also, the reality is, interviews don't really align with your day to day jobs. You just have to learn how to get through them
steady basalt
ive been asked to do coding, weird questions about regression, business questions, how to clean financial data if its already 'clean' in the traditional sense, and the most funny one was 'where does the data come from'
serene scaffold
steady basalt
lmfao, if they asked that in junior interviews it wud be TOO easy
these are all questions I was asked in first-round interviews, to sus out people who lied on their resume. the last round for the job I currently have practically involved a thesis defense.
steady basalt
in 15 mins i have a interview which im too nervous for so i will forget all syntax, its mainly in pandas
gona fail bad
imagine being nervy so u just go blank and forget how to code on the spot
cringe
ripe forge
We all fail sometimes. Accepting that may help you with the nerves.
steady basalt
no im like really anxious idk
spring mortar
serene scaffold
"what is the difference between precision and recall"
"what is the difference be...
Thank you
ripe forge
Remember that if you apply to 100 places, you just need to pass through 1. It's just a numbers game
steady basalt
what if they ask me how to do a simple pandas query and i totaly forget
ripe forge
Then you'll learn from your experience and hopefully do better in the next one.
steady basalt
i mihgt just unrust SQL for the next one and use that instead
ripe forge
I had an interview where, funnily enough it was a pandas join question and i didnt know the syntax
steady basalt
i can feel the adrenaline rn.
i know how to join in pandas luckily buti may forget in 20 mins
ripe forge
I just told the interviewer upfront and we ended up just talking through the problem on the whiteboard in essentially incorrect pandas syntax but used as pseudocode
I got the job at the end.
ripe forge
Syntax isn't everything. Don't worry, give it your best
ripe forge
Are you going to talk with a person or no
ripe forge
Then they may nudge you too, just remember to communicate
steady basalt
im gona fuckin choke aaaaaaahhhh
ripe forge
If you choke, you choke. It happens.
steady basalt
thank christ they cancelled
gleaming osprey
finite kayak
I will study “data science and artificial intelligence” and don’t have much know...
ok, I have an M1 mac and I will tell you one thing, I would recommend you getting a really good RTX laptop instead, the M1 is actually not as good as advertised and lags quite a bit (for gaming and ML training) because most apps (including jupiter notebook and anaconda navigator) so I will say by a million miles get the acer.
and its also not that flexible with app support given that on windows you have a million more games, apps and especially dev tools
tho if you using it lightly for moderate programming, its brilliant as long as its not c++ or any game engine
finite kayak
Thanks a lot!
 amber thorn
Hey guys...can someone here help me with my code...I've been trying to plot a tanh (in its exponential form) graph but with a deformed exponential called Tsallis exponential (https://en.wikipedia.org/wiki/Tsallis_statistics). I already have a code that runs perfectly fine...and here's the code...
import matplotlib.pyplot as plt
import math

#Tsallis tanh
def fun(q,x):

  if (1+(1-q)*x)>0 and q != 1:
    return (1+(1-q)*x)**(1/(1-q))
  elif (1+(1-q)*x)<=0 and q != 1:
    return 0**(1/(1-q))
  elif q==1:
    return np.exp(x)

def q_tanh(q,x):
  return( ((fun(q,x)-fun(q,-x))/(fun(q,x)+fun(q,-x))) )

v_tanh = np.vectorize(q_tanh)
x = np.linspace(-10,10,100)

test = [1,0.5,0.25,0,-1]

z = np.tanh(x)

for q in test:
  plt.plot(x,v_tanh(q,x),'--',label = "q=" + str(q))
plt.plot(x,z,'k')
plt.title("Tsallis Exponential")
plt.xlabel('X')
plt.ylabel('Y')
plt.legend()
plt.show()
However...
i get this error...
     13 def q_tanh(q,x):
---> 14   return( ((fun(q,x)-fun(q,-x))/(fun(q,x)+fun(q,-x))) )
     15
     16 v_tanh = np.vectorize(q_tanh)

TypeError: unsupported operand type(s) for -: 'NoneType' and 'float'```when I delete this part of the equation from my code... elif (1+(1-q)*x)<=0 and q != 1: return 0**(1/(1-q))
any help would be much appreciated!!
serene scaffold
This probably means that fun(q,-x) returned None
spring mortar
@amber thorn I would try and take a look at the data types (by a simple print statement with type()) of the return values of the functions in the error message. Apparently there is something empty (NoneType) which is being subtracted something of the data type float.
serene scaffold
By the way, remember that return is not a function, so using parentheses for that just adds noise. Also, remember to put spaces in your expressions, so that they're easier to read.
steady basalt
gleaming osprey
ok, I have an M1 mac and I will tell you one thing, I would recommend you gettin...
or you just dont know what youre doing, it doenst 'lag' for ML
its not gona have as low step time as a 3080 but its still very good for a laptop
amber thorn
serene scaffold
This probably means that `fun(q,-x)` returned None
okay..thanks
amber thorn
spring mortar
<@758362010059669565> I would try and take a look at the data types (by a simple...
thanks...I'll try that...and will let you know.
prime hearth
hello, i would like to please ask, should i remove stop words before using spacy library?
i wanted to use spacy to do text extraction for NLP
steady basalt
wish it wasnt so hot. really cant be bothered to keep coding my thesis its just horrible
how do u stay motivated and not procrastinate
gleaming osprey
How do u know?
mint palm
i saw some videos
isnt autoencoder and sparse encoding same?
why is it listed as two different things in types of unsupervised learning
wooden sail
they're not the same. lemme see if i can give a good explanation
mint palm
can i use sparse coding for denoising anomily detection data as well
wooden sail
in sparse encoding, you begin with the knowledge or assumption that your observations follow a linear model. you then try to learn that linear model: i.e., you learn a matrix and a vector that multiplies that matrix. the matrix-vector product yields a linear combination. you learn the matrix and the vector using whatever data-driven method you like, including but not limited to deep neural networks.
in autoencoding, you also learn a small set of parameters, which means you also find a sparse representation. the difference is that these parameters explain the data only through a network, i.e. it's a nonlinear model.
so you're right in that they are both sparse representations. the difference is that one model is a linear model, and the other is whatever your network learns, which in general is nonlinear
steady basalt
gleaming osprey
How do u know?
I have one
gleaming osprey
@steady basalt oh
steady basalt
i have the 2021 pro
 zealous granite
Anyone recommend how to get into machine learning after learned the python basics?
steady basalt
i heard andy ng is good
 brave osprey
off
offcourse
write this in python pip install sklearn
and start to explore the library enjoy cuz is very big
questions ?? fast that i am a master of mathematical and computational modelling
FAST!!!!
prime hearth
@zealous granite krish naik is good channel as well. But for any new subject you need a roadmap so that it realisitic. krish niak chanel has videos on roadmaps to learn ML or Deep learning or NLP etc. Can also google ML roadmap
 nova matrix
for feature in ['Sex','Cabin','Embarked','Title']:
le = LabelEncoder()
le.fit(titanic[feature].astype(str))
titanic[feature] = le.transform(titanic[feature].astype(str))
I used this code to encode my labels
I wanted to encode my test labels then with
for feature in ['Sex','Cabin','Embarked','Title']:
test[feature] = le.transform(test[feature].astype(str))
but it was giving me an error
y contains previously unseen labels: 'male'
brave osprey
how i can speak invoice chat 0?
nova matrix
Does anyone know how to get around this ^
brave osprey
nova matrix
Does anyone know how to get around this ^
I CANT SPEAK?
 cinder plover
nova matrix
for feature in ['Sex','Cabin','Embarked','Title']:
le = LabelEncoder()
l...
cinder plover
nova matrix
for feature in ['Sex','Cabin','Embarked','Title']:
le = LabelEncoder()
l...
I would suggest that you just do it manually for four of the column and append it to the main data frame, or just override the label encoded columsn on the dataframe..
brave osprey
deep learnig?
steady basalt
100% deep learning
serene scaffold
cinder plover
Does anyone of you know deep learning ?
what do you want to know about deep learning
serene scaffold
cinder plover
I know
why are you asking who knows about keep learning?
steady basalt
cinder plover
Has anyone got any doubts
i have many doubts
prime hearth
hello, im looking to work as machine learning engineer, but i would like to please ask, is this a good datascience project?
My project is using NLP to get the most common sentiment from reviews using scipy text extraction. The code is just a few lines, but i did clean the data prior to this. I was planning on using these sentiments and showcase it on the frontend for business reviews
i not sure if this is consider a decent ML project since the actual ML stuff is like 3 lines or so
but the rest of the code is just data cleaning
my stack will include Next js, bootstrap/scss and flask/express with Docker and cloud for my ML model
 teal tangle
HELP!
I need a logic:
Input-> "Hey Shawn. Why are you mad at Steve. He is just stupid. Tom is the hero of cartoon. He is very cute." Now, using NLP I created a cluster of noun-pronoun. the clusters are {'Steve': ['He'], 'Tom': ['the hero of cartoon', 'He']}
- we dont have to take care of how this is done, bcoz its already working for me.
Now, my task is to create a function so that the output will be -> "Hey Shawn. Why are you mad at Steve. Steve is just stupid. Tom is the hero of cartoon. Tom is very cute."
This output can be generated using the cluster, like 1st item of list will be used to replace 2nd item of the list in sentence, example "Steve" will replace first "He" and "Tom: will replace "the hero of cartoon" and 2nd "He".
dict = {} #cluster of noun and pronouns which is automatically take inputs from NLP library

for key, values in dict.items():
    for i in values:
        doc = doc.replace(i, key)
Now, this will create a dictionary from cluster(list of noun-pronouns): {'Steve': ['He'], 'Tom': ['the hero of cartoon', 'He']}
Can someone tell me how to fix this output: (Hey is replaced as Stevey as Hey contains He. and 2nd He should ne Tom, but Steve is replaced in that position"
Input: "Hey Shawn. Why are you mad at Steve. He is just stupid. Tom is the hero of cartoon. He is very cute."
Output: "Stevey Shawn. Why are you mad at Steve. Steve is just stupid. Tom is Tom. Steve is very cute."
Actual Output: "Hey Shawn. Why are you mad at Steve. Steve is just stupid. Tom is Tom. Tom is very cute."
Note: Input can be changed. Thanks
lapis sequoia
Any servers for R?
 modest haven
Hey! I plan to make a model which informs the user when they aren't looking directly at the camera- the input will be the video provided by the webcam
I have very little experience in machine learning, how should I go about making this model?
iron basalt
prime hearth
hello, im looking to work as machine learning engineer, but i would like to plea...
ML project or data-science project?
steady basalt
whats the difference?
scarlet siren
So I just noticed that
im2double in matlab is not the same as ndarray.astype(float)
proof is
Array after matlab code

After python code in pycharm after the same operatios
 wooden sail
matlab scales down to the range [0,1]. you'd have to divide the numpy array by the max value
and/or save the matrix as a .mat file and load it in python, then compare
prime hearth
@iron basalt they are interchangeable
scarlet siren
Up until this time the result was the same
wooden sail
that will not give you the same result because of what i just told you. you need to scale one down, or the other up
matlab uses a different scaling
scarlet siren
So divide the numpy array by maximun(ndarray)?
wooden sail
np.max(arrray)
scarlet siren
oh ok
scarlet siren
wooden sail
np.max(arrray)
The results are still different
wooden sail
show them

 wooden sail
is the value of lambda the same in both?
wooden sail
what's this part of the code then. i have nothing to go on
scarlet siren
image1 = Image.open(path1)
image2 = Image.open(path2)

image1 = asarray(image1)
image2 = asarray(image2)

if len(image1.shape) == 3 and image1.shape[2] > 1:
    image1 = Image.fromarray(uint8(image1))
    image2 = Image.fromarray(uint8(image2))
    image1 = image1.convert('L')
    image2 = image2.convert('L')
    image1 = asarray(image1)
    image2 = asarray(image2)

image1 = image1.astype(float)
image1 = image1 / np.max(image1)
image2 = image2.astype(float)
image2 = image2 / np.max(image2)
Matlab code:
image1 = imread(path1);
image2 = imread(path2);

if size(image1,3)>1
    image1 = rgb2gray(image1);
    image2 = rgb2gray(image2);
end

image1 = im2double(image1);
image2 = im2double(image2);
If your target audience thinks it's useful then it's a good project regardless if ML or data-science unless your target audience knows more details about ML vs data-science / what they want. But either way, if you can make useful things, you will probably be hired somewhere.
steady basalt
tf is the difference between ml and data science
iron basalt
steady basalt
whats the difference?
I'm trying to think of a nice example, but it's just difference in goals.
steady basalt
ML is an integral part of it
wooden sail
what library is Image from?
iron basalt
Data-science can definitely make use of ML. But that is different from being an ML engineer.
prime hearth
thanks and yeah they are different, it just most some say they are really same
it just depends on the company
scarlet siren
wooden sail
what library is Image from?
PIL
I would use opencv but I don't think there's a difference
iron basalt
prime hearth
it just depends on the company
Yes, and what their understanding of it is. Many just want someone that can do analysis of some kind, and script to handle the data (an employee that brings value, which happens to be through programming + analysis of data skills / to bring some insight).
wooden sail
scarlet siren
PIL
and what type is image1 before doing image1.astype(float)?
scarlet siren
ndarray I believe
iron basalt
iron basalt
Yes, and what their understanding of it is. Many just want someone that can do a...
The key in any case is to convince them that you provide value (not to check off some list of "this is what data-science or ML is").
wooden sail
scarlet siren
ndarray I believe
can you print the before and after? it's gonna be ndarray in both cases, i wanna see the dtype though
iron basalt
iron basalt
The key in any case is to convince them that you provide value (not to check off...
And often that involves just simple projects. So I think your project is fine. Just make a couple more. If you swing often enough, you will eventually hit something.
wooden sail
the whole thing, not just the size
scarlet siren
uint8
float64
iron basalt
prime hearth
my stack will include Next js, bootstrap/scss and flask/express with Docker and ...
Presentation is key, so yeah, I would present it with some nice front-end (visuals sell (and keyword optimization)).
wooden sail
scarlet siren
uint8
float64
after converting to L mode it's uint8?
prime hearth
one is home page and another is the dashboard which is where the ML is
@iron basalt do you know if there is a way to pass informatino to a model from javscript
i was planning on using express as the backend framework then find a. way to pass data into my model
iron basalt
prime hearth
i was planning on using express as the backend framework then find a. way to pas...
You could just use a Python backend.
prime hearth
i dont want to use flask since express is more like cleaner
iron basalt
prime hearth
i dont want to use flask since express is more like cleaner
Django?
scarlet siren
wooden sail
after converting to L mode it's uint8?
No that was after the astype(float)
prime hearth
oh ok, i guess il jsut use flask if there is no way
wooden sail
scarlet siren
No that was after the astype(float)
that can't be
iron basalt
The backend does not need to be complicated so whatever works. It will be clean either way as long as it's simple.
wooden sail
show the code of what you just did
prime hearth
yeah it just in express framework there is router library and it really clean and easy to use
compared to flask or django it not same
thanks for help
scarlet siren
image1 = Image.open(path1)
image2 = Image.open(path2)

image1 = asarray(image1)
image2 = asarray(image2)

print(image1.dtype)

if len(image1.shape) == 3 and image1.shape[2] > 1:
    image1 = Image.fromarray(uint8(image1))
    image2 = Image.fromarray(uint8(image2))
    image1 = image1.convert('L')
    print(image1.dtype)
    image2 = image2.convert('L')
    image1 = asarray(image1)
    image2 = asarray(image2)
print(image1.dtype)
image1 = image1.astype(float)
print(image1.dtype)
image1 = image1 / np.max(image1)
image2 = image2.astype(float)
image2 = image2 / np.max(image2)```
Output is:
uint8
uint8
float64
So before and after greyscale it's uint8
wooden sail
try comparing the images before converting to float, are those also different?
iron basalt
prime hearth
i was planning on using express as the backend framework then find a. way to pas...
It would probably be a separate server running the model that the web server gives requests to. But if you are doing Flask or Django it can just be both in one for simplicity.
scarlet siren
wooden sail
try comparing the images before converting to float, are those also different?
Image1 on matlab:

Image1 on python:

Is there some sort of export var on octave to compare both exactly?
With a code from python to like import the var and compare it to it's own image1
wooden sail
do you have octave installed or are you using it online
scarlet siren
I have it installed
wooden sail
do something like save "grayimg" image_variable_name
that should produce a .mat file
you can read mat files with scipy.io.loadmat
ah wait i think i got it
it shouldn't have been np.max, that's my bad. you needed to divide by 255... or possibly 256
try those out
i thought matlab was doing a relative scaling, but that's (possibly) not the case
scarlet siren
oh ok
wooden sail
did you check?

 wooden sail
seems that was indeed the case, it was just the scaling. this is the sort of stuff that was easier to check if you had exported the mat file, since taking the elementwise division would have yielded a matrix where all the entries are identical
scarlet siren
The code is now working 😮

Result image
@wooden sail You are a legend
Literally a legend
This project was 7 scores 💀
wooden sail
minstrels sing of a legendary dude that wastes away in front of a screen, lurking on discord all day
scarlet siren
I have one small issue tho
The code is totally working
However imshow is not showing anything
There is no error tho
(matplotlib)
wooden sail
are you running this on terminal?
scarlet siren
Yeah
wooden sail
classic. you probably forgot the plt.show()
 solar yew
Hey guys, sorry to once again sound like a broken record but I am still unsure of how you do model selection properly?
Seeing as hyperparam tuning can result in significantly better results, testing loads of untuned models doesnt seem great
steady basalt
scarlet siren
lov cafe nero
solar yew
For example for an nlp classifier im running these untuned models
models = []
models.append(("LR", LogisticRegression()))
models.append(("LDA", LinearDiscriminantAnalysis()))
models.append(("KNN", KNeighborsClassifier()))
models.append(("CART", DecisionTreeClassifier()))
models.append(("NB", GaussianNB()))
models.append(("SVM", SVC()))
models.append(("LightGBM", LGBMClassifier()))
models.append(("Random Forest", RandomForestClassifier()))
running cross-val getting decent results, however for things like the SVM the outcome is sub optimal (~0.6 -> Tuning -> ~0.85)
so what models should one choose to tune or tune all?
Really appreciate if someone could shed some light cause online I could only find people testing models (untuned), not selecting and in uni we seemed to gloss over this slightly
brave sand
nvm I got it
lapis sequoia
Hey, have you guys ever made a map with streamlit?
serene scaffold
solar yew
```py
models = []
models.append(("LR", LogisticRegression()))
models.append(("LD...
why do you make an empty list and then immediately append to it a bunch of times? you could put all that stuff in the list when you make it.
also, I'm not quite sure what I'm looking at. why do you have all of those?
steady basalt
jsut watched fight club i wonder what happens after the buildings blow up
solar yew
serene scaffold
why do you make an empty list and then immediately append to it a bunch of times...
this is true, initially i was going one by one so just formatted it as that, will adjust
im looping through all the models and running an evaluation on them
def main(models):
    X, y = get_dataset(development_set)

    names = []
    scores = []

    for name, model in models:
        cv, score = evaluate_model(X, y, model)
        scores.append(score)
        names.append(name)
        print(">%s %.3f (+/- %.3f)" % (name, mean(score), std(score)))
        conf_matrix(X, y, name, model)

    return names, scores
I see. what are these models being trained to do?
serene scaffold
solar yew
Classifying amazon reviews as real or fake
what features are you using?
solar yew
serene scaffold
what features are you using?
word count, char count, rating, verified review, category and bi-grams
serene scaffold
solar yew
word count, char count, rating, verified review, category and bi-grams
what percentage of the reviews are fake?
brave sand
does anyone know how to add a weight to my code for a bubble graph?
serene scaffold
@solar yew in what way are you using bigrams
solar yew
frequency in each text
serene scaffold
solar yew
frequency in each text
so a specific set of bigrams?
solar yew
top 200 of the cleaned text
serene scaffold
solar yew
top 200 of the cleaned text
and with all these features, you're getting between .6 and .85 accuracy?
solar yew
ah no I can just about achieve 0.8 with most untuned
though the question is more general
cause if i tune the svm it goes from being a terrible performer to one of my top
so i was wondering - for further projects, how i know which ones to bother tuning
steady basalt
svm tends t o be a terribl emodel
use random forest and having 1000 features wont hurt you
solar yew
yeah >10,000 datapoints is a terrible time for my poor laptop hahah
top performers apart from that are logistic and lightgbm
So is it just intuition, that some models require plentiful tuning, such as svm or a NN?
lapis sequoia
how do i install opencv on linux ImportError: OpenCV loader: missing configuration file: ['config.py']. Check OpenCV installation. error ^
serene scaffold
lapis sequoia
how do i install opencv on linux ```ImportError: OpenCV loader: missing configur...
what did you do to install it?
 pulsar hull
anyone know how to fix model collapse in GANs from scratch? all the tutorials i find on it use pytorch
 fallow shuttle
does anyone want to help code an ai?
i am pretty good at python but dont know everything
i want to code an AI that can learn about people and keep about 20 emotions it finds in a file and averages it to know how to talk to them when it says hello, who are you?
serene scaffold
fallow shuttle
i want to code an AI that can learn about people and keep about 20 emotions it f...
what do you mean, keep 20 emotions it finds in a file and averages it? what 20 emotions?
fallow shuttle
so, say you say
"I hate samantha at school" to this robot, who is a he.
he would see like "positive negative neutral neutral neutral" and keep those in a file for your
so this file would look like "negative positive neutral aggressive positive happy sad postive negative neutral neutral neutral"
and you can have legitimate conversations with it
serene scaffold
fallow shuttle
so, say you say
"I hate samantha at school" to this robot, who is a he.
he would...
so you want to assign a sentiment to each word?
rather
you want to do emotion classification on each word?
are you sure there are 20 different emotions? or did you just make that number up?
fallow shuttle
instead of using regular machine learning to learn words and stuff instead it has a word database and can recognize context clues to figure out how to respond to certain things.
say you say "I have clausterphobia" to boxr
he will say "I'm not sure what phobia clausterphobia is but what can i do to help"
fallow shuttle
serene scaffold
are you sure there are 20 different emotions? or did you just make that number u...
no theres not 20 emotions. it keeps a log of the last 20 emotions
ive coded this ai that i named boxr once but he needs a 2.0 his 1.0 is really dumb and becomes an asshole too easily
serene scaffold
@fallow shuttle have you read about how to create chat bots?
fallow shuttle
serene scaffold
<@326230471757398016> have you read about how to create chat bots?
yes. ive coded my first version
serene scaffold
is it on github?
fallow shuttle
it just kinda sucked and i cant do it on my own
fallow shuttle
serene scaffold
is it on github?
no. its litterally 3 files
"main" which contains loops and print commands
"users" which contains logs of the last 10 emotions it sees from you and your name when he asks "who are you"
and "dictionary" which contains every word he recognizes and every part he recognizes such as the part "phobia' which he translates to fear
serene scaffold
fallow shuttle
no. its litterally 3 files
"main" which contains loops and print commands
"users...
how does it form sentences
fallow shuttle
hes not just a chat bot tho. hes also supposed to be an anger and stress management bot but not a therpist. well maybe but not rn
serene scaffold
fallow shuttle
hes not just a chat bot tho. hes also supposed to be an anger and stress managem...
those things don't make it not a chat bot.
being a chat bot isn't a bad thing.
fallow shuttle
serene scaffold
how does it form sentences
well version 1 is kinda dumb. he has a dictionary of 5 words. what how, phobia, no, yes, and hello.
and if he asks "how is your day" and you replied "not good" he didnt recognize good and shortly became an absolute asshoile to anyone who speaks to him
he doesnt learn on his own he just generalizes based on the tone of your message and connotation
i want some people to help code a new one that is better and can reply to more words and messages and not ahve to use so many loops and print commands
serene scaffold
fallow shuttle
he doesnt learn on his own he just generalizes based on the tone of your message...
a common misconception is that AIs learn while they're being used. but that's usually not the case. all the learning usually happens before you start using it.
serene scaffold
fallow shuttle
i want some people to help code a new one that is better and can reply to more w...
it's not very likely that anyone will want to commit to ongoing participation in the project. but you can probably get suggestions.
iron basalt
serene scaffold
a common misconception is that AIs learn while they're being used. but that's us...
*Unfortunately true.
serene scaffold
iron basalt
*Unfortunately true.
which part is unfortunately true?
iron basalt
serene scaffold
which part is unfortunately true?
That a lot of AI out there is not doing continual / online learning. Rather it being separated into learning and inference.
(Would like it to not be the case)
fallow shuttle
well its not a misconception. i know ai's are used in processors and stuff to smartly distribute their stuff. but chat bots normally run on neutal networks that can use multipul users inputs to figure out the best way to respond to a word. but i dont want a neural network cause i want the bot to be able to be completly private to you and you only. so everything it needs to know and can know stays on your computer for the sense of security and safenss
serene scaffold
iron basalt
That a lot of AI out there is not doing continual / online learning. Rather it b...
well, if you just want to integrate AI in your product so you can say that it has AI, it's easier to just train a classifier once and forget it.
fallow shuttle
i also want boxr 2.0 to be able to communicate in languages i tried using loops and stuff to determine language when you first reply. but it doesnt work out well. because it becomes slow
iron basalt
serene scaffold
well, if you just want to integrate AI in your product so you can say that it ha...
Yup. The kind of AI that does online learning is not appreciated yet for what it can do.
(But also often not what is wanted by most right now)
iron basalt
fallow shuttle
well its not a misconception. i know ai's are used in processors and stuff to sm...
It being private has nothing to do with it using neural networks.
Or do you mean like generate something someone else said?
serene scaffold
fallow shuttle
i also want boxr 2.0 to be able to communicate in languages i tried using loops ...
I wouldn't try to make it work in more than one language until it has interesting responses and the emotion-related functionality that you want
fallow shuttle
i mean you can make a neural network that goes on a private computer but it would be one hell of a massive file for a chat bot
especially when it actually starts figuring out whats happening with someone in their conversations
iron basalt
iron basalt
(But also often not what is wanted by most right now)
*It also requires radical departure from "normal" statistics. Which forces one out of their comfort zone.
fallow shuttle
serene scaffold
I wouldn't try to make it work in more than one language until it has interestin...
i might actually need to recode it for every language
serene scaffold
fallow shuttle
i might actually need to recode it for every language
you might be able to use neural machine translation, or something like that
fallow shuttle
serene scaffold
you might be able to use neural machine translation, or something like that
no. im a language geek and know quite a bit of german and chinese mainly chinese is my second language and its not like you can say "i like roast beef sandwiches" to it in chinese and expect a correct grammar response
serene scaffold
@fallow shuttle just so you know, I work as a computational linguist, and I would find it exceptionally difficult to create a bot that does all the things you want it to do. unless you're a very experienced AI developer, I would encourage you to undertake a more attainable project.
serene scaffold
fallow shuttle
i learned python to code an ai
you can still do that. but it would probably take several years of study before you could potentially pull this off.
iron basalt
serene scaffold
<@326230471757398016> just so you know, I work as a computational linguist, and ...
Yeah, it's not really a thing right now yet. You can of course try, but it will take a lot of research. Social AI is also very experimental at the moment.
@fallow shuttle
(And you may run into some serious ethical issues with social AI (please research this too if you want to go for it))
serene scaffold
there are more attainable AI projects that will help you learn as you work on them, and that will make the process more satisfying and enjoyable for you. if you continue working on this, I think you will burn out before accomplishing anything.
iron basalt
You can try a bunch of smaller AI projects and after that you will have a better idea of what your goal AI might look like in terms of specification and implementation.
iron basalt
fallow shuttle
i mean you can make a neural network that goes on a private computer but it woul...
You will find the answers to these kinds of problems if you study machine learning.
 stable palm
 zealous granite
serene scaffold
what do you want to know about deep learning
zealous granite
serene scaffold
what do you want to know about deep learning
what is deep learning
 bold timber
why I can't find that price in my dataframe?
 wooden sail
are you sure the price printed by df.head() is the full number? it's probably formatted to only a few significant figures
a quick check would be to instead do df[df.price - 461 < 1]
bold timber
wooden sail
a quick check would be to instead do df[df.price - 461 < 1]
I already try do this, but I get the same result
 wooden sail
try it exactly as i wrote it, what do you get?
bold timber
wooden sail
try it exactly as i wrote it, what do you get?
like this
 wooden sail
oops, i meant df[abs(df.price - 461) < 1]
but in any case, what this means is that you're still not using all of the decimals that the df is storing, because (understandably) it doesn't print out all of them
bold timber
wooden sail
oops, i meant df[abs(df.price - 461) < 1]
Like this?
 wooden sail
that looks about right. still, pay attention to what i said above
is there any reason you want to check that specific number?
bold timber
wooden sail
is there any reason you want to check that specific number?
I'm trying to evaluate my model with actual value. Then, I wonder to see does it the y_test is caught in the actual value
wooden sail
you're very likely not going to be able to exactly estimate any of the numbers in the data frame
this is because many models use a sort of "distance" to measure how good they are, something like what i suggested you use up there
bold timber
wooden sail
you're very likely not going to be able to exactly estimate any of the numbers i...
That makes me wonder because I had completed another project and I got the exact value in my original dataset
and I think y_test are basically not be calculated in the model
wooden sail
well, that depends on the model and how you train it. polynomial interpolators pass exactly through all points, for example. and if you use a deep neural network where the number of examples is small enough, it can overfit and also pass exactly through the training data points
this won't always be the case, and is often undesirable
bold timber
bold timber
I already try do this, but I get the same result
But what do you think about this? Does it not completely print all float values?
wooden sail
apparently it doesn't, since you still can't find the value that way
 drifting topaz
Does anyone have a fine roadmap for learning Data Science on my own?