#data-science-and-ml
1 messages · Page 416 of 1
 misty flint
 hollow sentinel
maybe that'll be my next project
hollow sentinel
sports analytics
misty flint
im still working on my NYT api project
hollow sentinel
ken jee
misty flint
but i ended up getting too busy yet again
hollow sentinel
ken would approve
misty flint
my favorite podcaster
he released another podcast today
i already listened to it 
the person he interviewed worked in DS consulting for ~5 years or so
with one of the big 4
pretty interesting perspective
 tender acorn
Are you OCR or NLP term ?
 serene scaffold
I've found a situation where Series.apply is faster than idiomatic pandas, where s is a Series of strings and ys is a set of 5000 strings.
In [44]: %timeit s.apply(ys.__contains__)
69.5 µs ± 174 ns per loop (mean ± std. dev. of 7 runs, 10000 loops each)

In [45]: %timeit s.isin(ys)
407 µs ± 3.01 µs per loop (mean ± std. dev. of 7 runs, 1000 loops each)
go to sleep stel 🗿
serene scaffold
hollow sentinel
go to sleep stel 🗿
how about no

 flat birch
Hey.
I am running a github project in deep learning.
I am running a script and it's calling another script which is calling another script and it goes on. i want to get values printed for a tensor which is inside a called script. I am using a print function to get them printed but it's not working. Could you please help me understand of how to get the values printed of a script being called deep inside the code. I think it's the oops principles. Could you please direct me to usefull resources?
Thanks
tender acorn
flat birch
Hey.
I am running a github project in deep learning.
I am running a script and ...
Can you send me resource?, i will check for you 😄
flat birch
I don't think i can send it. I will try to explain it. So basically it's like this: i run script1. Inside script1 is calling script2. Script2 is calling script3. Script3 is calling script4. Script4 has some functions inside calculating some values (let's say) x and y. I need to work with these x and y. So if i want to find the shape of x. I wrote a print command to get shape printed in script4. But it's not getting printed.
So like how do I access these values?
It is an oops concept i think. Could you please help me understand 😭
 wooden sail
you could just return the values of x and y through all the functions
tender acorn
First: you can check all scripts have been run by logging in each script !
Confirm each script has been run before printing value x, y
 eternal cosmos
Hello
I have a good amount of GIS and automation using Python. I am looking to get into more specifically AI because I am very interested in it. Any suggestions on where to start?
tender acorn
eternal cosmos
Hello
I have a good amount of GIS and automation using Python. I am looking to g...

Coursera
#BreakIntoAI with Machine Learning Specialization. Master fundamental AI concepts and develop practical machine learning skills in the ... Enroll for free.
eternal cosmos
tender acorn
https://www.coursera.org/specializations/machine-learning-introduction?action=en...
Thank you! I'll check this out
tender acorn
http://cs231n.stanford.edu/ computer vision course.
 misty pewter
hey! can anyone tell me the basic or prerequsists to learn DS and AI apart from python.
wooden sail
some maths will carry you a long way
the most agreed-upon basics are statistics, linear algebra, and calculus
 dusk tide
I need help in open cv regarding a small piece of code .
It is regarding to haar cascade classifier
Can someone help?
 primal shuttle
I'd delicately add probability
@dusk tide ask your question 🙂 don't ask to ask - @serene scaffold back me up here 💪
 brazen yoke
hey
 whole thunder
hey
 wheat snow
Ok time to get that projecvt human friendly 
hollow sentinel
holy shit guyys
i think i might have big brain idea
?
i found this public food api
i can get nutritional facts on items like ttheir sugar, carbs, calories,
and then from there i was thinking maybe put it in a pandas dataframe
clean the data
and then some EDA
i like eating food so maybe it's a good project
import requests
import pprint


response = requests.get(url)


pprint.pprint(type(response.json()))
<class 'dict'>
<class 'dict'>
---------------------------------------------------------------------------
TypeError                                 Traceback (most recent call last)
<ipython-input-34-51155cb31122> in <module>()
     10
     11
---> 12 print(response["calories"])

TypeError: 'Response' object is not subscriptable
pprint.pprint(response.json().get("calories"))
so if .get works, why does me trying to print a key in the dictionary not work?
or am i just being dumb?
 steady basalt
Anyone else trying summer jam qualifier?
serene scaffold
steady basalt
Anyone else trying summer jam qualifier?
why are you asking here?
serene scaffold
steady basalt
Cause this my homies
well, make sure all your comments are on-topic.
serene scaffold
hollow sentinel
```python
<class 'dict'>
-------------------------------------------------------...
the error message says that response is a Response, not a dict.
response.json() is not the same thing as response. and JSONs get read into Python as dicts (or sometimes as lists).
serene scaffold
yay
serene scaffold
.
serene scaffold
hollow sentinel
i googled the error message and read the doc
this warms the cockles of my heart.
serene scaffold
I like to do import pprint as pp
hollow sentinel
yeah good idea
serene scaffold
I tend to have a lot of import [a-z]{3,} as [a-z]{2} in my code
hollow sentinel
i'm happy i came up w a nice project idea on my own
now i'm not so intimidated by APIs
i'm gonna start using them more for my projects
i like how this doc automatically generated my GET request for me
!pastebin
 arctic wedgeBOT
Pasting large amounts of code
If your code is too long to fit in a codeblock in discord, you can paste your code here:
https://paste.pythondiscord.com/
After pasting your code, save it by clicking the floppy disk icon in the top right, or by typing ctrl + S. After doing that, the URL should change. Copy the URL and post it here so others can see it.
hollow sentinel
so i get all of this just from one item
grilled chicken with pasta
but i want my dataframe to have like at least 100 entrees
actually wait
i think i can do this
a for loop is the best way to go here
and i think i can do a list comprehension
to make multiple food calls?
 little spear
Hi guys, i need help with datasets creation
i have these two data frames
df1.columns
Index(['uid', 'actionid', 'createdAt'], dtype='object')

df2.columns
Index(['uid', 'postid', 'createdAt'], dtype='object')
now when i am concatenating them
  df = pd.concat([df1, df2])

  df.columns
  Index(['uid', 'actionid', 'createdAt', 'postid'], dtype='object')
i get NaN value for postid
but if i concat them with axis=1
 df = pd.concat([activity_logs, post_likes], axis=1)

 df.columns
 Index(['uid', 'actionid', 'createdAt', 'uid', 'postid', 'createdAt'], dtype='object')
no i am getting duplicate column names with values uid, uid, postid, actionid, createdAt, createdAt
but i want unique column names with values like this uid, postid, actionid, createdAt
how can i achieve that can someone help me with this?
hollow sentinel
!pastebin
arctic wedgeBOT
Pasting large amounts of code
If your code is too long to fit in a codeblock in discord, you can paste your code here:
https://paste.pythondiscord.com/
After pasting your code, save it by clicking the floppy disk icon in the top right, or by typing ctrl + S. After doing that, the URL should change. Copy the URL and post it here so others can see it.
hollow sentinel
ok so here's my output
import requests
import pprint as pp
import pandas as pd
pd.set_option('max_rows', 99999)
pd.set_option('max_colwidth', 400)

url = "https://api.edamam.com/api/nutrition-data?app_id=aba82731&app_key=793acdcce19384d28aa31dbd04ae2e42&nutrition-type=logging&ingr=grilled%20chicken%20with%20pasta"

response = requests.get(url)

data = response.json()

pprint.pprint(data)

calories = data["calories"]
# print(calories)

cautions = data["cautions"]
# print(cautions)

diet_labels = data["dietLabels"]
# print(diet_labels)

calcium = data["totalNutrients"]["CA"]["quantity"]
# print(calcium)

cholesterol = data["totalNutrients"]["CHOLE"]["quantity"]
# print(cholesterol)

fat = data["totalNutrients"]["FAT"]["quantity"]
# print(fat)

iron = data["totalNutrients"]["FE"]["quantity"]
# print(iron)

dietary_fiber = data["totalNutrients"]["FIBTG"]["quantity"]
# print(dietary_fiber)

potassium = data["totalNutrients"]["K"]["quantity"]
# print(potassium)

magnesium = data["totalNutrients"]["MG"]["quantity"]
# print(magnesium)

sodium = data["totalNutrients"]["NA"]["quantity"]
# print(sodium)

protein = data["totalNutrients"]["PROCNT"]["quantity"]
# print(protein)

sugar = data["totalNutrients"]["SUGAR"]["quantity"]
# print(sugar)

vitamin_c = data["totalNutrients"][ 'VITC']["quantity"]
# print(vitamin_c)
i wanna store this in a for loop but i can't figure out how to write it
i was thinking of iterating through the values of the dictionary
 broken oxide
little spear
Hi guys, i need help with datasets creation
i have these two data frames
```py
d...
broken oxide
little spear
Hi guys, i need help with datasets creation
i have these two data frames
```py
d...
if you view the output for
print(df1.info())
print(df2.info())
Are all the column data types matching?
P.S. Reply to this message so I get notified
hollow sentinel
i can't seem to get calories i'll show the code and the error msg
for value in data["calories"]:
  print(value)
---------------------------------------------------------------------------
TypeError                                 Traceback (most recent call last)
<ipython-input-99-9ced5fe9c526> in <module>()
      2   print(value)
      3
----> 4 for value in data["calories"]:
      5   print(value)

TypeError: 'int' object is not iterable
bc an integer can't be iterated through
it can only be like grabbed
so maybe part has to be hard coded in
w/o a for loop?
just use an if condition
broken oxide
hollow sentinel
i was thinking of iterating through the values of the dictionary
I'm confused on what you want to change? The variable data is already stored as a dict and you're accessing each of the dict keys with data['key']. Are you wanting to create a loop that stores this data out of the dictionary? Or just wanting to print the dictionary values?
hollow sentinel
yeah, i wanna create a loop that stores the data out of the dictionary
so i don't have it hard coded like that
and it's shorter
does that make sense?
that's also just for one entree and i want a dataframe that's 100 entrees
# build the dataframe

df = pd.DataFrame(columns = ["calories", "cautions", "diet_labels", "calcium", "cholesterol", "fat", "iron", "dietary_fiber", "potasssium", "magnesium", "sodium", "protein", "sugar", "vitamin_c"])


#print(df)

df = df.append({
    "calories" : calories,
    "cautions" : cautions,
    "diet_labels" : diet_labels,
    "calcium" : calcium,
    "cholesterol" : cholesterol,
    "fat" : fat,
    "iron": iron,
    "dietary_fiber": dietary_fiber,
    "potasssium": potassium,
    "magnesium": magnesium,
    "sodium": sodium,
    "protein": protein,
    "sugar": sugar,
    "vitamin_c" :vitamin_c,
},
ignore_index=True)

print(df)
print(df.shape)
Ahh so the overall goal is to create a DataFrame from this dict and you want each column to be a key?
hollow sentinel
yes
bingo
i also need to make like a 100 get requests
for those 100 entrees
grilled%20chicken%20with%20pasta" bc if you see here that's one entree
so yeah idk how to go about this
i can manually make get requests it's just going to be tedious as hell
broken oxide
looking back at your link, the dictionary seems incomplete for me to try coding a solution
broken oxide
 hollow sentinel
!pastebin
arctic wedgeBOT
Pasting large amounts of code
If your code is too long to fit in a codeblock in discord, you can paste your code here:
https://paste.pythondiscord.com/
After pasting your code, save it by clicking the floppy disk icon in the top right, or by typing ctrl + S. After doing that, the URL should change. Copy the URL and post it here so others can see it.
broken oxide
Thanks, just wanted to make the same dictionary you are working with
hollow sentinel
ty for the help
this is my first time working with APIs so
i got very tired of downloading datasets from kaggle and wanted a real experience of messy data
lol
plus this is closer to what i'd do when i get the job
my end goal here is to use regression models to predict total calories given all the other 13 features
and ofc EDA
yeah idk how to do this
 stoic viper
Hey. I might need some help.
I have 2 dataframes.
Lets say one has a row that contains with 625 somewhere and other columns dont matter for this.
The other dataframe has also has one row that has 625. On a column that 625 has lets say 250km.
I want to add the 250km to the specific row that has the 625 in a column.
And all of this for thousands of rows and a lot of different numbers
Its hard to describe what i wanna do
I have this. And i wanna add the 523 to another dataframe at the row that contains the 77001 and also 898 for 77004 and so on
 broken oxide
hollow sentinel
idk what to do
broken oxide
hollow sentinel
idk what to do
Close I think, hang tight
broken oxide
hollow sentinel
```python
# build the dataframe
df = pd.DataFrame(columns = ["calories", "cauti...
A note that I'm getting a warning that Frame.append will be removed so I'm looking into other methods for future proofing
serene scaffold
broken oxide
A note that I'm getting a warning that `Frame.append` will be removed so I'm loo...
they're deprecating it? thank god. thank you for this wonderful news.
hollow sentinel
apparently i should be using .concat instead
that formats my dataframe really weirdly
that's what my data looks like
there also has to be a better way than me sitting there and typing 100 food items into the api website
i just don't know it
 agile cobalt
!e anyone has any clue about why this puts C as a column in one case, but in the other case it puts it as an Index level?```py
import pandas as pd
import numpy as np
np.random.seed(0)
data = pd.DataFrame(
{
"A": [1] * 1000,
"B": [1, 2, 3, 4] * 250,
"C": np.random.randint(0, 10, 1000),
"D": np.random.randint(0, 20, 1000),
}
)
def foo(df):
result = df.groupby(["A", "B"]).apply(lambda group: group.groupby("C")["D"].unique())
print(result.head(2))
foo(data)
foo(data.iloc[:100])
@agile cobalt :white_check_mark: Your eval job has completed with return code 0.
001 | C                                                    0  ...                                                  9
002 | A B                                                     ...
003 | 1 1  [18, 12, 2, 17, 7, 3, 4, 19, 11, 16, 15, 0, 6,...  ...  [16, 8, 7, 18, 13, 4, 5, 14, 19, 15, 12, 3, 6,...
004 |   2            [9, 11, 16, 0, 13, 10, 15, 17, 5, 7, 1]  ...             [17, 7, 12, 13, 4, 19, 9, 11, 2, 5, 0]
005 |
006 | [2 rows x 10 columns]
007 | A  B  C
008 | 1  1  0    [18]
009 |       1    [18]
010 | Name: D, dtype: object
i have an idea. just copy the column and then replace it with the values. That should work.
But its still confusing a bit
hollow sentinel
# build the dataframe

df = pd.DataFrame(columns = ["calories", "cautions", "diet_labels", "calcium", "cholesterol", "fat", "iron", "dietary_fiber", "potasssium", "magnesium", "sodium", "protein", "sugar", "vitamin_c"])


#print(df)

df = df.append({
    "calories" : calories,
    "cautions" : cautions,
    "diet_labels" : diet_labels,
    "calcium" : calcium,
    "cholesterol" : cholesterol,
    "fat" : fat,
    "iron": iron,
    "dietary_fiber": dietary_fiber,
    "potasssium": potassium,
    "magnesium": magnesium,
    "sodium": sodium,
    "protein": protein,
    "sugar": sugar,
    "vitamin_c" :vitamin_c,
},
ignore_index=True)

print(df)
print(df.shape)
just these
i'm trying to get all of this and predict the amount of calories for each entree based off the features
it's a headache and a half honestly
broken oxide
@hollow sentinel good news, I've got it
hollow sentinel
god bless
broken oxide

broken oxide
You're welcome, it was tricky because of the nested dictionaries but not impossible. In time, you'll learn to enjoy them once you see how to access each level. I'm just adding dome comments for you
hollow sentinel
ty
yeah i'm looking forward to doing more projects w APIs
there's a ton of cool ones out there
broken oxide
hollow sentinel
bingo
# Create DataFrame from data dictionary
# - set_index(0) makes the keys (columns) the index values
# - .T takes the transpose and makes the index the columns
# .reset_index(drop=True) resets index to 0 (1 row DataFrame) and drops old index
df = pd.DataFrame(data.items()).set_index(0).T.reset_index(drop=True)

# Select first 3 columns to keep as is
df = df[['calories', 'cautions', 'dietLabels']]

# For loop logic to create all other columns
# Since not all keys from totalNutrients are wanted, they must be selected in col_list
col_list = ['CA', 'CHOLE', 'FAT', 'FE', 'FIBTG', 'K', 'MG', 'NA', 'PROCNT', 'SUGAR', 'VITC']
value_list = []

# For each key and value (dictionary) in data['totalNutrients']
for key, value in data['totalNutrients'].items():
    # If key is in col_list
    if key in col_list:
        # Add value to value_list
        value_list.append(value['quantity'])

# Create dictionary of columns and values using zip()
clean_data_dict = dict(zip(col_list, value_list))

# Concatenate df with new DataFrame on the same index. axis=1 to concatenate on columns
df = pd.concat([df, pd.DataFrame(clean_data_dict, index=[0])], axis=1)

print(df)

try:
    main_df = pd.read_csv('data.csv')
    main_df = pd.concat([main_df, df])
    main_df.reset_index(drop=True, inplace=True)
    print(main_df)
    main_df.to_csv('data.csv', index=False)
except FileNotFoundError:
    df.to_csv('data.csv', index=False)

# OPTIONAL
# To change the column names at the end you can repeat the zip process
new_col_list = ["calories", "cautions", "diet_labels", "calcium", "cholesterol", "fat", "iron", "dietary_fiber", "potasssium", "magnesium", "sodium", "protein", "sugar", "vitamin_c"]

col_dict = dict(zip(col_list, new_col_list))

# .rename() uses a dict to map old column names to new column names
df.rename(columns=col_dict)

print(df)
wow
 lament ridge
Lmao
broken oxide
hollow sentinel
wow
I tried using index=[len(df)-1] so it would work for multiple iterations but now I see it won't so I'll change it back to original index=[0]
hollow sentinel
idk how to do the hundred API calls
broken oxide
If you did want to do multiple API calls then a loop wrapping all of this would work
hollow sentinel
hm
broken oxide
hollow sentinel
idk how to do the hundred API calls
How would you call the API multiple times? manually?
or like every hour?
hollow sentinel
well i think manually might be the only way
bc i only got that info by typing in "grilled chicken and pasta"
broken oxide
hollow sentinel
bc i only got that info by typing in "grilled chicken and pasta"
I've updated the code so that it will check is the file data.csv exits.
- If it does, load in and add new row to
main_df, overwritedata.csv - If not then generate it with first DataFrame
df
I hope all this helps 😁 Now you'll be able to repeatedly run using different url and build a database. Then, once you have enough rows, you can build your model!
@serene scaffold Are code questions and solutions stored in any way? Or would the best thing be to take the question and answer and post independently somewhere like stack overflow? Seems like information loss to let the chat consume it...
serene scaffold
broken oxide
<@253696366952316929> Are code questions and solutions stored in any way? Or wou...
all the conversations here just go into the endless scrollback. if you want to preserve a question/answer pair that you think will be useful for other people, you should do that on SO, yes.
broken oxide
serene scaffold
all the conversations here just go into the endless scrollback. if you want to p...
Damn, more effort but okay... In the pursuit of sharing knowledge!
@hollow sentinel is it working on your end?
hollow sentinel
broken oxide
<@567030124306759710> is it working on your end?
yeah, i see a data.csv
tysm
so do i have to keep typing the food items in for the API?
broken oxide
stoic viper
Hey. I might need some help.
I have 2 dataframes.
Lets say one has a row that...
Yeah I'm super confused. Try creating some simple DataFrames to demonstrate on with actually Python code
broken oxide
hollow sentinel
so do i have to keep typing the food items in for the API?
either type and run, or type a list of strings and then loop through that list with the api call inside. It would be best to extract the food item strings from an index on the site or something so you wouldn't need to type them all manually
broken oxide
Yeah like where ever you found this API, is there a list of possible food times it can take? I would think there is stored somewhere so the API can retrieve the data for said specific food item
hollow sentinel
Edamam - API developer portal for Nutrition Analysis, Food Database Lookup, Recipe Search API and others. Check out the Frequently Asked Questions.
i don't think so
ACTUALLY YES
wait i think it blocked me out
no it didn't hang on
broken oxide
Ahh well that would be the last thing to build your .csv database, Or if you can access all the data the API is retrieving from, that would skip over all this API stuff and get straight into the data science
The free plan says 100 calls per min but if you can't get a list to automatically generate then looks like this is for an app or something that like 1000 people could make calls to every 10 minutes
stoic viper
broken oxide
Yeah I'm super confused. Try creating some simple DataFrames to demonstrate on w...
Here we have some cars that have numbers as names. And they drove that Kilometers, but the km are in a different dataframe.
I want that in the first dataframe we get a new column with the kilometers for the specific cars. Im at as loss of how i should do it.
#first dataframe
data = [10,20,30,40,50]

df = pd.dataframe(data, columns=['Car Number']

#second dataframe
data = [[10, 250], [30, 400], [40, 250]]

df = pd.dataframe(data, columns=['Car Number', 'Kilometers'}
I just have to assign teh right values for the right row.
there was a small mistake
10 always drives 250
but also 40 can drive 250
I would start wit copying the column and then replace 10 with 250, but in my real example its 100+ numbers and i cant do that manually
hollow sentinel
broken oxide
The free plan says 100 calls per min but if you can't get a list to automaticall...
lst = ["Green salad with avocado", "Spinach Salad with Blood Oranges and Pistachios Recipe", "Green Bean and Plum Salad",
       "Anna's California Miso Avocado Salad recipes", "Spinach Frittata with Green Salad", "Chipotle Steak Salad", "Thai-Style Chopped Salad with Sriracha Tofu",
       "Chicken Fried Steak", "Grilled Mojo-Marinated Skirt Steak Recipe" , "Steak Sandwich Wrap recipes", "Grilled Steak Ramen Recipe",
       "Top Butt Steak with Whiskey Mustard Sauce", "Steak De Burgo", "Steak and Onion Taco Filling", "Celery Root And Potato Puree",
       "Crabby Potato Chips", "Oven-Fried Potato Chips", "Summer Potato Salad", "Mini Bacon and Potato Frittatas", "Sweet Potato Pie",
       "Kale smoothie", "Tropical Tofu Smoothie", "Chicken Marengo", "Orange Chicken", "Chicken Fricassee", "Tarragon Chicken",
       "Barbecued Chicken Pizza", "Chicken Marsala", "Chicken Carbonara", "Barbecue Chicken" "Caribbean Chicken Thighs", "Roman Chicken Sauté with Artichokes",
       "Chicken Saltimbocca", "Meyer Lemon Spound Cake", "Strawberry Country Cake", "Angel Food Cake", "Whiskey Fudge Cake", "Plum Upside Down Cake", "Dark Cherry Bundt Cake",
       "Magrut (Kaffir) Lime Leaf Cake With Garden Flowers", "Chocolate Spider Cake With Caramel-Coffee Mousse", "Pink Lemonade Layer Cake",
       "Mini OREO Surprise Cupcakes", "Mushroom Pie", "Apple Pie", "Farmhouse Apple Pie", "Pasta Primavera", "Spicy Garlic-Chili Oil with Pasta",
       "Caprese Chicken Pesto Pasta", "Multi-Grain Pasta with Lamb, Butternut Squash, and Kasseri Cheese", "Bowtie Pasta with Asparagus"


       ]
that took a while
hollow sentinel
now watch one of them have the word "recipe" in it
stoic viper
tehre is no recipe
hollow sentinel
ok now
stoic viper

#first dataframe
data = [10,20,30,40,50]

df = pd.dataframe(data, columns=['Car Number']

#second dataframe
data = [[10, 250], [30, 400], [40, 250]]

df = pd.dataframe(data, columns=['Car Number', 'Kilometers'}


#this is how it should look after assigning the values
data = [[10, 250], [20,NaN], [30, 400], [40, 250], [50, Nan]]
df = pd.dataframe(data, columns=['Car Number', 'Kilometers']
I could do it manually, but i would go crazy. i have over 300
stoic viper
haha
in real life its bus line numbers
and i have to assign the km they drive
and the time.
wait that works-
let me try
hollow sentinel
how do i pass the food items into the api request?
using some kind of for loop?
bc i'm stumped
arctic wedgeBOT
@charred egret :white_check_mark: Your eval job has completed with return code 0.
001 |    Car Number  Kilometers
002 | 0          10       250.0
003 | 1          20         NaN
004 | 2          30       400.0
005 | 3          40       250.0
006 | 4          50         NaN
yeah idk
stoic viper
Super danke. Hat funktioniert ❤️
duplicates are nto a problem
i already fixed that beforehand
hollow sentinel
i am confusion
maybe a list comprehension would work?
some kind of for loop idk
i could do it manually but that's going to take forever
hollow sentinel
yep i am stuck
so i have just been doing it manuually
hell of a time
espeeccially bc the api doesn't recognize half of these fucking foods
safe to say this is not fun

that took SO long
was there a way i could've automated this?
wooden sail
what were you doing?
hollow sentinel
making api calls
i had to click a button 50 times for each food
and get nutrition facts

i just didn't know how to make multiple api calls at once
and couldn't find it when i searched for it
wooden sail
but you could do a single one automatically?
hollow sentinel
yes
wooden sail
you could've used asyncio or multiprocessing
hollow sentinel
what's that for future referencce
wooden sail
parallelization
though i don't see what the problem would've been with sequentially doing calls here
hollow sentinel
Edamam - API developer portal for Nutrition Analysis, Food Database Lookup, Recipe Search API and others. Check out the Documentation for Nutrition Analysis API.
but it was 50 different calls
it took forever ngl
unless i used the wrong api?
idek
oh i am such a fucking IDIOT
whale
!pastebin
arctic wedgeBOT
Pasting large amounts of code
If your code is too long to fit in a codeblock in discord, you can paste your code here:
https://paste.pythondiscord.com/
After pasting your code, save it by clicking the floppy disk icon in the top right, or by typing ctrl + S. After doing that, the URL should change. Copy the URL and post it here so others can see it.
hollow sentinel
 nova rampart
Probably a pretty broad question. But here goes. I want to learn how to do "ETL" with apache spark. I have a large database and I want to create a datawarehouse from it. How do I begin to learn to do that and what the best practices are?
serene scaffold
 mint palm
is data mining and data preprocessing almost similar
mint palm
is data mining and data preprocessing almost similar
preprocessing is preparing data for some subsequent step in your process. often, it will involve preparing data for input into a model.
whereas data mining is an informal term for "getting something from lots of data".
mint palm
so preprocessing can be a sub process of data mining.
in data science atleast i think?
serene scaffold
I wouldn't even try to put "data mining" and "preprocessing" in some conceptual hierarchy.
also, "data preprocessing" isn't a separate thing from "preprocessing". in the context of data science, anything that you'd "preprocess" is data.
mint palm
got it
serene scaffold
data science is really hyped, and a lot of people are trying to coin terms for things
mint palm
yess, i saw a classification, and it made sense only for small portion of types of approaches to DS problems
 sinful surge
Hi, can someone explain to me why my model is outputting float numbers (sometimes > 1) when it is supposed to output 1 or 0? My model is supposed to tell me whether my picture is of a cat or a dog. For example, it outputs [1.] for one of my dog pictures, but [1.4508298e-29] for a cat picture. Thanks. **(cat = 0, dog = 1)
serene scaffold
sinful surge
Hi, can someone explain to me why my model is outputting float numbers (sometime...
we'd have to know what your model architecture is to comment. but if you set everything up correctly, it probably means that your model is treating cat vs dog as a spectrum, and it's telling you how close it is to being a cat vs a dog
meaning that it would be your job to round to the closest integer.
however, 1.4508298e-29 is exceptionally close to zero
sinful surge
serene scaffold
we'd have to know what your model architecture is to comment. but if you set eve...
Ooooh
1/1 [==============================] - 3s 3s/step
[1.]
1/1 [==============================] - 0s 14ms/step
[1.4508298e-29]
1/1 [==============================] - 0s 14ms/step
[1.1843214e-06]
1/1 [==============================] - 0s 14ms/step
[1.663139e-27]
1/1 [==============================] - 0s 14ms/step
[1.9103793e-13]
They all are close to one or close to zero
serene scaffold
sinful surge
1/1 [==============================] - 3s 3s/step
[1.]
1/1 [====================...
what library are you using? keras?
sinful surge
Yeah
serene scaffold
how many training instances do you have?
sinful surge
serene scaffold
how many training instances do you have?
Sorry I'm new to this, could you clarify what that means?
serene scaffold
sinful surge
Sorry I'm new to this, could you clarify what that means?
when you do machine learning, you're "training" the model to do something based on examples. and those examples are training instances.
serene scaffold
!paste
arctic wedgeBOT
Pasting large amounts of code
If your code is too long to fit in a codeblock in discord, you can paste your code here:
https://paste.pythondiscord.com/
After pasting your code, save it by clicking the floppy disk icon in the top right, or by typing ctrl + S. After doing that, the URL should change. Copy the URL and post it here so others can see it.
serene scaffold
can you show the code?
sinful surge
serene scaffold
can you show the code?
Update: Just by rounding, it gives me the correct values...
steady basalt
Why does everyone want a “analyst” and not a data scientist aaaaaaa
“Analyst” is literally project manager or some shit
Has there been massive skill inflation or has the bar for being a data scientist raised
How can any one human have all the skills and knowledge?
Especially early career
mint palm
while filling a form i am being about my "GPU programming experience" and my "cloud programming experience"?
for the gpu... i am actually using cuda for parallel processing, and i know its for speed...
is it something else about gpu programming experience they might wanna hear and i dont know?
for the cloud.... part i know but havent used it.....i only know that you train over some cloud gpu/resource
do they wanna ask same?
its a form for ML research
steady basalt
misty flint
and has grown even more
And pays even less
In the Uk it pays peanuts
Like, 34-45k
misty flint
ok ?
 fathom lark
What modules are used for data science and ai?
serene scaffold
fathom lark
What modules are used for data science and ai?
I have a message going over that in the pins. But just learning how to use the various libraries won't make you better at data science.
misty flint
serene scaffold
I have a message going over that in the pins. But just learning how to use the v...
you know i just realized this channel probably has some of the better pins
compared to the rest

but maybe i am biased
serene scaffold
all the pins before 2021 were pinned by not me
I pinned all the ones from 2021 onward
misty flint
hmm hmm
i think it shows

jk
i mean raggy's links are ok
but kinda niche
less broad in scope
this is pretty nifty

Google Research
PAIR is an initiative devoted to advancing the research and design of people-centric AI systems.
like
especially the content here

A toolkit for teams building human-centered AI products.
 rain temple
Is anyone familiar with Facebook Prophet for time series modelling?
Even though the column names for t_prophet are ["ds", "y"], I am still getting this error. Can anyone please explain what I am doing wrong. Thx
 hollow sentinel
# Split-out validation dataset
X = cleaned_food_data.drop(["calories"], axis =1)
Y = cleaned_food_data["calories"]
validation_size = 0.20
seed = 7
X_train, X_validation, Y_train, Y_validation = train_test_split(X, Y,
    test_size=validation_size, random_state=seed)

# Test options and evaluation metric
num_folds = 10
seed = 7
scoring = 'neg_mean_squared_error'

# Spot-Check Algorithms
models = []
models.append(('LR', LinearRegression()))
models.append(('LASSO', Lasso()))
models.append(('EN', ElasticNet()))
models.append(('KNN', KNeighborsRegressor()))
models.append(('CART', DecisionTreeRegressor()))
models.append(('SVR', SVR()))

# evaluate each model in turn
results = []
names = []
for name, model in models:
  kfold = KFold(n_splits=num_folds, random_state=seed, shuffle = True)
  cv_results = cross_val_score(model, X_train, Y_train, cv=kfold, scoring=scoring)
  results.append(cv_results)
  names.append(name)
  msg = "%s: %f (%f)" % (name, cv_results.mean(), cv_results.std())
  print(msg)

LR: -7143.747771 (8542.811408)
LASSO: -7303.020692 (8972.311573)
EN: -8147.680217 (11005.538611)
KNN: -58483.693667 (64512.137690)
CART: -18451.658333 (23321.927270)
SVR: -68864.873572 (66028.873698)
LMAO
well now we can conclude that there is absolutely no way to predict calories from calcium, cholesterol, fat, iron, fiber, potassium, magnesium, sodium, protein, sugar, and vitamin C
serene scaffold
hollow sentinel
```python
# Split-out validation dataset
X = cleaned_food_data.drop(["calories"...
# Spot-Check Algorithms
models = []
models.append(('LR', LinearRegression()))
models.append(('LASSO', Lasso()))
models.append(('EN', ElasticNet()))
models.append(('KNN', KNeighborsRegressor()))
models.append(('CART', DecisionTreeRegressor()))
models.append(('SVR', SVR()))
this could be a list literal.
 supple wyvern
why does everyone use notebooks instead of IDE for all AI related stuff?
serene scaffold
supple wyvern
why does everyone use notebooks instead of IDE for all AI related stuff?
because """"visualization"""", idk. I think notebooks are criminally overused.
agile cobalt
supple wyvern
why does everyone use notebooks instead of IDE for all AI related stuff?
quick prototyping, but there are a bunch of people that like IPython or similar better
supple wyvern
so there's nothing wrong with using an ide?
serene scaffold
supple wyvern
so there's nothing wrong with using an ide?
no. and some IDEs have notebook integration
supple wyvern
ok, thanks... Imma just use IDE, notebooks look more confusing lol
serene scaffold
notebooks and IDEs aren't different kinds of the same thing. notebooks are a different way of writing code than flat files.
agile cobalt
the main advantages of Jupyer I can think of rn are:
- re-running everything to change a few parameters and re-run parts of the code
- you can document the code very well through Markdown cells
- you can save the run results to present later
1 can be done with any IPython or even just normal interpreter stuff
2 can be done via docstrings and comments, though not as fancily
3 is mostly jupyter exclusive depending on which libraries you're using, but you can always make a powerpoint with saved graphs
serene scaffold
supple wyvern
ok, thanks... Imma just use IDE, notebooks look more confusing lol
I find notebooks cumbersome and annoying, so I only use them in very narrow circumstances.
and this is a bias of mine, but when I encounter code written by "notebook natives", I find it very difficult (and sometimes impossible) to productionize.
hollow sentinel
serene scaffold
```py
# Spot-Check Algorithms
models = []
models.append(('LR', LinearRegression(...
a what
serene scaffold
hollow sentinel
a what
models = [
    ('LR', LinearRegression()),
    ('LASSO', Lasso()),
    ('EN', ElasticNet()),
    ...
]
Python is not Java. You don't have to create empty data structures and use methods to populate them.
hollow sentinel
serene scaffold
```py
models = [
('LR', LinearRegression()),
('LASSO', Lasso()),
('E...
ohh, i see
misty flint
serene scaffold
and this is a bias of mine, but when I encounter code written by "notebook nativ...
i think DS need to be able to work with both notebooks and an IDE. the former for quick experiments, the latter to package their code and model for production.
didnt think i would say this
but highly recommend docker to help with this

misty flint
that being said, vscode has jupyter integrations btw
misty flint
hollow sentinel
maybe next project?
tbh you might be able to work with it if you go for that internship
i havent used it seriously until this most recent work project

serene scaffold
misty flint
but highly recommend docker to help with this
All my projects involve docker in some way. But something being packaged up into docker doesn't mean the python code can be understood by anyone who might need to understand it in the future
misty flint
that is also true
clean code + good documentation goes a long way
something i heard recently is that a well-written function in python (in many cases) should never be more than 5-8 lines
there was another recommendation for class length but i forgot already

anyway these ramblings of mine are mostly for the lurkers in the chat or those that backread (stel already knows all this and more...he should be teaching me...jk). anyway peeps, keep these concepts in the back of your mind during your learning journey 
i will sleep now. gn 
 lapis sequoia
Hi, is there any resource that goes in depth on the convergence properties of reinforcement algorithms
 tropic matrix
I'm training a DNN machine learning model in tensorflow keras on a dataset with over 22 million rows of data and around 4400 columns, so I'm using a Data Generator (keras.utils.Sequence) in order to not run out of memory. however, i'm finding that the GPU i'm using is only under around 20-40% utilization, and the CPU 100% utilization, and I believe this is slowing down my training. Is there a way to increase GPU usage without increasing batch size in order to speed up training? anything else I can do to speed it up?
I'm using a batch size of 1024, image is the specs for the machine

 tacit basin
tropic matrix
I'm training a DNN machine learning model in tensorflow keras on a dataset with ...
tacit basin
tropic matrix
I'm training a DNN machine learning model in tensorflow keras on a dataset with ...
Seems the bottleneck is CPU. Get machine with faster CPU or optimize data pipeline
tropic matrix
tacit basin
Seems the bottleneck is CPU. Get machine with faster CPU or optimize data pipeli...
how would i go optimizing the data pipeline?
tacit basin
What do you do with data before putting it on GPU?
tropic matrix
tacit basin
What do you do with data before putting it on GPU?
i'm not sure what you mean by that, but i'll send over the code for the data generator:
class DataGenerator(keras.utils.Sequence):
    'Generates data for Keras'
    def __init__(self, list_IDs, col_len, batch_size=1024, shuffle=True):
        'Initialization'
        self.col_len = col_len
        self.batch_size = batch_size
        self.list_IDs = list_IDs
        self.shuffle = shuffle
        self.on_epoch_end()

    def __len__(self):
        'Denotes the number of batches per epoch'
        return int(np.floor(len(self.list_IDs) / self.batch_size))

    def __getitem__(self, index):
        'Generate one batch of data'
        # Generate indexes of the batch
        indexes = self.indexes[index*self.batch_size:(index+1)*self.batch_size]

        # Find list of IDs
        list_IDs_temp = [self.list_IDs[k] for k in indexes]

        # Generate data
        X, y = self.__data_generation(list_IDs_temp)

        return X, y

    def on_epoch_end(self):
        'Updates indexes after each epoch'
        self.indexes = np.arange(len(self.list_IDs))
        if self.shuffle == True:
            np.random.shuffle(self.indexes)

    def __data_generation(self, list_IDs_temp):
        'Generates data containing batch_size samples' # X : (n_samples, *dim, n_channels)
        # Initialization
        X = np.empty((self.batch_size, self.col_len))
        y = np.empty((self.batch_size))

        # Generate data
        uuid_list = []
        for ID in list_IDs_temp:
            uuid_list.append(ID)

        df = pd.read_sql_query(f'SELECT * FROM public.auctions WHERE uuid IN {tuple(uuid_list)}', con=conn)
        X, y = preprocess_data(df, scaler_X, scaler_y, ability_scroll_mlb, df_columns, verbose=False)

        return X, y
basically the only points where i could see an issue with speed would be in the preprocessing step, but that takes less than a second at the batch sizes i'm using, same with reading the data from the sql database
and i just have this code for training:
callbacks = [
    keras.callbacks.EarlyStopping(monitor='val_loss', min_delta=0, patience=4, verbose=1, mode='auto'),
    keras.callbacks.ReduceLROnPlateau(monitor='val_loss', factor=0.1, patience=2, verbose=1),
    keras.callbacks.ModelCheckpoint(filepath='model.h5', verbose=1, save_best_only=True, save_weights_only=True),
]

model = dnn_model_builder()
model.fit(
    train_gen,
    batch_size=BATCH_SIZE,
    epochs=200,
    callbacks=callbacks,
    validation_data=val_gen,
    verbose=1
)
train_gen and val_gen are both the same generator code just with a different section of the database
tacit basin
What's train_gen
tropic matrix
tropic matrix
i'm not sure what you mean by that, but i'll send over the code for the data gen...
@tacit basin train_gen is the code block i'm replying to
BATCH_SIZE = 1024

train_gen = DataGenerator(train_ids, col_len, BATCH_SIZE)
val_gen = DataGenerator(val_ids, col_len, BATCH_SIZE)
test_gen = DataGenerator(test_ids, col_len, BATCH_SIZE)
col_len = number of columns
oops wait i just realized i don't need that but that's minor
tacit basin
What does DataGenerator do? I don't use Keras ..
Oh i see
What takes most time ? Can SQL query and preprocess be done upfront?
Assuming this takes most time ...
little spear
Hi guys
i have this createdAt date value in mongodb 2021-12-16T13:15:42.385+00:00
and i want this value in timestamp so i can do this with js like this.
new Date('2021-12-16T13:15:42.385+00:00').getTime()
1639660542385
how can i do this same thing with python?
i have this date object value in each rows of dataframe and i want to convert it in milliseconns
can someone help me with that?
 tranquil sage
Why my Training classification report is not displayed properly?
I cloned the code from https://github.com/uvipen/Very-deep-cnn-pytorch/blob/master/src/utils.py
Added this to utils.py
y_pred = np.argmax(y_prob, -1)
print(classification_report(y_true, y_pred)) ```
And inserted both lines of codes at the end of `train.py`
`generate_report(label.cpu().numpy(), predictions.cpu().detach().numpy()) `
`generate_report(te_label, te_pred.numpy())`
Above is training report. Bottom is testing report.
the actual support for training should be 7308. But it only shows 12. little spear
okay bro thank you, i will check that. now i did that with the mongodb aggregation. 🙂
 unique flame
tranquil sage
Why my Training classification report is not displayed properly?
I cloned the co...
unique flame
tranquil sage
Why my Training classification report is not displayed properly?
I cloned the co...
I would look what label.cpu().numpy() and predictions.cpu().detach().numpy() do, because right now it tells me there are only six classes. Horrible numbers btw
tranquil sage
    num_iter_per_epoch = len(training_generator)

    for epoch in range(opt.num_epochs):

        for iter, batch in enumerate(training_generator):
            feature, label = batch
            if torch.cuda.is_available():
                feature = feature.cuda()
                label = label.cuda()
            optimizer.zero_grad()
            predictions = model(feature)
            loss = criterion(predictions, label)
            loss.backward()
            optimizer.step()
generate_report(label.cpu().numpy(), predictions.cpu().detach().numpy()) ```---------------------------------------------------------------------------
AttributeError Traceback (most recent call last)
<ipython-input-11-d5151920f7c6> in <module>()
1 import requests
----> 2 import pandas as pd
5 frames
/usr/local/lib/python3.7/dist-packages/pandas/core/frame.py in DataFrame()
10563 # ----------------------------------------------------------------------
10564 # Add plotting methods to DataFrame
> 10565 plot = CachedAccessor("plot", pandas.plotting.PlotAccessor)
10566 hist = pandas.plotting.hist_frame
10567 boxplot = pandas.plotting.boxplot_frame
AttributeError: module 'pandas' has no attribute 'plotting'
import pandas as pd
???
idek what i did wrong here
oh nvm we're fine

i'm confused on how to format the url
why am i always so lost with formatting api URLs

i have thiis
it gives me a 403
tropic matrix
tacit basin
What takes most time ? Can SQL query and preprocess be done upfront?
no, as that will lead to running out of memory, hence the reason for me to use a data generator
 ocean swallow
is there a more elegant way to combine multiple features for input
for example for youtube I just vectorize titles with some embeddings + num views + num subs and concatenate them
and try to predict views for example a week forward
wooden sail
"elegant" how?
ocean swallow
more elegant then just concatenating
I don't know if it works at all tbh
for my dataset
wooden sail
since the bread and butter of ML is to compose linear functions followed by nonlinear ones, you could represent the linear transformation acting on the data in any way you like, as long as it satisfies the properties of linear transformations
HOWEVER
if you're working with linear transformations on a finite dimensional space, then this is anyway equivalent to concatenating the parameters and applying some matrix to them
you can change how it looks if you like, but it's the same thing 😛
ocean swallow
alright I see thanks 🙂
hollow sentinel
fucking APIs man
some of the doc for this stuff is gibberish to me
i think there's a format for this stuff
hang on
like this is for coinmarket
 echo vigil
How is the color scale is SHAP summary plots determined? Is the low / high set by the min / max or percentiles in the data?
agile cobalt
hard to tell without knowing how they were generated / in what you want to put them as new columns, but perhaps look up pandas transform / pandas groupby transform if you do not know how it works
wooden sail
hmm quick question. say i have a handful of different functions with the same domain and codomain. how do you prefer seeing their definition when reading a paper?
.latex $f,g,h: \mathbb{R} \times \mathbb{R}^n \to \mathbb{R}$ or $f: \mathbb{R} \times \mathbb{R}^n \to \mathbb{R}, g: \mathbb{R} \times \mathbb{R}^n \to \mathbb{R}, \cdots$
 strange elbowBOT

 autumn mountain
Hey everyone, do you know how to fit such a curve on a scatterplot ? The curve I'd like to be able to form (with an initial value, a peak at around 90 days, then approx 8% monthly decay, from dairy cows):

Tried doing something similar with seaborn and get something not respecting that wanted shape of peak then slow decay. I guess the polynom behind must be specified ?
my crappy data:

created using regplot of order 5
sns.regplot(x='DEL', y='LE', data=df_analisis[(df_analisis['LA']==3)&(df_analisis['DEL']<305)], order=5)
any tip welcome, sorry for the spam
 warm valve
Hello, can someone correct me please ? It’s Bayesian networks
 warm valve
misty flint
shrinking python libraries is a pain
warm valve
misty flint
shrinking python libraries is a pain
I didn’t understand ?
misty flint
im talking to myself
pip installs the entire library only right? theres not a way to only install certain parts of the library?
wooden sail
copy paste the needed components from the original repo?
serene scaffold
misty flint
pip installs the entire library only right? theres not a way to only install cer...
you know how there's stuff like pip install thing[cuda]?
 hollow sentinel
misty flint
shrinking python libraries is a pain
hollow sentinel
misty flint
shrinking python libraries is a pain
api is pain
i don't understand why my brain cannot grasp a GET request
misty flint
i saw those options and am wondering if it will be sufficient
hollow sentinel
i have a really dumb question
hollow sentinel
do endpoints for an api request go at the end?
or is it called an endpoint bc it's data for a specific category?
misty flint
hmm api endpoints are the location where you call the api i think
hollow sentinel
like take this url for example
the endpoint goes at the end
/v1/cryptocurrency/map
idk
"Public endpoints, such as the list of exercises or the ingredients can be accessed without authentication. For user owned objects such as workouts, you need to generate an API KEY and pass it in the header, see the link on the sidebar for details."
where is the link on the sidebar?
the world may never know
actually i seee it
import requests
import pandas
import pprint
import json

url = "https://wger.de/api/v2/meal/"
api_key = "um"
# response = requests.get(url)

# data = response.json()

# pprint.pprint(data)

data = {"key": "value"}

headers = {"Accept": 'application/json', "Authorization": api_key}

r = requests.patch(url=url, data=data, headers=headers)

print(r)

r.content

pprint.pprint(json.loads(r.content))
i took the code off their website and it won't work
misty flint
hollow sentinel
the endpoint goes at the end
oh hey that makes sense
maybe thats why they call it that
hollow sentinel
idk what's wrong with this
the code is under "Tools"
what am i missing here?
misty flint
whats your ide
misty flint
thats why
hollow sentinel
really?
misty flint
 hollow sentinel
it gives a 403 in thonny too
hollow sentinel
" The HTTP 403 Forbidden response status code indicates that the server understands the request but refuses to authorize it."
misty flint
so you were able to connect to it
you just dont have access to that specific resource
hollow sentinel
bc it's a private endpoint?
misty flint
dunno bud
hollow sentinel
welel
it might be bc of that
bc i don't see anything in the documentation talking about
stuff like connecting to private endpoints
why didn't they fucking specify that?
why give a list of private endpoints but then never bother to say oh yeah whoopsie you can't access those
there needs to be better api doc
<Response [405]>
---------------------------------------------------------------------------
TypeError                                 Traceback (most recent call last)
<ipython-input-17-29374e2e3637> in <module>()
     22 r.content
     23
---> 24 pprint(json.loads(r.content))

TypeError: 'module' object is not callable
i get a response 405
"The HyperText Transfer Protocol (HTTP) 405 Method Not Allowed response status code indicates that the server knows the request method, but the target resource doesn't support this method.May 13, 2022"
misty flint
hollow sentinel
there needs to be better api doc
Public endpoints, such as the list of exercises or the ingredients can be accessed without authentication. For user owned objects such as workouts, you need to generate an API KEY and pass it in the header, see the link on the sidebar for details.
hollow sentinel
yeah i saw that
misty flint
did you see melio's comment
hollow sentinel
import requests
import pandas
import pprint
import json

url = "https://wger.de/api/v2/meal/"
api_key = "x"
# response = requests.get(url)

# data = response.json()

# pprint.pprint(data)

data = {"key": "value"}

headers = {"Authorization": f"Token {api_key}"}

r = requests.patch(url=url, data=data, headers=headers)

print(r)

r.content
wait hang on can't show my api key
hollow sentinel
just imagine it's there lol
misty flint
whats the error now
misty flint
try requests.get
hollow sentinel
<Response [200]>
hollow sentinel
and my data is
...
{'count': 0, 'next': None, 'previous': None, 'results': []}
💀
ah yes scrumptious data this will be a very interesting project
misty flint
well i mean you havent used this app right? so ofc it wouldnt have your data
hey at least now you know how to call APIs

hollow sentinel
by copy pasting
yes
i'll keep doing these
until i find a more interesting projct
hollow sentinel
misty flint
~~hey thats how you do it~~
Find the documentation you need to get your BreezoMeter API up and running in no time. Easily create BreezoMeter API calls with our easy guides!
yo that's some nice doc
misty flint
The Pollen API lets you request pollen information including types, plants, and indexes for a specific location. The API provides endpoints that let you query:
oh hey thats pretty cool
especially if you have bad allergies
could be interesting dataset to play with
hollow sentinel
i have awful ones
misty flint
really? i havent used it a while and i heard theyve restricted it since
oof
so i guess they have
oh noice
i mean what do you want to do bud
i think we talked last time about word clouds of most frequent words
and you could probably do some basic sentiment analysis too
ah
NLTK has a built-in sentiment analysis pre-trained one

In this tutorial, you'll learn how to work with Python's Natural Language Toolkit (NLTK) to process and analyze text. You'll also learn how to perform sentiment analysis with built-in as well as custom classifiers!
i think i only know this bc my friend used it for our project
and it performed pretty well
for basic sentiment analysis
so i think its probably worth giving it a shot and see how your data works with it
hollow sentinel
at this point i put everything on github
i now have 6 repos
i had like zero two months ago
💀
misty flint
hollow sentinel
💀
nice dude. did you end up making that readme yet
hollow sentinel
misty flint
nice dude. did you end up making that readme yet
for which one
misty flint
for github profiles, you can make a readme JUST for your profile
and i highly recommend that
misty flint
as it serves as a mini-landing page
hollow sentinel
i'll do it today
hollow sentinel
much appreciated
misty flint

hollow sentinel
oh guys if you wanna look at more apis i found a website
for free ones
hang on

Public APIs
A collection of public APIs for developers, categorized and crowdsourced. Over 1000 different APIs to power your project.
agreed
hollow sentinel
import requests
import pandas as pd
import pprint
import json


latitude = 0
longitude = 180
days = 5
my_api_key = "x"
url = "https://api.breezometer.com/pollen/v2/forecast/daily?lat={latitude}&lon={longitude}&key=YOUR_API_KEY&features={Features_List}&days={Number_of_Days}"

r = requests.get(url)

data = r.json()

print(data)
hello darkness my old friend
oh shit
I CAUGHT MY ERROR
no i didn't 😦
Find the documentation you need to get your BreezoMeter API up and running in no time. Easily create BreezoMeter API calls with our easy guides!
i was going off this
hollow sentinel
misty flint
oh hey that makes sense
Calling the base URL alone isn’t a lot of fun, but that’s where endpoints come in handy. An endpoint is a part of the URL that specifies what resource you want to fetch. Well-documented APIs usually contain an API reference, which is extremely useful for knowing the exact endpoints and resources an API has and how to use them.
so the endpoint is the end
mind blown
 velvet rampart
Could anyone please help me with this

 cold saddle
I have been using Prophet for time series forecast and love it. However I want to start forecasting sales and predicting with variables. I was thinking multiple regression is what I want. Is sci kit learn a good place to start?
I have a minitab license but I would rather not chain myself to something proprietary and expensive
mint palm
how important are DL dedicated GPUs?? from research point of view?? i havent came across training set that could hugely waste my time on normal GPU.
is it just google brain etc type of research where billions of data need big GPUs?
 jovial cedar
I want to make a ai assistant like Alexa what is the best speak analyzer api
misty flint
one of my favorite ML Engineers just released this, and it was a very good read as it gave a good overview of the current state of Speech AI https://developer.nvidia.com/blog/an-easy-introduction-to-speech-ai/

A simple introduction to speech AI technology, use cases, and benefits for practitioners.

from the technical blog:
 jovial cedar
misty flint
one of my favorite ML Engineers just released this, and it was a very good read ...
jovial cedar
misty flint
one of my favorite ML Engineers just released this, and it was a very good read ...
Ok I'll look into it
Thanks
ocean swallow
Can somebody help me with youtube titles? I want to predict views from titles and number of subs of a video but don't know how to implement an embedding for it
serene scaffold
ocean swallow
Can somebody help me with youtube titles? I want to predict views from titles an...
were you planning to train your own vectors, or what?
ocean swallow
serene scaffold
were you planning to train your own vectors, or what?
I am actually not sure. I was initially going to be using word2vec trained on newspaper articles, but some places suggest to train the embedding model along with the main model
serene scaffold
ocean swallow
I am actually not sure. I was initially going to be using word2vec trained on ne...
I would just use an existing set of vectors, and use them as inputs for the classifier, along with the subscription count.
if you want to make it even simpler, you could pick like, ten words that you associate with clickbait videos, and see if the presence of those words can be used to predict the views.


 charred light
If I have 3 independent vars: Total Population, Female Population, Male Population. Is it better if I drop total population and convert the Female/Male to a percentage or leave as raw values in linear regression?
wooden sail
you could drop any of the 3 variables and it would work ok. as for the percentages part, it might help in the conditioning, yeah
dusk tide
How to be an intern in ML in Nvidia ??
tacit basin
dusk tide
How to be an intern in ML in Nvidia ??

NVIDIA
Do real work, on real projects, side-by-side with some of the industry’s brightest minds.
wheat snow

i got data

and wanna plot something like that
i thoughtabout using .groupby for that
 tidal bough
calculate a "day of week" column from the date, then groupby by it and take the mean, yeah
wheat snow
tidal bough
calculate a "day of week" column from the date, then groupby by it and take the ...
ah so you say i gotta add 7 new columns?
tidal bough
no, one.
wheat snow
hmm
tidal bough
like, equal to Monday if the date is a monday, and so on
wheat snow
def User_habits_1(Username): # Average time of watching per day of week


    user= df_vd[ (df_vd['Profile Name']== Username) ].copy()

    user['Weekday']= user['Duration'].dt.weekday.copy()
this is what i got so far
first i gotta filter to one name
one user in the netflix account
tidal bough
ah, you already did it I see
you just need to groupby by that column then, and take the means of each group
wheat snow
but the duration has to be in a timedelta to work for it right?
tidal bough
No? Timedeltas don't have a weekday, datetimes do. What weekday is "5 minutes", say? 🙂
ah, I see what you're asking
yeah, your code isn't quite right - it's the start time you must determine the weekday by, not the duration.
wheat snow
tidal bough
No? Timedeltas don't have a weekday, datetimes do. What weekday is "5 minutes", ...
ef User_habits_1(Username): # Average time of watching per day of week


    user= df_vd[ (df_vd['Profile Name']== Username) ].copy()
    print(user.dtypes())
```print(user.dtypes())
TypeError: 'Series' object is not callablei cant even check the dtype
tidal bough
it's saying user.dtypes is a Series, so not callable. it's an attribute, not a method
wheat snow
so how do i check the dtypoe then
tidal bough
user.dtypes
wheat snow
Duration timedelta64[ns]
but for that to work with i gotta transform that to an integer righT?
Start Time datetime64[ns, Europe/Berlin]
but that can stay.
tidal bough
but for that to work with i gotta transform that to an integer righT?
I'd guess that pandas can take a mean of timedeltas just fine; I don't see why it wouldn't.
wheat snow
tidal bough
> but for that to work with i gotta transform that to an integer righT?
I'd gues...
trueee
user= df_vd[ (df_vd['Profile Name']== Username) ].copy()
    print(user.dtypes)
    user['Weekday']= user['Start Time'].dt.weekday.copy()
    data=user['Start Time'].groupby(user['Duration']). mean()

    print(data)
``` okay now this gives me every duration and start time now i gotta limit it to a specific time (every monday) @tidal boughdata=user['Start Time'].groupby(user['Duration']). mean()
you're groupbying start times by duration. Instead, groupby durations by weekday.
 warm hound
I have a captcha here which is relatively complicated:
https://i.stack.imgur.com/X6Uxx.png
Is there any libraries that everyone knows that could be useful?
 lapis sequoia
Anyone know about a guide with appium with ml ?
steady basalt
warm hound
I have a captcha here which is relatively complicated:
https://i.stack.imgur.co...
Cv
 hasty grail
warm hound
I have a captcha here which is relatively complicated:
https://i.stack.imgur.co...
hasty grail
warm hound
I have a captcha here which is relatively complicated:
https://i.stack.imgur.co...
Sorry, but since bypassing captchas may break TOS, you are not allowed to seek help on that on this server
nova rampart
I'm having trouble understanding spark data streaming? What is it exactly? From what I understand spark data streaming is running some code or process everytime a source is updated with new data. So if a new row is added to the database spark will do something to that row and wait for the next row.
Is that right?
misty flint
nova rampart
Is that right?
are you talking about streaming/real-time data in general? because the concept you are describing is more along the lines of the concept: Change Data Capture
unless you are talking about Spark Streaming itself https://databricks.com/glossary/what-is-spark-streaming
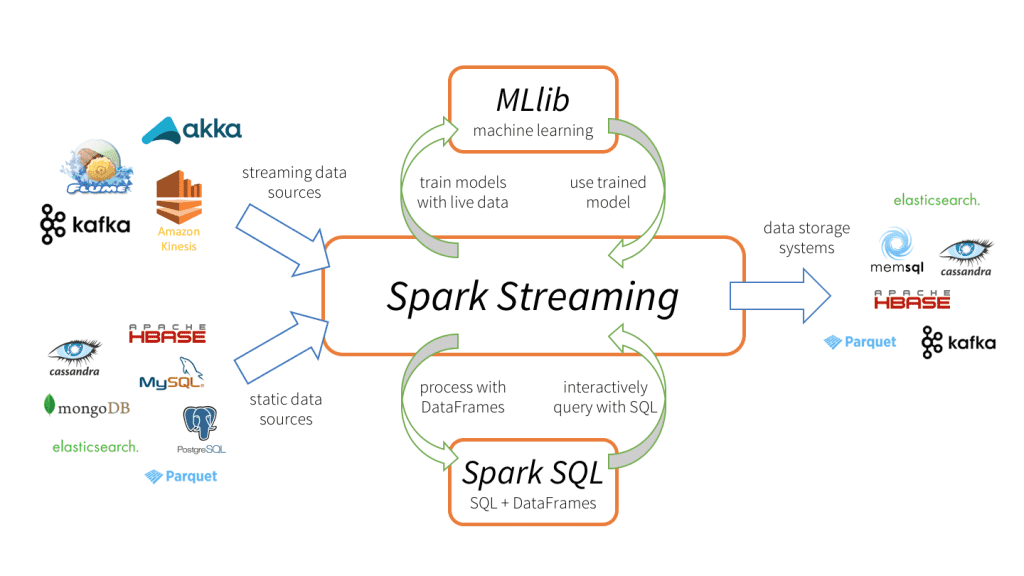
Databricks
Apache Spark Streaming is a scalable fault-tolerant streaming processing system that natively supports both batch and streaming workloads.
tropic matrix
what cloud provider provides the best price for A100 gpus?
serene scaffold
I would only bother learning all that apache stuff if your job uses it. there are employers who would like for you to have apache experience before offering you a job, but I'm not sure how you'd get non-trivial experience working with apache unless you had data to populate it with
I'm on a project where we were going to use apache/spark, but we ended up using dask 😎
tacit basin
tropic matrix
what cloud provider provides the best price for A100 gpus?
Check Jarvislabs.ai
tropic matrix
tacit basin
Check Jarvislabs.ai
i just did, seems like the pricing isn't as good as something like lambda
especially since it's limited to 60% capacity
jovial cedar
misty flint
oh it wasnt for your question
Oh that's awkward but it works for what I need so
misty flint
serene scaffold
I'm on a project where we were going to use apache/spark, but we ended up using ...
oh hey i ended up using dask over pyspark as well (but for a class project)
i like that it has similar syntax to pandas
what Stel said. learning some cloud would probs be a better investment since that would be a valuable skill in any data or software role
(imo)
serene scaffold
misty flint
i like that it has similar syntax to pandas
libraries don't have syntax, they have an API 😠
misty flint
serene scaffold
libraries don't have syntax, they have an API 😠
oops
i thought about saying that and then i remembered incorrectly

serene scaffold
misty flint
guess it depends on which route you want to go after graduation
btw if you do end up needing dask, i recommend the docs + this https://github.com/dgerlanc/dask-scaling-dataframe/blob/main/01-10-minutes-to-dask.ipynb

GitHub
Python and Dask: Scaling the Dataframe. Contribute to dgerlanc/dask-scaling-dataframe development by creating an account on GitHub.
hollow sentinel
import requests
import pprint

# Change this to be your API key
MY_API_KEY="x"

url = "https://beta3.api.climatiq.io/search"
query="grid mix"


query_params = {
    # Free text query can be writen as the "query" parameter
    "query": query,
    # You can also filter on region, year, source and more
    # "AU" is Australia
    "region": "AU"
}


# You must always specify your AUTH token in the "Authorization" header like this.
authorization_headers = {"Authorization": f"Bearer: {MY_API_KEY}"}


# This performs the request and returns the result as JSON
response = requests.get(url, params=query_params, headers=authorization_headers).json()

# And here you can do whatever you want with the results
data = response.json()
  File "/Users/myname/Desktop/climate data analysis project/climate analysis project.py", line 30, in <module>
    data = response.json()
AttributeError: 'dict' object has no attribute 'json'
oh shit
i know why i'm getting that error
the doc already called json() on it
nova rampart
misty flint
unless you are talking about Spark Streaming itself https://databricks.com/gloss...
Yeah that is exactly what I’m trying to figure out. Spark data streaming
Basically I’m trying to make my first data warehouse. I can design databases and put them on AWS but I have no idea where to begin to make a data warehouse
Or specifically what a data warehouse is because it just sounds like a database
Or this one is my favourite data lake
Like who comes up with these terms my dude
misty flint
sigh this is why i recommend all DS picking up the bare minimum of Data Engineering skills.
learn the concepts and not just the tools. inmon data warehousing vs. kimball data warehousing and star schema. there are specific use cases for these (i.e. analytical tasks, including machine learning) as well as an extensive body of literature.
data lakes should be used more as a staging area before further transformations or transfer into a data warehouse (to avoid the phenomena of data swamp).
im on mobile so im too lazy to say more than this for now. just know these are bare minimum concepts in Data Engineering land

Unclear what a data warehouse is or when to use one? Then this post is for you. In this post, we go over what a data warehouse is, the need for it, and the differences between using an OLTP and OLAP database as a data warehouse.
why does this even matter?
well, hopefully you will have someone doing Data Engineering work for you...
because otherwise...guess who is the one doing it? hehe
hollow sentinel
import requests
import pandas as pd
import time

api_key = "x"

#get latitude, longitude, humidity value, pressure, temperature, and predict wind speed.

#make API call.

url = "https://api.openweathermap.org/data/2.5/weather?q=London&appid={api_key}"
response = requests.get(url)
print(response.status_code)


params = {
    "city_name": "London"

    }
https://api.openweathermap.org/data/2.5/weather?q={city name}&appid={API key}
We don’t have the time to learn to be gods and do everything
misty flint
steady basalt
We don’t have the time to learn to be gods and do everything
welp. thats what some companies will expect so...hopefully you can change their expectations
or you can just get fired for not providing value aka not being able to deploy your model or having data quality issues since there is no data engineer. this is very pessimistic so feel free to ignore but just saying sometimes this is the reality...
hollow sentinel
i can't w them
why is it so hard for my brain to make a URL
or am i just being too hard on myself
misty flint
i actually have; probably heard like 10ish podcasts about them already. and they are their own controversies.
from everything ive heard and read, data marts are ideal for organizations where business units have their own data person embedded into such a unit, and there is a centralized data team employing a hub and spoke model
no, they wont solve all your data problems, but some companies seem to think they are the magic bullet
so they get used and abused
hollow sentinel
i want to use and abuse APIs
misty flint

hollow sentinel
CONSUME
😤
We’re going to be working with the Youtube API to collect video statistics from my channel using the requests python library to make an API call and save it as a pandas dataframe. Working with APIs is a necessary skillset for all data scientists and should be incorporated into your data science projects. I talk about the one data science project...
maybe this is a bad tutorial?
idek
broken oxide
For this API, if it's lat and long, you can find other databases online that have lat and long for many cities in the world and use that with a mapping
hollow sentinel
that’s true
 dull granite
What 's your Twitter project looking like?
Or at least what's the basic idea?
I'm planning my own project using the Twitter API which is a bit daunting but fun ngl. Was wondering as to how'd be able to continuosly update queried tweet data to a page/dashboard.
Ik the API's rate limited so I'd only be able to query around 300 tweets per 15 minute interval so querying a large amount would take a lot of time
ic. My monthly limit's around 2 million tweets and I assume the academic limit is 5 million.
Is your project similar to a visualisation type or are you creating a dashboard for a certain topic?
Since Twitter's just social media, I'd assume the max I'd be able to do is provide a dashboard regarding Twitter sentiment on a particular topic.
I'd prolly to have do a separate thing to find actual usage numbers and querying them regarding my project topic.
Dang, that seems like a large scale project.
How'd you set-up aggregating all those tweets asynchronously?
I'd assume you'd have to set-up a server to keep it up-and-running in the background to ensure the requests being made?
That's a scary JSON file.
So pretty much populating a data-frame till you get 350k tweets?
How'd you get 250k in one go💀
Ah, got it.
I was assuming you'd queried tweets via keyword/hashtag searches instead of specific tweet replies.
dull granite
Ah, ic.
steady basalt
misty flint
welp. thats what some companies will expect so...hopefully you can change their ...
Stop normalising companies expecting people to have inhuman knowledge and skill capacity
Specialising is best
Data engineer is a huge role itself, I’m not saying u shudnt be able to deploy a model
But it’s just bad to expect a data scientist to also be a data engineer at the same time
At the level of a data engineer
hollow sentinel
steady basalt
But it’s just bad to expect a data scientist to also be a data engineer at the s...
yeah that’s unicorn levels
misty flint
steady basalt
Stop normalising companies expecting people to have inhuman knowledge and skill ...
im not normalizing them. im just saying companies have wild expectations for candidates
and many DS have already found themselves in roles where they have to do more data engineering than actual DS, i.e. candidates have already been burned by companies and their expectations
especially in data immature companies
thats why "recovering data scientist" is a thing
thats all ill say on this conversation since its obviously a bit spicy
warm hound
hasty grail
Sorry, but since bypassing captchas may break TOS, you are not allowed to seek h...
Yeah, but this captcha isn't used on discord
I don't plan to break Discord's ToS
I'm a good user
warm hound
steady basalt
Cv
I mean like how do I do shape detection with opencv
especially with the letters like R and O which are tilted
 modest timber
hey, has anyone been interested in artificial intelligence in finance?
I am looking for interesting potentials methods
arctic wedgeBOT
5. Do not provide or request help on projects that may break laws, breach terms of services, or are malicious or inappropriate.
serene scaffold
 violet monolith
how are you
violet monolith
how are you
I'm just fabulous
violet monolith
Hello
serene scaffold
Do you wanna talk about data science?
violet monolith
yes
serene scaffold
what do you wanna say about data science?
serene scaffold
idk very much about those
warm hound
I don't plan to use my project for malicious intent.
 slate hollow
i have the weirdest problem
In [1]: import tensorflow as tf
2022-07-02 18:47:17.158993: W tensorflow/stream_executor/platform/default/dso_loader.cc:64] Could not load dynamic library 'cudart64_110.dll'; dlerror: cudart64_110.dll not found
2022-07-02 18:47:17.159161: I tensorflow/stream_executor/cuda/cudart_stub.cc:29] Ignore above cudart dlerror if you do not have a GPU set up on your machine.
so this is what happens when i try to just import tf by itself
magically
In [1]: import torch

In [2]: torch.cuda.is_available()
Out[2]: True

In [3]: import tensorflow as tf

In [4]:
if i import pytorch
before i import tf
everything magically works!
 jagged blade
Hi guys, hope you are doing well. I'm currently learning web scraping and I would like to know if I can scrap any kind of website with selenium and delicious soup or Will I have to learn more libraries and tools???
warm hound
warm hound
I don't plan to use my project for malicious intent.
Anyways, are there any tools / libraries which I could use?
 worthy phoenix
anyone in here have a decent digit recognizer system ? like if i give a cv2 array it would identify the digits in it?
charred light
Does it make sense to be able to use "Sales" to predict "Profit" in this dataset? https://www.kaggle.com/datasets/vivek468/superstore-dataset-final
It sounds to me like that's borderline basically cheating.
tacit basin
charred light
Does it make sense to be able to use "Sales" to predict "Profit" in this dataset...
Did you try it? Curious if it gave good prediction...
charred light
tacit basin
Did you try it? Curious if it gave good prediction...
Well, I tried without it and the models are garbage.
Metrics w/o Sales. There's a notebook on kaggle that used RF and got R^2 about ~0.61.
 tacit basin
worthy phoenix
anyone in here have a decent digit recognizer system ? like if i give a cv2 arra...
tacit basin
worthy phoenix
anyone in here have a decent digit recognizer system ? like if i give a cv2 arra...
Google vision api
worthy phoenix
tacit basin
Google vision api
without any proprietary api's
tacit basin
Openmmlab mmdetection @worthy phoenix
charred light
Sales + profit are correlated, albeit not that bad.

Guess I don't have a choice excluding it lmao
tacit basin
charred light
Sales + profit are correlated, albeit not that bad.
Kind of make sense as you can sell at loss
charred light
Yes, that's true.
worthy phoenix
tacit basin
Openmmlab mmdetection <@411031233364099072>
seems like a gun to kill a fly a decent ocr to identify images will do , except for tesseract cuz it is biased and doesnt identify everything correctly
tacit basin
worthy phoenix
without any proprietary api's
Probably this one https://github.com/open-mmlab/mmocr
GitHub
OpenMMLab Text Detection, Recognition and Understanding Toolbox - GitHub - open-mmlab/mmocr: OpenMMLab Text Detection, Recognition and Understanding Toolbox
charred light
Rerunning w/ sales then. Let's see.
tacit basin
worthy phoenix
nice
Google vision API still does better job...
Depends on images you have
Maybe you need to train on your dset
charred light
tacit basin
Probably this one https://github.com/open-mmlab/mmocr
Also, that's pretty cool. Saved for future ™️ project.
worthy phoenix
tacit basin
Google vision API still does better job...
Depends on images you have
Maybe you...
this is the kind of image i have tesseract still fails to identify lmfao
 tacit basin
worthy phoenix
this is the kind of image i have tesseract still fails to identify lmfao
tacit basin
worthy phoenix
this is the kind of image i have tesseract still fails to identify lmfao
Hmm, what's tricky about it?
charred light
Lmao, with sales it's magnitude better. I mean I'm not surprised since it's basically cheating imo.

Looks like XGB and RF might be overfitting a bit too.
worthy phoenix
tacit basin
Hmm, what's tricky about it?
idek
steady basalt
What’s with people trying so hard on Kaggle Lmao
Coloured markup and tables of contents
misty flint
interesting

haha nice
anyway, similar to that first link, you can check the attributes of the tweet or twitter user and see if there are any patterns
dunno if there will be any strong correlations. most likely not is what it seems like
but maybe
misty flint
youre still going to do basic sentiment analysis right? like a hypothesis could be maybe more negative tweets get more replies but more positive tweets get more likes?
that would be interesting to test
 stiff mason
greetings all. I'm trying to find a resource that will help me correctly syntax pandas DataFrame like an excel spreadsheet, adding/subtracting individual cells within the DataFrame like excel does. Are there any resources out there that y'all can point me to?
misty flint

serene scaffold
stiff mason
greetings all. I'm trying to find a resource that will help me correctly syntax...
if you're just asking how to manipulate the data in the DataFrame in general, that's the whole thing that pandas is for, so your question is really "how can I learn pandas". and I would recommend this pandas tutorial: https://www.kaggle.com/learn/pandas
Solve short hands-on challenges to perfect your data manipulation skills.
also, there is no "pandas syntax". programming languages have syntax, and libraries have APIs.
hollow sentinel
!pastebin
arctic wedgeBOT
Pasting large amounts of code
If your code is too long to fit in a codeblock in discord, you can paste your code here:
https://paste.pythondiscord.com/
After pasting your code, save it by clicking the floppy disk icon in the top right, or by typing ctrl + S. After doing that, the URL should change. Copy the URL and post it here so others can see it.
hollow sentinel
Traceback (most recent call last):
File "/Users/myname/Desktop/fighting game data analysis project/brawlhalla_analysis.py", line 73, in <module>
pd.get_dummies(brawlhalla_data, brawlhalla_data["gender"])
File "/Users/myname/Library/Python/3.7/lib/python/site-packages/pandas/core/reshape/reshape.py", line 904, in get_dummies
check_len(prefix, "prefix")
File "/Users/myname/Library/Python/3.7/lib/python/site-packages/pandas/core/reshape/reshape.py", line 902, in check_len
raise ValueError(len_msg)
ValueError: Length of 'prefix' (55) did not match the length of the columns being encoded (3).
never seen this error before
GitHub
System information OS Platform and Distribution (e.g., Linux Ubuntu 16.04): Linux 16.04 Modin installed from (source or binary): Binary Modin version: 0.7.0 Python version: 3.7 Exact command to rep...
anyone know what to do here?
hollow sentinel
i want to dummy the gender column and drop the name and datereleased cols
sinful surge
How would I add a 'none' option to my machine learning model? I have a model that tells me if I have a picture of a cat or a dog, but it gives me an answer even if there isnt a cat or a dog. (I'm new to machine learning btw)
steady basalt
sinful surge
How would I add a 'none' option to my machine learning model? I have a model tha...
Maybe u can just make it none if it has low confidence
 cursive belfry
Whats the best way of extracting tweets from twitter ?
serene scaffold
cursive belfry
Whats the best way of extracting tweets from twitter ?
there's one way, and it's using the twitter API with tweepy
wooden sail
sinful surge
How would I add a 'none' option to my machine learning model? I have a model tha...
you need to add a third category and retrain. you'll probably have to rethink the last layer and cost function of the network as well, since the output cannot be captured by a single boolean anymore and you need a more general cross-entropy cost func
cursive belfry
serene scaffold
there's one way, and it's using the twitter API with tweepy
Well I tried using twint and I am facing issues
hollow sentinel
i don't like java
why did i have to take a course in java next sem
oh shit wrong channel
serene scaffold
hollow sentinel
oh shit wrong channel
you have my permission to shit on Java in whatever channel you like ||not really but still||
hollow sentinel
it’s actually really helpful to have projects even if they’re just snippets of other people’s codes put together
bc i can see what to do for certain scenarios
slowly putting the pieces together helps
hollow sentinel
what
steady basalt
serene scaffold
you have my permission to shit on Java in whatever channel you like ||not really...
What’s wrong with Java exaclty
hollow sentinel
!pastebin
arctic wedgeBOT
Pasting large amounts of code
If your code is too long to fit in a codeblock in discord, you can paste your code here:
https://paste.pythondiscord.com/
After pasting your code, save it by clicking the floppy disk icon in the top right, or by typing ctrl + S. After doing that, the URL should change. Copy the URL and post it here so others can see it.
hollow sentinel
so i wanted to get rid of the name and datereleased columns
but when i check to see if they're gone, they're still there
oh shit
i never specified "inplace = True"
no
that's not it
Index(['name', 'strength', 'dexterity', 'defence', 'speed', 'gender', 'price',
       'datereleased'],
      dtype='object')
Traceback (most recent call last):
  File "/Users/rahuldas/Desktop/fighting game data analysis project/brawlhalla_analysis.py", line 88, in <module>
    print(brawlhalla_data.columns)
AttributeError: 'NoneType' object has no attribute 'columns'
idek
arctic wedgeBOT
@charred egret :white_check_mark: Your eval job has completed with return code 0.
001 | Index(['name', 'strength', 'dexterity', 'defence', 'speed', 'gender', 'price',
002 |        'datereleased'],
003 |       dtype='object')
004 | Index(['strength', 'dexterity', 'defence', 'speed', 'gender', 'price'], dtype='object')
huh
wait so what did i do wrong
wait no
it works
i'm an idiot my b
another project done
 stiff mason
serene scaffold
also, there is no "pandas syntax". programming languages have syntax, and librar...
stiff mason
serene scaffold
also, there is no "pandas syntax". programming languages have syntax, and librar...
I found how to add/subract columns: df['diff_3_4'] = df.apply(lambda x: (-2*x['Column 4']) + x['Column 2'], axis=1). How to I do math for individual cells like in excel?
steady basalt
stiff mason
I found how to add/subract columns: df['diff_3_4'] = df.apply(lambda x: (-2*x['...
Don’t think u need a function for that
hollow sentinel
ok time to enter the hellscape again that is
APIs
i am not giving up on that pollen analysis project
serene scaffold
steady basalt
What’s wrong with Java exaclty
tons of boilerplate and forced OOP.
serene scaffold
stiff mason
I found how to add/subract columns: df['diff_3_4'] = df.apply(lambda x: (-2*x['...
you should avoid apply as much as possible. it looks like what you've written is this:
df['diff_3_4'] = -2 * df['Column4'] + df['Column 2']
but bad.
you can do and and time it yourself. you'll get the same result, but faster.
if you want to select an individual value, use .at
df.at[4, 'Column4']
will give you whatever value is in the 4 row at Column4
btw, if your column names are just Column1, Column2, etc., you should delete that and just use an integer range.
but how often are you doing math with individual cells, really?
steady basalt
serene scaffold
tons of boilerplate and forced OOP.
Sounds just like ML packages to me
serene scaffold
steady basalt
Sounds just like ML packages to me
have you used Java? in Python, you don't have to define a class that isn't actually a class with a bunch of static methods just to accomplish literally anything.
Java conflates "class" with "module". classes shouldn't be the only form of code modularity available to you.
if you're doing ML in Python, chances are, you're only defining a class when you're using tensorflow or pytorch. and even then, you're not actually doing traditional OOP.
stiff mason
In this case, it's a lot of math for individual cells. I'm trying to have the python functionality work the same math as excel. I'm importing API data for stock information and I want to manipulate the indexes and cells individually to make my spreads for trading
serene scaffold
stiff mason
In this case, it's a lot of math for individual cells. I'm trying to have the p...
try to think of what you're doing in terms of, well, what you're actually trying to do. don't think of it in terms of "how can I port this Excel functionality over to pandas".
what are these individual operations that you're trying to do? what's the real goal here?
Java is the JVM language that I like the least, so any alternative is an improvement.
stiff mason
to be able to add index values, and create a new value as a result
serene scaffold
stiff mason
to be able to add index values, and create a new value as a result
add index values. can you show an example?
stiff mason
in excel for example, cell A1 has a value of 5. I want to add it to cell A2 which has a value of 10. In a new cell I want it to have a value of 15
in a new column
serene scaffold
why do you only want to do this for exactly two cells?
serene scaffold
can you arrange it so that there are two columns, and every pair of elements you want to add are in the same row?
stiff mason
well there's different operators I want to add on top of that. (-2*(B2)+A1+C1) for example
sorry I missed a parenthesis in there
serene scaffold
okay, can you arrange it so that there are three columns?
why is B2 in a different row?
do you also want to do (-2*(B3)+A2+C2)?
stiff mason
Option Spreads are a whole other can of beans, but yes I want to add different rows with different columns
serene scaffold
because if you do want to do (-2*(B2)+A1+C1), you can do this
df['D'] = (-2 * df['B'].shift(-1)) + df['A'] + df['C']
and that will do the operation row-wise for every row, but offset the B column by one row.
NaN
I'll be back in 20 minutes or so. unless I get a chance to look at my phone.
stiff mason
here's an example from excel: ((-3C11)+(C102)+(C13))
Here's the C column

sorry that didn't paste correctly
arctic wedgeBOT
@charred egret :white_check_mark: Your eval job has completed with return code 0.
001 |    A  B  C
002 | 0  1  2  3
003 | 1  4  5  6
004 | 2  7  8  9
005 |
006 | AFTER
007 |    A  B  C    D
008 | 0  1  2  3 -6.0
009 | 1  4  5  6 -6.0
010 | 2  7  8  9  NaN
ok I think I see what you're getting at. I want to add for example column A Index 0 to Column A Index 3 and have column D get the combined value of 8
In your example
then I want to copy that functionality and have it run for thousands of lines
sorry index 2
arctic wedgeBOT
@charred egret :white_check_mark: Your eval job has completed with return code 0.
001 |    A  B  C
002 | 0  1  2  3
003 | 1  4  5  6
004 | 2  7  8  9
005 |
006 | AFTER
007 |    A  B  C    D
008 | 0  1  2  3  8.0
009 | 1  4  5  6  NaN
010 | 2  7  8  9  NaN
I'm back btw
 surreal badge
Hi cant figure out my my colors on the graph doest match the colors in my legend https://i.imgur.com/av9GGZn.png
 serene scaffold
surreal badge
Hi cant figure out my my colors on the graph doest match the colors in my legend...
serene scaffold
surreal badge
Hi cant figure out my my colors on the graph doest match the colors in my legend...
can you show the code that made this?
from the figure alone, there's no way to know that the key is incorrect
surreal badge
How did i paste code like above?
serene scaffold
!code
arctic wedgeBOT
Here's how to format Python code on Discord:
```py
print('Hello world!')
```
These are backticks, not quotes. Check this out if you can't find the backtick key.
serene scaffold
don't forget the py on the first line
surreal badge
    # Plot
    for album in range(len(all_albums)):
        print(all_albums[album])
        for song in range(all_albums[album][3]):
            x = np.linspace(0, longest_album, all_albums[album][3])
            plt.plot(x, albums_analyzed_data[album], marker='.')

    # Decorate
    plt.xlabel('From first to last song')
    plt.ylabel(analyze_name)
    plt.title(artist_name + "´s Albums " + analyze_name + " per song")
    # Limits
    plt.xlim(-2, longest_album+2)
    plt.ylim(0, y_data)
    plt.legend([all_albums[i][1] for i in range(len(all_albums))], loc='upper left')
    # Discrupt
    plt.show()
can you also show the result of print(all_albums)?
surreal badge
Im very new to this, so im doing this to learn. So i apologize for the ugly code
serene scaffold
surreal badge
Im very new to this, so im doing this to learn. So i apologize for the ugly code
that's fine. we need all variables to be defined, in order to diagnose the problem.
surreal badge
'''py
('0kCdT4gjYlSxIV7ll3Yd4M', 'Infinite Granite', 3215289, 9, 'Deafheaven')
('4PVyUMglBuxtPVip15aFfq', '10 Years Gone (Live)', 4353790, 8, 'Deafheaven')
('2iA7rzpQsOfAPkfH4Ekp7f', 'Ordinary Corrupt Human Love', 3699742, 7, 'Deafheaven')
('2e4xOasRFhJn4x2MBM5pdu', 'New Bermuda', 2797485, 5, 'Deafheaven')
('2kKXGWaCEl06EKZ4DxBJIT', 'Sunbather', 3597438, 7, 'Deafheaven')
('4OGPeQsT1vl9BsNG8kiDpQ', 'Roads to Judah', 2303026, 4, 'Deafheaven')
'''
mint palm
why is this form asking for my exp in ML, DL, Big data analytics seperately?
what should I do? I can write ML,DL exp seperately but what about big data analytics?? just visualisationand cleaning?
serene scaffold
surreal badge
'''py
('0kCdT4gjYlSxIV7ll3Yd4M', 'Infinite Granite', 3215289, 9, 'Deafheaven')
(...
you used ' instead of `
surreal badge
('0kCdT4gjYlSxIV7ll3Yd4M', 'Infinite Granite', 3215289, 9, 'Deafheaven')
('4PVyUMglBuxtPVip15aFfq', '10 Years Gone (Live)', 4353790, 8, 'Deafheaven')
('2iA7rzpQsOfAPkfH4Ekp7f', 'Ordinary Corrupt Human Love', 3699742, 7, 'Deafheaven')
('2e4xOasRFhJn4x2MBM5pdu', 'New Bermuda', 2797485, 5, 'Deafheaven')
('2kKXGWaCEl06EKZ4DxBJIT', 'Sunbather', 3597438, 7, 'Deafheaven')
('4OGPeQsT1vl9BsNG8kiDpQ', 'Roads to Judah', 2303026, 4, 'Deafheaven')
and it's a list of tuples like this?
 cinder mortar
does anyone here use scikitlearn's random forest classifier for multiple labels? my data has 4 target labels but the model returns me a binary result, losing two of the classes in the process. I tried googling the problem but I'm totally lost; my queries often return results about missing labels/data in the dataset and I don't know how to phrase this problem
surreal badge
serene scaffold
and it's a list of tuples like this?
The data it uses to draw the graph is the "albums_analyzed_data[album]" if that has anything to do with it
serene scaffold
surreal badge
The data it uses to draw the graph is the "albums_analyzed_data[album]" if that ...
I don't know if albums_analyzed_data[album] is a dict, or a list, or what the types in it are, or what they mean.
surreal badge
I can of see the problem now. There is no really connection beteewn the lines and the ledgend
List
serene scaffold
list of what?
if you send me enough information to completely reproduce what you're trying to do, I can try to suggest a cleaner solution.
surreal badge
albums_analyzed_data[album] [0.164, 0.162, 0.0949, 0.164]
thats whats in it
I can show you everything if you like. I can upload it so there wont be so much text here
arctic wedgeBOT
Pasting large amounts of code
If your code is too long to fit in a codeblock in discord, you can paste your code here:
https://paste.pythondiscord.com/
After pasting your code, save it by clicking the floppy disk icon in the top right, or by typing ctrl + S. After doing that, the URL should change. Copy the URL and post it here so others can see it.
surreal badge
serene scaffold
this is just more code. I'm only interested in the data that's relevant to producing the figure in question.
also, a reproducible example can never include database IO, unless it only refers to tables that are created and populated in the example.
surreal badge
albums_analyzed_data[album] [[0.455, 0.343, 0.28, 0.214, 0.36, 0.335, 0.36, 0.388, 0.278], [0.104, 0.143, 0.101, 0.197, 0.242, 0.202, 0.242, 0.0876], [0.295, 0.225, 0.275, 0.296, 0.213, 0.437, 0.197], [0.279, 0.152, 0.247, 0.246, 0.218], [0.1, 0.648, 0.106, 0.22, 0.182, 0.173, 0.206], [0.164, 0.162, 0.0949, 0.164]]
That is the data it uses to draw that graph
serene scaffold
there literally isn't any other data that is relevant to creating the figure?
that can't be. because this isn't labeled.
surreal badge
Im not sure really, first time with mathplot. But i understand that there is no way to the graph line to connect with the legend. But i have no idé how
i thought this was the only data it used
surreal badge
Thanks anyway for taking your time. I will try to figure it out tomorrow
 young plume
Anyone able to answer a question?
serene scaffold
young plume
Anyone able to answer a question?
You have to ask your actual question. Don't ask to ask. Your question should have enough information for someone to read it and immediately start answering it.
young plume
Ye
serene scaffold
That goes for any time you ask for help on the internet, btw.
serene scaffold
This is the channel for data science and ai questions. So if that's what your question is about, go.
young plume
Ok
I have a general understanding of neural networks, and i have one built that is object oriented, and expanable. I want to know how or if i can turn it into a RL neural network.
The internet isnt very clear about that
serene scaffold
I don't know what an object oriented neural network is.
There are a lot of different kinds of neural architectures. I don't know that you can necessarily use a basic feed forward neural network for reinforcement learning. Haven't really looked into it.
@young plume
serene scaffold
What did you eat
young plume
Chicken, spinach and carrots. Dinner
serene scaffold
Yay
young plume
Sorry about the wait
serene scaffold
I like spinach
young plume
Ye



 young plume
But i have everything in a class, which runs the functions as many times as i tell it to, creating as many layers as i need, as big as i need
Learned from that nnfs guy
serene scaffold
This means that the implementation is object oriented. "Object oriented neural networks" isn't a term that you'll hear when talking about AI techniques.
young plume
Oh ok