#data-science-and-ml
1 messages · Page 414 of 1

 glad mulch
for some reason, my where function is bugging out. Example code:
def generate_pnl(df: pd.DataFrame, gain, gain_std, loss, loss_std):
    for col in df.columns.values:
        start_time = time.time()
        print("Generating PNL values for portfolio {}".format(col))
        print(df[col].head())
        df[col] = df[col].where(
            (df[col] == 1),
            truncnorm.rvs(
                1, gain+gain_std, loc=gain, scale=gain_std, size=len(df)))
        print(df[col].head())
        df[col] = df[col].where(
            (df[col] == 0), -truncnorm.rvs(
                1, loss+loss_std, loc=loss, scale=loss_std, size=len(df)))
        print(df[col].head())
        end_time = time.time()
        duration = end_time - start_time
        print(
            f"Completed generating PNL values for portfolio {col} in {duration} seconds")
    return df
i did a quick print function at each point of the statement
# First print Statement
1    0
2    1
3    0
4    0
5    0
# Second print statement
1    243.949907
2      1.000000
3    208.573045
4    279.292684
5    202.035304
# Third Print Statement
1   -241.167932
2   -251.109101
3   -265.073210
4   -202.495864
5   -282.503205
 serene scaffold
it looks like each of these might be a Series rather than a df
glad mulch
so i have a dataframe and iterate through each column
 burnt citrus
serene scaffold
so much for three hours
burnt citrus
serene scaffold
so much for three hours
no im done just got to pkg it
clone the repo and run the main.py
didn't need to c it
i did it how r does it
by done i mean the logic is all there
so it works as
the header of the cols will be the name of the array
and then you can mutate the array
like any other array
then write to file like that
have to finish that part
burnt citrus
I am semi finished now
act looked at the pandas functions
its a little fucked
but i have just lost focus after my mom called so i will pick this up later
so much for 3 hrs
 viral swan
anyone can help how can I extract the data from this table like regex pattern?

 hoary wigeon
I need help with replacing null values
Im trying to fill industry values with mode of industry and bucket of titles,
lead_df['industry'] = lead_df.groupby('title')['industry'].transform(lambda x: x.fillna(x.value_counts().mode()[0]))```
There are missing values for those combinations too.. and im getting `ERROR`
Is there any alternate way to do that? agile cobalt
which error are you getting?
hoary wigeon
agile cobalt
which error are you getting?
no values present in series KeyError: 0
 tacit basin
viral swan
anyone can help how can I extract the data from this table like regex pattern?
tacit basin
viral swan
anyone can help how can I extract the data from this table like regex pattern?
splitting on \ would be a good start 🙂
 agile cobalt
hoary wigeon
no values present in series `KeyError: 0`
agile cobalt
hoary wigeon
no values present in series `KeyError: 0`
maybe try .iloc[0] instead of [0] then
 untold bloom
hoary wigeon
I need help with replacing null values
Im trying to fill industry values with m...
untold bloom
hoary wigeon
I need help with replacing null values
Im trying to fill industry values with m...
you're trying to fill the NaNs with the mode of counts rather than the mode of values themselves; is that intended? i.e., perhaps you should be doing x.mode()[0] instead.
but this isn't the source of error: you probably have a "title" for which the all "industry" values are NaN, hence there's no value to take the mode of because mode (or value_counts) won't consider NaN by default
so perhaps try x.mode(dropna=False)[0] to see if the error goes away. If so, you need to do something for those groups :p
also .iat[0] is slightly more clear than [0] here although they achieve the same in this specific case because what mode returns has a RangeIndex.
 steady basalt
Another day another QUIZ! Who wants to do some Einstein notation! Multiplication…
Aka index notation
Need some rotations and reflections
 wooden sail
einstein notation does the soul good
steady basalt
Didn’t it come from just
Laziness
My lord they want me to do it in numpy again. CBA
wooden sail
it's not from laziness, it's just an alternative notation
a very powerful one at that
and yeah, numpy has an einsum function
that makes it so that your math involving multilinear transformations looks exactly the same on paper as in your code (which otherwise isn't the case, since you have to unfold tensors into matrices more or less arbitrarily)
steady basalt
changing basis oh no
steady basalt
wooden sail
and yeah, numpy has an einsum function
not allowed functions
has to be literally line by line
wooden sail
well, in that case, for you, it makes no difference which notation you use
steady basalt
now its getting confusing af
objects basis vector + objects vector
translating to 3d
that makes 0 sense
wooden sail
idk what you mean by objects vector
wooden sail
what language are you learning the math in?
steady basalt
ENglish
wooden sail
but since last time you're not using any standard math terms
where are you getting these terms from
wooden sail
oof
 wooden sail
is that exactly what they said? are we talking object in python or object in the real world?
steady basalt
 wooden sail
is this from school or are you watching videos from random people on youtube?
steady basalt
its coursera
wooden sail
man, that's terrible
steady basalt
its 40 euros a month
wooden sail
at any rate, what they mean is that the object has a "position vector"
wooden sail
that course looks really bad from what i can see
steady basalt
it was projecting shadows off of 3d objects and then doing some weird transofmations
cant wait to just get thru the course put it on the cv and th en go learn from somewhere more explainable
i can DM u the video lmao
wooden sail
i would discourage you from rushing through it just to put in in your cv because this is all super elementary. you'll have to basically start again from 0 anayway
wooden sail
ok, so
i personally don't like 3b1b, and especially not his linear algebra series
but many people seem to like it
steady basalt
ive watched a few of his videos
wooden sail
so one place to look at is here https://www.youtube.com/watch?v=P2LTAUO1TdA
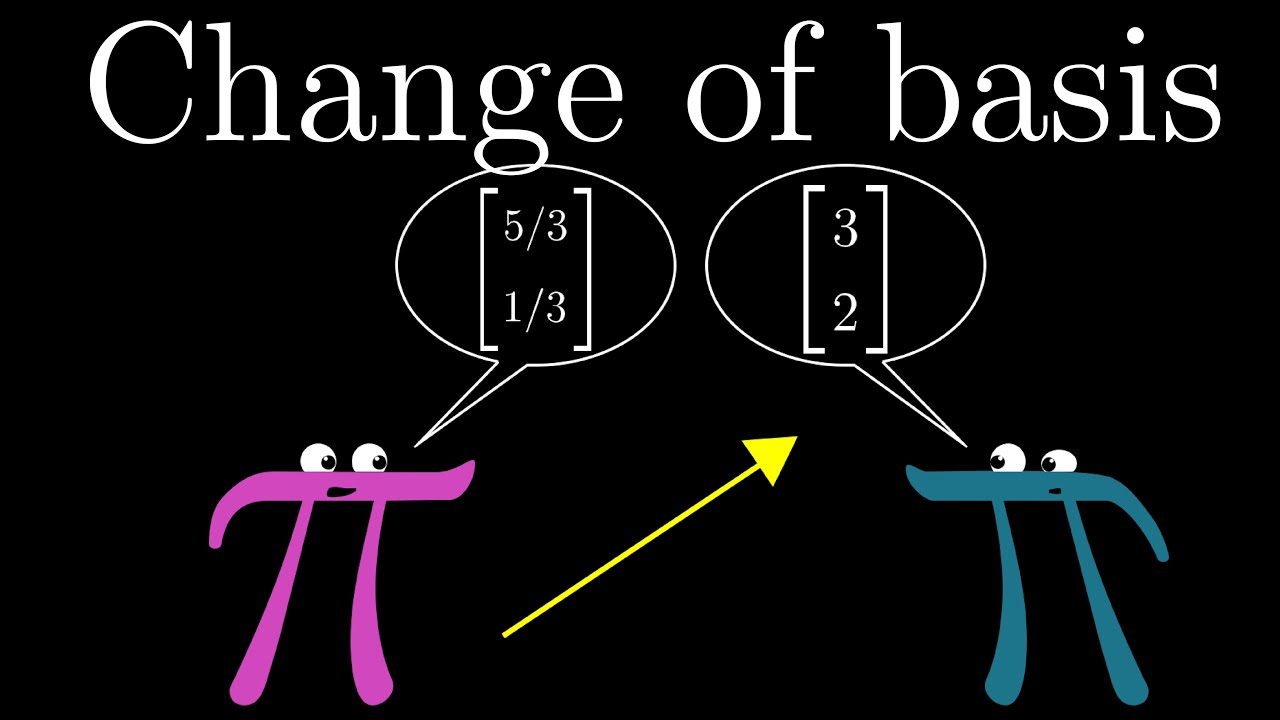
How do you translate back and forth between coordinate systems that use different basis vectors?
Help fund future projects: https://www.patreon.com/3blue1brown
An equally valuable form of support is to simply share some of the videos.
Home page: https://www.3blue1brown.com/
Future series like this are funded by the community, through Patreon, w...
wooden sail
even though he WANTS them to be, his videos are NOT for people who're freshly learning a topic. his explanations only work if you've already learned the topic before and want a different perspective
in my opinion, at any rate
 primal shuttle
Agreed - you can't learn from these
wooden sail
i'd also just recommend to look at gilbert strang's linear algebra book
primal shuttle
That's why content validation is crucial when picking study materials 🙂
I'll be making a video on this on my YT channel if you're interested
steady basalt
what is ur channel
primal shuttle
It'll start next week
wooden sail
online courses don't work for everyone. some teachers are bad at making them, and some students are bad at learning from them. the same is true for all learning and teaching material too, so you should always keep an open mind, look for different kinds of material, etc
primal shuttle
well after next week
wooden sail
i will also point out that even going to lectures at uni is not meant to teach you everything. lectures only work if you complement the material with your own studies
so extra material is ALWAYS needed
you need something to read
primal shuttle
There is also this thing of going from theoretical to practical or the other way round, you need to work out what works best for you
wooden sail
steady basalt
is intro to linalg a good book
yep
primal shuttle
@steady basalt find the book, see its contents, read an exemplary chapter on stuff you are currently learning
wooden sail
the MIT one by gil strang?
primal shuttle
See if it speaks to you
steady basalt
strang yes
primal shuttle
If it doesn't, find another source, rinse and repeat
steady basalt
123 pounds are u serious
wooden sail
look around here first https://math.mit.edu/~gs/linearalgebra/
to see if you find the style pleasant
 barren wedge
Any idea on how to generate infographic using AI?
wooden sail
the short explanation i can give you is based on the interpretation of the multiplication of matrices and vectors
it is usually helpful to think of a matrix as a collection of vectors. let's say you have a 3x3 matrix M. then you can think of M as [m_1 m_2 m_3], where each of the m_i are a vector in R^3
now, if you consider a vector v = [x,y,z]
the product M v is equal to x m_1 + y m_2 + z m_3
we observe that this is the very definition of a linear combination
if we write w = Mv, what this says is "the vector w is written as a linear combination of vectors. the vectors are the columns of M, and the coefficients are the entries of v"
steady basalt
I can do AijBjn or something
wooden sail
now we just shift out viewpoint a little, and refer to v as a "coordinate vector". the entries of v are coordinates in some basis. that basis is formed by the columns of M.
and so w = Mv can be interpreted as "the vector w has coordinates v in the basis formed by the columns of M"
and now, to get the final bit, maybe we are not given v. maybe we are given w instead, and we want to FIND v. then w = Mv -> M^-1 w = v
so M^-1 is a change of basis transformation
steady basalt
This change in basis can’t it just be explained as basic product of matrix and vector
Oh
wooden sail
that's basically the idea i tried to convey just now, yes
wooden sail
whenever you have a matrix vector product, you can choose to interpret it as expressing a vector in a special basis
steady basalt
Same thing? Axis stretched?
wooden sail
basis is not "the" axis because an n-dimensional space has n axes
the basis is all of the axes
steady basalt
The basis of the vector
wooden sail
the basis has the name number of elements in it as the dimensionality of the subspace containing the vector
in the panda example, the dude is working on a 2D plane
that means the basis has 2 vectors
steady basalt
Ok
wooden sail
and you want to use these 2 vectors to express any point in 2D space
steady basalt
But a panda has many points it isn’t a square
wooden sail
yeah well, the guy explained stuff really poorly
after watching the vid, what he means is
"consider a random point in 2D space"
steady basalt
It’s just the uhh dimension direction?
wooden sail
"to the panda, it seems the point has these coordinates. to me, though, it looks like the SAME point has DIFFERENT coordinates, because i'm looking at it from a different point of view"
steady basalt
2d vs 3d u mean?
wooden sail
the panda is an observer looking at the 2D plane
you are an observer looking at the same 2D plane
you're both looking at the same point
steady basalt
So the panda is the same as me from a different angle?
wooden sail
sure
wooden sail
no
steady basalt
Oh
wooden sail
mind you, it could be, but then the transformation does not involve square matrices with inverses, but rather rectangular matrices that are either left or right-invertible
and i'm pretty sure you haven't gotten there yet in your content 😛
steady basalt
Wait a minute
wooden sail
what you're saying CAN be done, you'll learn it later
but for now assume just that you're both the same and looking at a 2D plane
steady basalt
Me and panda both see the point in space at the same place but we have different axis values because we both start at zero?
wooden sail
no
steady basalt
so it appears different
wooden sail
rather, the point where you placed the 0 might be different. or maybe you're looking at it from a skewed angle
steady basalt
thats what i mean
wooden sail
or more generally, the only condition for a set of vectors to form a basis is for them to be linearly independent
steady basalt
its physically in the same place but appears different so thats confusing me
this sort of makes 'physically' not a thing anymore
wooden sail
but you have that experience every day
steady basalt
because its literally not in the same place mathematically
wooden sail
you point at a thing that's far away and tell your friend to look at it
and he struggles to find the thing
he sees you pointing at it, but his eyes are not located where yours are
steady basalt
isnt the location of a point in space defined by your axis, so the same point is different from another angle
wooden sail
so he can't see where exactly you'Re pointing
steady basalt
that seems to break physical laws its so out there
steady basalt
cuz physically its in the same place
wooden sail
there is nothing that makes one coordinate system more valid than another
wooden sail
this is exactly the example i just gave you
steady basalt
but they both have their co-ord system catered towards their pov
wooden sail
idk if you're just ignoring what i'm writing
steady basalt
so mathematically they have a different point infront of them but its the same point
is that waht u mean
wooden sail
idk what you mean by "mathematically" there
steady basalt
in terms of their own description of its location
wooden sail
the point is the same, you can choose whatever coordinate system you like to describe it
steady basalt
one guy can say its at x co-ords and the other says y
is that what the panda is about
wooden sail
yes
steady basalt
okay
wooden sail
but you're trying to give it some extra physical meaning that also doesn't exist lol
there's no such thing as absolute coordinates anyway
steady basalt
its all perspective?
wooden sail
sure
all the maps you use in real life follow a convention someone made up
there's no reason why they're "more correct"
steady basalt
yeah so this problem is all about describing a point in another co-ord system?
wooden sail
yeah
wooden sail
right
steady basalt
is that where the basis vectors come in
wooden sail
yeah
wooden sail
there IS one assumption made, and it's that the coordinate systems share the same origin
yeah
so you have a point p in 2D space
steady basalt
so we have the basis vector not of the panda but of the object from the pandas pov? why did he say of the panda
wooden sail
you could write p as ax + by, or you could write it as wu + vz
steady basalt
was he talking about a random point
wooden sail
yeah, he meant to say of the panda's POV
steady basalt
same origin?
wooden sail
so, vectors don't inherently have a location in space
so "canonically" (i.e. someone made up the convention and we follow it), vectors are assumed to have their tail and some origin, which we usually call (0,0) in the canonical basis formed by the nice and simple vectors [1,0] and [0,1]
steady basalt
but i thought that the origin depended on the pov
the co-ord system
now im confused
were stil talking 2d
wooden sail
it can, and these receive the name of affine transformations
you'll also learn that later
but for now assume they have the same origin, but are maybe slanted or stretched
steady basalt
if both basis vectors come out of the same origin, how is it a different pov
steady basalt
but its the same co-ord grid aka same pov
wooden sail
now consider the new basis [3,0], [0,1]
if we have the point that, in the canonical basis, has coordinates [3,1]
in the new basis, this vector has coordinates [1,1]
steady basalt
i need a minute to envision that
wooden sail
because the new basis has a longer vector to explain the horizontal axis
this is the same as, for example, giving THE SAME LENGTH in km vs in miles
but more generally you can also have a slant, instead of just a stretch
steady basalt
ok so the co-ords are translated to whatever the basis units are
why is it even called a basis in the first place
cant values go less than a basis unit
wooden sail
because you explain every point in space as being made up from the elements of the basis
the whole space is "based" on them
wooden sail
steady basalt
cant values go less than a basis unit
and yes, they can
steady basalt
but you can still get 0.5 on a 1,1 basis
wooden sail
sure
steady basalt
so the grid squares in 1,0 0,1 basis are squares but in the 3,1 are rectangles?
wooden sail
all of them are equivalent to each other in some sense. the whole idea is exactly that
steady basalt
this is getting really hard to envision now
steady basalt
how did u manage to get this to sink in in the first place
this is purely based on 3rd eye strength
primal shuttle
Practice
steady basalt
xd
wooden sail
practice is one thing, since it helps develop intuition
but also, algebra is very powerful independently of visualization
the simpler idea is kinda like this
imagine i tell you "we have this number 5 here "
steady basalt
3b1b has lost me
wooden sail
"what 2 numbers did we add in order to get 5?"
and i tell you nothing else
you quickly realize this question has infinitely many answers
5 = 0 + 5, but also 1 + 4, and also -0.99999 + 5.99999
steady basalt
i saw on some news show that a woman said 2+2 may not actually = 4
wooden sail
...
steady basalt
something about math being racist and the way we understand it is subjective
american*
primal shuttle
……
steady basalt
according to her, it cud be another system entirely
serene scaffold
steady basalt
i saw on some news show that a woman said 2+2 may not actually = 4
this was probably a metaphor for something unrelated to math that fell flat.
wooden sail
that essentially made the remainder of my patience evaporate. best of luck with learning change of bases!
steady basalt
serene scaffold
this was probably a metaphor for something unrelated to math that fell flat.
it was a talk on maths
steady basalt
wooden sail
that essentially made the remainder of my patience evaporate. best of luck with ...
im starting to understand now
when you inverse matrix it takes the old basis back
wooden sail
my final attempt will be algebraic
consider again the equation w = Mv
more explicitly, we can now write I w = M v, where I is an appropriately sized identity matrix
we say that v = M^-1 I w is a vector in the basis M, because we need to multiply it by M again to return to a vector that is a linear combination of the canonical basis vectors
we can see this by taking Mv = M M^-1 I w = I^2 w = I w = w, without any further dependence on M
steady basalt
cause I doesnt do anything ?
steady basalt
what happens when you actually show this on a graph, so far ive only seen co ordinate vectors
wooden sail
that's what the 3b1b video shows
wooden sail
but anyway as soon as you move away from R^1, 2, and 3, there is no longer any good visualization
a 3x3 matrix is an object in 9 dimensional space
wooden sail
the matrix is not in the space the vectors are in. it's a function that acts on those vectors
wooden sail
but you CAN look at the columns as vectors in that same space
steady basalt
wooden sail
a 3x3 matrix is an object in 9 dimensional space
9D object?
and 3x1 is 3d?
wooden sail
yes
steady basalt
1x3 also 3d
wooden sail
yes
steady basalt
2x2 is 4d?
wooden sail
yes
steady basalt
i wish i cud see it
wooden sail
you can't, and the idea if linear algebra is precisely that
take a nice and easy behavior that is easy to visualize in low dimensions
and now generalize it to arbitrarily weird structures that satisfy the same conditions
steady basalt
as I saw earlier you can translate from 3d to 2d, so cant u go from 4d to 3d to 2d
steady basalt
it was a shadow cast of an object in my quiz
wooden sail
probably orthogonal projections
but anyway, yes, you can go from 4d to 2d
you just can't visualize it
steady basalt
so you can not see the 2d version?
wooden sail
you can see the 2d shadow, not the original 4d thing
and the shadow can be formed in infinitely many ways. you just saw one in your course
whenever you see something has the name "algebra" in it, you have to immediately be prepared to have no direct visualization. you can almost always construct illustrative examples that are simple, like working with 1, 2, and 3d space. but the point is to take that intuition, generalize it, and now be able to do similar things in more abstract scenarios
nothing stops you from projecting something in 1000d space down to 100d space, how do you visualize it? that's a different matter altogether
steady basalt
i wonder if we will ever get a new breakthrough scientist who changes that
wooden sail
changes what?
steady basalt
rules of dimensions
wooden sail
what?
steady basalt
well consider how far we came in 100 years now imagine 100 years form now
they might change maths even more
unless we suddnely got less productive
wooden sail
the changes are made by building on top, the results used are already proven to be true
idk what you even mean
steady basalt
basically cant even imagine what the next einstein will do...
wooden sail
you should start by looking at the 2x2 matrix in front of you
steady basalt
im just doing this to be able to do a job, not make a new discovery
maybe there will never be a next einstein
wooden sail
maybe the langlands program yields something cool in a few years time
steady basalt
well think about it, 60 years ago people had alot more time on their hands to put into thinking
In representation theory and algebraic number theory, the Langlands program is a web of far-reaching and influential conjectures about connections between number theory and geometry. Proposed by Robert Langlands (1967, 1970), it seeks to relate Galois groups in algebraic number theory to automorphic forms and representation theory of algebraic g...
never did i think there was a field dedicated to studying sound waves
how itneresting

how can a^2 + b^2 = c^2 work of cubing doesnt work
 wheat snow
@untold bloom I was thinking of a way to plot (in a specific period of time (e.g. 4months)) the average hours watched per month... i was thinking about using .mean() somehow
here... with that i get the average of the whole time duration
result=df_vd_R.groupby(df_vd_R["Start Time"].dt.date)["Duration"].sum()
result.index = pd.to_datetime(result.index)
b=(result.loc["2019-03-24": "2019-5-24"].dt.total_seconds()/60/60)

Month= b.mean()
print(Month)
but now, i want that we have e.g. "2019-03-24": "2019-06-25" and get 4 values (each an average of the month (y axis) and x axis would be the 4 moths
 flat sable
Ah im searching for sm1 have a training while im still learning python libraries for Ai
 steel flax
I've a question about sklearn.random_projection.johnson_lindenstrauss_min_dim, they are using this formula: n_components >= 4 log(n_samples) / (eps^2 / 2 - eps^3 / 3), but what is the origin of this formula? Wiki page doesn't mention it, the only place where I could find it, is in the sklearn's soruce code... any ideas?
wooden sail
if you read here, they show a few references. https://scikit-learn.org/stable/modules/random_projection.html#johnson-lindenstrauss i can't find the exact derivation, though
scikit-learn
The sklearn.random_projection module implements a simple and computationally efficient way to reduce the dimensionality of the data by trading a controlled amount of accuracy (as additional varianc...
i'm under the impression it's a heuristic to generously try to guarantee a value of epsilon in the jonhson lindenstrauss lemma
ah, it seems the result is from this paper https://www.sciencedirect.com/science/article/pii/S0022000003000254

A classic result of Johnson and Lindenstrauss asserts that any set of n points in d-dimensional Euclidean space can be embedded into k-dimensional Euc…

that's the one
the proof seems rather involved
that's a pretty well-cited paper, too
might as well do a little @steel flax to make sure you find the message later
 mental girder
I'm trying to make a program to take raw data from a Gaussian text file and export it to excel and was directed towards Jupyter/Anaconda since it has support for pandas which can do that. What are the differences between a Jupyter notebook and a regular Python file?
mental girder
wooden sail
none
Is each block like a separate program?
wooden sail
yes, you can run each block separately
if that's helpful for you, or you want to include text/tex in blocks interleaved with the code, it's nice
but otherwise it's no different. you can think of it almost like a fancy IDE
mental girder
huh
wooden sail
it doesn't change which packages you can use
mental girder
It just seems strange to look at something like this after only using regular guis
wooden sail
you don't have to use it if you don't like it 😛
anaconda is nice for package and environment management, but it also isn't necessary
mental girder
i just downloaded anaconda since my pip wasnt working after installing python
 ancient pendant
Hi I am a begineer and need some help here
I am doing one exercise in which I have (n, m) matrix
and the result I want is (1 , m) and (n , 1).
mental girder
I just switched computers so im missing all my programming tools
wooden sail
all right. a good thing to keep in mind then, is that it's better to manage your packages using conda instead if pip
mental girder
huh. alright, thanks
wooden sail
like conda install xxxx instead of using pip
wooden sail
ancient pendant
Hi I am a begineer and need some help here
I am doing one exercise in which I ha...
can you give more details?
 ancient pendant
yes
wooden sail
i would use a mix of that and list comprehension
primal shuttle
@mental girder another alternative to conda is a tool like poetry, which also allows you to handle package dependencies really well
wooden sail
something like this ```py
In [7]: import numpy as np
In [8]: M = np.array([[1,1,1],[3,2,1]])
In [10]: [M[np.array([i]), :] for i in range(M.shape[0])]
Out[10]: [array([[1, 1, 1]]), array([[3, 2, 1]])]
that's just one way of doing it
ancient pendant
wooden sail
i would use a mix of that and list comprehension
This is my solution which gives (4, ) matrix but not (4, 1)
so I was thinking using newaxis method
Will it work?
 wooden sail
right, that's pretty much what i was going to suggest as an alternative to what i shared above
ancient pendant
wooden sail
something like this ```py
In [7]: import numpy as np
In [8]: M = np.array([[1,1...
Oh okay👍
wooden sail
your method is technically correct, too
ancient pendant
Okay so I just need to figure out how to use newaxis method
am i in right direction?
wooden sail
yes, that would work
ancient pendant
Okay Thanks!
wooden sail
i would also say that a super clean way to make your code look hot would be to call get_rows on a.T inside of get cols, instead of coding a loop that looks identical to what's in the other function
but that's just style
ancient pendant
Oh yes Thanks🎉
wooden sail
and regarding np.newaxis: ```py
In [12]: x = np.array([1,2,3,4,5,6,7])
In [13]: x[:, np.newaxis]
Out[13]:
array([[1],
[2],
[3],
[4],
[5],
[6],
[7]])
In [14]: x[np.newaxis,:]
Out[14]: array([[1, 2, 3, 4, 5, 6, 7]])
Yes Thankyou @wooden sail 🙏
primal shuttle
A way to check it (if you're interested) is to use .flags on the objects to see that the numpy method for transposition is indeed O(1), where you will see that np.transpose keeps the matrices represented as blocks of contiguous memory (as if they were a one-dimensional array) - so the memory doesn't change, it's only the axis that does - hence np.newaxis works as well
wooden sail
that's real chad advice
primal shuttle
@wooden sail chad? 😉
wooden sail
especially cuz it shows you that stuff like newaxis also doesn't make copies, super nice
steady basalt
try plot this
 primal shuttle
@steady basalt you have too much time on your hands 😉
steel flax
wooden sail
might as well do a little <@300261303392534528> to make sure you find the messag...
thankssss a loooot :>
 bronze jacinth
im trying to follow a tutorial for an opencv project. it requires tensorflow(inexperienced) and it throws this (i have already installed tensorflow). how to fix this?
 primal shuttle
What's the actual error?

 primal shuttle
Oh dear it’s windows
primal shuttle
Dear @bronze jacinth - yes, yes, a thousand times yes
bronze jacinth
yessir on it, will delay this project. thanks!
primal shuttle
I can tell you that you have wsl available on windows
Windows Subsystem for Linux
wooden sail
right, wsl is a great place to start
bronze jacinth
yes i tried doing that but eventually installed a vm
primal shuttle
Cool, if you have a VM just make sure you have a GPU pass through so you can use it for your tensorflow
primal shuttle
Anytime 🙂
@bronze jacinth one more question - which hypervisor are you using?
I mean Virtualbox, VMware, something else ...
bronze jacinth
virtualbox
primal shuttle
Cool - that should make things easier
bronze jacinth
but my friend who's a little more experienced is trying to get me to dual boot
primal shuttle
I'm not sure that's really required, unless you have solid reasons to do it this way
Usually a simple VM should do
bronze jacinth
i eventually also plan on learning ROS, and im not sure what all is required for that (software wise)
primal shuttle
what's ROS?
wooden sail
i dual boot and i'd still recommend wsl or wm instead (depending on what the end goal is). at the end of the day, you won't run any hardcore stuff on your own hardware, so all you need is a suitable environment to do more or less realistic tests before deploying them somewhere else
bronze jacinth
primal shuttle
what's ROS?
Robot Operating System
primal shuttle
Ah - that's out of my scope unfortunately 😦
bronze jacinth
no problem, youve helped plenty
my next doubts will be linux/tensorflow related xD
primal shuttle
🙂 that's the fun bit - but that's already about 1000 times easier than win
But this may be my traumas from the past talking 😉
bronze jacinth
hmm
primal shuttle
By means of entertainment, you can also compose your setup through docker
But that's for another day 🙂
bronze jacinth
one step at a time
steady basalt
bronze jacinth
do you recommed doing this in linux? I have to learn it anyways for my course
mac has bash
mac is the bes tos
steady basalt
works great for me
steady basalt
No
BTW when standardising, if X is exposur and Y is outcome, what is L?
intervention?
currently studying g methods
oh its risk group i think
or its just a confounder?
 pseudo wren
is anyone familiar with the library rasa
i need help
this project is a huge undertaking and the first part is literally just installing rasa
which will not work for some reason
primal shuttle
dontasktoask . com 🙂
pseudo wren
the question was how did you handle installing rasa because installing it has been giving me trouble :)
primal shuttle
What's the trouble 🙂
 mild dirge
pseudo wren
the question was how did you handle installing rasa because installing it has be...
mild dirge
pseudo wren
the question was how did you handle installing rasa because installing it has be...

Install Rasa Open Source on premises to enable local and customizable Natural Language Understanding and Dialogue Management.
pseudo wren
I worked through the installation guide
that was the first thing i did
the thing is there's so many packages abstracted in the actual thing
mild dirge
So where did it go wrong lol, wassp isn't just asking it for a laugh
pseudo wren
that the run time is extremely wrong
I attempted to install rasa in full
and it did not load for 3 hours
this was through colab
i then attempted to install it through command line
and it errored out due to an issue with the dependancies
it cited it being an issue with the package
 fiery vigil
Hi, had a question about eigenvalue solvers in numpy: is there a version of np.linalg.eig that will solve complex symmetric matrices? (not complex Hermitian matrices, for which we have np.linalg.eigh)
wooden sail
a complex symmetric matrix is not a special kind of matrix, as far as i recall
i lied, i always forget the autonne-takagi factorization
primal shuttle
You mean np.linalg.eigvalsh?
If takagi factorisation is what you're after, it involves constructing a Hermitian as its step
wooden sail
In [1]: import numpy as np

In [2]: M = np.array([[1, 1j],[1j, 1]])

In [3]: np.linalg.eigvalsh(M)
Out[3]: array([0., 2.])

In [4]: M
Out[4]:
array([[1.+0.j, 0.+1.j],
       [0.+1.j, 1.+0.j]])

In [5]: np.linalg.eigvals(M)
Out[5]: array([1.+1.j, 1.-1.j])
using eigvalsh yields the wrong result, since it's not hermitian, just complex symmetric
primal shuttle
then I'm not sure, would have to look deeper
wooden sail
i'm fairly sure most solvers don't have an optimized diagonalizer for these kinds of matrices... or at least i've never seen one
but it could be the case that doing takagi by building that intermediate hermitian mat yourself and using eigvalsh is faster than using vanilla eigvals
hmmm nah there's a simultaneous diagonalization step
fiery vigil
wooden sail
a complex symmetric matrix is not a special kind of matrix, as far as i recall
The way cupy (or numpy) defines their solver cp.linalg.eigh. or np.linalg.eigh is:
"Return the eigenvalues and eigenvectors of a complex Hermitian (conjugate symmetric) or a real symmetric matrix."
So there is some limitation (and from what I tried, it does give wrong results).
fiery vigil
wooden sail
hmmm nah there's a simultaneous diagonalization step
so is this possible, using this "takagi" process?
wooden sail
it is, but you can also just remove the h and you're set
or maybe... cupy suffers from the same thing as jax, where non hermitian matrices can only be diagonalized on cpu?
wooden sail
aha
fiery vigil
wooden sail
or maybe... cupy suffers from the same thing as jax, where non hermitian matrice...
yeah, it just throws and error, and then I am left to use numpy.linalg.eig, which is visibly slower
pseudo wren
wooden sail
maybe saying you were missing some build tools?
when you import the library the built tools also import with it. the thing is, the rasa library contains a lot of sub libraries like matplotlib, numpy, and tensorflow. Because of this, the library is huge, and to import what you need, you have to sift through all the sub libraries. it's a little tedious.
fiery vigil
What is this takagi process? Will it help me use cupy.linalg.eigh but on complex symmetric matrices?
wooden sail
it can help you find the singular values of your matrix by doing eigenvalue decompositions on a few intermediate hermitian matrices
but as i mentioned, complex symmetric matrices are not really "special" and are in general not diagonalizable the usual way
i'd say to just use the SVD directly instead
fiery vigil
oh, you mean special like that: I though you meant, "they are no different than other matrices, so it should be usable"
fiery vigil
wooden sail
i'd say to just use the SVD directly instead
what new hell is that? 😅
wooden sail
they are no different than other generic matrices, meaning eigvalsh does NOT work on them
fiery vigil
oh I saw the SVD, forgot about it
 slow tapir
hi y'all, I need some help with a data science task with working with support vector machines. I wasnt sure if I should post that into a help channel or just here because its some kind of a longer task 😅
fiery vigil
wooden sail
i'd say to just use the SVD directly instead
How can I ensure, matrices u and v are inverse of each other?
wooden sail
they aren't in general, and you can't
that's the whole point of what i'm saying
there is no guarantee your matrix is diagonalizable because it's not a special matrix
fiery vigil
It does diagonalize with np.linalg.eig, no problems there
just needed a cupy version of that, to distribute the computation over GPU
wooden sail
what exactly do you need the eigenvalue decomp for? if i may ask
cuz i don't think there's a good solution for this
fiery vigil
These are modes of a system, in which I have to solve the overall problem.
I will use these eigenvectors to write a general superposition for any state of the system
so have to get both the eigenvalues and eigenvectors right
can I write decorators in cupy, like those for numba, jit?
wooden sail
should be doable
fiery vigil
yeah, I guess wherever I can squeeze out some efficiency. It's quite a letdown that cupy didn't bother with an equivalent of general solver np.linalg.eig
thanks for the clarification, it saved me time that would be wasted looking at stuff that wouldn't have worked
wooden sail
yeah i can't find any clever workaround
fiery vigil
oh no worries, eigenvalue solvers always have some catch. At least numpy has a general purpose, complex eigenvalue solver!
wooden sail
if you're willing to try something different, there's a chance the jax eig function does work on gpu, maybe i'm just misremembering
gimme a second to test
fiery vigil
says "symmetric/Hermitian matrices", now the question remains if it is complex symmetric or just real symmetric 😅
 fiery vigil
ah, okay. Well, that's a lot of time saved, again. I was going to dig into this jax and see how to implement it.
snail-pace numpy it is 😔
wheat snow
anybody could help me out rq?
fiery vigil
wooden sail
best of luck
thanks!
wheat snow
wheat snow
<@836605577400549436> I was thinking of a way to plot (in a specific period of t...
here
its about netflix watchdata
primal shuttle
slow tapir
hi y'all, I need some help with a data science task with working with support ve...
What’s up with the SVM
slow tapir
primal shuttle
What’s up with the SVM
I just got a data set and I need to perform calssification using an SVM, make a training, dev and test set out of it etc. im just kinda lost there
primal shuttle
And what specifically are you having trouble with? The splitting part or the actual SVM part?
slow tapir
right now the splitting part, probably after thats done I will have trouble with the SVM part aswell
primal shuttle
Ok, for SVM I'd suggest using stratified sampling
Alternately you could use k-folds
I'll leave it at that, see which one fits your data more and then once it's split I'll answer the SVM questions - fair?
slow tapir
sounds good, I'll try 🙂
primal shuttle
🙂 hint: it has to do with class imbalance, if your dataset indeed suffers from that 🙂
steady basalt
slow tapir
I just got a data set and I need to perform calssification using an SVM, make a ...
have u tried using the split method from sklearn
theres 0 skill required to run data on a sklearn svm so you shud find no problems
slow tapir
df1 = df[["Height (cm)", "Age", "Sex", "DoesGroceries"]]
df1.sort()
random.seed(230)

split_1 = int(0.6 * len(df1)) # 06. of 1.0 is train
split_2 = int(0.8 * len(df1)) # mid between 0.6 and 1.0 is 0.8 for 2x 0.2

train_data = df1[:split_1] # train 0 to 0.6
dev_data = df1[split_1: split_2] # dev 0.6 to 0.8 = 0.2
test_data = df1[split_2:] # test 0.8 to 1.0 = 0.2
thats what I got now for splitting
so train should be 60%, dev 20% and test 20% aswell
primal shuttle
Have you checked that the sizes indeed reflect that?
serene scaffold
slow tapir
```py
df1 = df[["Height (cm)", "Age", "Sex", "DoesGroceries"]]
df1.sort()
random...
your three statements at the bottom are slicing along the columns. use iloc if you want to slice by row position
slow tapir
primal shuttle
Have you checked that the sizes indeed reflect that?
yes I checked that per hand, should I implement three functions that calculate it?
slow tapir
serene scaffold
your three statements at the bottom are slicing along the columns. use `iloc` if...
what does slicing by row positions mean?
primal shuttle
I'm gonna help you with that
serene scaffold
slow tapir
what does slicing by row positions mean?
if you just do df[ ], you're picking columns, not rows. looks like wassp can walk you through it.
slow tapir
serene scaffold
if you just do `df[ ]`, you're picking columns, not rows. looks like wassp can...
hmm but its throwing me an error if I just use one pair of sq brackets
primal shuttle
that is true
slow tapir
I should pick those columns from that dataframe. so I think [[]] is correct
primal shuttle
Yes, you want a list of columns
So if you're creating a data frame from a larger set, then these will pick the columns with all their rows
slow tapir
yes! thats what I wanted/need there:D
primal shuttle
So it will be a matrix of n rows and 4 cols
Yup I'm with you 🙂
I'm writing code for you - hold on 🙂
Are you familiar with the sklearn package? And train_test_split?
slow tapir
im just wondering what random.seed(230) does, what is the number 230 for? (just picked it somewhere from the internet lol)
slow tapir
primal shuttle
Are you familiar with the sklearn package? And train_test_split?
yes I heard about that too but I wasnt sure how to use it there
slow tapir
awesome:D
primal shuttle
the 230 bears no particular meaning in this instance, in can be any number
value
It serves the reproduction purpose
So for example if I want to reproduce your random splits exactly the same way as it has split for you, I need to use the same seed
Does that make sense?
slow tapir
alright, I understand
primal shuttle
In a more technical sense, it "saves" the state of a random function
Anyway
I'll post the code for you, and you'll let me know what it does, ok?
slow tapir
alright, so it makes sense that I keep the random.seed() function, right?
slow tapir
primal shuttle
I'll post the code for you, and you'll let me know what it does, ok?
alright
primal shuttle
slow tapir
alright, so it makes sense that I keep the random.seed() function, right?
Correct - otherwise the RNG (your random function) will split your data differently
If you run your code again
slow tapir
I see, that makes sense
primal shuttle
And it doesn't matter that it's 230, could be 1, or 12345
test_size = 0.2
dev_size = 0.2

X_train, X_temp, y_train, y_temp = train_test_split(X, y,  test_size = test_size + dev_size)

X_test, X_dev, y_test, y_dev = train_test_split(X_temp, y_temp,                      test_size = dev_size / (test_size + dev_size))
(I hope I haven't made a booboo, I haven't tested it)
If you want to demo the seed, here is how you can do it
import random
random.seed(3)
print(random.randint(1, 1000))
random.seed(3)
print(random.randint(1, 1000))
print(random.randint(1, 1000))
alright, so I need to replace X and y, I would guess X is my current dataframe with the new columns, but what is y?
primal shuttle
your label
slow tapir
ahhh
okay
so my label is in my case isOverweight because the first point of the task was to classify if a person is overweight or not
primal shuttle
Yup
slow tapir
and at the start it had true/false values and I converted them to 1/0 values
that was correct labeling, right?
primal shuttle
Cool, yup - python will calculate both 0 and 1 and True and False just the same - False = 0, True = 1
If you were to sum them for example
As a bonus, train_test_split has a random_state option, which is equivalent to our seed
🙂
And if your labels / classes are imbalanced, it also conveniently comes with the stratify option for your pleasure 🙂
primal shuttle
Phew - yay!
slow tapir
so it makes sense to use those two options aswell? or at least random_state ?
primal shuttle
One of them is enough
slow tapir
stratify wouldnt make sense I think, I dont think that my labels or classes are imbalanced
primal shuttle
The stratify option is not a case of "true / false" - it requires a little bit more thinking
But if it was, you can handle it therein
Also, since you're only using the seed for splitting (I don't think you'd use it anywhere else, in your case), it's better to include it in the train_test_split, rather than separately
Makes for a cleaner code
slow tapir
alright
primal shuttle
And for the pleasure of most people I hang out with, the value for seed is 42 🙂
slow tapir
I chose 69 :DD
slow tapir
I do hope, will check real quick
primal shuttle
Awesome - my point exactly
slow tapir
im just a bit confused with those X_train, X_temp, y_train, y_temp variables at the beginning
primal shuttle
What about them?
primal shuttle
X_test, X_dev, y_test, y_dev = train_test_split(X_temp, y_temp, test_size = dev_size / (test_size + dev_size))
You are
🙂
These are all variables, so you can print them at every step
Or view them in whatever way you want
If it's easier for you to visualise
slow tapir
yeah I will do that 🙂
primal shuttle
🙂
It will be better for you to start with a small set as well, to grasp the splits as a whole
So take 10 observations and see how it works
 misty flint

A Python library for quantum machine learning, automatic differentiation, and optimization of hybrid quantum-classical computations. Use multiple hardware devices, alongside TensorFlow or PyTorch, in a single computation.

primal shuttle
@slow tapir any other questions? I'm about to call it a day 🙂
slow tapir
hmm well so far what youve sent me works:D very nice thanks a lot:D
now I need to stratify the data by sex and isOverweight
but I think I can just add it myself to the functions
xD
primal shuttle
Ok you want to stratify at the point of splitting, if indeed your classes are imbalanced
slow tapir
and then the next step would be using a linear SVM for classification
primal shuttle
Is that your task? or your choice?
primal shuttle
Ah ok
primal shuttle
Yes
slow tapir
alright, perfect
primal shuttle
One more tip: scale only the train set
slow tapir
okay, is there a specific reason to it?
primal shuttle
If you scale the test set, it's not "unseen" anymore
slow tapir
ohhh
primal shuttle
In simple terms
primal shuttle
🙂 good luck!
slow tapir
thank you so much for helping out!:D
primal shuttle
Pleasure 🙂
pseudo wren
So I realized that I needed to install a specific version of Rasa to get the library to work in google collab. I imported the Rasa library, and then got hit with an error saying that I couldn't use tensor symbols with numpy. I subsequently upgraded my numpy version to 1.19.5 and then restarted the run time so that the changes could be implemented. Each time i've done that, the run time could no longer connect in my colab notebook despite restarting the browser, notebook, and creating new ones.
I've also changed the order in which i installed the packages thinking that would change it.
steady basalt
Does python statsmodels let u do propensity scores and ipw

 austere swift
So I'm trying to train this model on two different datasets simultaneously, but the problem I'm having is that the model can't have data from both sets in the same batch (each batch has to either be completely the first dataset or completely the second). What would be the best way to have the dataset shuffled randomly while still maintaining that each batch contains only samples from one of the datasets?
would it be better to have it just alternate between datasets or should I just have it randomly select a dataset each iteration
well actually neither of those options would be ideal because I wouldn't be able to reproducibly get the same data if i put in the same index
actually what I could just do is see if the first value in the batch indices is odd or even, and select the dataset based on that
 grave knoll
Suggestions on good certification course for Big Data?
ancient pendant
Hello @wooden sail this is my solution.

But server which checks answer is saying my dimensions are wrong
 wooden sail
huh, it looks like they lied
ancient pendant
My dimension is (4, ) but not (4,1)
wooden sail
maybe they don't want the np.newaxis
oh i read it backwards
or did i? can you try removing the newaxis?
wooden sail
ok, the task description was wrong, then
the thing is that the np ndarray data type does not actually support "true" vectors
if you transpose a 1d array, you get the same 1d array back
that also means that you can multiply the same vector to the left or right of a matrix
it seems to me that whoever wrote the task description was not aware of that or chose to ignore it
what i mean to say is that, using 1d arrays, there is no distinction between row and column vectors
you should mention this to whoever designed the task
the description does not match the tests
ancient pendant
Man I wasted 1 week thinking about this problem, Thanks🙏
I was doubting myself like I am not made for data analysis,
why my brain is not working and now I found out there description was wrong😅 .
ancient pendant
wooden sail
you should mention this to whoever designed the task
Yes I am going to
wooden sail
that one was 100% not your fault, the tests and the description don't match
ancient pendant
Man I am feeling so embarrsed right now I accidently checked another solution🥲 😂
My anser is only 83% right
This is the problem
 wooden sail
seems like you had to remove it from both
ancient pendant
Now I again added np.newaxis to both like in first picture i showed you
Now its right 100%
maybe server problem
this is staff solution
they did it so cool
 austere swift
actually what I could just do is see if the first value in the batch indices is ...
austere swift
austere swift
actually what I could just do is see if the first value in the batch indices is ...
I found a better way, I modified the dataset to take a tuple of (dataset_idx, idx) then modified the batch sampler to give the dataloader these indices
 grizzled stump
Hey guys.
Do you guys feel like Spyder performs better than VS Code, in terms of code execution? Or am I just tripping out?
wooden sail
there shouldn't be much of a difference
 pliant pewter
I don't think either of them is responsible for actually executing code?
grizzled stump
pliant pewter
I don't think either of them is responsible for actually executing code?
Hmmm, you have a point.
I don't know. I just felt like my code completed execution in significantly lesser time than it did on VS Code, for reasons unknown.
wheat snow

i formated a excel file
very easy to understand

depends on the shown information ig
 grave moat
Hey, does anyone know how can I plot on local host using plotly?
 humble mist
Hi does anyone have a dockerfile with tensorflow_1? Thank you in advance
 upper spindle


im trying to read in sample_prices into my jupyter lab
but keeps coming out with an error
 lapis sequoia
Click on the bar at the top of the file explorer to get the proper file path, it should be something like C:/Users... @upper spindle
 lapis sequoia
Put an r in front like this:
That should fix it for you
upper spindle
thank you so much @lapis sequoia
lapis sequoia
No problem 👍
 void lion
which modules are good to learn in relation to AI?
serene scaffold
void lion
which modules are good to learn in relation to AI?
there aren't really libraries where you can learn AI by using them. you have to read about the theory, and then create things using multiple libraries that apply what you've learned.
I have an overview of the main libraries in the pins.
primal shuttle
void lion
which modules are good to learn in relation to AI?
Never learn a subject through a tool - always use tools to help you understand a subject
void lion
i just framed my question wrong
i meant to say what modules in relation to AI are good to learn
 arctic needle
Does anyone know if learning about finances is important in data science/data analytics/BI careers? If yes do you recommend any free course?
serene scaffold
void lion
i meant to say what modules in relation to AI are good to learn
I wouldn't even focus on learning libraries. I would try to do something, and use libraries implicitly while trying to achieve that goal.
steady basalt
arctic needle
Does anyone know if learning about finances is important in data science/data an...
i dont think data science can be compared to most BI jobs
for Bi and analytics yes, for data science no
mild dirge
what's Bi?
tacit basin
arctic needle
Does anyone know if learning about finances is important in data science/data an...
In one DS project i was part of for financial institution, the in depth knowledge of finance filed wasn't required but it was rather nice to have.
Free online MS in financial engineering https://www.wqu.edu/programs/mscfe/

Program page for the MSc in Financial Engineering
steady basalt
mild dirge
what's Bi?
I think its business intelligence
like, making bar charts and stuff
mild dirge
It's like collecting information about a company and converting it into usable data?
steady basalt
tacit basin
In one DS project i was part of for financial institution, the in depth knowledg...
how can a MSc be free? isnt literally everyone and their grandma gona do these free online masters completely fucking the job market?
primal shuttle
serene scaffold
I wouldn't even focus on learning libraries. I would try to do something, and us...
My point exactly
humble mist
humble mist
Hi does anyone have a dockerfile with tensorflow_1? Thank you in advance
Push
steady basalt
are those values in ur dataframe integers or strings
yeah... why?
u know what happens when u add two strings in python right? thats why its appending them and not summing them
ur welcome remember the think in terms of how python works and u will find the answer
misty flint
hmm it depends on their background. if theyre STEM/technical at all, they might like to see some data but maybe a quick ppt would be better

do you know streamlit? you could probably make a quick demo that way as well

 steady basalt
how do people get helper role btw?
serene scaffold
wheat snow
why is everything so complex
things are complicated before you understand it, and simple after.
steady basalt
do you have to volunteer and commit to helping people?
serene scaffold
steady basalt
how do people get helper role btw?
see #roles
misty flint
have you also considered something like using wordclouds? could do some NLP-lite and show most common words associated with each tweet/replies
wheat snow
serene scaffold
things are complicated before you understand it, and simple after.
maybe.... im still dying trying to figure out this
misty flint
it really depends on what you think they are looking for though
steady basalt
there are people in this channel that deserve a nobel prize for the amount of effort they put into help
wheat snow
wheat snow
<@836605577400549436> I was thinking of a way to plot (in a specific period of t...
@serene scaffold
steady basalt
especially the math people
wheat snow
steady basalt
there are people in this channel that deserve a nobel prize for the amount of ef...
@hardy ledge for workin 5 hours straight at a game with me
steady basalt
blessed channel i dont even go into any other rooms in this server lekl
serene scaffold
steady basalt
there are people in this channel that deserve a nobel prize for the amount of ef...
I keep an eye on people in this channel who I think would be a good candidate, but I can't guarantee how quickly those people will be put to a vote with the other mods/admins or what the outcome will be.
wheat snow
@serene scaffold gotta admit, i like that siam in your banner
steady basalt
@serene scaffold maybe most of them wudnt wana be a helper
serene scaffold
wheat snow
<@253696366952316929> gotta admit, i like that siam in your banner
he's a ragdoll
steady basalt
the rest of the server is very much 'go to the help room to get help' but in this channel, its pure help only if asked
serene scaffold
steady basalt
the rest of the server is very much 'go to the help room to get help' but in thi...
well, this is the channel for data science help
misty flint
yeah just try to keep the business questions they are trying to answer in mind. that will help guide the analyses you choose to do vs, and more importantly sometimes, the ones you choose not to do. if they're also a business person, i think slides would be good + having an executive summary at the beginning (tl;dr section)
serene scaffold
steady basalt
help?
 wheat snow
@serene scaffold if you got some time, you could look over that thing i pinged and wanted to do rq
steady basalt
damn i never noticed that
serene scaffold
wheat snow
<@253696366952316929> if you got some time, you could look over that thing i pin...
I'm busy, sorry
 serene scaffold
more like tropical chat amirite
wheat snow
serene scaffold
I'm busy, sorry
not referring to now... just in general... the week maybe
steady basalt
might start spending more time in algos and structs channel in a coupla months, scared for interviews
i suck so hard at them
i literally peak at lc easy
wheat snow
interviews
 wheat snow
nothin i need to worry about rn
steady basalt
i havnt even learnt how to work with binary tree objects
wheat snow

steady basalt
the best i got is a 70% passrate array question
misty flint
what positions are you going to go for
steady basalt
ds
misty flint
have you also considered DE
steady basalt
ive been told even for a da interview i was gona receive arrays and strings questions lmfao
misty flint
since its supposedly hot rn
steady basalt
as if that shit wud ever be useful on the job
misty flint
or something
steady basalt
nah, not interested in de
misty flint
hmm
steady basalt
and also i do not personalyl believe im capable of it
misty flint
ah
misty flint
usually they have a SWE background i think
misty flint
since its usually production level code
steady basalt
its not like im gona stop learning
misty flint
eh i think you could do it in 3 or less if you really try
steady basalt
with a full time job id prob still in my spare time learn coding
misty flint
since it seems like you know a lot
steady basalt
nah not rly
misty flint
steady basalt
with a full time job id prob still in my spare time learn coding
you also have to consider you will be learning on the job too
steady basalt
u prob saw earlier i cudnt even inverse a matrix
misty flint
so you cant discount that component
steady basalt
im still on the learning process early on
steady basalt
ahhh
misty flint
i just come and go like the wind
steady basalt
cheers bud
gona grind the leetcode
and the random stats details they ask
speaking of stats
anyone got a TLDR on why g formula gives u same result as linear regression?
but different ci?
literally nowhere explains this stuff in a simple way its all papers
wooden sail
what's "g formula"? what's ci?
steady basalt
and how do you know if IPW results (different) are better
confidence intervals, sorry

PubMed Central (PMC)
Robins’ generalized methods (g methods) provide consistent estimates of contrasts (e.g. differences, ratios) of potential outcomes under a less restrictive set of identification conditions than do standard regression methods (e.g. linear, logistic, ...
this would speak to you, edd
its estimating effect of exposure ? i think youd find it interesting
wooden sail
nah i'm too tired for this today
i also take maths in medical papers with a heap of salt
wooden sail
they're usually rediscoveries of old stuff with a new name
steady basalt
haha
steady basalt
savage..
serene scaffold
I wanna discover that that the ratio of a radius to the circumference is exactly two times pi
like what are the chances
steady basalt
Any torch users in chat?
serene scaffold
steady basalt
Any torch users in chat?
remember what we discussed about asking to ask?
steady basalt
Do the grad and backward functions alter variables??
I was following the tutorial they have that makes you try a backwards pass
And I call my earlier variable and it has now changed
 sage inlet
Can anyone help me how to extract all the professions from a text file using nltk or spacy?
steady basalt
sage inlet
Can anyone help me how to extract all the professions from a text file using nlt...
Do u have a list of professions u want or is this the problem
sage inlet
steady basalt
Do u have a list of professions u want or is this the problem
I don't have a list of profession, also if I do have how to train a simple model?
in nltk specifically
steady basalt
Use probabilities of words following other sets of words
For example “he worked as a “
Would commonly then give you a professions
sage inlet
yeah I will try it once
steady basalt
I’m afraid I don’t have enough nlp experience to walk u thru it
sage inlet
Also can't we find professions using NER ?
steady basalt
What’s that?
sage inlet
Named Entity Recognition
sage inlet
No we don't need the list actually, but nltk library has pretrained model that can categorize words as PERSON, ORGANIZATION etc
steady basalt
Can try looking for words that come before organization or after ?
sage inlet
yeah we can but I too don't have much experience in NLP to train a model from scratch 😦
wooden sail
it sounds more like they just need a regex or something like that
better ask in the python general channel
sage inlet
I don't think we can use regex for extracting profession
steady basalt
He wants nlp model
sage inlet
steady basalt
He wants nlp model
Precisely.
steady basalt
Ur gona need at least some valid professions corpus
sage inlet
steady basalt
Ur gona need at least some valid professions corpus
Yeah Yeah
 wooden sail
oh well, i'm prepared to be mistaken
 bold timber
hi, anyone can help me? why the amount of rows is so huge? I'm so wondering about that
 sage inlet
bold timber
hi, anyone can help me? why the amount of rows is so huge? I'm so wondering abou...
sage inlet
bold timber
hi, anyone can help me? why the amount of rows is so huge? I'm so wondering abou...
You can try dropping the NA values
bold timber
sage inlet
You can try dropping the NA values
I don't have missing value
steady basalt
How long is ur date variable mate
bold timber
steady basalt
How long is ur date variable mate
the unique value of date is 1684
steady basalt
I bet it’s glitched in like 25000 2017-0101
Unique doesn’t matter
It’s probably repeated a lot of times
Don’t group by but just show the full dataframe
Unique values doesn’t mean anything for dataframe length
bold timber
steady basalt
It’s probably repeated a lot of times
of course, the actual dataset is over 3 million. in this case, I try to grouping that by date and I'm so wonder why it does get over 65k whereas the unique of date only 1684
this is the actual dataframe

can u explain to me why when I group that it gets over 65k rows? @steady basalt
I'm so wondering how did it happen
steady basalt
How many unique sales ?
bold timber
steady basalt
How many unique sales ?
over 370k
bold timber
steady basalt
The date range is only like 5 years?
yeah
steady basalt
That’s weird
bold timber
steady basalt
That’s weird
can you explain to me why?
steady basalt
What if u don’t use to frame how big is the array
Did u get the groupby syntax right
tacit basin
steady basalt
how can a MSc be free? isnt literally everyone and their grandma gona do these f...
you need to have Bachelor’s Degree then this is 2 years free MS course 🙂
steady basalt
😅
tacit basin
or rather 😦
 formal cape
On the job experience in data science seems more relevant than any PhD or masters
To me at least
bold timber
steady basalt
Did u get the groupby syntax right
Like this? It's the same result that I get before
 steady basalt
formal cape
On the job experience in data science seems more relevant than any PhD or master...
steady basalt
formal cape
On the job experience in data science seems more relevant than any PhD or master...
Yeah but if u don’t have a masters ur not gona be selected for most jobs
In the first place
To get that experience
formal cape
Can you remove the mean() argument and see what you get
bold timber
formal cape
Can you remove the mean() argument and see what you get
I get an error
formal cape
It could be that it tries to do some averaging based on both the date and onpromotion length and it returns something funky
keep to_frame(), just remove the mean()
bold timber
formal cape
keep to_frame(), just remove the mean()
it's same, I've tried before
formal cape
What I would try is to create another data frame only with data , onpromotion and sales
Then I'd just write newdataframe.groupby([sales].mean for the new dataframe
 timid kiln
Hey folks, don't know if this is the right place for this question. If not, please gently direct me to the correct channel. Thank you.
I have a software program that has what's called a 'schematic'. On this are a series of dots and lines. I can get the coordinates of the dots, but I cannot get any information about the lines other than what dots they're connected to. What I need to be able to determine, using python, is if the line between two dots crosses another line. I was wondering if there was a module or library in python that has this kind of functionality built in?
I know enough about math to create the equation of the line and get it in slope-intercept form and then calculate if the lines intersect but, just wondering if I do that if I'll be reinventing the wheel.
Here's a representative diagram of what I would see in the software:

brb
wheat snow
@bold timber since you are using the same date thingie as in my project, i have a question for that (short: I want the user to input 2 dates e.g. 2019-04-21 and 2019-11-21 and my programm should notice that this is like 7/8 months and should generate an average watchtime hours for each month( so 8 values))
formal cape
Put each point of every line in a set and then use set intersection https://www.w3schools.com/python/ref_set_intersection.asp

W3Schools offers free online tutorials, references and exercises in all the major languages of the web. Covering popular subjects like HTML, CSS, JavaScript, Python, SQL, Java, and many, many more.
There's probably other ways but this is what first pops to mind
wheat snow
wheat snow
<@836605577400549436> I was thinking of a way to plot (in a specific period of t...
here is the exact thingie @bold timber
it is a netfliux watch time analyses btw
bold timber
formal cape
Then I'd just write ```newdataframe.groupby([sales].mean ``` for the new datafra...
it get an error
bold timber
wheat snow
<@786960616664727572> since you are using the same date thingie as in my project...
what the question is?
bold timber
formal cape
Did you write the entire line what's the error?
like this
 formal cape
Syntax is wrong sorry. It should be df_train.groupby(['sales']).mean()
bold timber
formal cape
Syntax is wrong sorry. It should be ```df_train.groupby(['sales']).mean()```
I'm sorry, that is my fault. This is the result is:
 bold timber
formal cape
That only contains onpromotion and date
bold timber
formal cape
That only contains onpromotion and date
With groping certain column or not?
formal cape
I think you can do a newdf = d_train.filter('date', 'onpromotion', 'sales', axis=1)
timid kiln
formal cape
Put each point of every line in a set and then use set intersection https://www....
Thank you!
bold timber
formal cape
I think you can do a ```newdf = d_train.filter('date', 'onpromotion', 'sales', a...
 formal cape
Then do the newdf.groupby(['sales']).mean()
This is weird
newdf = df_train[['date', 'onpromotion', 'sales'] ].copy()
bold timber
Well yeah, I think I will get rid of my curiosity for that case now because I still have a lot of things to solve hahaha
but, thank you for the discussion👍
wooden sail
there must be some library that does this automatically, but also doing the math by hand isn't that difficult at all. instead of writing the lines in slope-intercept form, you could write them in parametric form. for example, given points a and b, the parametric form of the line is given by f(t) = a + t(b-a) for t in the interval [0,1]. then for another pair of points c and d, we do the same and get g(u) = c + u(d - c). if you subtract these two equations, there should be a point parameterized by t and u for which the difference is 0. that's the point where the two segments intersect. it can be found by inverting a 2x2 matrix, which you can do by hand or using numpy or something of the sort. then, if both t and u are in the interval [0,1], the two segments intersect, and they do so at the point you find by substituting either of the two parameters t or u into its own parametric line equation
@timid kiln
steady basalt
bold timber
Well yeah, I think I will get rid of my curiosity for that case now because I st...
Work with the underlying dictionaries and arrays
You will find answer