#data-science-and-ml
1 messages · Page 407 of 1
 versed gulch
 wooden sail
of an image? of a 3D object/point cloud?
versed gulch
wooden sail
of an image? of a 3D object/point cloud?
of an image but aswell a 3D image but viewing each 2D slice
wooden sail
the easiest way to get something similar a MIP, then, is to take your 3D data made up of L slices of size M x N, and then keep the abs(max()) along the L axis, and put that into a 2D array of size M x N
versed gulch
so np.max(arr3d, axis = 0)?
wooden sail
in numpy that'd be something like np.amax(np.abs(my_cube), axis=whatever_axis_has_the_slices)
yeah
i don't remember what exactly the difference is between amax and max, but i never use max. lemme read up
oh it seems they do the same
btw this IS a type of MIP, but maybe not the usual one you find in papers. it's an orthogonal projection onto a 2D plane instead of a projective plane/something like a pinhole camera. the latter requires something like ray tracing to find the maxima along rays radiating from some prescribed origin
i think in medicine applications, this approach i suggested is called a "C-Scan"
versed gulch
wooden sail
oh it seems they do the same
okay so the latter isn't available to do on python?
wooden sail
the latter what? using a projective plane?
idk if there's a library for it. i do stuff like that, but i code it all by hand
you need a lot of extra geometric information, and having 3D images is not enough without that
versed gulch
wooden sail
you need a lot of extra geometric information, and having 3D images is not enoug...
hmm okay thanks for your help
but im working with medical images, so it seems this maybe near impossible to get those rays
wooden sail
some of that can be chosen rather arbitrarily depending on what aspect ratio and field of view you want
the most important part is the physical spacing between pixels and slices
i think last time we spoke you didn't have that for your images
whatever system you used to collect the images HAS that information. it needed it to make the images in the first place
as a side note, the two techniques above are exactly identical if the focal point of the "pinhole camera" moves infinitely far away from the imaging plane
and in that case, exact geometric parameters don't matter, just that you have aligned slices, which you probably do
versed gulch
wooden sail
the most important part is the physical spacing between pixels and slices
yh but the info I have know is that the voxel sizes are of ~0.8x0.8x1.6
wooden sail
oh, that's all the info you need, then
you can set up a ray tracer based on that
this involves only intersections of rays and planes, so it's not that complicated at all
a random google search spits out a handful of libraries that do stuff like this https://gist.github.com/fepegar/a8814ff9695c5acd8dda5cf414ad64ee. i can't comment on whether they're safe or good
versed gulch
okay thanks I'll keep this for future work if needed
 serene scaffold
 chilly abyss
Pls is it possible to get a base-code for p2p energy trading?
chilly abyss
Pls is it possible to get a base-code for p2p energy trading?
is this data science related?
chilly abyss
Oh sorry about that, I m actually doing digital energy course which implies machine learning..
So it is not directly data sci related, however it has a machine learning application.
 topaz prairie
I've posted a tensorflow question over in #help-pancakes if anyone is willing to take a look. Thanks.
 gloomy anvil
Hey y'all! Quick question: If the probability distribution of a model on the test set looks like this, is it safe to say, that the test data is inherently different from the training data? I mean that must kinda be the reason why the confidence or probability is that low, right?

 mild dirge
probability, of what?
gloomy anvil
oh shiat I just realized I made a stupid mistake
I am sorry

I am doing a binary classification and also saved the probabilities of the classifications. I just realized it is basically 1 if the probability is above 0.5 and 0 if the probability is below 0.5
gloomy anvil
yes. i used predict() and predict_proba() for each model. I thought predict_proba() would return how probable the prediction of 1 or 0 was.
mild dirge
well the prediction is deterministic for most models
So unless you did this multiple times, I don't see what this probability is
what library are you using that has this function?
gloomy anvil
i used the sklearn models. There they have a .predict() and .predict_proba() function for each model.
mild dirge

Seems to be for a multi-class model if i'm not mistaken
So instead of having an output 0 or 1, you'd have [1 0] or [0 1]
But instead of having a perfect [1 0] or [0 1] you'd get stuff like [0.95 0.05]
So predict_proba gives these values
gloomy anvil
yeah, i just saved the probabilities for the true class, since the false class is basically 1 - true class probability
mild dirge
alright, so it gives the absolute difference between the correct output, and your prediction then?
or 1 - this abs difference?
gloomy anvil
no it is basically like you said. if the true class probability is 0.95, then the probability returned for the false class is 1-0.95 = 0.05
so yeah, thank you for your help
mild dirge
alright, as long as you understand it 😛
gloomy anvil
I just thought there might be some takeaway from the probabilities and plotting them
But I'll probably just stick to my ROC curves
mild dirge
I've personally never used them, it's probably best to just use accuracy/recall/precision/f1 score
instead of this
and roc ^^
gloomy anvil
yeah I have them as well. The predict_proba() function actually comes in quite handy in order to create the ROC plots
thanks again for your help!
greetings from Germany!
mild dirge
Greetings from your neighboring NL
gloomy anvil
mild dirge
Greetings from your neighboring NL
De Mazell! (if google translate is correct 😄 )
mild dirge
hahaha
 unkempt sage
Hello there! Is there anyone working on Keras? I am trying to write a custom keras metric for a given function but cannot do it.
mild dirge
Please ask a concrete question, such that people can immediately help you with your problem 😉
unkempt sage
I am trying to write a custom keras metric for this function
 mild dirge
Is there anything special about a metric function for keras?
unkempt sage
But could not understand how backend works here
unkempt sage
mild dirge
Is there anything special about a metric function for keras?
I am not sure whether this is relevant or not :(
mild dirge
Apparently it's just a function that takes the true labels, and the predicted labels
But these are tensors, which is why you have to use keras.backend
Look at this page for the functions https://keras.rstudio.com/articles/backend.html

@unkempt sage
You see functions like k_abs which you probably need
unkempt sage
Thanks :)
 manic heron

reddit
0 votes and 1 comment so far on Reddit
a little tutorial in python and a cool result 🙂
let me know if you have any questions, as i'm the author

reddit
0 votes and 5 comments so far on Reddit
 odd meteor
gloomy anvil
odd meteor
gloomy anvil
Which IDE are you using? Spyder? How were you able to colour your DataFrame? 🙂
 hasty mountain
Uh... Is it just my impression or BatchNorm layers really messes up with GANs? The higher their momentum, the more segmented my output gets...
I'm testing this right now, but it feels like at the same time it makes generating "outputs"(it doesn't generate what I exactly wanted, just some noise that vaguely reminds of a generated image) faster it also fragments the image into 9 squares, trying to generate 9 different images.
 lapis sequoia
Anyone know how to create and activate a conda environment from cmake? I tried the following in a CMakeLists.txt file but the conda activate command does not work when called from cmake.
# Create and activate a Python environment.

cmake_minimum_required(VERSION 3.18)

# Define the project
project(MyExample)

# Specify the C++ standard
set(CMAKE_CXX_STANDARD 17)
set(CMAKE_CXX_STANDARD_REQUIRED True)

# Make sure Python is installed
find_package(Python REQUIRED)

# Activate conda environment, assume Anaconda or Miniconda is already installed
if(EXISTS /opt/miniconda3/envs/myenv)
    execute_process(COMMAND conda activate myenv)
else()
    execute_process(COMMAND conda create --yes --quiet --name myenv python)
    execute_process(COMMAND conda activate myenv)
endif()
 fleet musk
hi guys, so i have a query on plotting charts from pandas(matplotlib)
import datetime as dt
import yfinance as yf
import pandas as pd

stocks = ["AAPL","GOOG"]
start = dt.datetime.today()-dt.timedelta(4000)
end = dt.datetime.today()
# dataframe to capture all closing prices
cl_price = pd.DataFrame() # empty df to fill with close price of tickers

# looping over tickers and creating a dataframe with close price, 1D-tf
for ticker in stocks:
    cl_price[ticker] = yf.download(ticker,start,end)["Adj Close"]

# dropping NaN values
cl_price.dropna(axis=0,how="any",inplace=True)
cl_price.plot()

so i have not explicitly imported matplotlib, but matplotlib is installed in the virtual environment,
here in the code, pandas and spyder IDE are enough to display the plot

my problem is, by default the plot is a curve

can i make it bar graph?? if so , how? i am unable to figure out what to give for the x,y values
cl_price.plot(kind="bar",x= ,y= )
x and y are necessary for bar plot
 fleet musk
 tacit basin
```py
cl_price.plot.bar()
```
https://pandas.pydata.org/pandas-docs/stable/refer...
tacit basin
```py
cl_price.plot.bar()
```
https://pandas.pydata.org/pandas-docs/stable/refer...
aye aye aye miwojo. long time 😃
so these are simple panda built in plot commands, hmm hmm
it needs matplotlib to work i mean, but even without calling in tht file it works
ok thanks
i spent time learning plots, but still at 0.5/10
!solved
ok. my bad
tacit basin
pandas uses matplotlib as default plotting backend

Stack Overflow
When I use pandas df.plot() it has matplotlib as a default plotting backend. But this creates static plots.
I would like interactive plots, so I have to change the pandas plotting background.
How ...
 winged slate
Hi,
I was training my atari rl model and saw that when ever training is done python stops responding and I need to restart the kernel. There weren't any error messages but the ipython notebook showed "Dead kernel" with a pop up saying the kernel will restart it self. I am training the model locally on my laptop. Idk how to check the status of memory. This guy on stackoverflow: https://stackoverflow.com/questions/52123009/jupyter-python-kernel-dies-openaiappears to have the same issue as me but he has no answers. Pls help!
Thx
Stack Overflow
I am new to reinforcement learning and I am trying to use OpenAI Gym environments.
First, I installed gym by this command: !pip install gym in jupyter
And after running again to making sure it is
 urban lance
I have a rather strange question
I got a dataframe of 7 columns with all True and False values
And I want to make an 8th column equal to the index (or better the column name: probably "df.column[index]") of the most right True value in that row
What would be the most efficient way to do this?
ex:
[False, False, True, False, False, False, False]
[False, False, True, False, False, True, False]
[True, True, False, True, False, False, False]
8th column
[2]
[5]
[3]
output:
[False, False, True, False, False, False, False, 2]
[False, False, True, False, False, True, False, 5]
[True, True, False, True, False, False, False, 3]
is this explanation clear enough?
wooden sail
how large are the rows?
one way is to get the row, and use argmax (perhaps from numpy) on the reversed row
idk if pandas has something similar to argmax built in
yes, df.idxmax(axis=the_axis_of_the_rows {this is zero by default, probably don't have to change it})
then just keep the last element of each row of the result
urban lance
wooden sail
idk if pandas has something similar to argmax built in
s[s==True].last_valid_index()
s[::-1].idxmax()
well there are 3.800k rows zo I'm not gonna iterate through them
I want a time efficient method
urban lance
wooden sail
then just keep the last element of each row of the result
this takes years and my ram suffers 😅
winged slate
winged slate
Hi,
I was training my atari rl model and saw that when ever training is done py...
Any help will be highly appreciated
wooden sail
urban lance
s[s==True].last_valid_index()
s[::-1].idxmax()
since you can specify the function to run over the rows axis, there is no need to iterate. i just broke it down into rows so it was easier to explain.
wooden sail
urban lance
s[s==True].last_valid_index()
s[::-1].idxmax()
the second one you wrote, if you specify axis='columns', does what you want for all rows at the same time
urban lance
you know what @wooden sail I believe ".idxmax(axis=1)" worked!
I'm baffled really
Such a simple solution
lemme double check
wooden sail
that's the same thing as i wrote, sure
urban lance
thanks!
wooden sail
you do need the ::-1 though
urban lance
does idmax take the fiest one then?
wooden sail
yes
and as a sidenote, 3800 rows should still be pretty fast to iterate over 😛 that's on the small side still unless you have a couple 100 thousand columns per row
urban lance
I solved it by swapping the order of my columns (the ::-1) wasn't working 🤔
but it doesn't make a difference for me in this case
urban lance
wooden sail
and as a sidenote, 3800 rows should still be pretty fast to iterate over 😛 that...
let me check how fast it runs
wooden sail
urban lance
I solved it by swapping the order of my columns (the ::-1) wasn't working 🤔
bu...
aight, that achieves the same thing, so it should also work. good that you know the pandas-specific tricks
urban lance
the program takes 3.04s (but that's with specifying the order, changing the dtype (for some reason they're objects) and the idxmax() function
so pretty good 🙂
and there are 3.222.450 rows
wooden sail
ok yeah, then it's getting beefy
wooden sail
was that 3s iterating or using the method from above?
btw reversing the order of the columns in place is a better solution than [::-1] if you're having memory issues. the latter makes a copy, however briefly, of the dataframe. i would hope the former doesn'T
urban lance
the ".idxmax(axis=1)"
I had memory issues when I tried to loop over every row and take the last true value 😅
I knew it was an afwul strat but couldn't think of a better way yesterday
Creaamm also needs assistance with a question, we're kinda spamming the chat 😅
wooden sail
aight, i'll be omw. sadly i don't have an answer for cream
urban lance
winged slate
Hi,
I was training my atari rl model and saw that when ever training is done py...
this hasn't occured to me when I was running something. My kernel dies sometimes out of inactivity
me neither, I know people who trained their models for days/weeks and didn't have such issues
issues where no error is thrown are the worse
 dusty valve
can anyone recommend a good tutorial on how to build a language prediction model on a dataset, all the ones i've see so far use older versions of tensorflow, throw errors that i can't fix or don't work.
 sour tide
Heeelllo guys....I wanted the help of you guys to identify any content based recommender system in python which give a certain attribute more importance. I am saying this as i need a system which recommends movies to user according to the movies they watched mainly by the mood of the movie and then the other categories like actor, studio, genre etc. So far all the recommender systems I found online were not including this feature, but i also want to ask that i want to make a mood based recommender system, so is my approach fine as described above as i want to search by mood first like my algorithm runs the cosine similarity with mood first then all the genres. Is that approach good in making my mood based recommendation system or there can be any other way for recommending a movie by mood first in the algorithm like giving more priority to it then the other categories. It would be highly appreciated if i can receive a link or a you tube video explaining this program and code and also want the advice of you guys.
Thanks and if anything is unclear lemme know. Sorry my English is not very good
hasty mountain
winged slate
Hi,
I was training my atari rl model and saw that when ever training is done py...
Hey, I don't really know how to solve this, but I've used a slightly different code to make an AI play Street Fighter in Gym Retro and it worked. Maybe this can help you:
env = retro.make(game="StreetFighterIISpecialChampionEdition-Genesis", state="ChunLiVsBlanka.1star")
env = wrapper(env)
model = PPO2.load("D:/Python/Projects/Hakisa/rl_model_1000000_steps")
obs = env.reset()
total_reward = []
steps = 0
end = False

while end != True and steps < 100:
    env.render()
    action, state = model.predict(obs)
    obs, reward, end, info = env.step(action)
    steps += 1
    total_reward.append(reward)
    time.sleep(0.05)
The script runs normally and will close after reaching 100 steps. env.close and env.render(close=True) seems more like... "code-breaking" , at least for me.
winged slate
hasty mountain
Hey, I don't really know how to solve this, but I've used a slightly different c...
Hi thx a bunch for ur response but I tried this and it didn't work. Here is my code for reference: episodes = 5
#Import Dependencies
import gym
from stable_baselines3 import A2C
from stable_baselines3.common.vec_env import VecFrameStack
from stable_baselines3.common.evaluation import evaluate_policy
from stable_baselines3.common.env_util import make_atari_env
import os
from gym.utils import play
environment_name = 'Breakout-v0'
env = gym.make(environment_name, render_mode='human')
episodes = 5
for episode in range(1, episodes+1):
obs = env.reset()
done = False
score = 0
while not done:
    action = env.action_space.sample()
    obs, reward, done, info = env.step(action)
    score+=reward
print("Episode:{} Score:{}".format(episode, score))
env.close()
winged slate
urban lance
this hasn't occured to me when I was running something. My kernel dies sometimes...
Yep, very frustrating when no error comes up just a glitch takes place 😦
 arctic wedgeBOT
Hey @somber prism!
You either uploaded a .txt file or entered a message that was too long. Please use our paste bin instead.
 somber prism
hi , https://paste.pythondiscord.com/susihicoqe . i have face images around 950k+ images , but i am only loading 50k images, when i try to load these images using tf data dataset and when i try to load the batches for training these images , it always uses more ram and ends up exceeding the ram limit . can someone help me correct this code
im pretty sure its not my model thats taking up all the ram , it becausse of loading all the batches during training or even if i try to load all the batches simply by doing this test code ```
epochs = 2
for epoch in range(1, epochs + 1):
print(f'Epoch {epoch} / {epochs}')
for ind, batch in enumerate(train_data):
print(f'Reading batch num : {ind}')
 rugged skiff
hello can anyone would kindly explain this error to me, I am newbie in deep learning and would appreciate your help. Thanks in advance.

this is how the model was created
transfer_model = tf.keras.applications.ResNet50(
     include_top=False,
     weights="imagenet",
     input_shape=(240,240,3),
     pooling='avg',
     classes=2,
    )

for layer in transfer_model.layers:
      layer.trainable = False

resnet.add(transfer_model)
resnet.add(Flatten())
resnet.add(Dense(512,activation='relu'))
resnet.add(Dense(2,activation='softmax'))
resnet.compile(optimizer=Adam(learning_rate=0.001),loss='categorical_crossentropy',metrics=['accuracy'])```can anyone help with an error
i'm trying to translate each value in a column, but after the 78th iteration it gives the error 'TypeError: sequence item 2: expected str instance, NoneType found'
for x,y in df.iterrows():
        df.loc[x, 'translated'] = ts.google(y['tweet'])
        print(y['tweet'])
 mental cairn
You probably have a NaN at the line 77
lapis sequoia
even after filling in all the NaNs it gives the same error
lapis sequoia
what do you mean?
mental cairn
If I understand correctly, you want to translate a column df["tweet"]and place it into another column df["translated"]which basically comes to df["translated"] = df["tweet"].apply(ts.google)right ?
lapis sequoia
yes exactly! and the first rows work, after a while it gives an error
mental cairn
Okay, so this error means that somewhere in your column df["tweet"], you have a value which is not a string
To easily check that, we can select the rows in that column which are not a string
To do this, we can just transform the values in their corresponding type and check if this type is str
so you first select their type df["tweet"].apply(type) and then you check if they are str : df["tweet"].apply(type) != str and finally you select only those rows : df["tweet"][df["tweet"].apply(type) != str]
lapis sequoia
so to check that, i did:
for x,y in df.iterrows():
    if type(df.loc[x, 'tweet']) != str:
        print("hoi")
which gives no results, which indicates that every value is a string?
mental cairn
normally yes
you can also check for the type before translating
i.e ```python
for x,y in df.iterrows():
if type(y["tweet"]) == str:
df.loc[x, 'translated'] = ts.google(y['tweet'])
imma try that rn
lapis sequoia
it is a pandas df
 sonic flicker
But the issue is U got nan values I think
lapis sequoia
df.fillna()
lapis sequoia
i replaced them all with strings
sonic flicker
Does it work?
Oh U did already oh sorry idk
I think you can specify dtypes
That may help.
Pandas might be reading the column as an object
lapis sequoia
filling in all the nans gives the same error
lapis sequoia
good point
lapis sequoia
yes dtype is object
lapis sequoia
running it right now
sonic flicker
Good luck
 unique flame
Anyone here familiar with YOLOv4 and inferencing?
lapis sequoia
well it keeps giving the same error
sonic flicker
Oh sorry idk
rugged skiff
hello does anyone know what to do with this?
code
checkpoint = tf.keras.callbacks.ModelCheckpoint(filepath='/content/drive/MyDrive/NewApproach/mymodel.h5', verbose=2, monitor='val_accuracy', save_best_only=True, mode='auto')
error:
WARNING:tensorflow:Can save best model only with val_accuracy available, skipping.
somber prism
rugged skiff
hello does anyone know what to do with this?
code
```checkpoint = tf.keras.callb...
for every epochs if the current epoch's val accuracy is greater than the any of the prev epochs then it will save the model
 hollow sentinel

i’m sorry but this makes me die laughing
i see this as a common answer every time someone asks it
 sonic jetty
Hello, can you suggest documantation about Dask xgboost? I am trying but I get result 0.5 with DaskXGBoostClassifier
serene scaffold
hollow sentinel
they're not wrong, though 
wooden sail
yeah idk what's funny about it. those are pretty much the bare minimum to understand what you're doing when you use preexisting libs, and probably not enough to produce your own, new results
winged slate
winged slate
Hi,
I was training my atari rl model and saw that when ever training is done py...
Plh help, Thx
 bold timber
How to calculate this area using integral?

 pliant pewter
You would integrate the constant density 1 over the region in the plane
 quasi blaze
lol
pliant pewter
You can probably find better coordinates that make the region easier to express. In that case, you'll pick up a Jacobian from the coordinate transformation.
 tidal bough
Is that blue line even supposed to be like that, or was it plotted in unsorted order by accident?
pliant pewter
Oof
 sacred oriole
How to get started? If you were starting now... what tips would you tell yourself?
 fringe summit
Hi, I am doing a battery modeling. I have a set of parameters (R0,R1,R2,tau1,tau2) and dependent variables 't' and 'I'. But the problem i am facing is after certain datapoints in the dependent variable the value of parameters changes to a new set of values and this process continues several time . what i am looking for a code to change the parameter values periodically wrt the change in dependent values ('I' ,'t').

 serene scaffold
fringe summit
Hi, I am doing a battery modeling. I have a set of parameters (R0,R1,R2,tau1,tau...
serene scaffold
fringe summit
Hi, I am doing a battery modeling. I have a set of parameters (R0,R1,R2,tau1,tau...
sorry but I'm not following
can you expand on "the value of parameters changes to a new set of values"
so you're trying to do a certain calculation for each of these rows, and there's two additional values, l and t, and these values stay the same for a certain subsequence of the rows?
fringe summit
serene scaffold
sorry but I'm not following
I have a data frame with column names I and t , It is having 1 lakh data points, I have an equation as defined in the above function to get values of Vt from I and t .
Vt is connected to I and t using this parameters (R0,R1,R2,tau1,tau2). This parameters values are not fixed
It changes for every 4000 points
serene scaffold
fringe summit
It changes for every 4000 points
I would add l and t as additional columns, where the value changes every 4000 rows.
and then you can do vt = df['OCV'] - (df['I'] * df['R0']) ... and it will do it all at once.
fringe summit
That is for the first 4000 points of I and t , parameter values are as shown in the index 0, and for next 4000 it changes to the values as shown in the index 1 and so on
serene scaffold
fringe summit
That is for the first 4000 points of I and t , parameter values are as shown in ...
do you have the values of l and t in arrays? because you could use np.repeat, or something like that
wooden sail
i would not use a dataframe for that, but rather numpy arrays. then you can arrange t and i as columns of a matrix, and the other parameters each as a row vector. the numpy evaluation will automatically broadcast without storing copies of the params
bold timber
pliant pewter
You would integrate the constant density 1 over the region in the plane
How?
serene scaffold
wooden sail
i would not use a dataframe for that, but rather numpy arrays. then you can arra...
did you see their formula?
wooden sail
serene scaffold
did you see their formula?
yep, what about it?
those can all be done elementwise
serene scaffold
wooden sail
yep, what about it?
seems like numpy would at best be worse at expressing their intentions than pandas
wooden sail
serene scaffold
seems like numpy would at best be worse at expressing their intentions than pand...
how come?
the function would look exactly the same
serene scaffold
wooden sail
the function would look exactly the same
hmm, I see what you mean now
serene scaffold
In [67]: np.repeat(np.arange(5), 3)
Out[67]: array([0, 0, 0, 1, 1, 1, 2, 2, 2, 3, 3, 3, 4, 4, 4])
anyway, you can get arrays for i and t like this.
fringe summit
I have 25 rows for this dataframe and 1 lakh points in another data frame (I,t) and need to get 1 lakh points of Vt, by periodically changing parameter values
 serene scaffold
let's see what Edd says
wooden sail
import numpy as np
import matplotlib.pyplot as plt

#let's just use simple exponentials for now
def myFunc(t, x, c):
    '''
    t: size Nt x M array with Nt time values for each of M curves
    x: size 1 x M array with exponents for each of M curves
    c: size 1 x M array with constant offset for each curve

    returns:
    curves: size Nt x M array; each of the M columns is a curve

    '''
    return np.exp(-t*x) + c

Nt = 100
M = 3
t = np.ones((Nt,M))*(np.linspace(0, 10, num=Nt).reshape(Nt,1))
x = np.array([1,2,3]).reshape(1,M)
c = np.array([0, 0.2, 0.3]).reshape(1,M)

curves = myFunc(t,x,c)
for m in range(M):
    plt.plot(t[:,m], curves[:,m])
plt.show()

ofc the columns of t could've been different too
you get automatic broadcasting when the dimensions of the arrays allow it, so keep track of the sizes of t, I, and the other params
 keen root
anyone here experienced with arrayfire-python?
I want to try to speed up a routine by trying to take advantage of the gpu, but I'm far too inexperienced to do this correctly and so far my approach has slowed down the already written code by a factor of 10x
The thing that's annoying me the most right now is how to use af.ParallelRange(). It simply does not want to work. I run it on jupyer lab and it gives an error every other try, and when there's no error, it does nothing
I have no idea what's going on
wooden sail
ah and btw if the t axis is the same each time, a single column suffices
wooden sail
wooden sail
```py
import numpy as np
import matplotlib.pyplot as plt
#let's just use simple...
@serene scaffold something like this is what i had in mind. pardon the ping, idk if you were expecting one or not but you seemed to suddenly dematerialize
 frigid elk
i've got a dataset of 300k rows and 35 columns, ... 10 of those are categories. .. categories like industry, sub industry, state, country, k means group. .... should i cut back on the number of categories, .. how do i know when i have too many? ... or does it not matter since they are all encoded and treated as features (integer) within the model.
pliant pewter
Lakh isn't standard English, by the way. I forget how much it is, is it 10 thousand?
serene scaffold
wooden sail
<@253696366952316929> something like this is what i had in mind. pardon the pin...
I'm at work, so I dematerialize when I remember to do work
pliant pewter
Imagine being corporeal
lapis sequoia
pliant pewter
Lakh isn't standard English, by the way. I forget how much it is, is it 10 thous...
100,000
 lilac root
having some issues in #help-honey and someone suggested asking for help here
 hard shuttle
How to get this line?
print(df.groupby("iso_code").mean())``` serene scaffold
hard shuttle
How to get this line?
```py
print(df.groupby("iso_code").mean())```
serene scaffold
hard shuttle
How to get this line?
```py
print(df.groupby("iso_code").mean())```
.iloc[0] at the end of that
or .loc['ABW']
pliant pewter
So I've started working through O'Reilly book, and it's already given me deprecated Python, so that's nice 😄
 loud cove
Hi, I'm trying to do K mean clustering and it seems like the loweest k gives the best results, this seems weird to me.

this is for text classification, i made the features to be at 8000
 loud cove
it does make sense given that the clusters are strongly at a certain group

 celest flax
i have been working on an ai to auto beat mario 1-1 on its own, but i dont know what data set for the ai to create when it dies
would it be like ([deathx, deathy], actionperformedatdeath)
?
tidal bough
So, are you doing Reinforcement Learning?
celest flax
yes
 ancient sorrel
could someone take a look in help-coffee i have a problem related to ai and ml
 atomic tide
!warn @loud temple Keep your comments server-appropriate please #code-of-conduct
arctic wedgeBOT
:incoming_envelope: :ok_hand: applied warning to @loud temple.
 ebon wedge
hiii everyone hope you guys are good
i have a little problem and i don't know how to fix it
if anyone can help me

 tired lava
yo
mild dirge
ebon wedge
What shape is Y_train? @ebon wedge
It seems to make sense that the shape cannot be broadcasted right?
ebon wedge
mild dirge
What shape is Y_train? <@338576260051501057>
hi it's (256,356,1)
mild dirge
you understand what the error means?
ebon wedge
yes
i don't know how to fix the shape
i tried with np.expand_dims
didn't work don't know why
mild dirge
ebon wedge
hi it's (256,356,1)
Are you sure? you define it as shape (NB2, IMG_HEIGHT, IMG_WIDTH, 1)
So it wouldn't be 256, 356, 1
what library are you using for your model btw
ebon wedge
tensorflow
mild dirge
Could you change the 1 in the line where you define Y_Train at the top? (to 3)
and then don't expand dimensions
mild dirge
got it working @ebon wedge ?
 misty flint
serene scaffold
I'm at work, so I dematerialize when I remember to do work
misty flint
serene scaffold
I'm at work, so I dematerialize when I remember to do work
we are the same person

mild dirge
Because first you only allocated enough space for 1 channel (gray scale image)
but the mask is 3 channels (like rgb)
@ebon wedge
mild dirge
😬
Well they're not loaded in as such haha
cv has a load grayscale image function iirc
ebon wedge
xd
mild dirge
you could always convert from rgb to grayscale
cv2.IMREAD_GRAYSCALE
pass this together with cv.imread()
so cv.imread(path stuff, cv.IMREAD_GRAYSCALE)
@ebon wedge
ebon wedge
i'll try this
misty flint
i feel like i had the same issue back when i worked with opencv
like
a year ago
💀
mild dirge
what issue?
ebon wedge
i am trying to do mammography segmentation
i have images and masks
the images are rgb
and masks are grayscale
mild dirge
masks are just 0 or 1 for each pixel?
ebon wedge
no
ebon wedge
do i need to convert it to binary first ?
mild dirge
Normally a pixel either belongs to a class, or it doesn't
or it belongs to 1 of multiple classes
Otherwise it is some sort of regression per pixel right?
ebon wedge
mild dirge
Otherwise it is some sort of regression per pixel right?
no i don't think so
sorry it's a first for me so i am kind of lost
mild dirge
Well it's good to know what the data is supposed to be
otherwise you might be reshaping it to some wrong shape
ebon wedge
can i add you and talk about this later ?
i really need to go rn
and thank you
@mild dirge
 slate hollow
are there any conventions for naming panda df columns?
i name them as i would name normal python variables but
 royal crest
I personally prefer snake_case_names but i've seen my colleagues use camelCaseNames
 fleet musk
hi guys
so im working on something
and when retreiving data from the package, it creates a datafram with only named columns
how can i change index column from name, to numerical index starting at 0
 sick fern
Hey guys, I'm working on an opencv project to help blind people. I'm trying to make a project that checks if any obstacle is in front of a camera. My question is: How do I detect ANY object in front of a camera? If someone could help that'd be great.
pls ping if you have any idea
 feral acorn
Hello, in a GAN model, if the generator produces an output which can be accepted by the discriminator easily then will the generator keep reproducing the same output? If yes then is it a normal situation?
 tiny swallow
The errors are purely related to tests written for the code. Your output is simply not matching that what you are expected to output.
The messages contains information about what is expected vs what you gave
I cannot tell you more as I do not know more about the problem that you are attempting to solve
 ancient pendant
tiny swallow
The errors are purely related to tests written for the code. Your output is simp...
ancient pendant
tiny swallow
The errors are purely related to tests written for the code. Your output is simp...
I am so sorry I accidently sent this in wrong group😅
@tiny swallow But thanks🙏
tiny swallow
No problem
Question: I have a pandas dataframe of N columns. Each column contains measurements(as floats64s).
Now I want to create another dataframe where for each column I create a row with common information like mean, stddev, min, max
Example of how my first dataframe could look like

 weary ridge
anyone comfortable with pytesseract and image processing?
libraries
how can we extract a particular text from a button in the image
lets assume we have "google" text in 2 places
one "google" is inside a button in the image and other "google" is somewhere else inside the image
how can we detect the coordinates of the "google" inside the button? is there any ways?
tiny swallow
I solved my Isssue using the following code:
def info_gen(col):
    return {
        "count": col.count(),
        "mean": col.mean(),
        "stddev": col.std(),
        "min": col.min(),
        "max": col.max(),
    }
l = []
for column in df:
    l.append(info_gen(df[column]))

info = pd.DataFrame(l)
print(info)
are there more efficient ways to do this?(I am not very familiar with Pandas inbuilts and would like to learn if a simpler way exists)
winged slate
Hi,
I was training my atari rl model(Tutorial I was following https://www.youtube.com/watch?v=Mut_u40Sqz4&t=6695s&ab_channel=NicholasRenotte) and saw that when ever training is done python stops responding and I need to restart the kernel. There weren't any error messages but the ipython notebook showed "Dead kernel" with a pop up saying the kernel will restart it self. I am training the model locally on my laptop. Idk how to check the status of memory. This guy on stackoverflow: https://stackoverflow.com/questions/52123009/jupyter-python-kernel-dies-openaiappears to have the same issue as me but none of the answers work. Code:#Import Dependencies
import gym
from stable_baselines3 import A2C
from stable_baselines3.common.vec_env import VecFrameStack
from stable_baselines3.common.evaluation import evaluate_policy
from stable_baselines3.common.env_util import make_atari_env
import os
from gym.utils import play
#Create Environment
environment_name = 'Breakout-v0'
env = gym.make(environment_name, render_mode='human')
#Testing atari environment
episodes = 5
for episode in range(1, episodes+1):
obs = env.reset()
done = False
score = 0
while not done:
    action = env.action_space.sample()
    obs, reward, done, info = env.step(action)
    score+=reward
print("Episode:{} Score:{}".format(episode, score))
env.close()
The above code works fine in terminal but not in ipython notebooks
Thx

Want to get started with Reinforcement Learning?
This is the course for you!
This course will take you through all of the fundamentals required to get started with reinforcement learning with Python, OpenAI Gym and Stable Baselines. You'll be able to build deep learning powered agents to solve a varying number of RL problems including CartPole...
Stack Overflow
I am new to reinforcement learning and I am trying to use OpenAI Gym environments.
First, I installed gym by this command: !pip install gym in jupyter
And after running again to making sure it is
 edgy glen
hi, i am currently working on some pandas datasets an struggle with p-value tests.
i wouldn´t have written in here, if there would be a chance i could make it by myself.
for a given property and a pair of classes i need to calculate the t-test p-value.
totally stuck...
serene scaffold
edgy glen
hi, i am currently working on some pandas datasets an struggle with p-value test...
don't implement the tests. you can use scipy
 shut ivy
Open CV and image processing in python
Hiii does someone happen to know how to count circles on a binary image using opening only?
(yes opening only not connected components)
I've been trying to find a way for days
urban lance
I have a dataframe with a timestamp as index. I grouped the dataframe by each user and wanted to do a df.rolling (moving time window) over each user but it's giving me this error

 serene scaffold
urban lance
I have a dataframe with a timestamp as index. I grouped the dataframe by each us...
serene scaffold
urban lance
I have a dataframe with a timestamp as index. I grouped the dataframe by each us...
please don't post code as screenshots--copy and paste it as text.
can you do print(df.head().to_dict('list')) and show it in the chat?
urban lance
ValueError: index must be monotonic
so you get that error before you even try to do the df.set_index ... part?
urban lance
df.set_index('timestamp').groupby("userid").rolling('2W')
it's when applying the rolling function
serene scaffold
please do print(df.head().to_dict('list'))
urban lance
but that's because it things the values aren't sorted
but they are
by user
but not through all indexes of the complete dataframe
serene scaffold
I can't wait any longer; sorry.
urban lance
serene scaffold
please do `print(df.head().to_dict('list'))`
what is that for?
k, bye then Oo
 heavy robin
Could some kind person tell me what this function does?
def _resample(quantity, reference):
    # midpoints corresponding to shifted quantity
    midpts = reference[:-1] + (np.diff(reference) / 2)
    # linear interpolation to fall back to initial reference
    return np.interp(reference, midpts, quantity)
It is used in a parser that gets seconds from a gpx file, and the result is returned via this function
according to the author it does: "Resample quantities to fall back on reference"
urban lance
can anyone help me though?
 ornate prism
 swift gyro
This may be a mode collapse. The generator just generate random noise that makes the discriminator just classify correctly but actually the image is bad. That's why the discriminator loss is low.
misty flint
learning more about the semantic search world
pretty nifty
sbert models are pretty cool
highly recommend if youre in the search engine/info retrieval space
see if it fits your use case
lapis sequoia
can I make a dictionary directly which changes country names in a column to their respective ISO codes

I know I can make one by looping. But is there a direct way in pandas
serene scaffold
lapis sequoia
I know I can make one by looping. But is there a direct way in pandas
are you trying to do iso_code as the key and location as the value?
you would need to add .set_index('iso_code').squeeze().to_dict()
or you can switch iso_code with location to get the opposite.
lapis sequoia
vaccinations["location"].map({country["location"]:country["iso_code"]})```wanting to do something like this
But this doesn't work ofcourse
serene scaffold
did you try what I suggested?
lapis sequoia
Let me see what it does

 icy tree
Im using PyTorch, why is label such a weird one? I have 6 labels in my dataset
 lapis sequoia
Your code worked. Thanks @serene scaffold
serene scaffold
lapis sequoia
seems to work
is vaccinations the same as country[['iso_code', 'location']]?
lapis sequoia
Yeah sort of same thing. Same data
serene scaffold
but is it exactly the same
like
vaccinations = country[['iso_code', 'location']]
Will explore what . squeeze and .to_dict did later.
serene scaffold
squeeze turns a dataframe with one column into a series
lapis sequoia
Vaccinations and country both have those 2 columns. So it's all good.
But dw. I made it work.
serene scaffold
well, this explains the nesting thing.
serene scaffold
🔥
serene scaffold
did you do country[['iso_code', 'location']].set_index('iso_code').squeeze().to_dict()?
see how that goes
anyway I must leave again
lapis sequoia
It still has nesting. So squeeze isn't neccesary
serene scaffold
 lapis sequoia
I did it
hollow sentinel
what's the point of psuedorandomness in machine learning
hollow sentinel
like i don't know when to use the random seed generator
hollow sentinel
pliant pewter
So I've started working through O'Reilly book, and it's already given me depreca...
the aurelien geron one?
it's hard to get past the initial stages of machine learning without the math knowledge behind it
otherwise i feel like you're kind of just throwing ml algos from sklearn and expecting things to happen but not really understanding why they happen
i have that book and i think they go into like partial derivatives somewhere around chapter 3 or 4 maybe?
mild dirge
They youtube series by 3 blue 1 brown is pretty good
And a book called deep learning with pytorch was also pretty nice, it re-explained some basics
hollow sentinel
i like this calculus book by jason brownlee
but it's freaking 37 bucks 😦
i like 3blue1brown's aesthetics but i always leave his videos with ooh pretty colors and graphics but what did i even learn
mild dirge
yeah true
It's just a primer
Planning on picking up some of the mathematics of ml this summer with a book
hollow sentinel
you really need to believe in yourself if you're trying to get into ml bc it is 3-4 years of math you're teaching yourself
i'd like to pretend it is very project-oriented and you can learn all of it by just doing toy projects alone but the math has to come in at some part

might as well learn to like the math
pliant pewter
hollow sentinel
it's hard to get past the initial stages of machine learning without the math kn...
That's ok, I have the mathematical background, I'm using the book as a practical guide
hollow sentinel
that's good
pliant pewter
Well, my thing is more differential geometry and linear algebra, I'm still learning the stats, but I have books for that too
hollow sentinel
i kinda binged linear algebra a while ago but i need a recap
i'm doing stats now but i did stats before too
still haven't started probability but i'm starting that today
pliant pewter
One thing I'm finding interesting is that machine learning seems to be intrinsically coordinate-dependent, which is the opposite of differential geometry. You would call this "feature scaling", and whatever methods are used to obtain derived features that may be more convenient (such as fitting to the square root of a feature rather than the feature itself)
hollow sentinel
in that sentence i understood the word feature scaling
mild dirge
I understood "The" too
hollow sentinel
"interesting"
pliant pewter
Even the O'Reilly book talks about manifolds in feature space
And trying to find good projections onto them
 devout sail
pliant pewter
Even the O'Reilly book talks about manifolds in feature space
devout sail
pliant pewter
Even the O'Reilly book talks about manifolds in feature space
what book is that?
devout sail
icy tree
Im using PyTorch, why is label such a weird one? I have 6 labels in my dataset
Hopefully you solved it by now, but it really depends on your dataset and dataloader
icy tree
I mean not everything yet is clear but i just need to explore more to form questions about what buggs me 😄
Thanks still!
pliant pewter
devout sail
what book is that?
The one by Géron
devout sail
interesting, I'll check it out. Thanks
devout sail
hey! decided to drop by and check what the cool kids are up to
serene scaffold
then you've come to the wrong place
 lusty valley
I’m trying to create a multivariate probabilistic model that predicts customer fallout/churn but management want to be able to mess around with the assumptions/variables. How could this be done, has anyone made interactive machine learning models with a front-end? what tools did you use? which algorithms would work best? goal is to find out cashflows
 reef cypress
Hello
I have a use case where I need to parse so messy text to get very specific information. The text can be very messy sometimes which means good old regex fails to find the info most of the time, I have tried GPT-3 in the playground, and it seems to be a very good solution, however, I am restricted in an offline environment and I cant send data to a third-party server.
Is there any offline solution similar to how GPT-3 extracts data from an unstructured text? I need it to work with python. preferably one that does not need training as well.
Thanks.
devout sail
lusty valley
I’m trying to create a multivariate probabilistic model that predicts customer f...
What kind of variables are we talking about here? because if changing one requires retraining your model it sounds like it'll be a pretty slow experience. The field of active learning might be useful here if they want to be able to correct the model in real time.
 buoyant steppe
I want to convert object to float and it runs this error, I tried as type and to numeric function but the values become NaNs any one know how can I solve this?
 lapis sequoia
@hollow sentinel are you in university?
serene scaffold
buoyant steppe
I want to convert object to float and it runs this error, I tried as type and to...
like I said before, you have strings in your data structure for some reason
lapis sequoia
@buoyant steppe could you show the dataset please
Ah. Yes you have string
I know the reason
It has delimiters, probably.
hollow sentinel
lapis sequoia
<@567030124306759710> are you in university?
yes
lapis sequoia
hollow sentinel
yes
What do you study.
hollow sentinel
business analytics
which if you ask me is a joke
most of the kids graduate without knowing what a p value is
or a hypothesis test
or the central limit theorem
just excel
it's funny actually if you look up business analyst jobs they go crazy for excel
 strong tapir
im trying to implement backpropagation from scratch and i have a couple a questions can anyone help?
I'm trying to get the deltas but I'm a little confused about doing some multiplication either element wise or matrix wise
like for the last layer I did the (outputs per sample - labels per sample) .* Derivative of the Sigmoid Function on the last layer
but the reason why i'm confused is how am i suppose to alter the weights and biases if the delta matrix will be sample based while the ws and bs are just vectors
should i average the samples together for each layer's delta then use that for gradient descent or what? (sorry im new to this)
lusty valley
devout sail
What kind of variables are we talking about here? because if changing one requir...
active learning sounds really interesting… do you have more information on this? any resources I could check out
wooden sail
strong tapir
should i average the samples together for each layer's delta then use that for g...
if i understood you right, you mean you're taking the gradient for several examples of input and output vectors at the same time? if so, then it depends on how you formulated your cost function. since it is applied it input-output pairs separately, the gradient of the cost will separate over the input-output pairs. then all you have to do is look at the cost function. it is often a sum over these pairs, but sometimes there's a factor 1/N in front. if the 1/N is in front, then sure, you get 1/N(sum of all the gradients), which is the average, as you mentioned. if the factor is not there, you just add the gradients up
you can use latex in this channel btw, so it'd be helpful if you can show the expression
strong tapir
so i should sum over all the training examples for the delta of each layer?
also i do not know what latex is lol
wooden sail
.latex smth like $\frac{1}{N} \sum_{n=1}^N sg(\boldsymbol{x}_n - \hat{\boldsymbol{x}}_n)$
 strange elbowBOT
 strong tapir
ooo ok
wooden sail
strong tapir
so i should sum over all the training examples for the delta of each layer?
as i said, it depends on how your cost function is written
strong tapir
i just have it written as outputs - labels
wooden sail
yes, but you have several outputs and several labels
what do you do with them, add them? average them?
that's what determines what to do with each gradient
remember differentiation is linear with addition
no one will be able to say just "yes" or "no" without seeing your cost function, it really depends on how that is defined for each network
strong tapir
yeah i'm seeing what you mean now
because the derivative of each function will be different depending on how it is written
im still learning the math behind all this stuff so it took me a second to comprehend what you meant but i see now
my cost function is just yhat-y right now because im trying to solve an xor dataset just for beginner practice
well thats the derivative for it ig
wooden sail
yeah but, that's for one yhat and one y
what are you doing when you get several examples
wooden sail
that'd be fastest
strong tapir
[[0.50234888 0.50234886 0.50234888 0.50234886]] nn outputs

[[0]
 [1]
 [1]
 [0]] labels
mhm
wooden sail
all right. and your cost is? sum of squared differences?
strong tapir
mean squared error
strong tapir
should i average them after multiplying them element wise by the activation gradient?
because the output layer is sigmoid so i was multiplying the difference of yhat-y by sigmoidprime
for the delta
wooden sail
.latex you can rewrite MSE in the form $\frac{1}{N}\sum_{n=1}^N (y_n - output_n(\boldsymbol{\theta}))$
strange elbowBOT
 strong tapir
n being the number of examples right?
wooden sail
and here output_n(theta) is the network, which depends on all of the hidden params and a handful of functions apparently, one being a sigmoid. and yep, n examples
so if you take the gradient of this expression wrt theta, you get N gradients added together, then multiplied by 1/N
use your standard chain rule on each example separately
unless you're already very comfortable with matrix calculus
strong tapir
im not comfortable with calculus in general im just trying to get by 😭
i just graduated high school so im trying to learn it as i go
i've been trying to learn this chain rule but its quite convoluted im slowly getting it
wooden sail
aight
i just noticed i forgot a square in the sum but it doesn't make a big difference in the sentiment of the explanation
strong tapir
thank you for the help I'm going to try implementing that version of mse
im gonna go ahead and average these together and see how it looks
i appreciate it
wooden sail
all right, good luck
 brave sand
 scenic tulip
Someone on here helped me a little while ago, I tried applying their help to my problem and Im not sure it's right
values = np.array([
    [1, 2, 3],
    [4, 6, 2],
    [1, 9, 2] ])
diffs = np.array([[-1,1,0],[0,-1,1]])
print("values shape")
print(np.shape(values))
print("diffs shape")
print(np.shape(diffs))
print(diffs.dot(values))

adder = np.array([1,1])

print(adder.dot(diffs.dot(values)))

adder_diff = adder.dot(diffs)

print(adder_diff.dot(values))

values2 = np.array([[1,2,3],[4,5,6],[7,8,9]])

vals_concat = np.concatenate((values,values2), axis=1)

print(vals_concat)

print(adder_diff.dot(vals_concat))

#adder_diff.dot(vals_concat)
Yes, I want to convert this string to float
scenic tulip
so the above does what i need, however I'm dealing with arrays of 20 elements
how could i alter "diffs" to work with 20 element arrays?
heres what i tried https://paste.pythondiscord.com/oqaqexohik
it gives me an array of negative numbers but not the correct shape....
lapis sequoia
strange elbow
Where's the square?
mild dirge
it should have a square yes
lapis sequoia
buoyant steppe
Yes, I want to convert this string to float
You can't. Because it's not in the right format
You can convert "37" to 37
But not something like "5,736" to 5736
The error might be different. It's just an example.
misty flint
rip
misty flint
intro to RecSys

Google Developers
highly recommend
at least bookmark it (if you arent already familiar with RecSys)
since you never know if you need it later

 hasty nimbus
Hi, is there any method to scale/normalise a numpy array of images? For example normalise 1000 images array with width and height of 50, 50. The dataset shape would be (1000,50,50) and type wpu;d be numpy array.
The image pixel values now is 0-255. I would like it to normalise each 'column' of each image to be from 0-1, so that the maximum value in each column would be 1 and minimum would be 0. I have checked Tensorflow site: ( https://www.tensorflow.org/tutorials/load_data/images ) but it gives an error of numpy.ndarray object has no attribute 'map'. The minmax scaler function by sklearn ( https://scikit-learn.org/stable/modules/generated/sklearn.preprocessing.MinMaxScaler.html ) intakes only 2 dimensions, but the image array is 3 dimensional.
Also, after doing the prediction, how can we do inverse transform on the same? Any help would be much appreciated. Thanks

TensorFlow
scikit-learn
Examples using sklearn.preprocessing.MinMaxScaler: Release Highlights for scikit-learn 0.24 Release Highlights for scikit-learn 0.24, Image denoising using kernel PCA Image denoising using kernel P...
wooden sail
opencv can do that for you. i don't think numpy has a built-in, this requires several smaller operations like filtering and interpolation before rescaling
cv2 resize
hasty nimbus
I would like to scale the image pixel values from 0-255 to 0-1
hasty nimbus
like doing minmaxscaler..but it does not support 3d input
wooden sail
if you want to guarantee each image goes up to 1, each one needs a different scaling factor
lemme make a MWE
hasty nimbus
hasty nimbus
Hi, is there any method to scale/normalise a numpy array of images? For example ...
I have edited the query..could you kindly check..
wooden sail
like this?
In [13]: import numpy as np

In [14]: images = np.random.uniform(low=0.0, high = 255.0, size=(3,5,5))

In [15]: scales = np.amax(images.reshape(3,25,order='F'), axis=1)

In [16]: scales
Out[16]: array([237.19904231, 230.94060485, 218.98602612])

In [17]: images = images/scales.reshape(-1,1,1)

In [18]: images[0,:,:]
Out[18]:
array([[0.67569725, 0.21388331, 0.249622  , 0.18252881, 0.29632614],
       [0.28566605, 0.27176033, 0.76236163, 0.67083059, 0.45019169],
       [0.91175326, 0.76058221, 0.20210482, 0.95254814, 0.84472389],
       [0.91709724, 0.63036086, 0.26080576, 0.47641451, 0.30868981],
       [0.02046636, 0.724837  , 0.06889213, 0.95102034, 1.        ]])

In [19]: images[1,:,:]
Out[19]:
array([[0.43200265, 0.27306708, 0.90259909, 0.92961155, 0.27101015],
       [0.78753618, 0.79439702, 1.        , 0.50874609, 0.93215593],
       [0.75177531, 0.84402742, 0.49015708, 0.23510406, 0.26459369],
       [0.79134137, 0.5624815 , 0.83143427, 0.54834133, 0.03840511],
       [0.5331968 , 0.70472815, 0.91496131, 0.79747464, 0.0131399 ]])

In [20]: images[2,:,:]
Out[20]:
array([[0.90233794, 0.64224338, 0.78333831, 0.85019137, 0.18125519],
       [0.39829734, 0.63498648, 0.30746761, 0.74053398, 0.4858814 ],
       [1.        , 0.23681526, 0.97160364, 0.01271114, 0.67433201],
       [0.41302812, 0.87823021, 0.77767189, 0.93987974, 0.04372113],
       [0.46167719, 0.26255225, 0.66262464, 0.11876092, 0.00363553]])
wait, you want it to be for each column of each image? not per image?
hasty nimbus
wooden sail
wait, you want it to be for each column of each image? not per image?
rescale to 0-1 in each columns of an image in the image array..
wooden sail
In [37]: import numpy as np

In [38]: images = np.random.uniform(low=0.0, high = 255.0, size=(3,5,5))

In [39]: scales = np.amax(images, axis=1)

In [40]: images = images/scales.reshape(3,1,5,order='F')

In [41]: images[0,:,:]
Out[41]:
array([[0.50671187, 0.60685933, 0.43826847, 1.        , 0.92494176],
       [0.4730359 , 0.2562297 , 1.        , 0.02432692, 0.4077236 ],
       [1.        , 0.52415199, 0.27995449, 0.74841586, 1.        ],
       [0.18376117, 1.        , 0.2540879 , 0.02768903, 0.67912986],
       [0.11203768, 0.03996201, 0.6436654 , 0.21895602, 0.97006871]])

In [42]: images[2,:,:]
Out[42]:
array([[0.86102301, 1.        , 0.00965854, 0.00874168, 0.34391565],
       [0.94786923, 0.574956  , 0.0292573 , 0.52215436, 0.61229683],
       [0.03150165, 0.57074663, 0.29018   , 0.41719752, 0.07521704],
       [0.13198368, 0.29659947, 0.31433814, 0.46667479, 1.        ],
       [1.        , 0.31451141, 1.        , 1.        , 0.16892427]])
that should do
you can replace the corresponding dimensions by the ones you need. here, 3 was the number of images, each image had 5 rows and 5 cols
hasty nimbus
Thanks for the suggestion..is the minimum value here zero? how can we inverse transform the image after prediction?
wooden sail
yes
the images i used there are random matrices with entries in the range 0 to 255, but they don't necessarily go all the way up to 255. if you have negative numbers, you have to make some changes
hasty nimbus
but here i think the minimum value in each column may not be zero..
wooden sail
oh you want it to go down to 0?
repeat the operation but for minima, and subtract that number
hasty nimbus
yes..scale the columns from 0-1 ..
is there any standard scaling function like minmax scaler for 3d image array
hasty nimbus
how to do the same in opencv?
wooden sail
you'd have to make another similar operation to the one above, but subtracting a number first (in numpy)
you can probably do it with the opencv function i mentioned a while back
wooden sail
oops that's the wrong one. i don't know which one specifically to use, maybe someone else can help you. otherwise, just modify the code i gave you above. the subtraction is pretty similar
hasty nimbus
wooden sail
oops that's the wrong one. i don't know which one specifically to use, maybe som...
sure..thanks for your time..
lapis sequoia
hi guys, does someone mind explaining to me how is the cross validation set even useful? I know the test set is used as a way to simulate unseen data and make predictions based on it to measure the accuracy, and well the training data is for the sole purpose of training the model. However, I have read articles in which test set and cross validation set were used interchangeably and it kind of got me confused
urban lance
I have a dataframe which I grouped by user. Its index is a timestamp.
I'd like to use a moving time window (df.rolling) to go through the complete dataset and apply my custom functions to it
however the approach I tried isn't working very well
are there any suggestions?
hasty nimbus
hasty nimbus
Hi, is there any method to scale/normalise a numpy array of images? For example ...
Do let me know if anyone else could shed some light on it..
wooden sail
did you try what i suggested to subtract the minimum value?
hasty nimbus
yes..the values are coming from 0 to 1
but after prediction, the values are not in the same range
wooden sail
well, that's not a problem with the normalization 😛
hasty nimbus
yeah, but when I check the error metrics, it is very high..
wooden sail
yep, then you have to give more info about the cost function and the network you're using
hasty nimbus
i am trying to use an autoencoder..
hasty nimbus
leaky relu..and lastly sigmoid for activation and kl divergence..
wooden sail
all of that sounds ok
hasty nimbus
where do you think it may go wrong..
hasty nimbus
yes.
wooden sail
probably too few layers, or the hidden layers for the sparse representation are too small, so they don't have enough parameters to represent the images well
hasty nimbus
would adding more layers help?
wooden sail
it's possible, but first, what's the size of the output at the end of the encoder part?
hasty nimbus
it is an embedding vector of 1d..
wooden sail
sure, but how many entries
hasty nimbus
meaning?
hasty nimbus
the same size of the filter in the last layer of encoder..
wooden sail
yes, what is that number though lol
if it is too small in comparison to the original size of your images, the network won't work
hasty nimbus
I am experimenting with different sizes actually..like 32, 64, 128..etc
wooden sail
128 or 256 should probably work
hasty nimbus
asking out of curiousity, is it possible to add lstm layer here?
wooden sail
i can't comment on that. i'll say "probably yes, but without any improvement if the images aren't related to each other", but take it with a grain of salt
hasty nimbus
hehe..ok..thanks for the help!!
lapis sequoia
are there any public discord bots that have AI responses
like one that u can have a conversation with
 plush glacier
lapis sequoia
like one that u can have a conversation with
plush glacier
lapis sequoia
like one that u can have a conversation with
yes although i may have forgotten the name
 trim kayak
how to convert list of strings to list of float
wooden sail
you could map float() to all elements or iterate over the elements
alternatively, if you have a numpy array, it suffices to call .astype(float)
 zenith panther
hey guys, i had problem with extracting elements that have same html class. is there a solution how to do it ?
urban lance
who has experience with df.rolling?
odd meteor
zenith panther
hey guys, i had problem with extracting elements that have same html class. is t...
Extracting elements? Are you doing Web scrapping? If yes, what error message are you getting?
zenith panther
odd meteor
Extracting elements? Are you doing Web scrapping? If yes, what error message are...
its not an error its just i want to extract elements that have the same html class
yes its web scrapping
odd meteor
zenith panther
its not an error its just i want to extract elements that have the same html cla...
Once you've identified the parent tag, then use css selector to grab the tag you're interested in.
Write the code you're currently using to do this if you can.

 zenith panther
odd meteor
Once you've identified the parent tag, then use css selector to grab the tag you...
zenith panther
odd meteor
Once you've identified the parent tag, then use css selector to grab the tag you...
im using beautiful soup with python
loud cove
so apparently, they did mention clustering somewhere else.
I did try it, but for some reason, it isn't clustering (even though I extracted the lemmas
https://github.com/MAmr21/EGYFWD/blob/main/KO/Article Classification/articles classifier.ipynb
Edit: so even with max features not set, it is still doing the same thing.
loud cove
zenith panther
hey guys, i had problem with extracting elements that have same html class. is t...
you need to get the selector for whatever part you want to extract.
loud cove
misty flint
bruh
it is their fault though
they needed to communicate this upfront and work around the limitation of the api.
and there is no way it is only "couple of rows each 3/4 months"
misty flint
eh lets agree to disagree
finance data is extremely voluminous
even the data for one stock
i can easily see the vendor behind the API messing up the way set up their architecture and this affecting the data it produces
now the data engineers get blamed for data thats not even theirs
def an unfair situation to me
loud cove
misty flint
finance data is extremely voluminous
my background is finance
I personally wouldn't fire them, that is just stupid, but they are 100% at fault here.
misty flint
then you should know collecting real time data is tough
loud cove
misty flint
now the data engineers get blamed for data thats not even theirs
the data isn't missing at source, they're missing in transfer
loud cove
misty flint
then you should know collecting real time data is tough
but they aren't collecting real time
loud cove
it is the DE team job to QA, irrelevant of who the vendor is.
misty flint
this only dissuades me from pursuing DE. sorry not sorry
loud cove
misty flint
it says source
because if it is messing at source then they would NEVER know
misty flint
if business stakeholders treat you like this, then its not worth it
loud cove
the way they know is when doing reconciliation they find some discrepancies
loud cove
misty flint
if business stakeholders treat you like this, then its not worth it
while i think firing them is extreme, I still think they should be held accountable for their jobs
a simple aggregation QA would have pointed this out, something like a count + group by sum at the DWH
serene scaffold
urban lance
who has experience with df.rolling?
it's usually not possible to answer pandas questions in the abstract, so please give exact examples that can be copied and pasted into a program exactly. you can create one with print(df.head().to_dict('list')), as we discussed yesterday.
loud cove
loud cove
so apparently, they did mention clustering somewhere else.
I did try it, but for...
just tested it with the original body without any transformations done and still same issue.
urban lance
serene scaffold
it's usually not possible to answer pandas questions in the abstract, so please ...
but that gives you some of my data
serene scaffold
urban lance
but that gives you some of my data
that is the point.
serene scaffold
I'll be busy for the next half hour or so, but if you can make a reproducible example, I can look at it when I get back.
urban lance
there is 1 huge catch to rolling that I should have thought of
it takes a LONG time to process everything
urban lance
well it has to go through 3.2M rows and with a custom function
loud cove
what is the window?
serene scaffold
urban lance
well it has to go through 3.2M rows and with a custom function
and there was no way to get that function's behavior in terms of pandas?
urban lance
or it's taking that long because of the stupid set copy warnings that don't actually make sense 🤷♂️ I'll solve that later
can warnings introduce an additional delay?
urban lance
loud cove
what is the window?
14D
loud cove
how many rows is that?
urban lance
loud cove
how many rows is that?
variable
serene scaffold
urban lance
can warnings introduce an additional delay?
warnings don't intentionally throttle your program, if that's what you mean
loud cove
yeah but on average, how long
urban lance
loud cove
yeah but on average, how long
2 maybe 3
loud cove
because 3.4 isn't that many
urban lance
serene scaffold
and there was no way to get that function's behavior in terms of pandas?
I'm categorizing each row based on the values in in the rows within that window
if that makes sense
loud cove
urban lance
```py
df.set_index('timestamp').groupby("userid").rolling('2W')
```
what are you exactly doing here
serene scaffold
urban lance
I'm categorizing each row based on the values in in the rows within that window
so you're taking the mode, or what?
urban lance
loud cove
what are you exactly doing here
(I changed the 2W to 14D since it said the time period was variable somehow)
I'm setting the timestamp as the index since that is what's required for df.rolling to work
and I'm grouping my df by each user
So I'm feeding the rolling function a slice of the dataframe (by user)
loud cove
yeah what are you doing though
you didn't get a specific aggregation there
and I don't think timestamp would work as index
urban lance
it worked
urban lance
loud cove
what are you exactly doing here
I made this equal to a variable and then I loop though every window in that variable
(that in itself does not sound very efficient 🤔 )
for window in var:
And I feed that window (slice of df) to my function
urban lance
it's grouped by user so that doesn't matter
loud cove
why not just sort by user then by timestamp and just keep as that?
urban lance
to my knowledge the rolling function only sees the df slice of one user at a time?
urban lance
loud cove
why not just sort by user then by timestamp and just keep as that?
if I didn't set the timestamp as the index, it would throw an error
went on 'stuckoverflow' and they had set the timestamp as index
thought I'd give that a go and it resolved my issue
loud cove
right
but what are you doing though
you're grouping all the numerical columns?
isn't there a specific aggregation that you care about?
and btw rolling have on you can set.
urban lance
I'm grouping all the columns that belong to a single user
I want to map all users in my dataset to a certain stage in the customer journey
we set some requirements for each stage so I'm trying to see when a user belongs to what category
urban lance
loud cove
and btw rolling have `on` you can set.
I'll take a look at the documentation
loud cove
how many numerical columns are there in the df?
you are grouping yes, but isn't there specific thing you want to get? like group the user data for past two weeks and get the sum of revenue or whatever
urban lance
there is one but I might as well drop that column since it's not very relevant to this problem
urban lance
loud cove
you are grouping yes, but isn't there specific thing you want to get? like group...
I'll give you an example
to belong to the consideration stage in our customer journey you have to have a search event and viewed more than one item.
Because a user can move through the stages as time progresses, I'm using a moving time window.
I check whether there is just once search event and multiple items viewed within that window
loud cove
okay so you're trying to get what stage of the funnel he's in?
loud cove
so a count of events by a single id from the time he landed?
urban lance
there are 2 main requirement categories --> a count (certain amount or exactly one) or whether the value is unique within the window
A journey is not always linear, users can move back in their journey too, so after some time the older entries should not be taken into account anymore
loud cove
yeah but that's what the two weeks for
urban lance
yea I'll have to see if that gives me the desired results or where I have to increase or decrease that window
loud cove
urban lance
yea I'll have to see if that gives me the desired results or where I have to inc...
try df.groupby("userid").rolling('14D', on='date')['event'].nunique()
 wicked vessel
Is there a specific name/algorithm when wanting to do classification of a couple of categories, and then a "others" for things that are far from any clusters?
most algo's ive found seem to do well at classifying data, but don't really have a option to classify things as "not close to any specific category"
loud cove
wicked vessel
most algo's ive found seem to do well at classifying data, but don't really have...
wouldn't kmean 3 work?
urban lance
wicked vessel
Is there a specific name/algorithm when wanting to do classification of a couple...
and how does your data look when plotted in 3D 🤔
wicked vessel
https://i.wqrld.net/Cake_PtO bit of a mess, ill probably remove the subsets that seem completely random
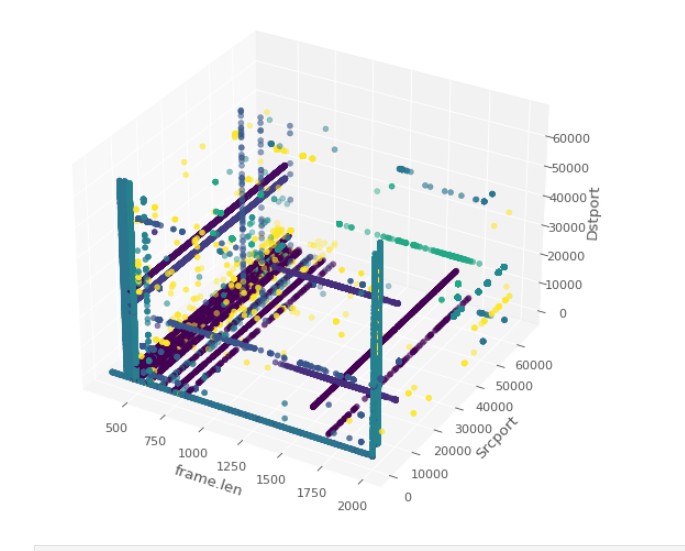
What's the programmer's favourite hangout place? Foo Bar
urban lance
loud cove
try `df.groupby("userid").rolling('14D', on='date')['event'].nunique()`
I'll have a try 🙂
wicked vessel
i'm a total noob with all this stuff, just learning 😉
wicked vessel
loud cove
wouldn't kmean 3 work?
kmeans can find the clusters but not really classify new data i believe?
why not i guess mh
urban lance
I suppose you can save the centroids and check what centroid the new data point is closest to?
loud cove
wicked vessel
kmeans can find the clusters but not really classify new data i believe?
you can set a distance for stuff to be counted as outliers https://medium.datadriveninvestor.com/outlier-detection-with-k-means-clustering-in-python-ee3ac1826fb0
wicked vessel
thanks, ill give that a read
urban lance
loud cove
try `df.groupby("userid").rolling('14D', on='date')['event'].nunique()`
I'll try this on monday/Tuesday. Alright?
loud cove
urban lance
I'll try this on monday/Tuesday. Alright?
Sure, good luck my friend.
urban lance
Thanks, I'll be relieved when this task is finished
 wooden forge
Hey there, I am currently struggling with data fit. I'd like to fit a double exponential decay but I don't get how I am supposed to do that so if anyone know I'd truly appreciate
I don't really understand the curve_fit from scipy
wooden sail
can you describe the problem a bit more?
.latex you mean something of the form $c^{a^x}$?
strange elbowBOT
 wooden sail
wooden forge
I don't really understand the `curve_fit` from scipy
wooden sail
wooden forge
I don't really understand the `curve_fit` from scipy
something like this?
In [45]: import numpy as np

In [46]: import scipy.optimize as spopt

In [47]: xvals = np.linspace(0,4,100)

In [48]: def doublexp(x, c, a):
    ...:     return np.power(c, np.power(a, -x))
    ...:

In [49]: yvals = doublexp(xvals, 1.3, 2.4) + 0.01*np.random.normal(size=len(xval
    ...: s))

In [50]: estimate = spopt.curve_fit(doublexp, xvals, yvals)

In [51]: estimate
Out[51]:
(array([1.30017782, 2.39802477]),
 array([[1.24632716e-05, 8.45438018e-05],
        [8.45438018e-05, 1.22429222e-03]]))

In [52]: plt.plot(xvals, yvals)
Out[52]: [<matplotlib.lines.Line2D at 0x7f260e5a5760>]

In [54]: plt.plot(xvals, doublexp(xvals, estimate[0][0], estimate[0][1]))
Out[54]: [<matplotlib.lines.Line2D at 0x7f260e5ab250>]

In [55]: plt.show()
 wooden forge
wooden sail
can you describe the problem a bit more?
wooden forge
wooden sail
can you describe the problem a bit more?
I want to fit this function basically

and I know it's a double exponential
so it's np.exp(p) on the left and np.exp(-p) on the right
wooden sail
ah that's what you meant by double exponential haha
wooden forge
yeah haha
wooden sail
just modify the function in what i sent, then
loud cove
loud cove
so apparently, they did mention clustering somewhere else.
I did try it, but for...
anyone have an idea why this happens? no clustering
wooden sail
wooden forge
if p > 0 it' decay else just a regular one
do you know if it's the same exponent on both sides of the curve?
wooden sail
right, so one is exp(-ax), the other is exp(bx), with a and b >= 0
mild dirge
So just fit an exponential function on the first half
wooden forge
the thing is
mild dirge
and then flip it for the second half
wooden forge
it overlaps
on 0
so the shape doesn't match anymore
it means I have to remove one point
wooden sail
you would get a better result, if there is symmetry, if you treat the right and left sides as different noise realizations of the same random process
wooden forge
because it's doubled
wooden sail
but anyhow
i'll also point that you have another param since the amplitude is unknown
pliant pewter
Fit to exp(-p|x|)
wooden forge
huh
wooden sail
that's fine, if you have a good suggestion for the non differentiable point at x = 0
i think scipy uses levenberg marquardt anyway though, so it probably gets around it easily enough with finite diff aprox to the gradient
wooden forge
of course omg
pliant pewter
Not sure why it needs to be differentiable, it's the mean square error that has to be differentiable, and it is
wooden sail
you're absolutely right, idk why i was thinking of differentiating wrt x lol
wooden sail
anyhow, you need an extra param for the amplitude too
pliant pewter
Of course
wooden forge
Litteraly worked on quantum mechanics 24/7 for 12 days and can't even figure it out for a simple function lmao
wooden forge
wooden sail
anyhow, you need an extra param for the amplitude too
ye ye !
woo

let's go
wooden sail
i was just making a MWE myself
 wooden forge
sweet
wooden sail
cool, glad you got that sorted out and that aurendil pointed out a nice model
pliant pewter
It's only a model
wooden sail
surely. if at any point you want to consider an asymetric case, you can consider a sum of exponentials multiplied by step functions or something like that
wooden forge
yeah well
pliant pewter
Sorry, was a Monte Python quote, I thought it would be recognized here 
wooden sail
went over my head, alas
pliant pewter
Damn
wooden forge
sharing the png and not pdf

sheeeeesh
when you discover you can add latex to matplotlib it's really cool
wooden sail
looks nice
 bronze prism
I have a code for a project where I pull data from house ads on the internet and make a table, the code is about 60 lines of code. There is no problem in the operation of the code, but since this is a project, I want the code to be neat and legible, can I post the code here for advice?
I am get the data with BeautifulSoup, I wrote it to the data science room because it is more data extraction and table making.
wooden forge
wooden sail
looks nice
look at this then
 wooden forge
bronze prism
I have a code for a project where I pull data from house ads on the internet and...
wooden forge
bronze prism
I have a code for a project where I pull data from house ads on the internet and...
sure, if it's too long you can use pastebin
or just share with github link I guess
sounds cool
bronze prism
lapis sequoia
Guys, here vaccine column has multi CSV values. How can I have a single row for each of those values. By keeping rest of the attributes same.

Like
Australia 1st June vaccine A
Australia 1st June vaccine B
Instead of
Australia 1st June vaccine A,vaccine B
@serene scaffold God friend. Save me.
bronze prism
For example, do you want pfizer to write A, moderna to write B, or do you want a column for all vaccine types?
lapis sequoia
Pfizer as vaccine A
Moderna as Vaccine B
Wanna keep the names same only. Was just an example to show the kind of split i desire.
bronze prism
lapis sequoia
If there was a way to loop through the rows of df maybe.
bronze prism
method 2 looks like what you want
lapis sequoia
bronze prism
https://www.geeksforgeeks.org/replacing-column-value-of-a-csv-file-in-python/#:~...
Oh no. That's not what I want at all.
I don't want to replace the names mate.
Like
Australia 1st June pfizer
Australia 1st June moderna
Instead of
Australia 1st June pfizer, moderna
Does it make sense now?
bronze prism
So you want to separate the vaccines by commas and make them all on a separate line?
2nd answer can be what you want
DMulligan's answer
scenic tulip
I have a list of arrays of 20 elements and I'm trying to find the trend in the data. The code below was given to me as an example and it works like i need it to. However when i try to apply it to my arrays it just gives a single number instead of an array with differences. ```import numpy as np
values = np.array([
[1, 2, 3],
[4, 6, 2],
[1, 9, 2] ])
diffs = np.array([[-1,1,0],[0,-1,1]])
print("values shape")
print(np.shape(values))
print("diffs shape")
print(np.shape(diffs))
print(diffs.dot(values))
adder = np.array([1,1])
print(adder.dot(diffs.dot(values)))
adder_diff = adder.dot(diffs)
print(adder_diff.dot(values))
values2 = np.array([[1,2,3],[4,5,6],[7,8,9]])
vals_concat = np.concatenate((values,values2), axis=1)
print(vals_concat)
print(adder_diff.dot(vals_concat))
#adder_diff.dot(vals_concat)
Here's what i tried https://paste.pythondiscord.com/oqaqexohik
wooden sail
what's the dimension of your data
scenic tulip
Basically I need to figure out how to alter "diffs"
(221,)
Edd was it you who helped me last time?
wooden sail
yeah that looks like something i would write
scenic tulip
yeah so if you look at what i tried you might be able to guide me on how to rearrange my attempt
lapis sequoia
Data cowboy Edd
wooden sail
so the code i gave you is made specifically for data of size 3 x number of data samples, but yours is of size 221. what operation do you want to do with this data?
serene scaffold
lapis sequoia
Instead of
Australia 1st June vaccine A,vaccine B
it sounds like you're either trying to pivot or unpivot the table
scenic tulip
i want to find the trend in the data
wooden sail
what is "trend" here
lapis sequoia
serene scaffold
it sounds like you're either trying to pivot or unpivot the table
Nice pfp.
scenic tulip
the difference of each array to the next, and updating as it traverses the list
lapis sequoia
I need to make one.
wooden sail
the pairwise differences?
serene scaffold
lapis sequoia
Nice pfp.
do df.pivot_table(index=['location', 'date'], columns='vaccine', values='total_vaccinations') and see if that is what you want
lapis sequoia
Let me see
scenic tulip
like, if i had [1,2,3] and the next array was [1,2,4] the updated trend would be [0,0,1]
your code works
wooden sail
ah, ok. well yeah, this is completely different from the code above. i'm surprised it works at all tbh
scenic tulip
but i can't seem to figure out why diffs doesn't reproduce the same results
no no, your code does what i need it to
lapis sequoia
serene scaffold
do `df.pivot_table(index=['location', 'date'], columns='vaccine', values='total_...
Nope
wooden sail
i don't see how, the way i wrote it, the math operation isn't defined haha
serene scaffold
lapis sequoia
Nope
how is it different from what you wanted?
scenic tulip
lol it's just the dot product of one array to the diffs
lapis sequoia
This summarises it well
 wooden sail
yes, the dot product only works for matching dimensions
scenic tulip
correct, i had to transpose my data to match the dimensions, now im getting scalar values instead of an array that shows the updated trend
wooden sail
i guess you multiplied from the left. anyway. if you have two 1D arrays, all you need to do is array1 - array2
serene scaffold
lapis sequoia
This summarises it well
I can't figure out what this transformation would look like in terms of the dataframe you showed earlier.
scenic tulip
yeah i had my own function that took the difference of the arrays in order, but your code seemed like it would do the entire list of arrays at one time
scenic tulip
        difference_arr = np.arange(1, 21)
        arr1 = np.array(arr1)
        arr2 = np.array(arr2)
        for i in range(21):
            if arr1[i - 1] > arr2[i - 1]:
                result = (arr1[i - 1] - arr2[i - 1])
                difference_arr[i - 1] = result
            elif arr2[i - 1] > arr1[i - 1]:
                result = (arr2[i - 1] - arr1[i - 1])
                difference_arr[i - 1] = result
            elif arr1[i - 1] == arr2[i - 1]:
                difference_arr[i - 1] = 0
return difference_arr```oh I see now
@lapis sequoia you need to use .str.split(',') on that column and then explode it
scenic tulip
in my code you will see i print the shape of the list that im using....it is (221,), the master list that i use is of shape (221,20)
i add the formatted arrays within the list to the master list
wooden sail
and you have two of these 221 x 20 arrays?
scenic tulip
i have 1
but i was trying to use the dot product like you did to do the entire list at one time
scenic tulip
yes
wooden sail
yeah, one way to do this is with a matrix, yes
but i also think there's a finite difference function that also does exactly this, because the operation is pretty simple
scenic tulip
numpy does have np.multiply but
wooden sail
np.diff( array, axis=my_axis)
if you have a list of lists, and the outer axis is of size 20 and the inner of size 221, you'd do np.diff(np.array(list_of_lists), axis = 0)
that should do it all at the same time
scenic tulip
@wooden sail can i FL you?
wooden sail
alternatively, you could make a toeplitz matrix with one diagonal band of ones and another with -1s, and multiply it to the array from the left
idk what FL is
scenic tulip
friends list
wooden sail
sure i guess, but i don't answer DMs
scenic tulip
oh ok nvm then
alright ill try the np.diff and see what happens....thanks again man you're awesome
wooden sail
i'll write a MWE really quick
scenic tulip
ok cool
i just dont get why your's produces the arrays with the differences and my produces single numbers for the entire array computation
i tried the same exact thing...or at least i thought i di
d
wooden sail
In [7]: import numpy as np

In [8]: lol = [[1,2,3,4],[2,7,5,3],[0,7,9,3]]

In [9]: np.diff(lol, axis=0)
Out[9]:
array([[ 1,  5,  2, -1],
       [-2,  0,  4,  0]])
that should do
lol stands for list of lists, happy coincidence
lapis sequoia
serene scaffold
I can't figure out what this transformation would look like in terms of the data...
like this
 scenic tulip
hmmm, so i need to try this on the master list once i have the individual arrays formatted and added to that list. i gotcha, brb
lapis sequoia
serene scaffold
<@456226577798135808> you need to use `.str.split(',')` on that column and then ...
sort of. But didn't know how to do it
I copied that github code and modified it a bit
scenic tulip
@wooden sail holy crap i think that worked....i need to write the data to a file because of how big it is to see if it's working right
wooden sail
for reference, the reason a function exists for that is that it provides a discrete approximation to a function's derivative. it stands for "finite differences", hence "diff"
scenic tulip
right, i mean initially being able to see some output it looks right
wooden sail
stencils for finite differences have nicely structured matrix representations, but it's usually overkill
scenic tulip
ok then, one last thing. In your example...that code that i posted of yours....how did you determine what "diffs" was going to be to do the dot product of the values array?
wooden sail
because of how matrix multiplication is defined
scenic tulip
so how would you have applied that to a bigger array?
wooden sail
if you take a matrix and multiply it from the left to a column vector, what happens is that the elements of each row of the matrix are multiplied with their corresponding element in the column vector, and then the results are added over
so since we wanted to subtract two elements of the column vector, i set all other elements to 0, and kept the ones we wanted as 1 and -1
scenic tulip
ahhhhh, that's why it was giving me scalar values instead of the entire array of pairwise differences
lapis sequoia
@bronze prism thanks dude
your Stack worked
I don't understand what it's doing exactly rn. But got the job done
bronze prism
lapis sequoia
<@411985781624799237> thanks dude
I didn't do anything, you did everything yourself, congratulations
wooden sail
.latex \begin{bmatrix} u_1 & u_2 & \dots & \u_N \end{bmatrix} \begin{bmatrix} v_1 \ v_2 \ \vdots \ v_N \end{bmatrix} = \sum_{n=1}^N u_n v_n
wooden sail
geez