#data-science-and-ml
1 messages · Page 399 of 1
 tacit basin
 versed gulch
tacit basin
With library like pillow or opencv
versed gulch
tacit basin
With library like pillow or opencv
huh seems I cannot find the code
tacit basin
What do you mean from 1x1x1 to 6x6x8?
versed gulch
tacit basin
What do you mean from 1x1x1 to 6x6x8?
pixel width height and depth
tacit basin
In jupyter you can do ??
tacit basin
versed gulch
pixel width height and depth
Image size? Wdym depth?
 merry ridge
Using what command?
 odd meteor
The number of pixels in an image is height x width of that image (excluding its number of channel(s). )
Do you mean, how to resize an image instead of pixels from, say, 1D to 3D with this shape (6.64 x 6.64 x 8.8)?
tacit basin
merry ridge
Using what command?
??
merry ridge
What do you mean by can I do it in jupyter
tacit basin
merry ridge
What do you mean by can I do it in jupyter
Yes double question mark
merry ridge
Your question doesn’t make sense to me. I am only interested in how a numpy method is implemented. How does Jupyter help me there.
versed gulch
odd meteor
The number of pixels in an image is height x width of that image (excluding its ...
so from my images they are 4000x4000 but the actual image pixel sizes are 6.64x6.64 micro metres (heightxwidth)
so I want to change the 1x1 pixel width and height to this
tacit basin
merry ridge
Your question doesn’t make sense to me. I am only interested in how a numpy meth...
What editor do you use? In Jupiter you can use double question mark to find out implementation details. In other editors jump to definition. Also in Jupiter lab with LSP extension
 desert oar
unfortunately not really, if something is implemented in a C extension you have to figure out where the implementation is and read the source code
pure python functions are easier, use inspect.getsource
!d inspect.getsource
 arctic wedgeBOT
inspect.getsource(object)```
Return the text of the source code for an object. The argument may be a module,
class, method, function, traceback, frame, or code object. The source code is
returned as a single string. An [`OSError`](https://docs.python.org/3/library/exceptions.html#OSError "OSError") is raised if the source code
cannot be retrieved.

Changed in version 3.3: [`OSError`](https://docs.python.org/3/library/exceptions.html#OSError "OSError") is raised instead of [`IOError`](https://docs.python.org/3/library/exceptions.html#IOError "IOError"), now an alias of the
former.Images are usually in pixels. If you change number of pixel the image size will change
odd meteor
Watch this https://youtu.be/aircAruvnKk if it's not at least 80% clear, let me know maybe I'll try to re-explain it in another way.

What are the neurons, why are there layers, and what is the math underlying it?
Help fund future projects: https://www.patreon.com/3blue1brown
Written/interactive form of this series: https://www.3blue1brown.com/topics/neural-networks
Additional funding for this project provided by Amplify Partners
Typo correction: At 14 minutes 45 seconds, th...
 spare briar
images have a pixel resolution (in microscopy called pixels-per-micron) where each pixel represents an underlying physical dimension
merry ridge
tacit basin
What editor do you use? In Jupiter you can use double question mark to find out ...
I completely misunderstood what you meant by ??. That unfortunately doesn’t help because I need technical details about the implementation of the algorithm. Not usage of the method itself
spare briar
you can plot a single pixel covering your entire monitor
merry ridge
desert oar
unfortunately not really, if something is implemented in a C extension you have ...
That’s helpful in a bearer of bad news sort of way. Thanks for the help
tacit basin
spare briar
images have a pixel resolution (in microscopy called pixels-per-micron) where ea...
But its still one pixel size?
odd meteor
spare briar
images have a pixel resolution (in microscopy called pixels-per-micron) where ea...
Hmm that's interesting. I just learned that now. I suppose that's what @versed gulch was specifically asking for. Perhaps, you can help him here
spare briar
If I have a MNIST image
32x32
I can stretch it and plot it larger
but when that picture was taken physically with the camera
one pixel would correspond to some length
versed gulch
spare briar
images have a pixel resolution (in microscopy called pixels-per-micron) where ea...
so in my case where where in the log file it says the image pixel size is 6.64 mu m does this mean Il have to squash my image (rescale it) by dividing by 6.64?
spare briar
so if I understand right this is a 3d image where the resolution is different in different dimensions
versed gulch
yes but only in the Z dimension so its 6.6.4x6.64x8.8 X Y Z
versed gulch
yes corrected above
spare briar
ok so if you rendered this image
you would want the voxels to be stretched
not cubes right
in your image rendering software you can specify the size of your voxels
versed gulch
so the images were taken slice by slice, yes i did this in ImageJ
 mighty spoke
Hi what does [:1000] mean?
spare briar
ImageJ definitely has this feature
versed gulch
spare briar
in your image rendering software you can specify the size of your voxels
But would I be able to do this in python?
 mild dirge
mighty spoke
Hi what does [:1000] mean?
mild dirge
mighty spoke
Hi what does [:1000] mean?
It takes only the first 1000 elements of some list/iterable
!e
values = [0, 1, 2, 3, 4, 5, 6, 7, 8, 9]

print(values[:5])
ah thanks!
arctic wedgeBOT
@mild dirge :white_check_mark: Your eval job has completed with return code 0.
[0, 1, 2, 3, 4]
zoomArray = desiredshape.astype(float) / original.shape
zoomed = scipy.ndimage.interpolate.zoom(original, zoomArray)
versed gulch
spare briar
try https://docs.scipy.org/doc/scipy-0.15.1/reference/generated/scipy.ndimage.in...
so desiredshape = np.array([6.64, 6.64, 8])?
spare briar
you have a 2d array though right
this is more a rendering problem
like when you have a (1000,1000) array to render in 3d
you define the voxel size in the rendering software
versed gulch
yes 2d slices of a 3d object
spare briar
you dont really use this in numpy
if you want to access the imageJ functions directly you can use this class https://github.com/Dana-Farber-AIOS/pathml/blob/f8789b9ba871b282b829c25227e242e681b36042/pathml/core/slide_backends.py#L245
arctic wedgeBOT
pathml/core/slide_backends.py line 245
class BioFormatsBackend(SlideBackend):```do you have access to software like Imaris?
tbh i would do this in Imaris
if you care about visualization and rendering
versed gulch
no i know how to change the voxel sizes through properties, I just wondered if I would be able to do it in python
spare briar
versed gulch
as I'm going to applying the frangi filter after this on many of the images
spare briar
hm
either the frangi filter algorithm is not using the voxel dimension or you need to rescale your image so each voxel is a cube
versed gulch
spare briar
either the frangi filter algorithm is not using the voxel dimension or you need ...
so basically upscale/stretch the image?
spare briar
yeah it depends on what assumptions the algorithm is making on pixel size
if the algorithm is written so you can provide the voxel size then you dont need to scale
but if it assumes that each voxel is a cube in physical dimension
you need to rescale
btw if you want to analyze your microscopy images in python you should try this https://pathml.readthedocs.io/en/latest/
versed gulch
@spare briar thank you for your help
 candid pollen
Hello all, is there anyone understand LSTM and its implementation?
spare briar
@candid pollen what is your question?
candid pollen
spare briar
<@249569660817637386> what is your question?
im trying to learn more about LSTM but i cant find Many-to-One examples
*that works
or other examples would be nice
i find this presentation is the best for my project but i cant get my head around it

model = Sequential()
model.add(LSTM(50, activation='relu', input_shape=(3, 1)))
model.add(Dense(1))

model.compile(optimizer='adam', loss='mse')

wandb.init(entity='ayush-thakur', project='dl-question-bank')

history = model.fit(X, Y, epochs=1000, validation_split=0.2, verbose=1, callbacks=[WandbCallback()])```
i found this model about many to one but i cant understand how to prepare the data etchave you tried reading the LSTM paper or modern review?
sorry the review I linked was garbage
candid pollen
thats the one that i read but yeah sometimes i understand better with implementation
 mental bane
Guys, can someone please help me with this

I can import numpy with the base environment but not with any other environment that I create
 dense lichen
THE OBJECTIVE OF THIS PROBLEM IS TO RECOGNIZE CHINESE CHARACTERS. (IMAGE PROCESSING-BASED SOLUTION IS MORE PREFERRED COMPARED TO DEEP LEARNING-BASED SOLUTION.) IN CASE OF DL MODEL DEVELOPMENT, USE KERAS.
Can someone link me to some useful resources/ give tips? Im in a hackathon and this is the objective.
odd meteor
mental bane
I can import numpy with the base environment but not with any other environment ...
You need to install all the dependencies you need in your new environment as well. So create VENV and install numpy therein. You might find the attached resources helpful
- https://realpython.com/lessons/creating-virtual-environment/
- https://docs.conda.io/projects/conda/en/latest/user-guide/getting-started.html (if you're using Anaconda on your pc)

So, first of all, we’re going to take a look at where the global environment currently lives, and we can do that with the which command. In this case, I’m going to be using Python 3, which means that I’m going to add this 3 suffix to all of my…
odd meteor
candid pollen
im trying to learn more about LSTM but i cant find Many-to-One examples
An example of Seq2Seq model that characterized many-to-one are:
i) Sentiment Analysis
ii) Classification
You can easily find the examples online where LSTM was used to solve those kinda of problem.
versed gulch
Hi guys I have a 3D array i.e. many 2D greyscale images (slices) which are of shape (30, 400, 400) - (number of slices/images, height, width), I want to turn this into (40, 400, 400) by turning them isotropic, is there a way to do this in python?
candid pollen
odd meteor
An example of Seq2Seq model that characterized many-to-one are:
i) Sentiment Ana...
yup already found it! thanks!
odd meteor
dense lichen
THE OBJECTIVE OF THIS PROBLEM IS TO RECOGNIZE CHINESE CHARACTERS. (IMAGE PROCESS...
- Image processing approach ==> Optical Character Recognition (OCR)
- Deep Learning approach with Keras ==> Try to leverage your knowledge of MNIST . The major difference here is, your input data will be chinese characters instead of numeric values (0-9).
I just did a random search on YouTube and I found this on OCR. Feel free to explore further if need be.... I'm attaching a link below on OCR --hopefully, you'll find it helpful.
https://www.youtube.com/watch?v=ZNrteLp_SvY

OCR isn't just about scanning documents and digitizing old books. Explaining how it can work in a practical setting is Professor Steve Simske (Honorary Professor at the University of Nottingham as well as Director & Chief Technologist at HP Labs' Security Printing Solutions)
http://www.facebook.com/computerphile
https://twitter.com/computer_...
 brave sand
so I was just looking into regex, and I was able to search in a string for missing punctuation, and the basic "who what when where"
but how do I search for ambiguity etc?
 serene scaffold
brave sand
but how do I search for ambiguity etc?
serene scaffold
brave sand
but how do I search for ambiguity etc?
Regex is just pattern matching in the actual characters of the string. It can't do anything that requires awareness of what the words mean.
brave sand
so I have to come up with an algorithm that determines the meaning of the question? that is so vague though
 normal vapor
Hi
i have a question in my task that says what are the attributes that best describe the class (whether or not it has recurring events).
how could i identify that?
serene scaffold
@brave sand have you figured out what constitutes a bad question?
brave sand
Not properly punctuated, too broad, missing nouns or adjectives
serene scaffold
Does bad punctuation actually make it difficult to tell what the question is? Or is it just awkward to read?
brave sand
Awkward to read but not proper english correct?
serene scaffold
A question is bad if it can't be clearly answered. Most of the time, punctuation is just a formality.
brave sand
But what determines if it is can't be clearly answered?
serene scaffold
That's the part you're supposed to be figuring out
brave sand
This is so ambiguous
 proven bolt
Is there anything obvious I can change/fix to get moar speed?
tokenizer = RegexpTokenizer('\<\w+\>|\w+|\$[\d\.]+|\S+')
stopwords_set = set(stopwords.words('english'))

def clean_tokenize_stop_and_stem(x):
    cleaned = clean_this(x)
    return [PorterStemmer().stem(word) for word in tokenizer.tokenize(cleaned) if word not in stopwords_set]

pandarallel.initialize(progress_bar=False, nb_workers=20)

selected_cols = ['domain', 'type', 'url', 'content', 'scraped_at', 'inserted_at', 'updated_at', 'title', 'authors']

def parse_it(from_file, to_file, chunk_size):
        write_header = True
        with pd.read_csv(from_file, chunksize=chunk_size, engine='c', usecols=selected_cols, nrows=100000) as reader:
            reader_tracked = tqdm(reader)
            for df in reader_tracked:
                df['content'] = df['content'].parallel_apply(clean_tokenize_stop_and_stem)
                df['title'] = df['title'].parallel_apply(clean_tokenize_stop_and_stem)
                df.to_csv(to_file, mode='a', index=False, header=write_header)
                write_header = False

parse_it(from_file='raw.csv', to_file='test.csv', chunk_size=10000)
It's used for stemming
I don't know what pandarallel is used for. I haven't used it before
proven bolt
allows for running .apply on a df col with multi thread
brave sand
@serene scaffold From the email the prof sent, quote on quote:
Finding and Fixing Bad Questions We have some questions that we’ve identified as being bad. We don’t know why all of them are bad, but we’d like to make them better. Some patterns that we’ve seen are: Ambiguity Wrong assumptions Wrong interpretations Take a look at the questions. Do you see a pattern? Can you detect this pattern automatically (e.g., with a regular expression)? Can you correct any of the patterns with a simple script that either changes the question or the answers?
What does he mean? Shouldn't bad questions depend on criteria rather than patterns?
 misty flint

We don't know why all of them are bad, but we'd like to make them better.
when you have vague statements like these...you get sub-par results

js
odd meteor
brave sand
<@253696366952316929> From the email the prof sent, quote on quote:
`Finding and...
Can you type some of the identified bad questions?
serene scaffold
brave sand
<@253696366952316929> From the email the prof sent, quote on quote:
`Finding and...
if you're given examples of the sentences that you need to classify as bad, that would be very useful information.
brave sand
serene scaffold
if you're given examples of the sentences that you need to classify as bad, that...
so the email says that I should’ve gotten examples, but I didn’t get any. That email is worded weird
brave sand
odd meteor
Can you type some of the identified bad questions?
That’s the thing, he gives me none
odd meteor
brave sand
That’s the thing, he gives me none
Well, I wouldn't know how to maneuver that if no data was given.
How about using the fire brigade approach? 😀 Since no rule was given as to what qualifies a question as a 'bad question', you could come up a couple of questions that have similar pattern and then use regex to detect questions that doesn't have, say, a "?" sign at the end of the question, or questions where an uppercase letter doesn't come after a full-stop sign (.)
I don't know if that makes sense though.
 main fox
Will it negatively affect my model if I use standardscaler on all of X, if X has dummy variables?
Should I separate these dummy variables, Scale, and then concatenate them to X?
odd meteor
main fox
Will it negatively affect my model if I use standardscaler on all of X, if X has...
No it wont. Applying StandardScaler on your input data is just making your data to follow a Standard Normal distribution which gives a variance score of 1 and mean score of 0.
So a Standard Normal distribution kinda differs from a Gaussian or Normal distribution. However, you can use both method to scale your numeric data.
main fox
odd meteor
No it wont. Applying StandardScaler on your input data is just making your data ...
Thanks. I initially used the StandardScaler and thought I messed up by standardizing my dummies.
desert oar
odd meteor
No it wont. Applying StandardScaler on your input data is just making your data ...
to be clear, StandardScaler does not transform it to be gaussian, it just centers the mean to 0 and the std dev to 1
"standard normal" is gaussian/normal with mean 0 and std dev 1
you can apply this transformation to binary variables, but it substantially changes the interpretation of their associated coefficients/weights
main fox
desert oar
you *can* apply this transformation to binary variables, but it substantially ch...
In practice, how would you perform the scaling?
With the dummies or without?
main fox
I found something interesting

Cross Validated
For the LASSO (and other model selecting procedures) it is crucial to rescale the predictors. The general recommendation I follow is simply to use a 0 mean, 1 standard deviation normalization for
The answer reference Robert Tibshirani, author of the ISLR
desert oar
main fox
I found something interesting
https://stats.stackexchange.com/questions/69568/w...
yep, i would have linked you to the same
see also the Gelman article in the other answer
but in practice people often don't bother to standardize binary variables
main fox
I see, thank your for you advice. I actually find it easier to just pass X to the standard scaler, over separating the dummies and then concatenating them back.
But I realize it's not a good habit to get into if I need to interpret the coefficients of a model.
 barren wedge
any NLP practicioner here?
how you learn about NLP
do you read paper or learn from online course?
serene scaffold
barren wedge
any NLP practicioner here?
how you learn about NLP
do you read paper or learn fr...
I switched majors from linguistics to computer science and worked for my department's NLP specialist, and we published a paper about esoteric NLP stuff.
barren wedge
serene scaffold
I switched majors from linguistics to computer science and worked for my departm...
Can i join your research team?
serene scaffold
barren wedge
Can i join your research team?
I graduated and work in industry now, but you can only work in that research team if you attend that university. I believe this is universally true in the united states.
barren wedge
serene scaffold
I graduated and work in industry now, but you can only work in that research tea...
I see, I'm looking for AI Research teams
but it's pretty hard to find because I'm from Indonesia
Do your company need remote worker in NLP?
i don't search for salary
but i want to make some paper
serene scaffold
barren wedge
Do your company need remote worker in NLP?
i don't search for salary
but i want ...
my company can only hire US citizens
but this isn't a recruitment platform, in either case
barren wedge
i'm sorry if i'm not in context
serene scaffold
Do you speak more than one of Indonesia's languages? Like Bahasa Indonesia + Javanese?
barren wedge
yes
serene scaffold
just those two? or additional ones as well?
serene scaffold
I see. Anyway, if you develop your skills in English, universities in the US and Europe might value your insights into Indonesian linguistics.
barren wedge
melayu, sunda, bali, sasak
barren wedge
serene scaffold
I see. Anyway, if you develop your skills in English, universities in the US and...
what do you mean about develop english skill?
i'm exhausted if i learn about TOEFL preparation
lol
but, maybe i can understand enough english like reading a paper
watching youtube videos, etc
serene scaffold
barren wedge
what do you mean about develop english skill?
i'm exhausted if i learn about TOE...
I understand that learning languages is very difficult (your English skills are better than my Arabic skills), but I don't think you write in English well enough to write research papers.
barren wedge
I see, writing is the most complicated thing for me
but there is Gramarly
what do you think about it?
barren wedge
serene scaffold
I understand that learning languages is very difficult (your English skills are ...
my english could be better if I'm teaming up with english speaking individual
right now, i'm stuck
lol
serene scaffold
barren wedge
I see, writing is the most complicated thing for me
but there is Gramarly
what d...
I've heard both good and bad things about Grammarly. Mostly bad things.
also, Grammarly's backend is written in lisp. and that is very sus.
barren wedge
serene scaffold
I've heard both good and bad things about Grammarly. Mostly bad things.
my friends that got foreign education like in UK or Japan use Gramarly to write their paper
but, it's absolutely not about machine learning paper
barren wedge
serene scaffold
also, Grammarly's backend is written in lisp. and that is very sus.
why?
serene scaffold
barren wedge
why?
(defun lisp
    (
        lisp
    )
    (
        lisp
    )
    (lisp lisp (lisp lisp lisp))
)    ; lisp
Do you know about MILA? https://mila.quebec/en/mila/
Try to shoot your shot there. It's hard to get in but there's no harm in trying. It's usually easier if you do attend ML conferences like NeurIPS, ICML, ICLR etc. You easily can meet NLP researchers in such events. If you play your cards right, they can easily refer you when their prof needs research students.
You might wanna consider applying for Masters or PHD position in good schools. it's the easiest way I know to get into research.

Mila
barren wedge
odd meteor
Do you know about MILA? https://mila.quebec/en/mila/
Try to shoot your shot the...
Thank you, but i don't think i'm fit in higher education system.
i just want to write paper to expand my understanding about AI
barren wedge
serene scaffold
```lisp
(defun lisp
(
lisp
)
(
lisp
)
(lisp ...
so, do you prefer python over lisp?
serene scaffold
well, I'm on this discord and not the lisp one 😛
odd meteor
barren wedge
any NLP practicioner here?
how you learn about NLP
do you read paper or learn fr...
I learn from online courses and practising what I've learned with projects.
barren wedge
serene scaffold
well, I'm on this discord and not the lisp one 😛
lol, i know nothing about lisp
but i'm pretty sure i know about web development
and in my experience, grammarly gives me better advice than my own writing
barren wedge
odd meteor
I learn from online courses and practising what I've learned with projects.
what projects do you work on?
can we teaming up sometimes maybe
odd meteor
barren wedge
what projects do you work on?
can we teaming up sometimes maybe
So lately, I'm learning NMT and I'm working on a pet project. Translating Igbo (my native language) to English
barren wedge
odd meteor
So lately, I'm learning NMT and I'm working on a pet project. Translating Igbo (...
that's great
is it going great?
odd meteor
barren wedge
that's great
is it going great?
Lol I don't think I left it much of an option than to keep going on smoothly
barren wedge
odd meteor
Lol I don't think I left it much of an option than to keep going on smoothly
keep up the good works
odd meteor
barren wedge
keep up the good works
Danke. I wish you well in your journey as well.
 silver sun
Has anyone here created a interactive webapp for their machine learning model? I trying to do that but unsure where to start.
odd meteor
silver sun
Has anyone here created a interactive webapp for their machine learning model? I...
A web app is supposed to be interactive. Do you mean like an interactive visualization deployed as a web app?
silver sun
Yes! that is what I meant lol. Like I want to have a input area for the webapp then visualizations of the results/analysis
odd meteor
silver sun
Yes! that is what I meant lol. Like I want to have a input area for the webapp t...
🙂 I thought as much. I've not personally worked on such but I've seen that kind of project deployed on Streamlit. Check Data Professor on YouTube, I think I've seen such video on his YouTube channel.
tacit basin
silver sun
Yes! that is what I meant lol. Like I want to have a input area for the webapp t...
Or Gradio is nice too
silver sun
@tacit basin @odd meteor Thank you both! I check it out.
 inland zephyr
is anyone have played with numpy and tensorflow? I have an library which only accept numpy array but i only have KerasTensor data. i have try to call data.numpy() as most stackoverflownian said but annoying KerasTensor object does not have numpy attribute error always happen
the numpy library is an wavelet transformation function so it will return a 4 downsized data from original ones
 wild pagoda
hey everyone, so i want this:
hello,world,,,hello,,,,,world
to become:
hello\tworld\t,\thello\t,\t,\tworld
anyclue how to do that?
 hollow sentinel
wild pagoda
hey everyone, so i want this:
```
hello,world,,,hello,,,,,world
```
to become:
`...
hollow sentinel
wild pagoda
hey everyone, so i want this:
```
hello,world,,,hello,,,,,world
```
to become:
`...
there's this function to replace commas or with whatever
i forgot but it's in the doc
and there are videos too
try keywords like string replacement function python
on yt and stuff
you could also iterate through the string and manually do that, but that's a waste of your time
wait are those commas or periods
💀
wild pagoda
hey guys so how to convert
['P\t2.300773e+02\t[kPa]', 'V\t1.668267e+01\t[m/s]', 'W\t2.176429e+03\t[N]', 'S\t3.820309e-18\t[rad]', 'C\t6.997814e-02\t[rad]', 'K\t0.000000e+00\t[-]']
to
[["P", "2.300773e+02", "[kPa]"], ["V", "1.668267e+01", "[m/s]"], ["W", "2.176429e+03", "[N]"], ["S", "3.820309e-18", "[rad]"], ["C", "6.997814e-02", "[rad]"], ["K", "0.000000e+00", "[-]"]]
Split each str on \t
wild pagoda
yeah i make it work thanks!
 rotund cairn
please I need help with these 🫠


 mild dirge
rotund cairn
please I need help with these 🫠
mild dirge
rotund cairn
please I need help with these 🫠
We are not going to make an entire exam for you
arctic wedgeBOT
7. Keep discussions relevant to the channel topic. Each channel's description tells you the topic.
mild dirge
!rule 8
arctic wedgeBOT
8. Do not help with ongoing exams. When helping with homework, help people learn how to do the assignment without doing it for them.
mild dirge
I am currently working on a little project trying to recognize characters of some ancient language. I have a bunch of cropped images of letters to use for training and testing. My first baseline would be to average the images of each class and match against those. The problem is that there are different fonts.
My first idea would be to separate different fonts for each letter. I am unsure how to do this. Would something simple as kmeans clustering work to separate different fonts of each letter?
Is there are more sophisticated way to separate the different fonts?
As a follow up: If anyone has some interesting ideas for recognizing characters, feel free to suggest them ^^
inland zephyr
is it have the same workflow as common classifier right?
do you want to rid off the CNN one? does the image is in color or don't mind if convert it to grayscale one?
inland zephyr
mild dirge
I am currently working on a little project trying to recognize characters of som...
I think the first approach is the right step to match the class. Correct me if I'm wrong here, is there different font with different characters in your dataset (let said Latin, Hieroglyph and Jawi, and each one have their own characters to said the same letter). If your aim to differentiate A for latin and A for Jawi, i think this is pretty hard since you need to know the mean of each characters too. But if you limit the aim to recognize this is Latin, this is Hieroglyph, i think you can just subsampling each picture for each language.
mild dirge
There's 27 letters, these are the averages

But as you can see, some letters are very similar, and each letter has some variations I assume, so instead of matching against these averages, I'd wanna match against the average of the different variations
Already got pretty decent(-ish) results with just matching against averages:
 inland zephyr
hmm interesting, looks like MNIST-like data but with different language.
mild dirge
Yeah it's like one of the oldest writings found iirc
From dead sea scrolls, but these characters are all hebrew
inland zephyr
it is a BW image so i assume it is a grayscale one.
inland zephyr
i have wild idea in here but you should try this. If you pretty common with embedding method using CNN, try to create the feature for each picture. And try the KMeans on it
sorry i mean t-SNE
https://towardsdatascience.com/visualizing-feature-vectors-embeddings-using-pca-and-t-sne-ef157cea3a42?gi=f77b87ad0ff7 i also have try this method to test whether my embedding method combine with image augmentation could easily differentiate a same person
Medium
Learn how to find out oddities or outliers or anomalies in your data by visualizing 2D/3D projections.
 mild harbor
anyone able to help me with some code for getting BFS moves
mild dirge
So I should embed the images using some CNN (which gives feature vectors), then what would t-SNE be for?
inland zephyr
mild dirge
So I should embed the images using some CNN (which gives feature vectors), then ...
The CNN will create an feature or identifier for each image (common size is 512 to 1024 feature). t-SNE method has similar aim as K-Means but the aim is to see if each font has nearest neighboring to the same font with your identifier. I can see if you use common K-Means method, Dalet and Resh font could be the same since its visually similiar. Let the CNN reveal the hidden feature for these font as your feature. Then you could use T-SNE to get the visualization if Dalet and Resh is the different font or not
afaik, you have declare the class and if i not wrong the class is the letter of each font
desert oar
tSNE is for dimension reduction @mild dirge
mild dirge
Maybe I didn't explain my task well enough, the letters are all different, so no two images I showed represent the same letter but a different font, they are all unique letters.
desert oar
UMAP is another similar algorithm
they are meant for reducing high-dimensional data so you can plot in 2d
mild dirge
It seems like your goal was to find out if two letters are just a different font of the same letter no?
inland zephyr
i think this your goal too
mild dirge
My goal was to classify the letters, and to make this a bit easier I wanted to find multiple varieties for each letter, I already know that there are 27 different letters
So no two letters are a different font of the same letter representation
inland zephyr
ah so it's a common classification case
 proper swift
Hi, Im trying to create some dummy data. But I am struggling to create dummy start and end dates. I was wondering what the best way of doing this would be?
mild dirge
inland zephyr
ah so it's a common classification case
Yeah in general it will just be a classification problem with 27 classes
But some look very similar (when looking at just the average)
inland zephyr
proper swift
Hi, Im trying to create some dummy data. But I am struggling to create dummy sta...
why you want to create a dummy for a start and end dates? what is the case for?
inland zephyr
mild dirge
But some look very similar (when looking at just the average)
try using a CNN classifier
it will reveal the hidden feature from similiar font
also a handwritten font should be different for the same font right?
mild dirge
I wanted to first try just some baseline, and then work up to CNN and DNNs
inland zephyr
how bout the baseline result?
mild dirge
what do you mean?
inland zephyr
mild dirge
Already got pretty decent(-ish) results with just matching against averages:
i pretty confused with this chart, umm is the number tell about similarity or something else
?
mild dirge
I split the data into 2 halves there, one half is used to generate an average of each letter, the second half of the data is for testing. Each letter is matched with the closest average letter.
That already gives these accuracies per class
But to increase these accuracies, I thought making multiple averages for each letter would be helpful
By using something like Kmeans to find different versions
binarizer?
No binarization is used at all, still not sure whether to use some global binarization (simply a threshold) are maybe some local method
inland zephyr
i'm sorry to confuse you, do you mean you apply an average filter for each image right?
inland zephyr
mild dirge
No binarization is used at all, still not sure whether to use some global binari...
since this is an grayscale image, a thresholding method as preprocessing is okay
mild dirge
Maybe it helps if I send you a bit of the code if you want to understand it
inland zephyr
sure np
proper swift
inland zephyr
why you want to create a dummy for a start and end dates? what is the case for?
I'm working with some location data at work, but I need to replicate the problem I have so I can show an external colleague. They've requested some dummy data to view basically
mild dirge
# Make a list of average images with their respective letter names (first half of data)
average_images = []
for class_name, class_count in zip(class_names, class_counts):
    average_img = np.zeros(shape=(40, 40))
    for file_name in glob.glob(f'data/{class_name}/*')[:class_count//2]:
        img = cv2.imread(file_name) / 255.0
        img = cv2.resize(img, (40, 40))
        img = np.mean(img, axis=2)
        average_img += img
    average_images.append(average_img / class_count)

average_images = np.array(average_images)
This is the code to make the average image of each class (using the first half of the data)
# Predict the class by the closest average image (test on second half of data)
accuracies = []
for class_name, class_count in zip(class_names, class_counts):
    correct = 0
    image_count = 0
    for file_name in glob.glob(f'data/{class_name}/*')[class_count//2:]:
        image_count += 1
        img = cv2.imread(file_name) / 255.0
        img = cv2.resize(img, (40, 40))
        img = np.mean(img, axis=2)

        # Find the average image with the lowest Manhattan distance
        closest = np.argmin(np.sum(np.abs(average_images - img), axis=(1, 2)))
        prediction = class_names[closest]
        if prediction == class_name:
            correct += 1

    accuracies.append(correct / image_count)
Then this is the code used for prediction
inland zephyr
proper swift
I'm working with some location data at work, but I need to replicate the problem...
hmm looks like an tracker logger right?
mild dirge
mild dirge
```py
# Make a list of average images with their respective letter names (first ...
I take the average over axis 2 here for each image because it has 3 channels btw (but all channels are the same)
brave sand
So the prof sent me a data set, any idea what I should do with this data set to determine if a question is good or not? @serene scaffold
How should I send the spreadsheet?
inland zephyr
inland zephyr
hmm looks like an tracker logger right?
try faker library to create a dummy lat lon https://faker.readthedocs.io/en/master/providers/faker.providers.geo.html
the code is depend on how your data structure
inland zephyr
mild dirge
```py
# Make a list of average images with their respective letter names (first ...
so at the first half you try to apply mean filter for each image per class in the training dataset then do a simple manhattan distance between test and training data
mild dirge
Yeah not sure what you mean with mean filter, but it's literally just the mean of the images per class
inland zephyr
sorry too hype for image processing. If you apply a function or matrix upon your image, you filter the image
proper swift
inland zephyr
hmm looks like an tracker logger right?
sort of yeah.
inland zephyr
mild dirge
Yeah not sure what you mean with mean *filter*, but it's literally just the mean...
with the same process, have you ever try to using thresholding to emphasize the font pattern after the mean and normalize it. Also have to considered cosine similarity which is easier to intepreted imho, and average the distance per test image
you will have the wider perpective with this approach, instead get the minimum distance, try to get the mean and std of the distance
mild dirge
What do you mean with average the distance per test image?
inland zephyr
this is why i suggest cosim since it bounded the distance between 0 (not same) to 1 (similar)
mild dirge
I take the minimum because that is the most similar image, and that will be the prediction
mild dirge
inland zephyr
this is why i suggest cosim since it bounded the distance between 0 (not same) t...
I can always use different distance measures, but the problem more so lies in the fact that different classes look very similar if just averaged
And when using global threshold, it would look something like this (arbitrary threshold chosen)

Again, Dalet and Resh f.e. cannot really be distinguished with just the mean
inland zephyr
try other thresholder maybe? or increase the threshold limit
there are several considerations for the image classification case, like the image dimension you choose, your preprocessing workflow, and the model you use. AFAIK, most character recognizers like this case unnecessarily need preprocessing for each image if using CNN. I suggest you take some references from the MNIST-like experiment as the baseline like this if you want to use k-means as the baseline https://medium.com/@joel_34096/k-means-clustering-for-image-classification-a648f28bdc47.
oh yeah i forgot, try not to mean the data, but just normalize it
and forget about the thresholding
let see if this will improve the result
mild dirge
Well I wouldn't use the mean if I were to use kmeans clustering, was just to get some idea of how similar the letters are and a raw estimate of the accuracy and complexity of the problem
But I think clustering the entirety of the data seems like a good solution
inland zephyr
if not then you should consider let the image as same as it is and don't resize the image.
mild dirge
How would I check similarity if the letters aren't the same size without resizing?
inland zephyr
so this is another problem
what is the mean of your image size?
or the median one? Be careful about resizing your image will break off the image too
mild dirge
It heavily depends, I chose 40x40 a bit arbitrarily after looking at the means per class
Some images are 40x20, 37x35, 25x38 etc.
I can maybe plot it in a scatter plot
mild dirge
I would be resizing then though
And do you think it would be better to resize to 28x28 instead of 40x40?
inland zephyr
it is arbitrary too, since there is an image less than 28 in the size. if you upscale it to 40x40 it will break the image pixel and cause blurry area on your image.
you could start with the smaller dimension of your image, try 25x25 to avoid this image break off
it's night in here and i'm pretty tired now. Hope the best for your project bro
proper swift
@inland zephyr would it be easier to show the problem im trying to answer?
 rich cave
More of a design than a python question but is generating a "neural-net" of some form and tossing dictionaries at it to generate keyboard layouts be a bit overkill? I'm thinking of building a split ergo keyboard from scratch because all the commercial ones I've seen have too many keys.
 plush jungle
can someone explain to me how linear separability works? I thought
w*x + b
is linear because it's the same as y = mx + b
but
relu(w*x + b)  or sigmoid(w*x + b)```
is nonlinear because it has a nonlinear activation functionbut the internet suggests that a single layer perceptron would only be able to solve linearly separable problems because it only has one layer. https://stats.stackexchange.com/questions/263768/can-a-perceptron-with-sigmoid-activation-function-perform-nonlinear-classificati

but in this diagram, why couldn't you just make the sigmoid curve in the top left encompass both black dots?
 vernal solstice
 wicked grove
hello,im training a cnn classifier and wanted to know if i canuse l2 regularizer with adam
i wanted to use l2 regularizer on the softmax layer but wasnt sure if that's how it's done
 swift oxide
hey guys so I was trying to make a logistic regression class learning from python engineer's videos
import numpy as np


class LogisticRegression:
    def __init__(self, lr=0.01, num_iter=1000):
        self.lr = lr
        self.n_iters = num_iter
        self.weights = None
        self.bias = None

    def fit(self, X, y):
        n_samples, n_features = X.shape
        self.weights = np.zeros(n_features)
        self.bias = 0

        for _ in range(self.n_iters):
            linear_model = np.dot(X, self.weights)+self.bias
            y_predicted = self._sigmoid(linear_model)

            dw = (1/n_samples)*np.dot(X.T, (y_predicted-y))
            db = (1/n_samples)*np.sum(y_predicted-y)

            self.weights -= self.lr*dw
            self.bias -= self.lr*dw

    def predict(self, X):
        linear_model = np.dot(X, self.weights)+self.bias
        y_predicted = self._sigmoid(linear_model)
        y_predicted_cls = [1 if i >= 0.5 else 0 for i in y_predicted]
        return y_predicted

    def _sigmoid(self, x):
        return 1/(1+np.exp(-x))

    @property
    def coef_(self):
        return self.bias

    @property
    def intercept_(self):
        return self.weights


# Testing the algorithm
if __name__ == "__main__":
    # Imports
    from sklearn.model_selection import train_test_split
    from sklearn import datasets

    def accuracy(y_true, y_pred):
        accuracy = np.sum(y_true == y_pred) / len(y_true)
        return accuracy

    bc = datasets.load_breast_cancer()
    X, y = bc.data, bc.target

    X_train, X_test, y_train, y_test = train_test_split(
        X, y, test_size=0.2, random_state=1234
    )

    regressor = LogisticRegression(lr=0.0001, num_iter=1000)
    regressor.fit(X_train, y_train)
    predictions = regressor.predict(X_test)

    print("LR classification accuracy:", accuracy(y_test, predictions))
This is the code
I am having an error in this
ValueError: operands could not be broadcast together with shapes (455,) (30,)
I made a similar program for linear regression which works perfectly
I don't know why this is happening
merry ridge
plush jungle
can someone explain to me how linear separability works? I thought
```
w*x + b
...
w*x +b is an affine map. There is a difference between a linear equation/relationship described by y = mx +b and a linear transformation T(x) = Ax.
 sterile rivet
There are many entries named "unemployed" in type column, what piece of code should I use in order to find the number using pandas.

 gloomy dagger
@sterile rivet df[df.type == 'unemployed'].count()
@sterile rivet you can also use df.groupby('type').count() to get all the counts
sterile rivet
gloomy dagger
<@524162026226974731> df[df.type == 'unemployed'].count()
It's showing me this
 gloomy dagger
sterile rivet
It's showing me this
gloomy dagger
sterile rivet
It's showing me this
Are you sure you're looking for the string "unemployed"?
sterile rivet
gloomy dagger
Are you sure you're looking for the string "unemployed"?
uh myb, its showing me 4.2k for alot of columns. Never faced such thing
 gloomy dagger
sterile rivet
uh myb, its showing me 4.2k for alot of columns. Never faced such thing
gloomy dagger
sterile rivet
uh myb, its showing me 4.2k for alot of columns. Never faced such thing
No problem. Remember there's case sensivity. Next you can do:
sui.groupby('Type').count()['Type']
sterile rivet
gloomy dagger
No problem. Remember there's case sensivity. Next you can do:
sui.groupby('Type...
Yep! got it thank you so much!
proper swift
Could anyone help me, group together which orders were in the same unit_id location? I need to figure out which IDs were in the same Unit location on the same days, and how long for.
desert oar
proper swift
Could anyone help me, group together which orders were in the same unit_id locat...
id_groups = {}
for unit_id, ids in orders.groupby('unit_id')['id']:
    id_groups[unit_id] = ids.tolist()
like this?
proper swift
desert oar
```python
id_groups = {}
for unit_id, ids in orders.groupby('unit_id')['id']:
...
That's a nice idea, but i also need to calculate the length of time the products spent together before moving to other locations
I was thinking that the Unit_id would need to be the index, and then sort the values by start_time.
Before applying something like this
df.set_index('unit_id', inplace=True)

df = df.sort_values(by = ['unit_id', 'start_date'], ascending=[True, True])

df['time_together'] = df.groupby('unit_id').start_date.diff()

df
but im not convinced that using .diff() on the start_date col is the right approach
@desert oar hopefully that makes sense/?
desert oar
proper swift
I was thinking that the Unit_id would need to be the index, and then sort the va...
note that you don't need to sort before using groupby
but i'm not entirely sure what the objective is here
df.groupby('unit_id')['start_date'].apply(lambda y: y.max() - y.min()) maybe?
proper swift
@desert oar Sorry I forgot to change the titles. Basically I am looking at some patient data. I want to find which patients were put in the same room, before being moved.
- I want to find the turnover of how frequently patients are being moved
- I want to find the time spent together in the room id, before being moved
desert oar
hopefully it's clear that there's no magic "patient room" functionality in pandas
so your best bet is to use groupby for patient-level data, and then you'll probably want to just loop over rows
or you can use group['room_id'].diff() to find the room change points
 potent fractal
Hey there, I have a numpy array of images and I want to loop that array to create a folder with each of the images as .tif
proper swift
@desert oar yeah I know haha.
Sorry I didnt mean to make it so complicated, just wasnt sure how to phrase my problem properly, and thought it might be easier to use products and orders.
 iron basalt
plush jungle
but the internet suggests that a single layer perceptron would only be able to s...
iron basalt
plush jungle
but the internet suggests that a single layer perceptron would only be able to s...
A gaussian perceptron is not a perceptron. There is only THE perceptron. The gaussian perceptron is something that was made up later that took the name because it was based on the perceptron. The gaussian perceptron is not linear.
Sometimes people will refer to their function as a perceptron because it's based on it. But changing the activation function (there is no concept of various different activation functions in the perceptron) means that it is no longer a perceptron.
It's bad naming / confusion, very common in ML.
Multi-layer perceptron is a thing, but these days when someone says MLP they almost certainly are not referring to the actual multi-layer perceptron. Probably something else, like some feed forward ANN.
Single perceptron: https://www.desmos.com/calculator/l87ncz4cih

Desmos
desert oar
is "the" (multi-layer) perceptron anything other than a specific kind of ANN?
iron basalt
Multi-layer perceptron (fixed a comment): https://www.desmos.com/calculator/ckvnjlv6mh

Desmos
iron basalt
desert oar
is "the" (multi-layer) perceptron anything other than a specific kind of ANN?
It's a specific kind of ANN.
ANN also includes recurrent and such, so it's even more general.
desert oar
right, that's what i thought
iron basalt
Another version of the MLP to make the boundaries more visible of each node: https://www.desmos.com/calculator/zqkehkfz6m

Desmos
A thing to note about sigmoid is that it's basically a smoothed step function.

Desmos
 graceful glacier
hello
i need help with a linear programming problem

^this is the problem and the following table is the price for each flower

how should i set up the linear programming eequation
 fervent flicker
well i guess you could start with the cost function
which in this case is like the "distance" from the best solution. the best solution is the one with the most flowers, so the cost decreases as the number of flowers increases
 trail horizon
have u used pysparser ?
[E053] Could not read config file from C:\Users\Asus\anaconda3\envs\devEnv\lib\site-packages\pyresparser\config.cfg does some one know how to fix this ?
 buoyant lily
hey Guys,
i've been asigned a project to classify some text field into a set of categories,
is SVM the best approach for this type of problem?
plush jungle
iron basalt
A gaussian perceptron is not a perceptron. There is only THE perceptron. The gau...
so a single layer (no hidden layers) neural net with
sigmoid(w*x +b)```
would be able to solve the xor problem? brisk nest
Hello everyone, I've been doing a study on the evaluation of four regression models (Linear, Ridge, Lasso, and Elastic Net) using the sklearn package when given a stock price dataset of multiple companies. I just want to know if I can control the iterations of each model so that I can show their evaluation results through a certain set of iterations.
iron basalt
plush jungle
so a single layer (no hidden layers) neural net with
```py
sigmoid(w*x +b)```
wo...
No.
plush jungle
why not though? the sigmoid function could bend the line around the two black dots while excluding the white dots
iron basalt
Try it.
 iron basalt

Desmos
 daring cape
Pycharm says it cant find keras. I've tried clicking "install package keras" and restarting pycharm but nothing has worked

nevermind i figured it out
a few typos and i switched to just from keras instead of from tensorflow.keras
iron basalt
plush jungle
https://www.desmos.com/calculator/xm6x1obhry (made a mistake, but it did not matter, fixed)
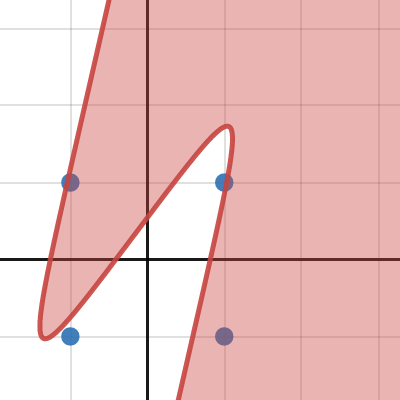
Desmos
2 layers, sigmoid, XOR.
plush jungle
I really appreciate you taking the time to graph both of those
i'm having trouble conceptualizing it though. what is it about multiple layers that makes it suddenly able to curve?
iron basalt
A single guassian activation can do XOR, to understand how multiple sigmoids combined can give the same effect (multi-layer (at least 2 layers)): https://www.desmos.com/calculator/ac489msx8o
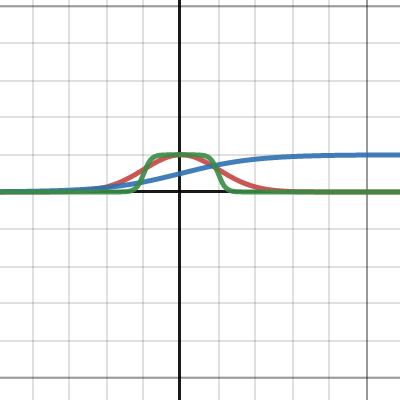
Desmos
plush jungle
when you say a single gaussian activation can do XOR, isn't that what you said a single layer couldn't do earlier? isn't gaussian activation just sigmoid?
iron basalt
Gaussian is not sigmoid.
In mathematics, a Gaussian function, often simply referred to as a Gaussian, is a function of the form
for arbitrary real constants a, b and non-zero c. It is named after the mathematician Carl Friedrich Gauss. The graph of a Gaussian is a characteristic symmetric "bell curve" shape. The parameter a is the height of the curve's peak, b is the p...
In the graph provided, the red curve is a gaussian with a=1,b=0,c=1
iron basalt
The green curve can be interpreted as 3 nodes, 2 sigmoids feeding into a single linear.
plush jungle
cause a gaussian activation could wrap around, but sigmoid can't form a loop like that
yeah i'm playing with the values in the first graph you sent and it's not possible to make it loop
iron basalt
Gaussian is not monotonic.
plush jungle
it's always S shaped
iron basalt
Which is what let it do it with 1 node, compared to the sigmoid.
Sigmoid curves are actually a family of curves that are S-shaped / S-like.
But that specific one is the sigmoid curve.
plush jungle
so the two layers achieves this even without an activation?
iron basalt
With enough nodes you can do whatever.
The types of things an ANN can represent is this general of idea of its representational power.
This definition / idea can also include how well it does that, not just if it can at all.
plush jungle
oh I just realized you need an activation function for nonlinearity
I took out the sigmoid functions and it just turned back into a straight line since it's just 2 linear transformations then
iron basalt
You can have a linear layer which has an activation function of just f(x)=x, but often you want some non-linearity at some point in the network.
plush jungle
right, so to solve nonlinear problems you need at the very least an activation function, and then in most cases (like sigmoid or relu) at least 2 layers
iron basalt
Non-linear functions have training difficulties though which is where the hack of ReLU comes into play.
Linear is easy to deal with.
(And also other ideas like how LSTM works versus just a plain old / classic RNN)
plush jungle
btw, neuron count increases dimensionality and adding more layers increases what exactly?
so if you had 4 inputs and 700 neurons in the hidden layer, it would probably overfit like crazy, and if you had 700 input neurons and 4 hidden layer neurons it would probably generalize like crazy
I think I get that part
iron basalt
Dimensionality can be measured in different ways, and there are multiple aspects of ANNs / the problems they are used in for which the dimensionality can be measured.
plush jungle
but i'm confused about what having deeper or shallower nets changes
iron basalt
Representational power.
They are trying to approximate some function and depending on the problem, the correct function (which is unknown) to be approximated could be stupidly complex / huge.
plush jungle
i've heard that adding more layers eventually makes neural net accuracy start to get worse with every layer added
if adding layers just gives you more representational power, shouldn't a 10 layer network be able to learn a simple problem just as well as a 3 layer one, it just might take more time to converge?
iron basalt
Making the ANN too big / deep can result in lots of unnecessary work when the function to be approximated is very simple. It can also over-fit (without regularization to fight this).
You can think of adding more nodes as making it even more twisty, which can let it twist so much that it perfectly fits the training data, but when you go to test it, it twisted into way too specific of a shape that only gets good results on that training data exactly, and not the test data.
plush jungle
when you say adding more nodes, you mean vertically or horizontally right?
more layers means more nodes, but so does more neurons per layer
iron basalt
Yes. Though IIRC more layers matters more past a certain number of nodes per layer (the remixing matters more as long as you have enough stuff to remix).
(There are some proofs and stuff for these kinds of things but it's been a while since I read them)
plush jungle
this is all really helpful, thanks for teaching me
iron basalt
**This depends on how your network's connectivity works. I am assuming feed forward here.
(When there are cycles things get crazy, and not nearly as much is understood about that)
sterile rivet
What should I do in order to fix it?

 rose agate
sterile rivet
What should I do in order to fix it?
rose agate
sterile rivet
What should I do in order to fix it?
The length of all_tweets and labels are probably different, they need to be the same
sterile rivet
rose agate
The length of all_tweets and labels are probably different, they need to be the ...
Yeah fixed it, ty!
 upper spindle
anyone know how to plot the frequency of comments per day?

to get something like this
 rose agate
upper spindle
to get something like this
rose agate
upper spindle
to get something like this
something like plt.plot(df.groupby('Date').count())
 rose agate
what part? do you mean the axes labels and legend?
there's commands for those, I can never remember them, you'd have to look at the matplotlib documentation
also Jupyter plot size is like plt.rcParams['figure.figsize'] = [10, 5], where you can change the 10/5 for width/height
upper spindle
i want the graph to look exactly like the one with the blue line
 golden wind
Anybody knows a jupyterlab plugin or a workaround which can display the live execution function call stack like in Google Colab on a locally hosted notebook?
 odd meteor
golden wind
Anybody knows a jupyterlab plugin or a workaround which can display the live exe...
odd meteor
golden wind
Anybody knows a jupyterlab plugin or a workaround which can display the live exe...
Idk about such plugging but you might wanna pip install tqdm TQDM shows progress bar when executing a code
fervent flicker
has anyone heard of or seen an audio analysis algorithm that distinguishes the different tones made by a conga drum? i'm working on that and looking for prior work to cite.
golden wind
odd meteor
Idk about such plugging but you might wanna `pip install tqdm` TQDM shows progre...
i know about tqdm, but that isn't used by a lot of processes. this just seems like a nice way of keeping track what is executing
 wet wave
I'm getting scientific notation after loading with pandas.to_sql, anyway to prevent this?
fervent flicker
there is always a way
 desert quartz
Hello people, good day. A query, when I create a column in the DataFrame, how do I store the data in it. I say save it because then I would need to work on the column again before doing a final file output
 nova pollen
as in, write new data to the column or read and place it in a variable
@desert quartz
desert quartz
nova pollen
as in, write new data to the column or read and place it in a variable
Very thanks.
nova pollen
uhh so which one :p
fervent flicker
wet wave
I'm getting scientific notation after loading with pandas.to_sql, anyway to prev...
sorry i wasn't more help. in general there are bound to be several ways to do the conversion AND several points in the data pipeline to do the conversion
list some options for both and try combinations until one works
@nova pollen i'm pretty sure @desert quartz wants to add data to a column in a dataframe
misty flint
im assuming there is no way to get 2 gpus at once with colab right?
theres this model that uses parallel architecture

fervent flicker
@misty flint local gpus, right?
cuz i'm pretty sure you just pay google more and more money if you want to use their gpus
misty flint
thats fine but i think i have to do it on gcp instead of colab itself
just wanted to see if there was an option at all
 viral surge
hey guys, can someone tell me what ide is the best for working with jupyter notebook python?
fervent flicker
jupyter notebook python is an ide
tacit basin
jupyter lab is good
viral surge
not the web one other than that
tacit basin
harder in what way?
vscode has jupyter ui as well, technically it's like a browser because it's electron app 🙂
fervent flicker
i've been able to .... be unable... to open a local jupyter notebook but google colab will always work
tacit basin
oh i see. you can also connect google colab ui to you local kernel
but i prefere jupyter lab/ notebook over colab
fervent flicker
yeah. i like that about colab
jupyter lab here: https://jupyter.org/try-jupyter/lab/
viral surge
also whats the best source for learning ai stuff's for free?
with the math's as well
not only python
fervent flicker
the pinned messages in this discord channel
viral surge
thanks!
fervent flicker
and i would add that if you find tutorials behind the medium.com paywall you can get access to them through https://web.archive.org/
consider tipping the author if you do so
 celest vine
Hi, can we predict what percent will a particular stock move next day, if the only feature we have is daily percentage move?
fervent flicker
no, but i would love to hear counter examples
 uncut plume
Can I send this message? I'm afraid it might clog the chat
fervent flicker
i think the nature of a discord server with thousands of people is rapid turnover in a channel
and that you should just ask your question again if you feel like it and until someone tells you to stop asking
uncut plume
Okay, I'll send it
fervent flicker
i would say you can't predict stock moves because there are so many institutions and smart people building new trading algorithms all the time
uncut plume
Hey. Sorry this might not be data-science related, but I'm using numpy so thought I would ask it in this channel.
I'm trying to make a connect 4 win detection system. For those who don't know, it's like X and O but instead of 3 it's 4 in a row.
My board looks something like this:
[[0, 0, 0, 0, 0, 0, 0]
 [0, 0, 0, 0, 0, 0, 0]
 [0, 0, 0, 0, 0, 0, 0]
 [0, 0, 0, 0, 0, 0, 0]
 [0, 0, 0, 0, 0, 0, 0]
 [0, 0, 0, 0, 0, 0, 0]]
What I'm doing right now is using convolution kernels to detect certain patterns
kernels = [
    np.ones(4, dtype=np.int8),
    np.ones((4, 1), dtype=np.int8),
    np.eye(4, dtype=np.int8),
    np.flip(np.eye(4, dtype=np.int8), axis=1)
]
And then:
def win_checker(board, player):
    for kernel in kernels:
        if (convolve2d(board == player, kernel) == 4).any():
            return True
    return False
But what I want is to instead get the board with the winning position masked. For example:
[[0, 0, 0, 0, 0, 0, 0]
 [0, 0, 0, 0, 0, 0, 0]
 [0, 0, 0, 0, 0, 0, 1]
 [0, 0, 0, 0, 0, 1, 0]
 [0, 0, 0, 0, 1, 0, 0]
 [0, 0, 0, 1, 0, 0, 0]]
This might be a bit overengineered for this small purpose, just a toy project I decided to do lol
fervent flicker
and that it's mostly just voodoo
 cloud lagoon
fervent flicker
cloud lagoon
fervent flicker
@cloud lagoon here: https://www.w3schools.com/sql/default.asp

W3Schools offers free online tutorials, references and exercises in all the major languages of the web. Covering popular subjects like HTML, CSS, JavaScript, Python, SQL, Java, and many, many more.
@uncut plume i think the 2d convolution output can be used to find the location of the overlap
uncut plume
fervent flicker
<@831504941083394059> i think the 2d convolution output can be used to find the ...
Oh it can?
That would be perfect
fervent flicker
there will be a point of maximum overlap
and some fuzzy boundaries where the kernel only partially overlaps
look at the output array from convolve2d
uncut plume
I'm not sure how to find the location of the overlap from this output 😅 https://imgur.com/OEXp5u3

Any ideas? @fervent flicker
fervent flicker
I think your first kernel is a 4 by 4 of all ones, but the kernels should only be the desired winning states. Vertical, horizontal, and the two diagonals
uncut plume
My first kernel is a 1d array of 4 ones
fervent flicker
Oh, and the second one?
uncut plume
kernels = [
    np.ones((1, 4), dtype=np.int8),
    np.ones((4, 1), dtype=np.int8),
    np.eye(4, dtype=np.int8),
    np.flip(np.eye(4, dtype=np.int8), axis=1)
]
Oh, k
uncut plume
Only the last two are square matrices
fervent flicker
So the fourth kernel is the one for this test case. The convolution with that one has a 4 in the place of maximum overlap
Try some other board configurations and check how that 4 moves around
misty flint
fervent flicker
ah, google cloud platform
yes
fervent flicker
Convolution might flip the output compared to what you would expect
 patent scaffold
Hello enthusiasts!
I wrote my first medium blog about Deep Learning today! Please read and review it 😍
You'll surely learn something new today 💯
https://medium.com/@aadarsh_af/18024fd149c8?source=friends_link&sk=93099e1adaddd0d33f1adf2565d802c0
Medium
“This blog is designed for complete beginners in Deep Learning”
tacit basin
i usually use tmux to keep the process (python machine learning training script) running on remote vm, even if i disconnect from vm, the process still runs. then i can connect to it with tmux attach and see the progress of the training etc. Now i just learned in tools channel this is not the best way to achieve it. I tried to read about other ways (systemd, nohup, disown) What do you use to achieve the mentioned result?
 arctic cliff
How do people pick the right nodes for their NN network?
tacit basin
arctic cliff
How do people pick the right nodes for their NN network?
you mean like the number of hidden nodes in a layer and number of hidden layers?
odd meteor
arctic cliff
I've done some research but didn't get much to apply
Unfortunately, there's no rule of thumb that tells how much neurons should be in a hidden layer nor the number of hidden layer a NN should have. So you just have to experiment and play with the number of neurons and hidden layers to find the right balance.
arctic cliff
I see! Thanks a lot!
fervent flicker
@uncut plume for a small board size i would just make a lookup table
you could use itertools to make all the permutations of winning boards
on second thought, this might be too much brute force. but the idea would be to multiply element-wise the board with every board solution until you get a total sum equal to the desired connected tile number
making the collection of board solutions could be tedious until you've found the answer, but it's a simple problem with many possible solutions
arctic cliff
For vectorizing text data into dictionary for binary classification
I know it's not a good idea to loop over +50k rows and count every word so is there a better idea?
 strange zealot
https://www.statsmodels.org/devel/generated/statsmodels.tsa.deterministic.DeterministicProcess.html
could someone guide me as to where i can get more information about Deterministic process. i cant seem to know where to look.
 remote stone
ok
uncut plume
fervent flicker
making the collection of board solutions could be tedious until you've found the...
I see
I’ll give that a try, thanks
 past ravine
tacit basin
https://allendowney.github.io/ElementsOfDataScience/README.html
past ravine
tacit basin
https://allendowney.github.io/ElementsOfDataScience/README.html
thanks miwojc
tacit basin
No worries happy learning.
There are tons of resources to learn so feel free to explore many and pick the one that works for you!
 safe elk
misty flint
hmm hmm
safe elk
misty flint
hmm hmm
Yeah its slow still hours later ... drinks coffee
 lapis sequoia
Join me in this fun interactive session that will help you in exploring Data Analysis and also walk you through the details of the Microsoft Learn Student Ambassador Program.
Key Takeaways:-
-Introduction to Microsoft Learn Student Ambassador
-Overview of what is Data Analysis
-Creating Microsoft Excel Dashboard
-Introduction to Microsoft Power BI
-Quiz and Giveaways
-Q&A
EVENT DETAILS -
Date - 8th May 2022
Day - Sunday
Time - 5:00 PM IST
Duration - 1 Hour
Platform - Microsoft Teams
Event Host - Aditi Gulati (Alpha Microsoft Student Ambassador)
If anyone is interested then DM for registration link
 hybrid mica
When making an AI chatbot, does the chatterbot library not give accurate results?
odd meteor
hybrid mica
When making an AI chatbot, does the chatterbot library not give accurate results...
You might wanna elucidate.
hybrid mica
which gives a smarter AI?
a naive bayes classifier?
the chatterbot library?
a deep learning model?
a seq2seq model?
odd meteor
hybrid mica
When making an AI chatbot, does the chatterbot library not give accurate results...
I've not used chatterbot library. I've only worked with RASA and Diagflow. So was there any reason why you think chatterbot library doesn't give better results?
hybrid mica
It seems to be the one used in any beginner chatbot python tutorial
odd meteor
hybrid mica
which gives a smarter AI?
a naive bayes classifier?
the chatterbot library?
a de...
There are different ways to create a chatbot. Of course the one that uses ML behind the hood will most likely recognize more intents and give more reasonable answers
hybrid mica
all of these use machine learning
odd meteor
hybrid mica
all of these use machine learning
I'm aware. I'll always put my 2 cents on GPT-3 and RASA. Because that's the ones I've seen and used and they both performed well
uncut plume
@fervent flicker
def win_checker():
    for kernel in kernels:
        if (out := convolve2d(board == player, kernel, mode="valid") == 4).any():
            row, col = map(lambda xs: np.ndarray.__getitem__(xs, 0), np.where(out))
            k_row, k_col = kernel.shape
            win_pattern = np.zeros(DIM, dtype=np.uint8)
            win_pattern[row:row+k_row, col:k_col] = kernel
            return win_pattern
    return False
I managed to make it work, I think. Haven't assessed it completely but for now, it works
 tight glacier
How often to use ReLu?
Should it be used after each layer?
or only after some layers?
lapis sequoia
how can I get the value of the upper whisker of a boxplot directly in matplot
rose agate
lapis sequoia
how can I get the value of the upper whisker of a boxplot directly in matplot
this thread seems to have what you want: https://stackoverflow.com/questions/23461713/obtaining-values-used-in-boxplot-using-python-and-matplotlib

Stack Overflow
I can draw a boxplot from data:
import numpy as np
import matplotlib.pyplot as plt
data = np.random.rand(100)
plt.boxplot(data)
Then, the box will range from the 25th-percentile to 75th-percenti...
lapis sequoia
rose agate
this thread seems to have what you want: https://stackoverflow.com/questions/234...
I used exactly this from this post. Was wondering if there was a more direct way in matplotlib
 woven coral
model=Sequential()
model.add(Embedding(vocab_size,output_dim=DIM,weights=[embedding_vectors],input_length=maxlen,trainable=True))
model.add(LSTM(units=128))
model.add(Dense(1,activation="sigmoid"))
model.compile(optimizer="adam",loss="binary_crossentropy",metrics=["acc"])
weights=[embedding_vectors]-------->>>>>>??????????
how can i define weights??
is it good idea if skip this weights ??
spare briar
you've already defined the graph
so you have weights at model.weights
if you want to init the weights a certain way you need to pass a kernel to your layers
woven coral

if i follow this method its give me error
its not working on bangla language but it s working on english language
how to slove this problem any idea??
odd meteor
lapis sequoia
I used exactly this from this post. Was wondering if there was a more direct way...
An alternative to the solution is using an interactive viz library. Plotly and Cufflinks are bam! If you have plotly installed in your machine already, you can re-customize the code below to fit your df and column of interest.
import plotly.express as px
fig = px.histogram(df, x='age', marginal='box', nbins=40, title='Distribution of Age')
fig.update_layout(bargap=0.1)
fig.show()
I think this could be an OOV issue. You're using Word2Vec which is a Word Embedding built using words in English Language. That's probably why it doesn't recognize the word 'bengal' even though it's supposedly a legit word in Bangala language.
This is one of the problems of working with Low-Resource languages in NLP. Welcome to the struggle bruh 🤝
odd meteor
tight glacier
How often to use ReLu?
It depends on how deep your NNs is, the kind of layers ( Conv2D, Embedding, Input, Flatten, Concatenate, TimeDistributed , ... etc) in you NNs, the number of layers where you'd like to apply your activation function on. An activation function isn't always added after each layer. In essence, I'd say there's no generalized answer to your question on how often RELU should be applied. It just depends on the kind of task you're working on and how deep your neural nets is gonna be
 rose girder
Hey can anyone help me with my concatenation issue. Problem is that column names and indexes are different and so I cannot concatenate the files. https://stackoverflow.com/q/72052396
Stack Overflow
I have multiple xls files in a directory.
each file dataframe headers are different but data type is same.
1.xls
Location StreetAddress
America Pvtld 800 st
2.xls
Billtoaddress ...
tacit basin
rose girder
Hey can anyone help me with my concatenation issue. Problem is that column names...
Can you rename the cols?
rose girder
I can rename them but their index positions are not same within files so there will still be an issue with concatenation right @tacit basin
lapis sequoia
past ravine
how do I start Data Science and AI with python?
first learn pandas and numpy
tacit basin
rose girder
I can rename them but their index positions are not same within files so there w...
Here are different joins, etc https://pandas.pydata.org/pandas-docs/stable/user_guide/merging.html
rose girder
@tacit basin thanks. How do I automate the renaming columns within the xls files of the folder though?
 tropic dome
Hey guys, I have an A* algorithm question, suppose the red markers are pharmacies and I want to find the optimal path from the top most one to the bottom most one, now when constructing my tree node, how many connections would each pharmacy have with the other pharmacies?

 eager imp
since @bitter kayak insists - how do i map Iterable[Callable] on a single value onto an array without upsetting numba?
def MIN(*guncs: Iterable[Callable]) -> Callable:
    """Classic AND variant."""
    funcs = []
    for g in guncs:
        try:
            funcs.append(njit(g))
        except TypeError:
            funcs.append(g)

    @njit
    def F(z):
        return min(f(z) for f in funcs)

    return F
problem is the gen exp in the min() which numba is allergic to
i could use np.min, but i don't know how to apply the functions to the var without .. wait i could do it with a for loop? hm..
pedestrian style
hybrid mica
which is the best dataset for a general chat chatbot?
 tidal bough
eager imp
i could use np.min, but i don't know how to apply the functions to the var witho...
tidal bough
eager imp
i could use np.min, but i don't know how to apply the functions to the var witho...
yeah, you probably need to use a normal loop. Also all these guncs better be njitted or numba'll probably be angry.
eager imp
it's all kind of edgy
sigh
it's bouncing between
numba.core.errors.NumbaNotImplementedError: Failed in nopython mode pipeline (step: native lowering)
NumbaExperimentalFeatureWarning: First-class function type feature is experimental
and numba.core.errors.TypingError: Failed in object mode pipeline (step: object mode frontend) Failed in object mode pipeline (step: convert make_function into JIT functions)
numba REALLY doesn't like this code
from numba import njit
from collections.abc import Callable, Iterable


def noop():
    @njit
    def f(x):
        return x
    return f

@jit
def MIN(*guncs:Iterable[Callable]) -> Callable:
    """Classic AND variant."""
    funcs = []
    for g in guncs:
        try:
            funcs.append(njit(g))
        except TypeError:
            funcs.append(g)

    @njit
    def F(z):
        values = []
        for f in funcs:
            values.append(f(z))
        return min(values)

    return F

f1 = MIN(noop(), noop(), noop())
print(f1(0.5))
 quick seal
I keep getting this error, any ideas? AttributeError: module 'tensorflow' has no attribute 'reset_default_graph'
lapis sequoia
quick seal
I keep getting this error, any ideas?` AttributeError: module 'tensorflow' has n...
https://stackoverflow.com/questions/40782271/attributeerror-module-tensorflow-has-no-attribute-reset-default-graph tf.compat.v1.reset_default_graph() could be what you need
quick seal
lapis sequoia
https://stackoverflow.com/questions/40782271/attributeerror-module-tensorflow-ha...
Thanks, that did it.
I keep getting, this. But i have no idea how to execute the last line.
Instructions for updating: Call initializer instance with the dtype argument instead of passing it to the constructor
btw, its tensorflow related
 delicate apex
 lucid abyss
who can make a phishing app
lucid abyss
who can make a phishing app
!rule 5 9
<@&831776746206265384>
arctic wedgeBOT
5. Do not provide or request help on projects that may break laws, breach terms of services, or are malicious or inappropriate.
9. Do not offer or ask for paid work of any kind.
 neat crescent
lucid abyss
i can pay £200
neat crescent
lucid abyss
i can pay £200
We don't allow offering paid work here.
 atomic tide
Yeah @lucid abyss that's not an appropriate question to ask here for multiple reasons.
neat crescent
.>
atomic tide
- off-topic
- malicious and illegal (rule 5)
- paid offer for work (rule 9)
eager imp
tidal bough
I'd remove the `jit` from MIN
the main issue is with jitting F 😦
numba doesn't like generators..
tidal bough
eager imp
the main issue **is** with jitting `F` 😦
I wonder if replacing the list with an array (and then np.mining it) would help
you could similarly store the functions in an array. All to reduce the number of lists/generators/whatever here.
eager imp
hmm
from numba import njit
from collections.abc import Callable, Iterable
import numpy as np


def noop():
    @njit
    def f(x):
        return x
    return f

def MIN(*guncs:Iterable[Callable]) -> Callable:
    """Classic AND variant."""
    funcs = np.ndarray((len(guncs),), object)
    for i, g in enumerate(guncs):
        try:
            funcs[i] = njit(g)
        except TypeError:
            funcs[i] = g

    @njit
    def F(z):
        values = np.ndarray((len(funcs),), object)
        for i,f in enumerate(funcs):
            values[i] = f(z)
        return np.min(values)
    return F

f1 = MIN(noop(), noop(), noop())
print(f1(0.5))
now produces
print(f1(0.5))
File "G:\Python398\lib\site-packages\numba\core\dispatcher.py", line 468, in _compile_for_args
error_rewrite(e, 'typing')
File "G:\Python398\lib\site-packages\numba\core\dispatcher.py", line 409, in error_rewrite
raise e.with_traceback(None)
numba.core.errors.TypingError: Failed in nopython mode pipeline (step: nopython frontend)
[1mUntyped global name 'object':[0m [1m[1mCannot determine Numba type of <class 'type'>[0m
[1m
File ".test8.py", line 23:[0m
[1m def F(z):
[1m values = np.ndarray((len(funcs),), object)
[0m [1m^[0m[0m
[0m
oh, i need to pass it as kwarg
hu
nope
tidal bough
try not passing the dtype maybe
eager imp
not passing it produces..
    funcs[i] = g
TypeError: float() argument must be a string or a number, not 'CPUDispatcher'
oh, right
The following scalar types and features are not supported:
Arbitrary Python objects
eager imp
rock and a hard place
tidal bough
hmm, so no array of functions
eager imp
considering that this is one of the simplest of combinator functions, i'm a bit frustrated 😦
 grizzled barn
roughly how skilled at calc and alg should i be to be able to do 'well' with a.i and data science programming? im currently a hs freshman, so much of that will have to be self taught.
serene scaffold
grizzled barn
roughly how skilled at calc and alg should i be to be able to do 'well' with a.i...
I don't know how you can quantity that. But pretty much all programming can involve algebra. Machine learning will involve calculus, linear algebra, and stats. If you want to become a professional AI dev, you should focus on doing well in the math course you're currently taking, and taking advanced math courses where you can.
grizzled barn
serene scaffold
I don't know how you can quantity that. But pretty much all programming can invo...
thats fair, and yea i kinda assumed you cant really quantify that, was hoping i could still get an answer though lol, so ty. i can definitely take ap stat, but i wont be taking calc until im a junior or senior. are there any good ways you recommend learning it myself?
id rather not have to wait 2-3 years to be taught it, lol
rose agate
grizzled barn
thats fair, and yea i kinda assumed you cant really quantify that, was hoping i ...
I think everyone used to recommend Khan Academy, don't know what they'd recommend now. There's whole calculus courses on YouTube as well
I'd also recommend 3blue1brown's essence of calculus series for a general overview
iron basalt
grizzled barn
thats fair, and yea i kinda assumed you cant really quantify that, was hoping i ...
The hard way / best way is still to get just get a book and read it. Also, extremely important is to actually do all the practice problems at the end of each section (if you skip this part, you have learned nothing). Other than that, there are other resources which can supplement that, such as https://brilliant.org (i'm not sponsored, but it seemed very good to me, and I would have used it had it existed at that time). And also another favorite supplement and also something to help get you interested in mathematical topics in general is 3blue1brown (3b1b) (also has essence of linear algebra and more): https://www.youtube.com/watch?v=WUvTyaaNkzM&list=PL0-GT3co4r2wlh6UHTUeQsrf3mlS2lk6x

Brilliant - Build quantitative skills in math, science, and computer science
with hands-on, interactive lessons.

What might it feel like to invent calculus?
Help fund future projects: https://www.patreon.com/3blue1brown
An equally valuable form of support is to simply share some of the videos.
Special thanks to these supporters: http://3b1b.co/lessons/essence-of-calculus#thanks
In this first video of the series, we see how unraveling the nuances of a simp...
grizzled barn
iron basalt
The hard way / best way is still to get just get a book and read it. Also, extre...
good to hear, since ive already got brilliant, i personally really like it. Ill take a look at 3b1b too, thanks!
grizzled barn
rose agate
I think everyone used to recommend Khan Academy, don't know what they'd recommen...
Khan Academy definitely seems like a staple for learning math, so ill start there too 💪
iron basalt
Kahn academy is also a thing, and pretty good for when you need to see examples of problems being worked through.
I also recommend playing around with various curves / functions in a graphing calculator such as desmos. Being able to look at something like x^2+y^2=4 (or some other equation or function or in the case of linear algebra a matrix, etc) and immediately say "circle" is a very useful skill.
lapis sequoia
Hi guys - can someone review my idea :
A robot program which has loads of data of shapes that can be manipulated - a camera which looks in the external environment and looks for shapes within the said environment and then simulates the environment with the shapes instead of imagery ?
Since the shapes are manipulatable , would we be able to use the shape environment to experiment with outcomes for zero shot learning ?
and if it can't find an outcome - it leads to the system experimenting (moving objects physically) to get more data
I'm trying to find how to improve learning in computers and make it more like how humans do it
 fringe knoll
sounds like the next project for Boston dynamics
lapis sequoia
what next project ?
iron basalt
lapis sequoia
Hi guys - can someone review my idea :
What you described is called a world model in ML.
lapis sequoia
iron basalt
What you described is called a world model in ML.
How are machines currently creating world models ?
iron basalt
lapis sequoia
How are machines currently creating world models ?
I'm not going to describe multiple books worth of stuff in a chat room. I recommend searching for world models in ML online.
There are many ways, and it's open ended and unsolved.
lapis sequoia
Okay, thanks for your answer though, I'm gonna do a bit more looking about
iron basalt
I will give you one popular example (popular, but not necessarily the best), it might give you some idea of how it works: https://www.youtube.com/watch?v=udPY5rQVoW0

GAN Theft Auto is a Generative Adversarial Network that recreates the Grand Theft Auto 5 environment. It is created using a GameGAN fork based on NVIDIA's GameGAN research.
With GAN Theft Auto, the neural network is the environment and you can play within it.
Github: https://github.com/sentdex/GANTheftAuto/
Unboxing and reviewing the DGX St...
lapis sequoia
Just looked it up and that is exactly what I was describing. Thank-you ❤️
iron basalt
Note that the output is this blurry mess because the system is not exactly designed to correctly draw the scene, this is basically a debug view. You could setup something to actually have it draw it nicely.
lapis sequoia
Where would you recommend to get knowledge about this stuff ? I did my A-levels in CS and I've never heard of world models before
iron basalt
(It needs to understand the world, not be able to draw it well)
World models are fundamental to robotics, machine learning, and AI. You can probably find several books about it. A lot of the best and most interesting stuff can be found in various world modelling papers published.
(Which are reviewed / summarized in various other places such as Youtube)
lapis sequoia
Thanks man - really appreciate it , I'm gonna spend the rest of the day learning about this stuff (probably)
iron basalt
World models in robotics can include the robot itself (model of self): https://www.youtube.com/watch?v=XM-rKTOyD_k

❤️ Check out Weights & Biases and sign up for a free demo here: https://wandb.com/papers
❤️ Their mentioned post is available here (Thank you Soumik Rakshit!): http://wandb.me/perceptive-locomotion
📝 The paper "Learning robust perceptive locomotion for quadrupedal robots in the wild" is available here:
https://leggedrobotics.github.io/rl-perce...
 compact parrot
can someony explain why is this happening? It opens another file, ores/iron_ore.png
 spare briar
iron basalt
I will give you one popular example (popular, but not necessarily the best), it ...
spare briar
iron basalt
I will give you one popular example (popular, but not necessarily the best), it ...
lol gamegan so cursed
terrible terrible ideas
compact parrot
tried with another image - opens correctly
test_ore with alpha channel - broken
 balmy junco
What are a few of the best performing online complete coverage path planning algorithms?
 ripe forge
compact parrot
can someony explain why is this happening? It opens another file, ores/iron_ore....
ripe forge
compact parrot
can someony explain why is this happening? It opens another file, ores/iron_ore....
Try with the full path to image.
lapis sequoia
Join me in this fun interactive session that will help you in exploring Data Analysis and also walk you through the details of the Microsoft Learn Student Ambassador Program.
Key Takeaways:-
-Introduction to Microsoft Learn Student Ambassador
-Overview of what is Data Analysis
-Creating Microsoft Excel Dashboard
-Introduction to Microsoft Power BI
-Quiz and Giveaways
-Q&A
EVENT DETAILS -
Date - 8th May 2022
Day - Sunday
Time - 5:00 PM IST
Duration - 1 Hour
Platform - Microsoft Teams
Event Host - Aditi Gulati (Alpha Microsoft Student Ambassador)
If anyone is interested then DM for registrations
 karmic aspen
datascience seems nice
 fervent zenith
how do i label dates in slicer as week 1 week 2 week 3?

 desert bear
hi is there a way to load a tensorflow model without importing tensorflow becouse i cant get tensorflow installed on my pi
 somber prism
guys i have one doubt on how rnn produce an output, take ner as an example prob for this one and have to output 1 for all the names from the sentence and 0 otherwise, so will the rnn feed the each token into the network and then the rest and finally output the ohe for all the sequence or it outputs right after one token is sent to the network
?
tidal bough
desert bear
hi is there a way to load a tensorflow model without importing tensorflow becous...
load it? probably, it most likely uses some numpy format like npz. run it? wouldn't be so sure
desert bear
tidal bough
load it? probably, it most likely uses some numpy format like `npz`. run it? wou...
this is the code ```py
import numpy as np
from tensorflow.keras.models import load_model
labels = open('nlu/entities.txt', 'r', encoding='utf-8').read().split('\n')
model = load_model('nlu/model.h5')
label2idx = {}
idx2label = {}
for k, label in enumerate(labels):
label2idx[label] = k
idx2label[k] = label
Classify any given text into a category of our NLU framework
def classify(text):
# Create an input array
x = np.zeros((1, 57, 256), dtype='float32')
if len(text) > 25:
    text = text[:25]
# Fill the x array with data from input text
for k, ch in enumerate(bytes(text.encode('utf-8'))):
    x[0, k, int(ch)] = 1.0

out = model.predict(x)
idx = out.argmax()

# print('Text: "{}" is classified as "{}"'.format(text, idx2label[idx]))
return {"entity": idx2label[idx], "conf": max(out[0])}
becouse i cant install tensorflow on my pi i cant run it so i am trying to fix it

 pastel valley
if i have a model that can classify either if a cat or dog or rabbit is in the image and i want the input to be checked first if there is a cat, dog, rabbit on the image before classifying the type of pet on the image what is the correct approach?
i am using keras cnn
is it like i trained 2 models first is to detect if there is a pet on the image and of it outputs true i pass the input image to the 2nd model which is the one that classify which type of pet are in the image?
 nova totem
Good morning guys, I'm looking in the jupyter notebook documentation. But it explains how jupyter cells work, what I'm looking for would be the number it finds. Because I'm passing a test library, in the code I pass True, which would be to run through the entire jupyter, it runs smoothly. More passing the cell will not. I'm counting the number of cells, of course code, not execution, 0, 1, 2.... For me it's giving 11 where is the function I want to test. But running the test gives error. Someone to give me this help
tacit basin
nova totem
Good morning guys, I'm looking in the jupyter notebook documentation. But it exp...
What's the test library?
nova totem
tacit basin
What's the test library?
textbook
tacit basin
nova totem
textbook
Ok. Didn't use it. But what do you test in your notebook and what error you get?
 novel raven
I don't understand how does the Hidden Layer works and how does it connects with the input layer
spare briar
desert bear
becouse i cant install tensorflow on my pi i cant run it so i am trying to fix i...
you have a few options including tflite, onnx, tensorrt
spare briar
novel raven
I don't understand how does the Hidden Layer works and how does it connects with...
inner product
 brittle radish
Please advice me to do best projects on power bi,sql, python for show my portfolio
nova totem
tacit basin
Ok. Didn't use it. But what do you test in your notebook and what error you get?
self = <testbook.client.TestbookNotebookClient object at 0x7f42735e2620>
tag = 'cell-11'

    def _cell_index(self, tag: Union[int, str]) -> int:
        """
        Get cell index from the cell tag
        """

        if isinstance(tag, int):
            return tag
        elif not isinstance(tag, str):
            raise TypeError('expected tag as str')

        for idx, cell in enumerate(self.cells):
            metadata = cell['metadata']
            if "tags" in metadata and tag in metadata['tags']:
                return idx


>       raise TestbookCellTagNotFoundError("Cell tag '{}' not found".format(tag))
E       testbook.exceptions.TestbookCellTagNotFoundError: Cell tag 'cell-11' not found
As I have a short term, I leave doing the tests running the entire notebook, finishing I will research more about it. Textbook content is small. Have to find code on the net
tacit basin
nova totem
As I have a short term, I leave doing the tests running the entire notebook, fin...
What's the purpose of this test?
odd meteor
brittle radish
Please advice me to do best projects on power bi,sql, python for show my portfol...
I think 'best project' is subjective. What do you have passion for? What scenario / subject gives you wings like Redbull? It could be healthcare, mental health, gender equality, marvel universe, neuroscience, etc.... Find a particular subject that interests you, then channel your creativity towards that field with your data science and python skill.
You could make it an End to End project if you wanna kill two birds (in your case; multiple birds) with one stone.
- Web Scrapping -- use selenium, beautifulsoup, or scrappy etc to scrap data from a website
- SQL -- Write a SQL query to add the scrapped data to your database with PyMysql, Pyodbc, SQLalchemy etc
- Build a viz dashboard by connecting your PowerBI or Tableau to the scrapped data in your SQL database
- Create a problem statement off the available data you've scrapped, then build your ML model
- Deploy your model with perhaps, Streamlit, FastAPI, Flask, Gradio, etc.
At the end of the day you'll be able to showcase your knowledge in Python, Sql, PowerBI with one solid project.
nova totem
tacit basin
What's the purpose of this test?
Apply the refactoring method. Change function Declaration. I will have to present this. I want to use the notebook to document the step by step.
I'm finishing too. Sent you his repository. After presentation with the teacher
I only had a problem with this issue of using a specific cell.
lapis sequoia
What kind of graphs can I make for analysing the relationship between a categorical(Boolean) and a discrete continuous feature.
serene scaffold
lapis sequoia
What kind of graphs can I make for analysing the relationship between a categori...
What is a discrete continuous feature?
lapis sequoia
I was thinking of doing a plot of going through all the values in the numeric feature. And to plot the fraction of positive booleans beyond that point.
Then I could do one that checks fraction before those points. And try to analyse some shit from there. Lol
serene scaffold
@lapis sequoia you could do stacked bar charts

 serene scaffold
lapis sequoia
The bottom one?
serene scaffold
lapis sequoia
The bottom one?
Yes. Though idk what the black lines are for
lapis sequoia
What do you suggest I plot with it
lapis sequoia
lapis sequoia
I was thinking of doing a plot of going through all the values in the numeric fe...
This?
serene scaffold
lapis sequoia
This?
Yes
lapis sequoia
Sounds good. I actually slightly changed my idea. That shit was stupid. Now I will do it for different value ranges in the numeric variable. The Age varies from 40,95. So I will plot the positive fraction for 40-45, 45-50, 50-55.
Along with the number of samples used for each range.
serene scaffold
@lapis sequoia if I understand you correctly, what you are doing is called binning. Which is a type of descretizing
lapis sequoia
I have no idea about formal terms :( no stats knowledge.
Should have studied it from Khan academy.
serene scaffold
Well, now you know 😁
lapis sequoia
I have the stats paper next sem. But they are making us do exploration without teaching much stats. Other than bar graphs.
serene scaffold
lapis sequoia
I have the stats paper next sem. But they are making us do exploration without t...
It's good that you know that there are different kinds of features, at least 😁
lapis sequoia
yeah some amount we learnt. I kept thinking I shoudnt learn stats on my own because i am gonna learn it next sem. but it would have been really helpful if i went to utube
lapis sequoia
@serene scaffold what do you think about my graph mate!

It's pretty useless though. Because the number of samples in some bins like the last is so low, that they are not good description of that age group.
tidal bough
Conclusion: anaemia vastly increases life expectancy. Indeed, anaemic subjects were 8 times more likely to reach an age of 90 years than non-anaemic subjects 🥴
lapis sequoia
lol
lapis sequoia
look I made it better by dividing data in 3 equal sample sizes sortedly.

But now I am so tired of doing this useless nonsense. Lol
Watch me copy the same code for the rest of the Boolean columns with age too 😁
lapis sequoia
Hi Everyone
I need a help . Can anyone suggest me a course or book for learning Artificial Intelligence from beginning ?
safe elk
tidal bough
Conclusion: anaemia vastly increases life expectancy. Indeed, anaemic subjects w...
What I got borderline low iron
misty flint
tidal bough
Conclusion: anaemia vastly increases life expectancy. Indeed, anaemic subjects w...
bruh
this is a lesson on how to use statistics for evil

people dont read what the n is. they just look at the stacked bar graph
misty flint
lapis sequoia
It's pretty useless though. Because the number of samples in some bins like the ...
in public health and medical data, people dont bin age groups like this for this reason
look into how they do it irl
tacit basin
nova totem
Apply the refactoring method. Change function Declaration. I will have to presen...
Refactoring is different than testing.
tacit basin
nova totem
I only had a problem with this issue of using a specific cell.
Not sure what the issue is and how is it linked to testing?
 lusty valley
anyone have anything to read on credit risk? risk of lending and how you can assign someone a score and predict whether they will default or nah?
 granite merlin
import csv
import pandas as pd
import plotly.express as px
read_file = pd.read_excel('raw-data.xlsx')
read_file.to_csv('raw-data.csv', index = None, header = True)
df = pd.DataFrame(pd.read_csv('raw-data.csv'))
with open('raw-data.csv') as f:
reader = csv.DictReader(f)
fig = px.scatter(reader, x = 'weeks', y = 'days')
fig.show()
Guys is the correct way to convert xlsx file to csv ?!
lusty valley
think the indentation at the end is wrong
on your viz
fig should not be indented like that
granite merlin
do u mean fig should be outside with open ?
 lapis sequoia
no one is helping . Pretty good
lusty valley
pd.read_excel('cat.xlsx', engine='openpyxl')
lusty valley
lapis sequoia
I need a help . Can anyone suggest me a course or book for learning Artificial I...
Yes I can recommend a few books
granite merlin
lusty valley
pd.read_excel('cat.xlsx', engine='openpyxl')
when i add that it says "file is not a zip file"
lusty valley
courses udemy, coursera, udacity, freecodecamp, code academy, data quest, datacamp (my fav)
lapis sequoia
lusty valley
courses udemy, coursera, udacity, freecodecamp, code academy, data quest, dataca...
Thanks
lusty valley
granite merlin
when i add that it says "file is not a zip file"
xl_file = pd.ExcelFile(file_name, sheet_name=None)

dfs = {sheet_name: xl_file.parse(sheet_name)
          for sheet_name in xl_file.sheet_names}
that gets you dictionaries of each sheet in the excel file
lusty valley
lapis sequoia
Thanks
books would be “An Introduction to Statistical Learning” and “Hands on Machine Learning II”
I’m currently reading “Probabilistic Machine Learning, an Introduction”
granite merlin
lusty valley
```
xl_file = pd.ExcelFile(file_name, sheet_name=None)
dfs = {sheet_name: xl_f...
now it says "module pandas has no attribute ExcelFile"
lusty valley
granite merlin
now it says "module pandas has no attribute ExcelFile"
try naming the sheet name in your read_excel statement
openpyxl should have worked
maybe update your pandas version
sheetname=0
granite merlin
lusty valley
try naming the sheet name in your ```read_excel``` statement
nah, it's still not working
granite merlin
lusty valley
maybe update your pandas version
i'm working on colab so i don't think i'll have to update it
lusty valley
update pandas, use old code but with sheetname=0 in your read_excel
you could always just save as inside excel
do it manually
granite merlin
lusty valley
update pandas, use old code but with sheetname=0 in your read_excel
okay gottcha
@lusty valley can u do me a favor, can u please write the code and run it and send it, i'm kinda struggling in it

 barren wedge
Why AI Research so heavily relies on Well Known University such as ivy league, how can we compete with them? As a freelance or hobbies researcher
 short heart
what models are there for human object detection that can be used?
 grave frost
barren wedge
Why AI Research so heavily relies on Well Known University such as ivy league, h...
grave frost
barren wedge
Why AI Research so heavily relies on Well Known University such as ivy league, h...
by joining open source collectives, which are as competitive most of the times too
 wooden sail
i'd add that using existing AI libraries, making efficient implementations of well-known results, and testing different network architectures can be done quite well by anyone, but providing good explanations and motivation why they work, as well as producing brand new results and theory requires some in depth knowledge of the underlying maths. not to say you can't do this as freelance or hobbyist, but you need to invest a lot of time into learning these things. go through a handful of books, do some experiments, etc. then if you want to publish your results without being associated to a university or a company, it can be challenging to get the required backup, be it because research outlets will ask for some trustworthy source to vouch for you, or because you have to pay some handsome amount of money to publish (which, normally, a research institution pays instead of you). this last part is purely lobbying.
 kind solar
Hello everyone, I am pursuing a Python field. Currently, I do a lot and am quite proficient in applying Python in the website field. Recently, I want to understand and learn the fields of machine learning, and AI with the camera, such as analysis and recognition. Like in the web field, starting with a web framework like Django, Flask,... So what machine learning should I learn, and what tools should I use for long-term development? Thanks
barren wedge
grave frost
by joining open source collectives, which are as competitive most of the times t...
What is it?
 supple leaf
sterile rivet
This is the error, what could be done?
supple leaf
sterile rivet
This is the error, what could be done?
I have the same problem right now. I read online and it said i should add more brackets like this.
[[0, 0, 1, 0, 0, 2 ....... ]]. Try it. However a new problem appeared when I did that. Now it says "ValueError: could not convert string to float: 'X values'"
Or did you solve it in any other way?
 boreal mauve
Hello everyone, I have slight problem with resampling my data frame. It looks like that:

I need to group it by hour, sum up the columns. With: data = data.resample('H').sum() I get:

I don't even have data at 2014-11-10 00:00:00 1/2/ etc. I want this to start at the 6:00 like the data starts, any idea why its happening like that?
grave frost
barren wedge
What is it?
if you're truly qualified, i.e have different approaches, a good amount of knowledge etc. you can join top-tier research groups like EleutherAI and collaborate with other Ivy scientists
EAI is free to join and contribute, but if you want your name in a publication you need to put in the extra mile
supple leaf
Im trying to use support vector regression. To plot the datapoints i have in an excel in the picture below:
There are 95 points in it

This is my code:
import pandas as pd
import numpy as np
import matplotlib.pyplot as plt


dataset = pd.read_excel(r'/Users/pontusskol/Desktop/data.xlsx')

X = list(dataset[['X values']])
y = list(dataset[['Y values']])

from sklearn.preprocessing import StandardScaler

sc_X = StandardScaler()
sc_y = StandardScaler()
X = sc_X.fit_transform(X)
y = sc_y.fit_transform(y)

from sklearn.svm import SVR
regressor = SVR(kernel='rbf')
regressor.fit(X,y)

y_pred = regressor.predict([[6.5]])
y_pred = sc_y.inverse_transform(y_pred)

X_grid = np.arange(min(X),max(X),0.01)
X_grid = X_grid.reshape((len(X_grid),1))
plt.scatter(X,y,color = 'red')
plt.plot(X_grid, regressor.predict(X_grid), color = 'blue')
plt.title('Energy prices per kWh (öre/kWh), as a function of time')
plt.xlabel('Time(h)')
plt.ylabel('öre/kWh')
plt.show()
I get the following error message: ValueError: could not convert string to float: 'X values'
Ive googled and all but i just cant seem to solve it. How do i convert it to float?
desert quartz
Good community. I bring a query that arises from a problem. I am parsing files with pandas. the tables that I analyze are always the same, only that depending on the file, the index location can change. Now, manually, I only change the index and that's it; but I would like the program to change the index automatically so that it detects the table. This is possible?
serene scaffold
@desert quartz is the index just ascending numbers? Or is it one of the columns in the file?
desert quartz
serene scaffold
<@699406323267403877> is the index just ascending numbers? Or is it one of the c...
Hello. It is a table with many columns, containing different types of data.
desert quartz
For example in a file, I access the table through index 0, as I show it with this code "df= pd.DataFrame(datos[0])". Other times I do it through index 1 as I show it with this code "df= pd.DataFrame(datos[1])". But I want it to be automatic.
serene scaffold
@desert quartz it would probably make more sense to open the whole file into one DataFrame and slice it with loc or iloc as needed
desert quartz
serene scaffold
<@699406323267403877> it would probably make more sense to open the whole file i...
OK my friend. I'll investigate what you're proposing. Thank you so much.
serene scaffold
desert quartz
OK my friend. I'll investigate what you're proposing. Thank you so much.
No problem! I'm going to be flying most of today. If I were at a desktop I'd get into it with you.
 jaunty mural
Hi, there who can suggest what color is better for scatter plot?
like this one

what's css color should I use for it orwould it be better option to change background?
serene scaffold
jaunty mural
Hi, there who can suggest what color is better for scatter plot?
if you're just picking arbitrary colors, pick two colors that are very distinct, but which aren't a common issue for color blindness.
orange and red are too similar, unless you're using multiple colors and you want to show that those two classes are similar.
jaunty mural
serene scaffold
if you're just picking arbitrary colors, pick two colors that are very distinct,...
thanks man) I start googling about it
also, question how to display legend not according to two lines, but for entire plot?
tidal bough
Do you mean, like, a title for the entire plot? plt.title sets it.
 spring stirrup
df.mean() how change to rechange to df ?
supple leaf
Could someone please explain to me how I can choose the values of the columns under X value and Y value?
X = dataset.iloc[:, 1:2].values.astype(float)
y = dataset.iloc[:, 2:3].values.astype(float)
I dont really understand how the indexes within the brackets work. How do I reach the values under X values and Y values?
 serene scaffold
@supple leaf df['X values'].to_numpy() is probably what you want.
It looks like they're already encoded as floats.
It's better to depend on the actual names of the columns where you can, since this makes your intentions more clear
supple leaf
Like this, right?
 serene scaffold
Unless you're sure you need a python list, just use the pandas structure
supple leaf
serene scaffold
Unless you're sure you need a python list, just use the pandas structure
Thank you, I think i will solve it now!
 robust jungle
Anyone mind explaining to me why activation functions are used?
odd meteor
robust jungle
Anyone mind explaining to me why activation functions are used?
Simply put, activation function is what you introduce in your neural network to enable it capture non linearities (non-linear relationships present in your data), thereby making your neural network achieve its maximum predictive power.
robust jungle
odd meteor
Simply put, activation function is what you introduce in your neural network to ...
I get that, but not how it achieves that
spare briar
robust jungle
I get that, but not how it achieves that
if i stack fully connected layers without activation functions i am basically composing inner products
but inner products are linear
robust jungle
spare briar
if i stack fully connected layers without activation functions i am basically co...
I get what they do but not how they do it
spare briar
they are nonlinear
a neural network is a function that is a composition of these layers
each of which defines its own function
the activation function is a nonlinear function so that the neural network as a whole can be a nonlinear function
odd meteor
robust jungle
I get that, but not how it achieves that
just think of your activation function as a Mathematical Function, because that's what they really are. For example, Tanh activation function is simply your hyperbolic tangent in Math. When this function is applied to to data, if the relationship in the data isn't linear; i.e a straight line relationship, it's this tanh (an activation function) that will enable you to capture non-linearities in the data.
This is better understood when it's explained with a graph. So I'm gonna try to be a little more illustrative.
 robust jungle
I understand that they enable it to be nonlinear and why that’s important
Im asking why these specific functions work
spare briar
there are multiple considerations here, first you need a function that is differentiable (or almost-everywhere differentiable in the case of ReLU activation we define the derivative at 0) and efficient
then you want the model to optimize well, and there are many considerations here including exploding/vanishing gradient
the most popular modern activations are basically the nonlinearities that are efficient and work best empirically (see http://proceedings.mlr.press/v15/glorot11a/glorot11a.pdf, https://arxiv.org/abs/1606.08415, https://arxiv.org/abs/1710.05941)
in general you want simple nonlinearities since they are composed through layers of the nn to express more complex nonlinear functions
@robust jungle
robust jungle
Good hbu?
 coarse burrow
I'm doing well!
robust jungle
That’s good to hear
 astral portal
hey guys, what if I want to predict the future? i want to predict what sales would be in May? what is my train set/test set ?
i know is kind of stupid, but anyone? 🙂
train = (df['DayFor'] >= '2022-01-01') & (df['DayFor'] < '2022-05-01')
test = (df['DayFor'] >= '2022-05-01')
X_train = df.loc[train].drop(['DayFor', 'MHProductId'], axis=1)
X_test = df.loc[test].drop(['DayFor', 'MHProductId'], axis=1)
y_train = df.loc[train][('Qty')]
y_test = df.loc[test][('Qty')]
?
but I can have the data? 🙂 to use later model.predict(X_test)
so, basically the question is, how to predict on real data? 🙂
mild dirge
your train/test set can't be from the future, so you would train/test on previously found data
And if you already trained your model, then you probably know what type of data to feed it to find future values
If it predicts the next value given 10 previous values, you give it the 10 most recent values f.e.
astral portal
but i want to know futures values now 😉
i won't know the real values, is it possible to know the predicted values?
astral portal
my training set is for last six months or whatever yes?
mild dirge
your model is just a function that maps input to output
astral portal
hmm?
mild dirge
you ever had formulas like f(x) = 5x + 3 in math?
like f.e. what is the answer to f(2)
astral portal
13?
astral portal
inf XD
mild dirge
There is no answer, this is what you currently want
an answer without an input
But you said you have data from past 6 months
serene scaffold
astral portal
inf XD
It's a trick question. f( ) is nonsense.
It's not even undefined
mild dirge
So you could use that data as input
astral portal
yea.. but...
train = (df['DayFor'] >= '2022-01-01') & (df['DayFor'] < '2022-05-01')
test = (df['DayFor'] >= '2022-05-01')
X_train = df.loc[train].drop(['DayFor', 'MHProductId'], axis=1)
X_test = df.loc[test].drop(['DayFor', 'MHProductId'], axis=1)
y_train = df.loc[train][('Qty')]
y_test = df.loc[test][('Qty')]
model = XGBRegressor(**params)
model.fit(X_train, y_train)
test_pred = model.predict(???)
but what about that?
i can't do it?
i won't know the future values? even if could be nonsense?
 visual minnow
hey um, given an array that represents an img, how can i get the average color of that image?
mild dirge
np.mean(img)
visual minnow
aight thx. Any docs for it
mild dirge
That would be for grayscale though
visual minnow
yeah
mild dirge
if it's colored you need to supply axis argument
astral portal
can I have a word in private @mild dirge ?
mild dirge
so np.mean(img, axis=(0, 1)) iirc
mild dirge
astral portal
can I have a word in private <@309775277720993792> ?
Ask in here
astral portal
astral portal
i won't know the future values? even if could be nonsense?
this
even if I have training set?
am I stupid or what? 🙂
mild dirge
You would use the most recent data to predict future values
astral portal
i want to predict on "real-time data"
mild dirge
Then you would get the data realtime and predict on that
That is just how you would get data, you can get it from some csv, or an api or whatever
astral portal
but how? without "test-set"?
mild dirge
you would have a "test set" but without the correct label/output
that is what your model will do
the test set (which is not a test set, just an input you'd like to feed to your model) can be passed to your model as usual
using model.predict()
astral portal
ok, thx
visual minnow
mild dirge
so `np.mean(img, axis=(0, 1))` iirc
so it returns a shade of gray for a grayscale
mild dirge
yh
visual minnow
aight thx
mild dirge
or the average r, g and b values for colored images
visual minnow
yeah
serene scaffold
@mild dirge there's a grey scale formula that I think gives priority to blue, or something like that
mild dirge
That is used for converting rgb to grayscale yeah
desert quartz
Hello. I am passing data from a DataFrame through an API. This DataFrame has repeating data. How can I prevent repeated data from passing through the API and continuing with the next data.
mild dirge
but don't think it's relevant for finding the average value for gray-scale/colored separately
desert quartz
serene scaffold
Oh
no, the data that I pass through the API, I extract it from a single column. In that same, several times the same data is repeated.
 full temple
Where to learn for Datascience?
serene scaffold
@desert quartz you can drop duplicates from that single column (a series) before passing it, I guess.
desert quartz
serene scaffold
<@699406323267403877> you can drop duplicates from that single column (a series)...
yes, I was just thinking about that. but since I need all the information to be in the final dataframe, I had discarded it. To avoid making two dataframes.
odd meteor
full temple
Where to learn for Datascience?
You can learn it Online, Schools, Reading Books, and Bootcamp.
If you wanna make a financial commitment, then check Udemy, Coursera, Udacity, DataCamp, DataQuest etc.
If you want free resources, check
-
YouTube
-
Google: https://developers.google.com/machine-learning/crash-course
For bootcamp: I'll recommend https://FourthBrain.ai (but it's kinda more expensive)

Google Developers

Coursera
Learn Machine Learning from Stanford University. Machine learning is the science of getting computers to act without being explicitly programmed. In the past decade, machine learning has given us self-driving cars, practical speech recognition, ...

 thorn halo
if anyone plays 8 ball pool here does he has any idea that how this app predicts each and every shot so accurately and whats the science or physics behind it called ?
 lapis sequoia
Conservation of momentum I think. @thorn halo
thorn halo
OpenCv and numpy is also used there right ?
For detecting which colour
@lapis sequoia
But there is also collision of balls and the app can detect that too
lapis sequoia
I have no idea on how it's implemented in code. I only understand the physics behind it
thorn halo
lapis sequoia
I have no idea on how it's implemented in code. I only understand the physics be...
Oh okay
mild dirge
Not sure what you mean with "the app predicts every shot", it is just some physics right?
Or do you mean some bot?
 abstract sinew
I think he's asking how the trajectories are calculated
barren wedge
grave frost
if you're truly qualified, i.e have different approaches, a good amount of knowl...
Thank you for your information, i still not qualified yet but i’ll try my best to become world class scientist
rose girder
Hi can someone help me with this simple python problem. I may be overthinking https://stackoverflow.com/questions/72093859/how-do-i-delete-a-particular-sheet-in-a-flat-file-with-python?noredirect=1#comment127383697_72093859
Stack Overflow
Im trying to write a loop that browses through my directory to find a file that starts with a particular filename('TVC') and deletes a specific sheet within that file. In the below case 'Opt-Ins' i...
sterile rivet
supple leaf
I have the same problem right now. I read online and it said i should add more b...
I was working on something else, did u find a solution?
 small lava
I have a dataframe that has a bunch of nan objects and the nan's need to all be converted to None so that the dataframe can be converted to json (without using the df.to_json() method). I usually replace the nan's using:
df.replace({np.nan: None}, inplace=True)
But for some reason with this dataframe it's only replacing the nan's in some of the columns. Anyone know why this might be happening or have any suggestions?
desert oar
rose girder
Hi can someone help me with this simple python problem. I may be overthinking ht...
i answered on stackoverflow ("shadowtalker") - yes, you are overthinking it. i suggest taking a step back and thinking about why you get a particular error message, including reading the error message carefully. it looks like your current strategy is to ignore the contents of the error message, and instead just try something else until the errors go away. a lot of beginner do that, but it's the wrong thing to do.
desert oar
small lava
I have a dataframe that has a bunch of nan objects and the nan's need to all be ...
it won't replace NaN in any columns that are numerical-valued, because None is not a valid value in those columns
i'm surprised that to_json doesn't take care of that
!d pandas.DataFrame.to_json
arctic wedgeBOT
DataFrame.to_json(path_or_buf=None, orient=None, date_format=None, double_precision=10, force_ascii=True, date_unit='ms', default_handler=None, lines=False, compression='infer', ...)```
Convert the object to a JSON string.

Note NaN’s and None will be converted to null and datetime objects
will be converted to UNIX timestamps.Note NaN’s and None will be converted to null and datetime objects will be converted to UNIX timestamps.
it should work without doing any conversion, according to the docs
daring cape
how can i upload a specific image to make a prediction on?
i tried this ```python
image = Image.open(image).convert('L').resize((28,28))
image = np.array(image)
model.predict(image[None,:,:])
        model = tf.keras.Sequential([
            tf.keras.layers.Rescaling(1. / 255),
            tf.keras.layers.Flatten(input_shape=(28,28,1)),
            tf.keras.layers.Dense(128, activation='relu'),
            tf.keras.layers.Dense(num_classes),
        ])

        model.compile(
            optimizer='adam',
            loss=tf.losses.SparseCategoricalCrossentropy(from_logits=True),
            metrics=['accuracy'])
after training i get this error when i try to predict ```
Input 0 of layer "dense" is incompatible with the layer: expected axis -1 of input shape to have value 2352, but received input with shape (None, 784)
Hello everyone, I've been doing a study on the evaluation of four regression models (Linear, Ridge, Lasso, and Elastic Net) using the sklearn package when given a stock price dataset of multiple companies. I just want to know how I can use multiple days to predict the next day.

X and y looks something like this
# Define model
LiR_model = LinearRegression()

# Fit to model
LiR_model.fit(x_train, y_train)

# predict
LiR_y_pred = LiR_model.predict(x_test)
LiR_y_pred = pd.DataFrame(LiR_y_pred, index=y_test.index, columns = ['price'])

y_test_trimmed = y_test[:-1]
LiR_y_pred_trimmed = LiR_y_pred[1:]

plt.plot(y_test_trimmed)
plt.plot(LiR_y_pred_trimmed)
plt.legend(['actual_price', 'predicted_price'])
plt.show
And this is how I usually implement them in the models
Now I am trying to figure out if I can somehow use multiple consecutive days to predict the next day
desert oar
@brisk nest 1) stock prices are usually a really bad project for time series forecasting, because they are notoriously impossible to forecast, 2) you will need to combine OHLC columns from multiple days. this is just a matter of pandas manipulation. you will end up with something like open_1, open_2, open_3, high_1, high_2, high_3, ... where the number indicates the number of lags
- normally you would use a proper time series model for this kind of thing
i think you made this project doubly hard for yourself by choosing a time series model and specifically by choosing stock price over time. you might find a lot more success if you avoid "intertemporal" data
 mint palm
I am trying to remember something:
Was there a concept that says degree of polynamial that is learned, to classify input is equal to no. Of layers is NN
What was it?
Or something like the topologies learned has degree = Nn layers
brisk nest
desert oar
<@319428582302547969> 1) stock prices are usually a really bad project for time ...
I see, I regret even proposing the study without extensively researching about it. I have learned my lesson.
Thank you very much for the reply, I really appreciate it.
 flat stratus
What's a good course to learn data science with python
flat stratus
lusty valley
datacamp.com
Thanks
spring stirrup
import pandas as pd
import matplotlib.pyplot as plt

data=[["Rudra",23,156,70],
      ["Nayan",20,136,60],
      ["Alok",15,100,35],
      ["Prince",30,150,85]
     ]

df=pd.DataFrame(data,columns=["Name","Age","Height(cm)","Weight(kg)"])
df.plot(x="Name", y=["Age", "Height(cm)", "Weight(kg)"], kind="bar",figsize=(9,8))
plt.show()

how print value of each bar ? thanks
 rough cape
how to create ai in python
lapis sequoia

Is there anything useful about the third and fourth plots?
Is there something I can do to improve the peak finding and trend fitting presented there?
lapis sequoia

ITD is supposed to be a novel intrinsic time-scale decomposition algorithm that i have adapted to python, i posted a bunch on it over in #algos-and-data-structs
" The ITD method decomposes a signal into (i) a sum of proper rotation components, for which instantaneous frequency and amplitude are well defined, and (ii) a monotonic trend. "
there are hundreds of references on google to SINGLE-WAVE ANALYSIS but no definition for this term
searching for "wave analysis" turns up VERY different results
ocean waves, financial trends, and vibration analysis, all of which use similar methods for different purposes, but none of which clearly define what it is, and then there's intensity wave analysis from a perspective for aorta modeling, and wave analysis for trend decomposition for ekg, which is where ITD originally comes from
unfortunantly, i am neither a siesmologist, nor am I a neurologist, nor am I a financial analyst, so i have no idea what any of this does
i guess my ultimate goal is to meaningfully decompose complex signal sample series in order to improve noise reduction methods, with a side effect of creating functions that i can provide to the community for other purposes like neural network inputs
https://github.com/falseywinchnet/demoframework/blob/main/demo.py
here is my current code
https://github.com/OverLordGoldDragon/ssqueezepy/issues/65
here is the discussion on the topic
However, i am unable to produce similar graph results to the original authors as depicted in the embedded image in the github issue
 karmic valley
Basically in my data I have 15 patients and for each patient I am analysing parameters at 5 time points (Baseline, Immediate Sonovue injection, 20s after sonovue, 40s after and 1minute after). For each time point for each patient I have calculated a signal intensity value. I have also calculated an AI Quality score for the same point. So in total I have 75 values of intensity (5*15) and 75 values of AI quality.
I want to do a correlation graph of AI quality and intensity. I thought of plotting 75 points on a graph and then doing line of best fit and then doing pearsons coefficient to get correlation. However, I read online that pearsons requires data to be independent and I think my data is not all independent as I have 5 points for the same patient on the graph? If this is not something I can use, is there any other way to simply get a correlation coefficient?
thorn halo
mild dirge
Not sure what you mean with "the app predicts every shot", it is just some physi...
Yea it is some physics there but for knowing and calculating exact trajectory u will need to have the game source code I guess but I am not sure
thorn halo
mild dirge
Or do you mean some bot?
Yea its a bot
thorn halo
abstract sinew
I think he's asking how the trajectories are calculated
Yes exactly
tidal bough
thorn halo
Yea it is some physics there but for knowing and calculating exact trajectory u ...
only if the game does something really fancy there. Most likely, it's just momentum-conserving collisions of balls with some loss of energy, collisions with walls with some loss of energy, maybe some friction. That's a bunch of (3) unknown parameters, but one could, say, take a video of the game and estimate the parameters from it.
barren wedge
Is anyone have an idea on how to summarize chat data? Like i have bunch of chatting data and i want to analyze it or summarize it
So i can have greater understanding of that bunch of data
serene scaffold
@barren wedge there are good techniques for summarizing news articles. Have you tried applying them to your data?
thorn halo
tidal bough
only if the game does something really fancy there. Most likely, it's just momen...
Probably college physics ?
Light rays optics too
tidal bough
Depends on your country's education system I guess, but elastic/inelastic collisions were high school physics for me.
There's nothing involving light here, hence no optics. "Straight lines" aren't really optics :p
thorn halo
Billiard balls collide with nearly perfect elasticity. This means that the kinetic energy in their motion is almost completely preserved, and very little of it dissipates into heat or other energy sinks. This makes pool and billiards a...
thorn halo
tidal bough
There's nothing involving light here, hence no optics. "Straight lines" aren't r...
Angle of incidence will be equal to angle of reflection and hence the angle of ball while colliding with the banks or the pool edge side will rebound to the same angle
tidal bough
Angle of incidence will be equal to angle of reflection
that's not necessarily true unless energy is conserved perfectly. My more important point, though, is that having straight lines and reflection be involved doesn't make something optics. Light being involved makes something optics.
 compact rose
Hello guys, i have a doubt about machine learning. When we want to improve models, one of the tips is selection of the features to run the model. But how do i choose them? My idea is to see through spearman correlation what are the best features that are correlated with the feature that i want to predict, but is this a good practice?
 oblique drum
How do i get into datascience/ai/machine learning
im thinking about reading a book called handson machine learning o'riley's
grave frost
barren wedge
Thank you for your information, i still not qualified yet but i’ll try my best t...
dope. check out their discord server if you wanna collaborate on minor points
barren wedge
serene scaffold
<@706828569346572300> there are good techniques for summarizing news articles. H...
What is it?
barren wedge
grave frost
dope. check out their discord server if you wanna collaborate on minor points
Yeah, i've join it but still figuring out how that group is working on projects and collaborate
grave frost
barren wedge
Yeah, i've join it but still figuring out how that group is working on projects ...
cool take your time
compact rose
oblique drum
How do i get into datascience/ai/machine learning
The best way, for me, was through datacamp.com. They have all sort of things and after that start working in project through what you learn in that. Don't start with machine learning, start with descriptive then you can pass to predictive. But this is my advice
oblique drum
is the free tier good
barren wedge
oblique drum
is the free tier good
Exhausting in my opinion
misty flint
does anyone have any resources they recommend for DS in the finance domain?
anything about forecasting/time-series models/etc.
barren wedge
misty flint
does anyone have any resources they recommend for DS in the finance domain?
I usually using facebook prophet because it is easier to do
misty flint
yes i know about that one