#data-science-and-ml
1 messages · Page 395 of 1
 misty flint
try cutting your data in half. maybe theres just too much for the model to learn
test that and see how long it takes for the epoch to run then
 desert oar
misty flint
try cutting your data in half. maybe theres just too much for the model to learn
desert oar
misty flint
try cutting your data in half. maybe theres just too much for the model to learn
is that a thing? it might take longer to work through each epoch, but more data should generally be better, right?
as long as it's representative etc
misty flint
desert oar
as long as it's representative etc
yeah this would be fine except colab cuts you off after a while

there are all these workarounds people come up with due to colab
and its limitations
 safe viper
im so frustrated bruh
will increasing batch_size make it faster maybe? currently at 64. Also I can't cut the data in half as part of the assignment
safe viper
No change
misty flint
i think you may be stuck with this setup unless google decides to give you a better gpu
at least its working
and not giving you a runtime error
safe viper
wait, just as a general quesiton:65 million parameters is a lot, but if they are non trainable, then does that mean that the issue is not coming from the embedding
or is that stupid
misty flint
i think its just the nature of an RNN and trying to feed it that many parameters
usually the first epoch is the longest one too
an RNN is slow compared to something modern like a transformer
but my understanding could be faulty so if anyone else has anything to add
feel free
safe viper
could changing the units of SimpleRNN() impact performance in any way
safe viper
is there a difference between using GPU and TPU🥲
misty flint
tpu should be faster but i have yet to see that 
jk i dont have enough experience using tpu to see the difference
misty flint
safe viper
is there a difference between using GPU and TPU🥲
also i found this

about improving RNNs
but its also the internet so who knows if its right
but i mean it sounds like it makes sense
and plausible

safe viper
true
 safe viper
Can't find any concrete info online, is SimpleRNN() < GRU() < LSTM() in terms of training speed?
 calm palm
Hope I am not wrong for asking this in this channel instead of a help channel but since I cannot find any good answers I might as well ask here. I have a pandas dataframe and I wanted to split data into a training and testing set based on a column with date information formatted like this 2022-04-10. Is there any specific scikit learn function like train_test_split that could be used so that I could assign december to be testing data and everything but december to be training data? Please let me know if I should ask in a help channel since I am still unsure about the rules here!
 serene scaffold
calm palm
Hope I am not wrong for asking this in this channel instead of a help channel bu...
serene scaffold
calm palm
Hope I am not wrong for asking this in this channel instead of a help channel bu...
for one thing, you don't want to store dates/timestamps as strings. you want to use a proper datetime. for the solution, your option is to convert that column to datetime, or keep it as a string but use a regular expression. which would you prefer?
calm palm
I unfortunately don't have a complete understanding of what you mean when you say I should store it as a proper datetime. I originally had it in the format as 2014-01-01 00:00:00 but in order to group data and sum the data corresponding to a day, I did energydf['time'] = pd.to_datetime(energydf['time']).dt.date and then did a energydf = energydf.groupby('time').sum() but this left me with the 2014-01-01 which does not have time information. Should I have not done that because it is not datetime format anymore?
serene scaffold
@calm palm pd.to_datetime(energydf['time']) returns a Series of datetimes. just remove the .dt.date part
test = energydf.loc[energydf['time'].dt.month == 12]
train = energydf.loc[energydf['time'].dt.month != 12]
Agh but now it removes the functionality of being able to sum the data that had the same day information, it groups based on exact time instead of by day. As for the training data part, I will try that out. Thank you for taking the time to help me! I unfortunately don't get much help in the help channels but this was informative
serene scaffold
calm palm
Agh but now it removes the functionality of being able to sum the data that had ...
you can still do that if you want. you would just do energydf.groupby(energydf['time'].dt.date).sum()
keeping time as a datetime gives you more flexibility
 iron basalt
misty flint
also i found this
iron basalt
misty flint
also i found this
Yes, but it depends on your GPU. You definitely want some power of 2. Probably 16, 32, or 64. Even better if the total size is not only a multiple of one of those, but also a power of two.
Also depending on the exact kernel run, it may want specific values that need to compiled into the kernel. Depending on your library used, it may or may not do that. In addition, there are tools you can run to see what preferred multiples and such your GPU wants.
calm palm
serene scaffold
keeping `time` as a datetime gives you more flexibility
Thank you for letting me know, I probably would have gotten into a bad habit, I will try all of these things :)
iron basalt
*Video game textures are also powers of 2 for the same reason.
 sharp rain
x1= list(range(10,90))

y1=list(range(250,330))

np.interp(8,x1,y1)

Output:
250.0
How can I get interpolation with value which not in list? let i input 8, then return 248
or there is a term to handle this issue
desert oar
sharp rain
```py
x1= list(range(10,90))
y1=list(range(250,330))
np.interp(8,x1,y1)
Outpu...
use linear regression
sharp rain
desert oar
use linear regression
but, i only have few data, like 10 data
since i have train equation with linear regression already
desert oar
sharp rain
but, i only have few data, like 10 data
linear regression just draws a straight line. when extrapolating outside the data range, there's nothing else you can really do
there aren't any more points to interpolate between
you can just use numpy.linalg.lstsq or numpy.polyfit
misty flint
iron basalt
Also depending on the exact kernel run, it may want specific values that need to...

i see
thanks mr. squiggle
desert oar
iron basalt
Also depending on the exact kernel run, it may want specific values that need to...
what would those tools be? i'd be interested
iron basalt
misty flint
<:blobpoll:897861777507876934>
It also matters more for older GPUs. If you go old enough, like 2000s and such, then you can only have powers of 2.
GPUs have become more general purpose now and relaxed a lot of requirements. Or, as some claim, the GPU will eventually replace the CPU and become the new CPU.
iron basalt
desert oar
what would those tools be? i'd be interested
In your CUDA or OpenCL SDK.
For example in OpenCL you can run clinfo.
e.g. ```
Max work item dimensions 3
Max work item sizes 1024x1024x1024
Max work group size 256
Preferred work group size (AMD) 256
Max work group size (AMD) 1024
Preferred work group size multiple (kernel) 64
Wavefront width (AMD) 64
Preferred / native vector sizes
char 4 / 4
short 2 / 2
int 1 / 1
long 1 / 1
half 1 / 1 (cl_khr_fp16)
float 1 / 1
double 1 / 1 (cl_khr_fp64)
Took a snippet from my clinfo there.
desert oar
neat
i have nvidia-smi and a bunch of other nvidia tools, but i think they are more generic than cuda
desert oar
clinfo dumped a bunch of cuda info anyway
iron basalt
(ofc, this is an AMD GPU, so that does not apply here)
desert oar
you haven't been doing machine learning on amd, have you?
i've heard it's really mixed
iron basalt
I have. Because I can write my own kernels.
iron basalt
Newer ones are better ofc. Older gets mixed, but if you can get it to work it'a a huge win because they are very cheap.
So if you ever wanted a cheap way to get a huge model, that is a way.
I am using opencl.
Because I also want to work with FPGAs.
OpenCL also works on the CPU, so it just works.
It's really the only generic cross platform/device thing.
The rest are too weird and spotty to get working.
Or don't work on smaller devices, like a raspberry pi.
desert oar
interesting. and you get good enough performance for what you need to do?
i certainly would not be able to write my own kernels. i'd waste so much time diy'ing everything and never getting any actual work done
iron basalt
Luckily some libraries do exist for OpenCL, like clblast, which is pretty fast.
 austere swift
desert oar
i've heard it's really mixed
austere swift
desert oar
i've heard it's really mixed
amd has been trying to push rocm a bit so its getting better than it used to be but it's still nowhere near as good as nvidia
iron basalt

GitHub
Tuned OpenCL BLAS. Contribute to CNugteren/CLBlast development by creating an account on GitHub.
Written by a GPU expert.
austere swift
pytorch as of 1.8 has prebuilt wheels with rocm support but that only works on linux (because rocm only works on linux)
iron basalt
(and it has python bindings too)
desert oar
i didnt realize rocm only worked on linux
iron basalt
Yeah, rocm in theory is nice, but spotty still.
austere swift
yeah
iron basalt
Take it from opencv, which also uses opencl so that it works all over the place.
(but don't take its source code as an example of how to do things, it's horrible, don't read it)
austere swift
with the mi100 (and now the mi250x) amd is trying to push more ML support so its getting better
iron basalt
Yeah the newest cards are fine.
It might give groups like the pytorch people hope to try again for opencl support.
desert oar
good that they're on the right track. by the time i want/need an upgrade im hoping that there will be a good non-nvidia option
i wonder if its possible to set up a computer with 2 gpus, but with only 1 running at a time. probably not without a lot of diy stuff
iron basalt
(although right now they worked more on rocm, and since everyone just runs the DL stuff as a web service they are ok with Linux only)
austere swift
on paper the MI100 actually had better fp32 performance than the A100, but the software lacked behind so it didn't really catch on in the ml space
iron basalt
If you care about robotics and such, and especially smaller devices, opencl is often supported.
Especially due to the work of the POCL team (portable opencl).
desert oar
   Max work item dimensions                        3
*   Max work item sizes                             1024x1024x64
*   Max work group size                             1024
*   Preferred work group size multiple (device)     32
*   Preferred work group size multiple (kernel)     32
so this means that my gpu can work on arrays up to 1024x1024x64, up to 3 dimensions, in batches of up to 1024 (?), and ideally in batches of multiples of 32
Half-precision Floating-point support (n/a)
i wonder what n/a means. is it yes or no??
 austere swift
desert oar
```
Half-precision Floating-point support (n/a)
```
i wonder what n/a ...
austere swift
desert oar
```
Half-precision Floating-point support (n/a)
```
i wonder what n/a ...
maybe it means you don't have fp16 support
iron basalt
desert oar
```
Half-precision Floating-point support (n/a)
```
i wonder what n/a ...
Probably not then.
iron basalt
desert oar
```
Max work item dimensions 3
* Max work item sizes...
    Max 2D image size                             16384x16384 pixels
    Max 3D image size                             2048x2048x2048 pixels
Max work item sizes is the maximum number of work items per work group per dimension. clinfo basically just calls and prints https://www.khronos.org/registry/OpenCL/sdk/1.0/docs/man/xhtml/clGetDeviceInfo.html
Each thing listed is described there.
Number of work-items that can be specified in each dimension of the work-group to clEnqueueNDRangeKernel.
https://www.khronos.org/registry/OpenCL/sdk/1.0/docs/man/xhtml/clEnqueueNDRangeKernel.html being the main / common way to run a kernel.
To get an idea of what that looks like, here is how matrix multiplication is implemented (tutorial written by the clblast author): https://cnugteren.github.io/tutorial/pages/page3.html
    kernel = clCreateKernel(program, "myGEMM1", &err)
    err = clSetKernelArg(kernel, 0, sizeof(int), (void*)&M);
    err = clSetKernelArg(kernel, 1, sizeof(int), (void*)&N);
    err = clSetKernelArg(kernel, 2, sizeof(int), (void*)&K);
    err = clSetKernelArg(kernel, 3, sizeof(cl_mem), (void*)&A);
    err = clSetKernelArg(kernel, 4, sizeof(cl_mem), (void*)&B);
    err = clSetKernelArg(kernel, 5, sizeof(cl_mem), (void*)&C);
    const int TS = 32;
    const size_t local[2] = { TS, TS };
    const size_t global[2] = { M, N };
    err = clEnqueueNDRangeKernel(queue, kernel, 2, NULL,
                                 global, local, 0, NULL, &event);
    err = clWaitForEvents(1, &event);
Create kernel, set kernel arguments (the dimensions of the matrices and the matrices' buffers (the actual data)), decide on a local size, make the global size the dimensions of the output, call the kernel, wait for it to complete.
If you are using Python you can do this with way less work by using pyopencl, which wraps it for you and gives you numpy-like ndarrays.
Still need to choose an appropriate local size.
The linked tutorial goes all the way from naive implementation to something pretty fast (GEMM).
desert oar
i see
so this is you defining "myGEMM1", or invoking it?
it looks like a lot of pre-allocations
definitely not something i want to do by hand
iron basalt
You are compiling myGEMM1.
Looks like this: ```c
// First naive implementation
__kernel void myGEMM1(const int M, const int N, const int K,
const __global float* A,
const __global float* B,
__global float* C) {
    // Thread identifiers
    const int globalRow = get_global_id(0); // Row ID of C (0..M)
    const int globalCol = get_global_id(1); // Col ID of C (0..N)

    // Compute a single element (loop over K)
    float acc = 0.0f;
    for (int k=0; k<K; k++) {
        acc += A[k*M + globalRow] * B[globalCol*K + k];
    }

    // Store the result
    C[globalCol*M + globalRow] = acc;
}
This is OpenCL's shader language (c-like language).
It's run in parallel.
desert oar
ah i see
ok so you're setting up all the memory requirements and such
and i have heard of glsl, haven't ever seen or used it
iron basalt
OpenGL has its own shader language that is basically the same thing, and so does DirectX, etc. They are all arbitrary differences.
You can actually do "compute shaders" in OpenGL which is basically just like OpenCL then (used in games for GPGPU).
OpenGL provides more graphics specific built-in functions and such.
But nothing is stopping you from rendering a 3D scene with OpenCL and then having your OS display that result somehow.
iron basalt
(unreal engine 5 actually does its own custom stuff a lot now)
desert oar
i figured they all just used some kind of c/c++ api
iron basalt
There is this thing called SPIR-V and such which is sort of like the assembly of GPU programming (generic), which all of these can compile to (OpenCL needs a conversion layer but it's a thing). So you can in theory write the kernels in Python (or any language you made up) that spit out SPIR-V. In fact, it already exists.

GitHub
Write modern GPU shaders in Python! Contribute to pygfx/pyshader development by creating an account on GitHub.
It's used in combination with Kompute: https://github.com/KomputeProject/kompute/

GitHub
General purpose GPU compute framework built on Vulkan to support 1000s of cross vendor graphics cards (AMD, Qualcomm, NVIDIA & friends). Blazing fast, mobile-enabled, asynchronous and optim...
Which is GPGPU via Vulkan (not OpenCL). Vulkan works fine, but it's not as general as OpenCL (small devices, and OpenCL can do more than GPUs).
This mess of differing ways of doing the same thing comes from GPUs being closed hardware and each GPU provider giving their own drivers and their own way of doing it (e.g. CUDA for nvidia).
Also because GPUs have changed a lot over time and are pretty general purpose now.
They seem to be stabilizing in design now (GPGPU stuff).
For GPUs specifically, that are not small devices, and not too old, Vulkan is probably the way to go, or OpenCL. Everything else does not seem like a sane option for cross-platform libraries unless you plan on re-implementing everything for each platform.
OpenGL was already heading there too, but then Apple decided "nah we don't like OpenGL and want to kill it like Flash".
"Use our thing instead, Metal". Even though it's the same thing again, different paint (very Apple).
iron basalt
desert oar
sigh, could have been lisp
Seems like it's a thing: https://github.com/markus-wa/lssl

GitHub
Lisp(y) Shading Language -> SPIR-V Compiler. Contribute to markus-wa/lssl development by creating an account on GitHub.
*Kompute also gives you a tensor type. It's meant for DL people.
 manic bolt
sup
 astral storm
I agree with what you are saying, but not for someone that wants to learn ML today when we have great libraries at our disposal. Like I said, there is no right or wrong, but this approach is what works best for me.
I feel a lot of people get discouraged if people continue to advice you need to know math to get started with ML, I feel this is not the case. Sure if you need something that doesn't exist in todays frameworks, but I think that is hardly the case for someone who just wants to get started:)
 weary flint
i'm looking to get started in data science
is someone willing to tutor me?
i have 2 months of python experience, but i think i've got the basics down
i also signed up for a course starting wednesday
 steady basalt
weary flint
is someone willing to tutor me?
steady basalt
weary flint
is someone willing to tutor me?
How much
 raven linden
hi everyone! how can i specify the default downloads folder in Python?
 tacit basin
weary flint
is someone willing to tutor me?
tacit basin
weary flint
is someone willing to tutor me?
 tacit basin
weary flint
I appreciate it
tacit basin
weary flint
I appreciate it
No worries. Also this https://www.datahelpers.org/

Data Helpers
A list of data analysts, scientists, and engineers willing to offer guidance to aspiring and junior data professionals.
weary flint
tacit basin
No worries. Also this https://www.datahelpers.org/
ty ty
 pastel valley
yo how to manually do this? the rgb to bgr i can use cv2 cvtColor() but the other process how?

i tried converting my keras model into tflite model and i want to use it on mobile using flutter
and i read that before passing input into the tflite model i should also be doing the preprocessing methods i did during training the model and since i used resnet50 model that is the default preprocess function for resnet50 input
i want to know how to replecate that preprocess function without using tf.keras.applications.resnet50.preprocess_input
without scaling means that image still 255 right?
but that zero centered is what?
steady basalt
@weary flint how does 15 usd an hour sound
weary flint
steady basalt
<@!674089971170148359> how does 15 usd an hour sound
can I dm?
steady basalt
Ofc
 plush glacier
does anyone know some machine learning projects i could do for school it can't be related to images and has to be useful
or should i just make a argument that a ml model that playes a snake game is useful because i will learn a lot from it
but the teacher also said that preferably it would be useful for school
steady basalt
plush glacier
does anyone know some machine learning projects i could do for school it can't b...
How about using a tumour data set to predict malignant or benign… very simple enough for school age peeps
plush glacier
steady basalt
How about using a tumour data set to predict malignant or benign… very simple en...
are there datasets that aren't related to images for that?
serene scaffold
it would be a dataset about properties of the tumor, not pictures of them
plush glacier
that could be something intresting
now the hard part would be finding a dataset like that that i could use for a school project
 arctic wedgeBOT
Hey @dusky rover!
You either uploaded a .txt file or entered a message that was too long. Please use our paste bin instead.
 dusky rover
https://paste.pythondiscord.com/ofimoqicaz
cant install chatterbot
tried with -
3.7.0
3.8.8
3.10
plush glacier
dusky rover
https://paste.pythondiscord.com/ofimoqicaz
cant install chatterbot
tried with - ...
this seems to be about your issue https://stackoverflow.com/questions/63461861/python-package-installation-error-py-compiler-msvc-not-found

Stack Overflow
I'm trying to install the chatterbot package on Python 3.8.3 under Windows 10 64-bit and encountering a strange error that I suspect must be related to some directory or PATH setting which, I hope,...
plush glacier
plush glacier
now the hard part would be finding a dataset like that that i could use for a sc...
looking at that a bit more it would be a very simple and boring project
because after i found the dataset i looked at the data and it would take a few hours to do an entire project on that without reinventing the weel
 summer plover
dusky rover
https://paste.pythondiscord.com/ofimoqicaz
cant install chatterbot
tried with - ...
summer plover
dusky rover
https://paste.pythondiscord.com/ofimoqicaz
cant install chatterbot
tried with - ...
try pip install chatterbot --use-deprecated=backtrack-on-build-failures
pastel valley
yo how to do this on an image?

is this mandatory? even i did not use the imagenet wieghts? of resnet50 model?

 modest shuttle
Hello,
How to calculate forecast accuracy in python based on percentage?
desert oar
iron basalt
Seems like it's a thing: https://github.com/markus-wa/lssl
im wondering why you'd make a custom lisp instead of a dsl in an existing lisp 🤔
desert oar
plush glacier
does anyone know some machine learning projects i could do for school it can't b...
ask the teacher what "useful" means... like something that directly benefits society? why can't it be related to images? you can do a lot with satellite images for example
 modern cypress
Hmm, I forgot to save the history from model.fit, but I see at the end it stores it here

How should I access this history if I wanted to draw a learning curve?
or will I have to type out the information manually?
hmm

The history is empty? Strange
 modest shuttle
Hello,
How to Create GUI and use matplotlib in it?
desert oar
modern cypress
hmm
this creates a new history object
desert oar
modern cypress
Hmm, I forgot to save the history from model.fit, but I see at the end it stores...
it's possible that it returned the history and it was just discarded
modern cypress
Oh for real? damn
desert oar
however ipython does save recent results
try print(Out[46])
Stack Overflow
In many symbolic math systems, such as Matlab or Mathematica, you can use a variable like Ans or % to retrieve the last computed value. Is there a similar facility in the Python shell?
so your butt might be saved after all 🙂
modern cypress

Hmm
I have a screenshot of the epochs so I could do it manually but

It's not possible to try access 0x221c0aafdf0?

Oh I got it, awesome thanks @desert oar gave me the idea ^^
steady basalt
plush glacier
now the hard part would be finding a dataset like that that i could use for a sc...
Extremely easy, use UCI
desert oar
modern cypress
lol what if you did my_history = Out[36]; print(my_history.history)?
desert oar
modern cypress
Oh I got it, awesome thanks <@389497659087650836> gave me the idea ^^
that is also a way to do it 😆

 desert oar
nice!
 fleet trail
Hello, does anyone know how I can use contextual embeddings for word sense disambiguation ?
dusky rover
summer plover
try `pip install chatterbot --use-deprecated=backtrack-on-build-failures`
no difference
dusky rover
plush glacier
this seems to be about your issue https://stackoverflow.com/questions/63461861/p...
stack overflow down 😦
 hollow flare
plush glacier
desert oar
ask the teacher what "useful" means... like something that directly benefits soc...
hollow flare
plush glacier
desert oar
ask the teacher what "useful" means... like something that directly benefits soc...
sorry for the late reply had to make dinner. but i can't do anything with images because i've already done quite a lot with images
plush glacier
dusky rover
stack overflow down 😦
it isn't for me but here was the answer message
I also had the same issue but now I think I found a work around this.
First I installed latest version of spacy. The blis compilation was needed for an old version of spacy. But latest version of spacy comes in a compiled version, so no need to use msvc.
pip install -U spacy
Next, I installed chatterbot from the github source code.
git clone https://github.com/gunthercox/ChatterBot.git
pip install ./ChatterBot```

> When you install latest version from ChatterBot repo, you will need to revise Chatterbot/setup.py to be compatible with Python3.8.x - for now it only supports <=3.8what about pip install git+git://github.com/gunthercox/ChatterBot.git@master on 3.7 although it seems like it might be for python 3.6

 plush glacier
can you do python --version
dusky rover
it shows 3.9.2 for whatever reason
plush glacier
you might want to switch to python 3.8 or 3.7
dusky rover
so according to the command pallete I am on 3.7, according to the terminal I am on 3.8.8 and according to python --version I am on 3.9.2
plush glacier
what if you do pip --version
also what code editor are you using because if you might be able to switch what python version is being used to run the .py file
 pseudo belfry
Where is a good place to start with my own chatbot?
plush glacier
@dusky rover you can also try making a .py file with the content
import sys
subprocess.check_call([sys.executable, '-m', 'pip', 'install', 'chatterbot'])
and run that with the code editor when it is set to use python 3.7
 robust jungle
learning image classification, would anyone mind explaining this line from a tutorial?
(layers.Conv2D***(32, (3, 3)***, activation='relu', input_shape=(32, 32, 3)))
specifically the highlighted bit
 pseudo wren
I created a correlation matrix between two different potential ML models to see which one is more viable to use when determining a linear relationship
there's this one

and this one

i feel as though the first one will require more cleaning than not
 mint palm
i was looking at a very interesting research paper...it was aimed at finding correct object and shadow pair, in a picture
 pseudo wren
but i am not sure which one shows the stronger evidence of linear relationships
mint palm
the architecture is like this...but i dont understand it...can you guys simplify
pseudo wren
a 1 to 1 given in any category just... is that category
so i'm not sure how to proceed with it
modern cypress
mint palm
feeds the image through 3 convolution layers, and then feeds each layer to a pooling layer
(at least I think)
mint palm
then
modern cypress
and then following the arrows down from p5, I think he feeds p5 into p4 and then p3
mint palm
modern cypress
and then following the arrows down from p5, I think he feeds p5 into p4 and then...
i dont get this
why feed one pool layer into other
what happens?generally
modern cypress
Yeah I'm not sure to be honest. But they get the mask and find out the relative cords in the image
 mint palm
oh ok thanks
 raven cloud
anyone heard of MOT datasets ?
pseudo wren
what are some good rules of thumb when it comes to data cleaning. I find this is the part of the process i struggle with the most
for example
i have a value i want to plot on a graph
but it's data type rn is "object"
this is because it has characters after it
what is a fast way to convert this value on my dataframe
modern cypress
What kind of evaluation techniques should I be using on a multi-class image classification model? I have accuracy and loss curves and then confusion matrix with a heatmap visualisation
 modern cypress
pseudo wren
what is a fast way to convert this value on my dataframe
modern cypress
pseudo wren
what is a fast way to convert this value on my dataframe
If you send an example we can try help better
 lapis sequoia
modern cypress
lapis sequoia
modern cypress
🤣
pseudo wren
modern cypress
If you send an example we can try help better
these values are a good example

they all have things like cc
bhp
kmpl
and as a result are listed as objects
i need to turn these values into integers
this is where i get stuck in data cleaning every time
modern cypress
pseudo wren
i need to turn these values into integers
Stack Overflow
I have the following code:
url = 'abcdc.com'
print(url.strip('.com'))
I expected: abcdc
I got: abcd
Now I do
url.rsplit('.com', 1)
Is there a better way?
 gaunt violet
I have a problem with alexnet model with pytorch
### strip the last layer
feature_extractor = torch.nn.Sequential(*list(model.children())[:-1])
### check this works
x = torch.randn([1,3,224,244])
print(feature_extractor)
output = feature_extractor(x) # output now has the features corresponding to input x
print(output.shape)
I'm trying to extract features from the alexnet model
here is what print(feature_extractor) gives
  (0): Sequential(
    (0): Conv2d(3, 64, kernel_size=(11, 11), stride=(4, 4), padding=(2, 2))
    (1): ReLU(inplace=True)
    (2): MaxPool2d(kernel_size=3, stride=2, padding=0, dilation=1, ceil_mode=False)
    (3): Conv2d(64, 192, kernel_size=(5, 5), stride=(1, 1), padding=(2, 2))
    (4): ReLU(inplace=True)
    (5): MaxPool2d(kernel_size=3, stride=2, padding=0, dilation=1, ceil_mode=False)
    (6): Conv2d(192, 384, kernel_size=(3, 3), stride=(1, 1), padding=(1, 1))
    (7): ReLU(inplace=True)
    (8): Conv2d(384, 256, kernel_size=(3, 3), stride=(1, 1), padding=(1, 1))
    (9): ReLU(inplace=True)
    (10): Conv2d(256, 256, kernel_size=(3, 3), stride=(1, 1), padding=(1, 1))
    (11): ReLU(inplace=True)
    (12): MaxPool2d(kernel_size=3, stride=2, padding=0, dilation=1, ceil_mode=False)
  )
  (1): AdaptiveAvgPool2d(output_size=(6, 6))
)
the error is that the shape of x is not correct, the weight of fc7 layer (last layer) is (1024x10)
any help would be appreciated
pseudo wren
@modern cypress thank you for the link! unfortunately the solution provided did not work for me
print(kamsdata['engine'].replace('CC'))```all it does it print what is already there
wait
i think i see an error in my code
one second
yeah no it still doesn't work
 modern cypress
pseudo wren
<@181415862933127168> thank you for the link! unfortunately the solution provide...
modern cypress
pseudo wren
<@181415862933127168> thank you for the link! unfortunately the solution provide...
try something like this

but you know
with your own values
here i was replacing all the yeses in my data frame with 1 and so on
That worked for me, so should work for you
desert oar
pseudo wren
this is where i get stuck in data cleaning every time
in addition to what titanic tony posted, a lot of string methods are available directly on the Series class with the .str "accessor"
!e ```python
import pandas as pd
times = pd.Series(['1 ms', '2 ms', '3 ms'])
print(times)
print(times.str.replace(r' *ms$', '', regex=True).astype(int))
@desert oar :white_check_mark: Your eval job has completed with return code 0.
001 | 0    1 ms
002 | 1    2 ms
003 | 2    3 ms
004 | dtype: object
005 | 0    1
006 | 1    2
007 | 2    3
008 | dtype: int64
it's still not working
 desert oar
pseudo wren
it's still not working
desert oar
pseudo wren
it's still not working
replace with a dict replaces exact values, not substrings
this is .str.replace
desert oar
pseudo wren
still doesnt work for some reason
"doesn't work" isn't something that anyone can help with. show your code (as text, not a screenshot), and explain what is happening
pseudo wren
pd.Series(['kmpl', 'CC', 'bhp', np.nan]).str.replace('f', repr, regex=True)
modern cypress
Assuming pd is your data and you didn't just do pd
 mighty orchid
anyone here know how weights are given in the particle filter algorithm? sorry if this is too language agnostic 
pseudo wren
...
pseudo wren
modern cypress
Assuming `pd` is your data and you didn't just do pd
so i did pd as it is my pandas data
it does yield a result
it just doesn't actually replace anything
desert oar
pseudo wren
so i did pd as it is my pandas data
normally people use import pandas as pd, so that's a very confusing name
mighty orchid
mighty orchid
anyone here know how weights are given in the particle filter algorithm? sorry i...
i do have some code for it here but i have no idea what logic behind it is
https://colab.research.google.com/github/jfogarty/machine-learning-intro-workshop/blob/master/notebooks/particle_filters.ipynb
pseudo wren
desert oar
normally people use `import pandas as pd`, so that's a very confusing name
i imported pandas as pd yes
the issue is
when i try to do this statement as the name of my table
it yields an error
desert oar
pseudo wren
i imported pandas as pd yes
so if you do pd = ... then you can't access pandas anymore, you've overwritten the name with something else
arctic wedgeBOT
Here's how to format Python code on Discord:
```py
print('Hello world!')
```
These are backticks, not quotes. Check this out if you can't find the backtick key.
pseudo wren
kamsdata = pd.read_csv('/content/Car details v3.csv')
kamsdata
pd.Series(['kmpl', 'CC', 'bhp', np.nan]).str.replace('f', repr, regex=True)
now when i attempted the last statement with
kamsdata.Series....
it yielded an error
when i do pd.Series it yields a result
desert oar
pseudo wren
kamsdata.Series....
no, you would do kamsdata.str.replace
pseudo wren
i did do that
desert oar
pd.Series creates a new Series
pseudo wren
however it gave me an error
misty flint
whats the error
desert oar
so show what you did!
modern cypress
Show the error
desert oar
you are saying you did 3 different things here
pseudo wren
kamsdata.Series(['kmpl', 'CC', 'bhp', np.nan]).str.replace('f', repr, regex=True)
'DataFrame' object has no attribute 'Series'
modern cypress
pseudo wren
```kamsdata.Series(['kmpl', 'CC', 'bhp', np.nan]).str.replace('f', repr, regex=T...
this =/= kamsdata.str.replace
desert oar
pseudo wren
```kamsdata.Series(['kmpl', 'CC', 'bhp', np.nan]).str.replace('f', repr, regex=T...
why would you expect that to work?
pseudo wren
maybe it was my own misreading of the documentation
however i am still new to using pandas
misty flint
pseudo wren
maybe it was my own misreading of the documentation
its okay. that happens to me a lot too
pseudo wren
thank you lol
kamsdata.str.replace(['kmpl', 'CC', 'bhp', np.nan]).str.replace('f', repr, regex=True)
are you advising me to implement a solution like this?
desert oar
pandas is the module
pandas.Series is the class
pandas.Series(...) is how you create a new series
pandas.Series(...).str.replace(...) takes the new series and invokes .str.replace(...) on it
kamsdata is your existing dataframe
kamsdata.str.replace(...) invokes .str.replace(...) on your existing series
note that kamsdata is a dataframe and you probably just want to do it on the single column (i.e. a series)
modern cypress
kamsdata[column name]
misty flint
when you select a single column from pandas kamsdata["max_power"] , it returns it as a Series so then we can apply the str.replace method afterwards
modern cypress
If True, performs operation inplace and returns None.```I would suggest doing inplace = true
desert oar
@pseudo wren
kamsdata['mileage'] = kamsdata['mileage'].str.replace(' kmpl', '')
kamsdata['max_power'] = kamsdata['max_power'].str.replace(' bhp', '')
kamsdata['engine'] = kamsdata['engine'].str.replace(' CC', '')
that solution makes sense
if i can break it down for understanding
you're accessing the column my df
individually
and then replacing it with the desired result
i think i tried to do it at all at once and confused myself further with the documentation
desert oar
pseudo wren
i think i tried to do it at all at once and confused myself further with the doc...
that's very likely
i recommend reading through the tutorials specifically
as well as the "user guide" stuff
it will take a while
also i think you might want to review the python basics
methods, attributes, etc.
pseudo wren
i think that when it comes to using modules
i tend to think some of the python basics are out of the window
because for some reason i don't think the same rules apply
misty flint
sometimes i wonder if it would beneficial to newbies if we provided more examples or something to the documentation
desert oar
yeah, that's an interesting observation. they are never out the window
misty flint
i think it wouldve helped me in many cases
desert oar
some languages work like that (e.g. ruby), but in python it is very hard to throw out too many rules as a library author
and it's considered bad practice to do so anyway
pseudo wren
using regular python can be very different when you are using a module
for me anyway since i'm just learning that
desert oar
even so, it's still python and all the same conventions and rules should still apply
too much magic is a bad thing imo, for this exact reason
desert oar
they tend to be overly complicated and show too many things at once
misty flint
yeah why is that
desert oar
the docs do a very poor job of breaking down the concepts
desert oar
because good technical writing is really fucking hard, and smart people who know a lot of things are sometimes the worst writers because they can't empathize with people who don't know things
misty flint
youre right
pseudo wren
i don't know
i'm in a weird in between stage of learning right now
somewhere in the limbo of beginner and starting to be intermediate
feels like a wide gap from those two points
desert oar
"advanced beginner"
misty flint
the more technical you get, the less likely you retain that empathy for beginners unless you actively encounter/interact with them regularly
desert oar
that's true. helping people online is a great exercise in staying in touch with what it's like to be a newbie
misty flint
so its harder to write to that audience
pseudo wren
i'm past hello world and loops
but i'm still struggling with packages
very weird learning place to be in
desert oar
that's still beginner imo because you're still learning how the language works. you aren't a beginner to programming anymore, so you've moved onto being a beginner at python itself
you're a beginner but at something different
pseudo wren
maybe so
desert oar
there's also no money in it 😆
pseudo wren
i can do some basic pandas
pseudo wren
but now i'm moving on to pandas with machine learning
desert oar
pandas is actually easier if you're better at python
pseudo wren
maybe so
misty flint
if i had my own startup
pseudo wren
it's a balance between practicing
misty flint
i would hire a couple technical writers
desert oar
@pseudo wren does this help?
kamsdata['mileage'] = kamsdata['mileage'].str.replace(' kmpl', '')
                      ^^^^^^^^^^^^^^^^^^^
                      get the 'mileage' column, a pandas.Series

kamsdata['mileage'] = kamsdata['mileage'].str.replace(' kmpl', '')
                                         ^^^^^^^^^^^^
                                         get the string-replace method

kamsdata['mileage'] = kamsdata['mileage'].str.replace(' kmpl', '')
                                         ^^^^^^^^^^^^^^^^^^^^^^^^^
                                         call the string-replace method, returning a new pandas.Series

kamsdata['mileage'] = kamsdata['mileage'].str.replace(' kmpl', '')
^^^^^^^^^^^^^^^^^^^^^^
assign the result back to the original column in your data frame
yes this i understand
i understand what methods you're accessing and how
it's more ethat
i don't...trust myself to understand it
desert oar
but this is all python syntax. you could know literally nothing about pandas and should still be able to more or less guess what this is doing
pseudo wren
if that makes sense
desert oar
right. which is a sign that you need to review your python fundamentals still, when it comes to methods, classes, functions, etc.
pseudo wren
like if the documentation i read throws me something else
pseudo wren
desert oar
right. which is a sign that you need to review your _python_ fundamentals still,...
see that's a thing i've been doing too
but it's also weird
because when i go to review
i find that i can do a class
or a function
or identify a method
and then i feel okay
but once i move on
it feels weird
desert oar
is your review time spent mostly reading explanations? or are you actively reading "real" code and writing code?
pseudo wren
it's more like i can recognize things but don't have fluency
no
it's more writing code
modern cypress
Sorry to interrupt, just have a quick question. What kind of evaluation techniques should I be using on a multi-class image classification model? I have accuracy and loss curves and then confusion matrix with a heatmap visualisation. Each class broken down into accuracy, precision, recall and f1 score. Do you think this is enough for a conference paper?
 pseudo wren
like for example if i were asked to write a function
i could do that
but when it comes to fluency
ie identifying approrpiate scenarios to use certain things
i falter
desert oar
modern cypress
Sorry to interrupt, just have a quick question. What kind of evaluation techniqu...
seems reasonable, but did you have some specific project goal in mind? are you comparing to SotA models? is your model huge and takes forever to train, or can you do nested cross validation to demonstrate the variance of the predictions?
misty flint
you could also plot an ROC curve (FPR vs. TPR)
desert oar
can you test the model under perturbations of the image that weren't in the training set?
misty flint
@modern cypress have you considered that?
modern cypress
misty flint
you could also plot an ROC curve (FPR vs. TPR)
I was looking at ROC curves, but I haven't gone too into depth with them, I read I would have to be doing a one class vs one class or a one class vs all classes?
desert oar
pseudo wren
ie identifying approrpiate scenarios to use certain things
that's fair, and that's definitely something you will gain over time. but in this particular case, i think you lost track of what each thing in the code was, and you didn't understand the examples because you don't recognize the usual spelling conventions (like capital letters for ClassNames)
misty flint
pseudo wren
ie identifying approrpiate scenarios to use certain things
i think its just practice over time for that skill. im also working at that type of stuff myself
doing practice problems on codewars helped me a lot
but you can choose your favorite platform but the key is to do it frequently
since you are thrown dif situations and have to apply various thinking/problem-solving skills
modern cypress
desert oar
seems reasonable, but did you have some specific project goal in mind? are you c...
My model is quite large, it took me all night to do 15 epochs (cpu only, cause when i try tensorflow gpu i just get spammed with errors). I will add in examples of the model working thank you for that!
desert oar
ok, no nested cross val then
you can do micro-averaging or macro-averaging to compute an overall roc curve
pseudo wren
desert oar
that's fair, and that's definitely something you will gain over time. but in thi...
i'm also just feeling a bit frazzled in general
but yeah
desert oar
https://datascience.stackexchange.com/q/15989/1156 @modern cypress

Data Science Stack Exchange
I am trying out a multiclass classification setting with 3 classes. The class distribution is skewed with most of the data falling in 1 of the 3 classes. (class labels being 1,2,3, with 67.28% of the
pseudo wren
i think reading your solution made a lot of sense for me
but i am new and still not at a running pace
modern cypress
desert oar
https://datascience.stackexchange.com/q/15989/1156 <@181415862933127168>
Oh I will take a read, thank you for this
pseudo wren
so identifying it on my own takes some time sometimes
desert oar
fair enough, you'll get there
pseudo wren
i'll try and keep at it
misty flint
modern cypress
I was looking at ROC curves, but I haven't gone too into depth with them, I read...
its kinda another way of looking at recall. i would just look again and see if it makes sense for your use case
 modern cypress
desert oar
ok, no nested cross val then
modern cypress
desert oar
ok, no nested cross val then
I also realised that after those 15 epochs, the learning curve still didn't plateau, so I have to discuss that as further possible next steps I think
desert oar
how did you decide on 15 epochs? just cut it off after a while?
modern cypress
I tried 6 epochs and it took roughly 2 and a half hours, so I just calculated how much time I have till I can wake up and work on it again
modern cypress
Hahahaha true
I should hopefully get this paper finished tonight so I can send it to be edited and stuff
due in 4 days >.>
My first time writing a paper that's not for university
 ocean swallow
Fellas any resources on modern and practical approach to sales forecasting, revenue analysis, price optimization?
I really like the sentdex's thinking approaching problems. But his things are I think a little too uncomprehensive.
desert oar
i can't speak to the financial stuff specifically, but the book Forecasting: Principles and Practice is free and very good
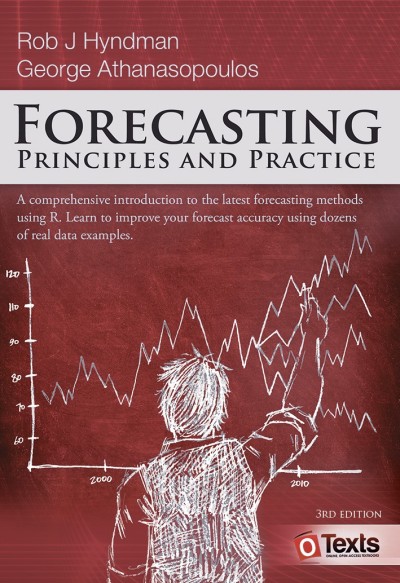
3rd edition
ocean swallow
desert oar
i can't speak to the financial stuff specifically, but the book _Forecasting: Pr...
"One hundred years later, in ancient Babylon, forecasters would foretell the future based on the distribution of maggots in a rotten sheep’s liver."
sold on that one. jokes aside looks nice very concise. Anything that has hands on python approach?
tacit basin
😭
 desert oar
ocean swallow
sold on that one. jokes aside looks nice very concise. Anything that has hands o...
desert oar
ocean swallow
sold on that one. jokes aside looks nice very concise. Anything that has hands o...
i don't know of books like this specifically. the tslearn and darts packages both include a lot of time series machine learning tools. tslearn has a good user guide too https://tslearn.readthedocs.io/en/stable/user_guide/userguide.html but it's a lot of pretty deep machine learning stuff. you probably need something more "applied" and industry-relevant / more-statistical
ocean swallow
desert oar
i don't know of books like this specifically. the tslearn and darts packages bot...
okay I will check both of them. And yes, I need something practical and applied, preferably over real-life data that doesn't have clear cut pattern and is noisy. I have gone over the basics too many times now. And seen too many useless old methods as well :\
I mean that "fbi crime data" like on kaggle just optimizes to maximum immediately with almost whatever model you use without doing anything lol
found some amazon sales data and things are hard for me rn lol
thanks by the way for all
 leaden crow
idk why you would use crime data for price optimization
not what I do tho, I'm in NLP and philosophy lol
tacit basin
misty flint
tragic.
kaggle
leaden crow
i've got a question, doing some data cleaning rn and looking to speed up things
so the data is formatted like this [{"label": "abstract-granular", "feature": SEQUENCE]}...},
abstract-granular meaning I could reformat the data to {"abstract": [{"label": "granular", "feature": SEQUENCE}...], ...}
so I am looking for anomalies in the sequences, like a term that doesn't make sense to be frequent under that label
a way you could prob do this is oh the term math comes in this sub-labels frequencies but not the other sub-labels in the abstract label
what would be a fast way of doing that
i'll move this to a help channel my bad
 soft lance
Hello everyone. Let's say I just learned about Fully-Convolutional Networks for semantic segmentation. The main advantage is said to be their ability to process images of any size, since fully-connected layers are not present in this architecture. My question is: how can I feed images of a different sizes to a model like this, since I can't just concatenate them into a batch of let's say 4 images. Am I doomed to only use batches of the size 1, or is there a trick? Would be very thankful for the help, google doesn't seem to understand my question
ocean swallow
leaden crow
idk why you would use crime data for price optimization
it is a time series data (like sales data) and a lot of courses use those.
 empty halo
what the best api to use for ai?
tacit basin
empty halo
what the best api to use for ai?
depends what you want to do. NLP - huggingface is good for example
pytorch, tensorflow are both very good
scikit learn, xgboost, etc etc
empty halo
ok thanks
 grave frost
@iron basalt https://arxiv.org/abs/2112.04035
In this work, we show that transformers, when equipped with recurrent position encodings, replicate the precisely tuned spatial representations of the hippocampal formation; most notably place and grid cells.
backs up the implicit (and scaling philosophy) towards achieving AGI 👌

arXiv.org
Many deep neural network architectures loosely based on brain networks have
recently been shown to replicate neural firing patterns observed in the brain.
One of the most exciting and promising...
pseudo wren
one more question o wise and gracious data science and ai chat
so now that i have dropped some of those extra strings
it does show that they are gone on my dataframe
however
it still reads those values as objects instead of integers or floats
here is the code i attempted
it was half right
kamsdata['mileage'].astype(float)
some of these conversions work
some of them do not
i know that this has to do with the standard python library rules
but what is a good way to get around this
 small orbit
Anyone who can review my code and tell me how i can speed the process up a bit?
dataset(100 000 emails) = 350mb
It has now run for 50 hours and completed 20%. It will take a total of a bit over 10 days for it to run.
I have 32gb of ram and a decent CPU.
Code: https://nbviewer.org/urls/bpa.st/raw/KZLA
 mild dirge
@small orbit gpu?
small orbit
can you give me a whole sentence?
pseudo wren
kamsdata['engine'].astype(float) this conversions work
but the others don't
is there a good rule of thumb for doing conversions
iron basalt
grave frost
<@119925597395877889> https://arxiv.org/abs/2112.04035
> In this work, we show t...
Yeah using a transformer is another option. There are several other options already tested. The main downside to transformers is of course that it's deep learning and suffers from catastrophic interference and requires a ton of compute (no online learning (unless you try doing some Numeta-like sparsity thing)). But on the other hand, lots of people have messed around with transformers so there is a lot of knowledge to make use of. The key thing here is actually what is briefly mentioned but the most important part, and that is that by having action-state pairs that are predicted you have moved up the ladder of causation implicitly (https://en.wikipedia.org/wiki/Causal_model#Ladder_of_causation ). And that they are doing it in a way that makes use of spatial mappings (and can therefor be used for "zero-shot" of most things, because most things (in our natural world) involve space (which helps even more if you have an online learner)). Most deep learning does not bother with this because they just want to classify stuff or predict only (no actions, unless you are doing RL, but i'm not sure if many actually realize that what they are doing involves moving up the ladder of causation and it's why RL is so hard). The problem is that when actions get involved there is a feedback loop and it's a way harder problem to understand what is happening (control theory / optimal control theory staring from the corner). So the upside is that it's higher on the ladder of causation making it way more powerful (and making use of the very general, but crucial assumption of space (2D, 3D, whatever, what is important is that you can move around in it / integrate motion and it acts like affine transforms in grid cells)), downside is that it's hard. You can learn grid-cell like behavior and other such things implicitly when you are higher up on the ladder of causation, but them being explicit is also an option, although I would not add in much more than space assumptions to keep the agent general, assuming you want AGI, because it can learn the rest (important for online learning because you can sort of bootstrap / bake in assumptions (like that the agent exists in a 3D world (very generic, but crucial assumption that saves a lot of training time (a transformer for example could learn it implicitly and not really care about that problem))).

In the philosophy of science, a causal model (or structural causal model) is a conceptual model that describes the causal mechanisms of a system. Causal models can improve study designs by providing clear rules for deciding which independent variables need to be included/controlled for.
They can allow some questions to be answered from existing...
Showing the implicit construction of grid-cell like behavior is really nice confirmation though.
*So when doing online learning explicit grid-cell systems can help your online learner a lot, but when using a transformer you are doing offline learning anyhow so you can just have it learn it implicitly. The explicit method does not make the agent any less general, because it's not really a problem specific assumption (for any agent in the real world it will be moving around in a seemingly / locally euclidean space (which is probably why geometers started with that assumption, it's baked into the way humans think by default without extra training (don't have time to just learn that implicitly within a life (would die quickly before one does (need it)), only via genetics))).
*Also as TBT's conjecture goes, the space assumption is used for more than just real world movement, but can be applied to just about anything (copy pasted into the neocortex and generalized).
misty flint
pseudo wren
is there a good rule of thumb for doing conversions
what error is being returned? you probably are trying to convert data types that cant be converted directly to float since the column data probably still has those units in them like we saw previously
so you might have to do more replacing if thats the case
grave frost
iron basalt
Yeah using a transformer is another option. There are several other options alre...
I don't agree with you. its been demonstrated that large models forget less and less over tasks https://openreview.net/pdf?id=GhVS8_yPeEa
PaLM and GOPHER have demonstrated that very well.
as for online learning, well its been pretty easy to just do a few backward passes. nothing major at all - and much cheaper in Mixture-of-experts like models
causation
PaLM demonstrated cause-and-effect understanding capabilities as well as reasoning, so I don't get where you're coming from
So when doing online learning explicit grid-cell systems can help your online learner a lot, but when using a transformer you are doing offline learning anyhow
even then, LLMs meta-learn. you can still give it a few examples as frozen prompts, equivalent to discoveries or a couple of state-reward pairs and still have it "understand" the context and act accordingly
iron basalt
grave frost
I don't agree with you. its been demonstrated that large models forget less and ...
From the openreview net link: ```
Our experiments indicate that large, pretrained ResNets and Transformers are significantly
more resistant to forgetting than randomly-initialized, trained-from-scratch mod-
els
That did not copy well.
 iron basalt
But I mean yeah, of course pretrained will not suffer nearly as bad.
grave frost
its a paper. they love to fill things up and inflate page count
iron basalt
grave frost
I don't agree with you. its been demonstrated that large models forget less and ...
"PaLM demonstrated cause-and-effect understanding capabilities as well as reasoning, so I don't get where you're coming from" - It's a philosophical thing about what actually counts as having found a causal relationship. PaLM does not learn causality. Only associations, and the associations it learned lets it correctly predict cause-effect relationships (the entire point of knowing correlations). But it does not actually know for sure. That requires interventions (taking actions / science). Basically, correlation =/= causation, but more nuanced.
It's part of what the ladder of causation idea is trying to get across.
What is interesting is that as soon as any model starts taking actions it may have the ability to learn causality (the transformer grid-cell thing is doing that, when it predicts some cause-effect relationship, it may be basing that on an actual cause-effect relationships and not just correlation).
grave frost
iron basalt
"PaLM demonstrated cause-and-effect understanding capabilities as well as reason...
seems pretty causal to me
 iron basalt
Yeah it seems like it knows.
It's deceptive in that way (not malicious or anything, just to us it looks like it).
grave frost
Its a pretty annoying philosophical question, but I would attribute things like this to "showing intellectual behavior" if that softens things down. but IMO its pretty much already started to reason to an extent, and meta-learn
iron basalt
It is reasoning, but add in the ability to take actions and it should also be able to reason based not just on associations, but cause-effect relationships learned.
It's meta-learning too.
grave frost
https://socraticmodels.github.io/
try to implement that to an extent
it can understand, but its really integration with their new division focusing on robots which would probably hammer in the interaction part
iron basalt
It's definitely reasoning, and it's useful (it's a type of reasoning). It could also be combined with something that takes actions, yeah.
So when it predicts some cause-effect relationship, it can be learned / turned into an actual learned cause-effect by taking an action that lets you find that out. That is counterfactual reasoning, and it's very important part of causal modelling.
You have some predicted cause-effect, from known associations (e.g. from PaLM) or learned cause-effect relationships. And then you investigate to see if it's an actual cause-effect relationship via intervention (taking actions). And that is much more effective than trying random actions until you got the right one.
grave frost
well, atleast it can learn that despite being grounded to language at the very least
grave frost
indeed, but its really when it goes multimodal, when everything just shifts to the next level
iron basalt
Add in interventions and you got it all. And it will be pretty wild to see what it will do.
grave frost
what a time to be alive 🙂
iron basalt
Yeah multimodal.
grave frost
'modal' - I strongly believe that its really when vision, audio and language come together can we start seeing AGI emerge
iron basalt
Yeah, typo.
Aka fusion. Depending on if you come from certain neuroscience groups or whatever. Different terms, same thing.
Which is a really hard problem too.
Big question mark.
grave frost
promising times. the only minor caveat being scaling has to hold 😉 which may totally spill all the water
its problematic because PaLM is about a year before Turing MT-NLG ( 🙄 their model's name is worse than its performance) which led everyone to assume scaling was beating the dead horse
iron basalt
If by scaling you mean compute. Then we are alright, sparsity is fine. If you mean the other scaling, then uh, yeah, idk, I don't see why though.
grave frost
by scaling, I mean compute, params, data
but PaLM demonstrated that MT-NLG was incorrectly scaled
iron basalt
Yeah then you want something not backprop based and/or sparse, but just do it way better than Numenta did.
grave frost
right before Deepmind demonstrated all models (including palm) are still incorrectly scaled 😂
all experiments kept data size constant. so Deepmind trained a 70B """correctly""" scaled model, outperforming their 260B model (inlcuding 175B GPT3)
iron basalt
Bugs not assumed*
grave frost
updated the scaling exponents, things look rosier than ever
grave frost
iron basalt
Yeah then you want something not backprop based and/or sparse, but just do it wa...
why not?
iron basalt
Backprop just takes a lot of compute. And requires differentiable stuff.
grave frost
but it works.
iron basalt
Human brain does not do it because it would melt it.
Yeah it works, but it would be great if we could get the same but better scaling.
We have put a lot of effort into kicking the can down the road. Making backprop work out better.
grave frost
well, alternatives just don't work
no matter how many approximations come up, they aren't effective
iron basalt
That's hard to say, because there are way less people doing it, and those that are don't have the compute to do something as massive as what is being done with backprop. So it's not really a fair comparison.
grave frost
I wouldn't think so. there have been more impactful papers without much compute too
iron basalt
They would have to compare given the same amount of compute.
grave frost
well, they can compare with smaller models
iron basalt
Yeah on smaller models they can win out already.
grave frost
well, they can always apply for more compute via TRC
iron basalt
One main downside and problem is that without backprop you don't get this nice glue together API so it takes custom code and a lot of time.
grave frost
yea, that too...
iron basalt
I think that may actually be the main reason we see way more of it...
It's just way easier to get into and try new things fast.
It makes sense that the non-backprop would play catchup. Backprop being the sort of relatively brute force way in terms of compute needed (but good end results), but gives a goal to aspire to. If you can get the same or similar enough with way less it would be a huge win.
grave frost
well, if something good comes up - I'm sure we'd all welcome it
my issue is that if existing approaches worked, we'd already see papers on it
since its just free citations with iterative improvements
iron basalt
Yeah, which is why I am a bit disappointing in Numenta's most recent paper. I don't want it to be used as an example of why not to bother trying. It can set it all back a few years.
grave frost
was that the RL one where they do sketchy things?
iron basalt
Yeah, although not really sketchy. You probably got that from YouTube right? They interviewed later. It's just confusing and underwhelming due to some method choices which are the naive way of doing it.
Their testing methods switch due to what was commonly done in those tasks and they wanted to be consistent to that, but that is not mentioned in the paper (typical ML paper implicit BS).
grave frost
ye, the authors sounded like they're doing their best suppresing those things
I suppose. I'm too tired to really remember bout that... 2 A.M vibes 😉
iron basalt
I think the rule for Numenta is that if Jeff is not the main author, take inspiration, but don't assume it's as good as presented (either too good, or bad).
grave frost
does seem to be a bit true. let's see what they come up with next
so far, kWTA sounds like the least novel thing all year 🤷♂️
iron basalt
I also expect Numenta to be hit and miss given they do weird stuff. And failure is really important for progress. Either in the idea, or the presentation of it (someone does it again, but better).
grave frost
yea...but 25 years... really makes you doubt whether they're on the right path
you can only hope for long-term returns by then
 safe elk
grave frost
yea...but 25 years... really makes you doubt whether they're on the right path
safe elk
grave frost
yea...but 25 years... really makes you doubt whether they're on the right path
Yep that long
iron basalt
Well, given where Jeff started, and all that, kinda makes sense. Back then nobody even wanted to give it a chance with him (covered a bit in his book).
grave frost
oh, I don't doubt his theories - they're marvellous, and they stand up to neuroscientific scrutiny
its really when it comes to AI they start to break down a bit
iron basalt
I think he just needs some better DL / programmers.
They are better than before, but still meh.
Way better.
grave frost
I just think he needs to do a ton more experimentation rather implementing everything from neuro-to-DL
that hybrid thing won't work on first few tries at all
iron basalt
Yeah, he also needs to be a bit more flexible with the biological part. Let some non-biologically plausible parts because it's a von neumann machine (we are more flexible with this, we are inspired by his ideas, but we care if it actually works, backprop or not).
There seems to be almost two different groups. Jeff and the pure bio-like and then the other that tries to hack it into DL.
grave frost
yea. what he doesn't get is that he's shipping it as a twist to DL models, so its taken from a DL lens - which in general is traumatized by GOFAI and winters so take everything scientifically and rigorously. while Numenta is a bit more carefree in their experimentation, interested more in ideas than results
grave frost
iron basalt
There seems to be almost two different groups. Jeff and the pure bio-like and th...
oh yea, that's something I've noticed from their forums too. never dug deep into that
safe elk
Lmao still remember GOFAI
iron basalt
Anyhow, gtg, thanks for the cool transformer paper, adding it to the list of grid-cell papers (related directly and indirectly).
grave frost
safe elk
Lmao still remember GOFAI
well, they tried their best with the tools they had- and the symbolic method is still kinda present in many ways. we're better off thanks to them. its really the problem of applying GOFAI today which is laughable
iron basalt
I also noticed that is seems to have one of the most concise descriptions of transformers in it.
grave frost
iron basalt
Anyhow, gtg, thanks for the cool transformer paper, adding it to the list of gri...
👍 anytime
safe elk
grave frost
well, they tried their best with the tools they had- and the symbolic method is ...
Yep with all the tools we hab nao
modern cypress
Hey I was wondering do you guys know of any software that creates these kinds of diagrams?

 slate hollow
i've done some research but i can't seem to find if vs (not vsc) 2022 is compatible with cuda 11.2.2
so yeah, is it?
and i'm just tryna get tensorflow set up, and from what i've seen the most recent version
of tensorflow only supports 11.2
 proven sigil
Anyone know how to install catboost for python? I did pip install catboost but still getting module import error.
 agile cobalt
there's that @modern cypress, check the link they sent after it as well
 pallid laurel
Anyone can help me how can I define a function in numpy with a variable
so that later I can set the variable to a number for example?
 tough frigate
modern cypress
Hey I was wondering do you guys know of any software that creates these kinds of...
tough frigate
modern cypress
Hey I was wondering do you guys know of any software that creates these kinds of...
I doubt
tough frigate
proven sigil
Anyone know how to install catboost for python? I did `pip install catboost` bu...
Use google colab
austere swift
modern cypress
Hey I was wondering do you guys know of any software that creates these kinds of...
it doesn't look exactly like that but http://alexlenail.me/NN-SVG/AlexNet.html generates very similar diagrams
 thorn venture
Hi I have 3 csv , I`ve read those and stored into df . I wanna add all these individual df into an Excel file (3 different sheet named as file name ). i used a loop but always the last one are present in the sheet the other heets are noit there. ANy way how to do this? Thanks in advance.
small orbit
Anyone who can review my code and tell me how i can speed the process up a bit?
dataset(100 000 emails) = 350mb
It has now run for 50 hours and completed 20%. It will take a total of a bit over 10 days for it to run.
I have 32gb of ram and a decent CPU.
Code: https://nbviewer.org/urls/bpa.st/raw/KZLA
Anyone?
mild dirge
small orbit
Anyone who can review my code and tell me how i can speed the process up a bit?
...
Did you try running it on your gpu instead of your cpu?
small orbit
@mild dirge: Nope, but how much would that potentially increase performance?
mild dirge
Well it depends on your cpu and gpu
but 10+ times as fast wouldn't be out of the question I'd think
small orbit
aha, that is interresting.
Is it easy to change the code to work with GPU's? Is the code different for different vendors?
mild dirge
if you have nvidea it shouldn't be too hard (you need CUDA and CUDNN iirc), AMD i'm not sure if it's possible
small orbit
On my laptop, i have a "Nvidia Quadro T1000", i7 cpu, and 32gb ram.
On my cloud server, i seem only to have a "MS hyper-V video", would probably not work.
 odd meteor
proven sigil
Anyone know how to install catboost for python? I did `pip install catboost` bu...
odd meteor
proven sigil
Anyone know how to install catboost for python? I did `pip install catboost` bu...
Were you able to successfully pip install the package? If yes, then I wanna believe it's a PATH problem.
small orbit
@mild dirge: but i could try to run it on a azure Machine learning studio compute instance with GPU setting.
mild dirge
Yeah not sure, but def check possiblities involving a gpu
GPU is much better for neural networks
small orbit
aha, good to know.
do you know what changes i need to do with my code to get it to work with a gpu though?
mild dirge
Depends on what framework you use, you need to check the docs or some tutorial for tf
 vast yacht
hi guys. i'm working on a dataset that doesn't have a single pattern/high correlations. is it a sign that the dataset is useless or do we have other methods to solve this? i think of filtering out random portions of data which has high correlation coefficient and then train that sub-data and ignore the rest. is it helpful to do so?
vast yacht
mild dirge
<@459046923379408899>
thanks. anw, is there any existing libraries help with this combination tasks?
mild dirge
You are saying that your data might be useless, useless for what? @vast yacht
If it's for prediction you can use a neural network, which can be non-linear

 acoustic forge
Am I correct in understanding that the ROUGE metric is not good in abstractive summarizations? Considering that when a summarization is abstractive, the number of n-gram overlaps will be smaller, and thus the ROUGE score is going to be lower.
 sweet sequoia
import matplotlib.pyplot as plt
import numpy as np

india = pd.read_csv('india.csv')

#data_frame = pd.DataFrame(india)

states = india.loc[:,"State"]

confirmed = india.loc[:,"Confirmed"]
deaths = india.loc[:,"Deaths"]

if confirmed[0] > 100:
  plt.plot(confirmed, states, color='blue')

elif confirmed[0] > 1000:
  plt.plot(confirmed, states, color='red')

elif confirmed[0] > 10000:
  plt.plot(confirmed, states, color='green')

elif confirmed[0] > 100000:
  plt.plot(confirmed, states, color='yellow')

elif confirmed[0] > 500000:
   plt.plot(confirmed, states, color='orange')

elif confirmed[0] > 1000000:
   plt.plot(confirmed, states, color='purple')


plt.plot(confirmed, states)
plt.figure(figsize=(126,127), dpi=100)
plt.show()
```The error im getting: ```'>' not supported between instances of 'str' and 'int'```any idea how I can fix it?
 long locust
It looks like confirmed[0] is returning a string, and you are comparing it to an int
sweet sequoia
long locust
It looks like `confirmed[0]` is returning a string, and you are comparing it to ...
But im not. The [0] are all the numbers
 long locust
sweet sequoia
But im not. The [0] are all the numbers
long locust
sweet sequoia
But im not. The [0] are all the numbers
Just as a test, do print(type(confirmed[0]))
Before the if statements
sweet sequoia
long locust
Just as a test, do `print(type(confirmed[0]))`
Okay
long locust
sweet sequoia
Okay
Any update?
sweet sequoia
long locust
Any update?
It gave type as string. Sorry for late response.
long locust
sweet sequoia
It gave type as string. Sorry for late response.
No worries, so what you need to do is convert it to an int in the if statement, or just reassign it before the if blocks
sweet sequoia
long locust
No worries, so what you need to do is convert it to an int in the if statement, ...
hmm okay thanks.
 sleek veldt
i want change Date Format in my date set TO : 2006-04-01
 next phoenix
Found this. Complete Data Manipulation using Pandas : https://medium.datadriveninvestor.com/day-10-60-days-of-data-science-and-machine-learning-d5d789fbda79
 serene scaffold
sleek veldt
i want change Date Format in my date set TO : 2006-04-01
serene scaffold
sleek veldt
i want change Date Format in my date set TO : 2006-04-01
Change it where?
 warm oracle
Did MLPClassifier() change where it stores its weights?
I thought it was in MLPClassifier.coefs_
🤔
 wicked grove
hello,i have a model that is giving me 93.3% acc but i wanna improve it to 96
i was thinking of using weight decay
serene scaffold
grats on getting 93 😄
wicked grove
wicked grove
i was thinking of using weight decay
but i dont get how i can use this parameter to fine tune it '
wicked grove
serene scaffold
grats on getting 93 😄
haha thanks:))
the model is a cnn with 7 conv layers,2 fully connected and 2 dropout layers
modern cypress
Does anyone know how to work with PlotNeuralNet?
https://github.com/HarisIqbal88/PlotNeuralNet
Im trying to get a graph similar to what it produces but I think im too dumb to understand how it works
GitHub
Latex code for making neural networks diagrams. Contribute to HarisIqbal88/PlotNeuralNet development by creating an account on GitHub.
Can't find any youtube tutorials either
pastel valley
if i trianed my model using these generators and preprocessing methods
from keras.applications.resnet import ResNet50, preprocess_input

datagen = ImageDataGenerator(preprocessing_function=preprocess_input)

base_train_generator = datagen.flow_from_directory(
    base_train_data_dir,
    target_size=(img_width,img_height),
    batch_size=batch_size,
    class_mode='categorical')

test_generator = datagen.flow_from_directory(
    test_data_dir,
    target_size=(img_width,img_height),
    batch_size=batch_size,
    shuffle =False,
    class_mode='categorical')
do i need to do the preprocessing methods also everytime i input image to the trained model?
serene scaffold
pastel valley
if i trianed my model using these generators and preprocessing methods
```python...
any image that goes into the model needs to be preprocessed so that the data is represented consistently.
pastel valley
serene scaffold
any image that goes into the model needs to be preprocessed so that the data is ...
preprocessed the same way i preprocessed it during training right?
serene scaffold
pastel valley
preprocessed the same way i preprocessed it during training right?
right. if you preprocessed each image into two-dimensional greyscale arrays, then two-dimensional greyscale arrays are the only things that mean anything to your model, and any image must be encoded as such.
pastel valley
how can i mimic that preprocessing i mentioned without using the imageDataGenerator?
serene scaffold
I'm not sure
I don't actually do anything with images, so I'm just speaking generally.
pastel valley
i tried these
img = cv2.resize(img ,(144,144))
img = preprocess_input(img)
img = np.expand_dims(img, axis=0)
but when i do model.predict(image) it generates different result than the inputs from test_generator
there are same images i just did it manually like looping to the directory of the images
serene scaffold
it looks like preprocess_input is a function. see if you can find out what its inputs and outputs are. what types are they, and what do they represent?
pastel valley
https://github.com/keras-team/keras/blob/v2.8.0/keras/applications/resnet.py#L504-L508
https://github.com/keras-team/keras/blob/fb4a0849cf4dc2965af86510f02ec46abab1a6a4/keras/applications/imagenet_utils.py#L11-L58
this is what i found and base on my understand this they do the centering and rgb to bgr with the lines shown
arctic wedgeBOT
keras/applications/resnet.py lines 504 to 508
@keras_export('keras.applications.resnet50.preprocess_input',
              'keras.applications.resnet.preprocess_input')
def preprocess_input(x, data_format=None):
  return imagenet_utils.preprocess_input(
      x, data_format=data_format, mode='caffe')```
`keras/applications/imagenet_utils.py` line 52
```py
# 'RGB'->'BGR'```oh wow what is this they automatically show it here
serene scaffold
anyway, it might be that you can just pass any training/test instance through this function. not totally sure.
pastel valley
because i probably missing something to this manual preprocessing its like my trained model is useless hahaha
do the batches also need to be the same?
but to predict i need to input multiple images?
serene scaffold
pastel valley
but to predict i need to input multiple images?
usually you predict over sequences and get a sequence of predictions, but if you only want to predict one instance, you can reshape it so that it's treated as a sequence with one instance.
pastel valley
do you mean this?
i trained with 32 batches so i just need to make it 32 also?
 desert oar
modern cypress
Does anyone know how to work with PlotNeuralNet?
https://github.com/HarisIqbal88...
desert oar
modern cypress
Does anyone know how to work with PlotNeuralNet?
https://github.com/HarisIqbal88...
man, you kids and your youtube tutorials.. did you try the example in the readme?
modern cypress
desert oar
man, you kids and your youtube tutorials.. did you try the example in the readme...
Mhmm, but I think this might be a problem with me not understandng git bash tbh
 desert oar
modern cypress
Mhmm, but I think this might be a problem with me not understandng git bash tbh
desert oar
modern cypress
Mhmm, but I think this might be a problem with me not understandng git bash tbh
looks like you opened vim somehow
oh, they told you to open vim
modern cypress
When I look in the dir, it's saved as .py.swp
desert oar
lol, that's just cruel
modern cypress
mhmm
desert oar
don't use vim, just use your normal text editor
type :q! to exit without saving
that has to be a prank by the author 🤣
modern cypress
Oh hahahaha alright
desert oar
to catch people unaware who type commands without thinking about them, perhaps? 😉
modern cypress
XD Well he fooled me
desert oar
im going to have to start doing that
putting echo 'I am a big dummy and didn't read before copying and pasting'; exit in code samples
for i in {0..9}; do echo 'Next time, read before copying and pasting' > README$i.txt; done ; shutdown -h now
in all seriousness this package is 3 years old so if you have issues it might just be old
those are pretty cool diagrams though, would be a shame if it didnt work
oh, if you're on windows the "texlive" stuff won't work for you @modern cypress
you might need to install miktex
or is there another windows latex distribution nowadays?
modern cypress
Yep downloaded miktex
 nova matrix
hello everyone,
does anyone know how I can smoothen out my plot in matplotlib, my data only has 6 points (manual addition or modification not possible) . Is it possible to smoothen it out just slightly to not make it not look all edgy ( something like the smooth curve option in excel)
I tried using gaussian_filter1d but it just changed the y values, tried using BSpline and spline but those were really inaccurate
and just to let everyone know Im just a beginner engineering student learning Data Science in my free time 🤣
desert oar
protext seems to be another option, never used it before https://www.wellesley.edu/lts/techsupport/latex/latexwin

Wellesley College
Prepare to set aside at least an hour of your time to install LaTeX. You should also be on campus or using a high-speed internet connection, since you will have to download a large file. You need to i
nova matrix
nova matrix
hello everyone,
does anyone know how I can smoothen out my plot in matplotlib, ...
The code I am currently using, using a high sigma just completely changes my y values
 desert oar
nova matrix
hello everyone,
does anyone know how I can smoothen out my plot in matplotlib, ...
desert oar
nova matrix
hello everyone,
does anyone know how I can smoothen out my plot in matplotlib, ...
if you use smoothing, you'll have to use a large number of points. that said, perhaps smoothing isn't desirable here. you will be basically guessing at the shape of the curve
wicked grove
hello im trying to use weight decay to optimise my model,but i dont really get what this parameter is doing
desert oar
nova matrix
The code I am currently using, using a high sigma just completely changes my y v...
did you try interp1d? https://docs.scipy.org/doc/scipy-1.8.0/html-scipyorg/tutorial/interpolate.html
nova matrix
desert oar
did you try `interp1d`? https://docs.scipy.org/doc/scipy-1.8.0/html-scipyorg/tut...
Yes I did, basically due to a lack of coordinate at around X = -60:-40 causes problems in no matter what method I use as it tries to make a guessed curve at that time
Using a low sigma with the gaussian_filter1d is the most accurate thing I
desert oar
there might be no other choice then. another option is to cut the array into two arrays, and actually leave a blank space where you have no data
nova matrix
I've gotten so far
nova matrix
desert oar
there might be no other choice then. another option is to cut the array into two...
will try
thanks
modern cypress
desert oar
protext seems to be another option, never used it before https://www.wellesley.e...
I think I'm just too dumb for this x)
I'll try find something else
safe elk
misty flint
<:kekHands:948697940711587900>
On daily coffee?
misty flint
modern cypress
If anyone has any other resources they know, I'd appreciate it XD
misty flint
i wish. about to get some.
modern cypress
I tried messing with NN-SVG but it doesn't look like my model at all (the picture with yellow) XD


Honestly might just mess around with that 2nd picture and just photoshop it
tough frigate
modern cypress
Honestly might just mess around with that 2nd picture and just photoshop it
Do we have any library to create such diagrammatic flow chart?
desert oar
modern cypress
Honestly might just mess around with that 2nd picture and just photoshop it
is that not your architecture?
or are the proportions just off?
oh lol. i wonder how the generated tex code looks, probably unusable to edit by hand
modern cypress
Yeah I was thinking I'll start a new notebook and just mess around with the model to create a more readable image 🤣
Feels like im cheating but it is it what it is
desert oar
it's just pictures, you aren't sacrificing your scientific integrity here lol
 novel acorn
Hello everyone, so I have one question
I'm doing some kaggle exercises and trying to reproduce them in my machine. But I'm seeing that the literal same code I wrote in kaggle isn't working in my machine
mild dirge
modern cypress
Yeah I was thinking I'll start a new notebook and just mess around with the mode...
I used some latex package to make a diagram of the network
 novel acorn
I'm doing some kaggle exercises and trying to reproduce them in my machine. But ...
novel acorn
novel acorn
I'm doing some kaggle exercises and trying to reproduce them in my machine. But ...
I'm using an OrdinalEncoder, and when using it in kaggle, it ignores the NaN values/imputes them, I honestly don't know. But when trying the very same code in my pc, I get an error
ValueError: Input contains NaN
modern cypress
mild dirge
I used some latex package to make a diagram of the network
I got linked to your message before of yours about this! It looked super cool so I wanted to try it, but I couldn't get it worked. So I'm just going to try working with what I have tbh
mild dirge
Yeah, it did take a few hours, but imo it was cool to learn 4 sure
modern cypress
I think it paid off to be honest, looks super professional
Maybe in a next project I'll try it ^^
pastel valley
serene scaffold
usually you predict over sequences and get a sequence of predictions, but if you...
yo sir i guess i figured it out hahaha now when i manually loop to my test images and count the correct predictions it equals to the evaluation of the model on the same images
my mistake is i mimic the rbg to bgr or preprocess_input but my image is already bgr hahaha
robust jungle
quick understanding question: when a neuron recieves multiple inputs how does it use them? Does it simply average them?
mild dirge
It sums them
and uses an activation function
(with inputs meaning the outputs of previous neurons multiplied by their respective weights)
robust jungle
thanks
 karmic valley
ax.plot(xs,256-file.flow[source_start:source_end])
hey is source_start:source_end acting on both x variable (xs) and y variable (256-file.flow). or is source_start:source_end only acting on y variable (256-file.flow)?
ax.plot(xs,256-file.flow[source_start:source_end])
hey is source_start:source_end acting on both x variable (xs) and y variable (256-file.flow). or is source_start:source_end only acting on y variable (256-file.flow)?
desert oar
karmic valley
ax.plot(xs,256-file.flow[source_start:source_end])
hey is source_start:source_...
the slicing only acts on the 2nd parameter
it's easier to see if you use proper whitespacing style:
ax.plot(xs, 256 - file.flow[source_start:source_end])
thank you so much
desert oar
@karmic valley this is how python parses it:
ax.plot(
    xs,
    256 - (file.flow[source_start:source_end]),
)
for my code i was unsure if x variable (xs) was starting at same point
i think it might be but not sure how to tell
!pastebin
arctic wedgeBOT
Pasting large amounts of code
If your code is too long to fit in a codeblock in discord, you can paste your code here:
https://paste.pythondiscord.com/
After pasting your code, save it by clicking the floppy disk icon in the top right, or by typing ctrl + S. After doing that, the URL should change. Copy the URL and post it here so others can see it.
desert oar
karmic valley
for my code i was unsure if x variable (xs) was starting at same point
if you're using pandas you can check the index. otherwise it's your responsibility to keep track of what your data represents
arrays are just arrays of numbers. they only have meaning because we give them meaning
karmic valley
ah okay will try find out
can i use source_start:source_end for a list or only nparray?
serene scaffold
karmic valley
can i use source_start:source_end for a list or only nparray?
you can use slicing syntax in both python lists and numpy arrays. numpy arrays also let you do additional slices for each dimension of the array
karmic valley
ah got you thanks
serene scaffold
python_list[4:10]
numpy_array_2d[3:5, 7:8]  # one slice for each dimension
thanks
i have list of y values named ys. i did 256-ys on console but says error
TypeError: unsupported operand type(s) for -: 'int' and 'list'
serene scaffold
show the whole error, please
karmic valley
 serene scaffold
karmic valley
serene scaffold
karmic valley
I've told you a few times that I won't look at screenshots.
karmic valley
i thought in this case would be easier but okay ill copy
desert oar
karmic valley
```TypeError: unsupported operand type(s) for -: 'int' and 'list'```
python lists don't support arithmetic operations. you need to use numpy arrays
!e ```python
import numpy as np
x = [1, 2, 3]
x_np = np.array(x)
print(5 - x_np) # ok
print(5 - x) # error
@desert oar :x: Your eval job has completed with return code 1.
001 | [4 3 2]
002 | Traceback (most recent call last):
003 |   File "<string>", line 7, in <module>
004 | TypeError: unsupported operand type(s) for -: 'int' and 'list'
ah so i need to convert list to array?
desert oar
karmic valley
ah so i need to convert list to array?
yes
karmic valley
like this?:
ys2=ys.numpy()
serene scaffold
karmic valley
i thought in this case would be easier but okay ill copy
it might be easier for you, but if you want free help, you should be willing to copy and paste the text into markdown blocks.
desert oar
karmic valley
like this?:
ys2=ys.numpy()
no. you should review the numpy tutorial
i even showed you in my own code sample how to do it 🤔
it seems like you are rushing through your projects
slow down and read things. i see this a lot in beginners, they expect to watch a youtube tutorial once and then just blast through their work
karmic valley
oh yes.
ys2= np.array(ys)
desert oar
programming takes focus, patience, and attention to detail!
karmic valley
ah i got you will focus more
desert oar
and yes, stelercus also makes a good point. if you want people to help you for free, you need to make it easy for them to help you
that includes posting code instead of screenshots, posting complete examples, posting the full error outputs, etc.
karmic valley
sorry all
i did this after converting to array:
ys[source_start:source_end]
Out[13]: []

ys2[source_start:source_end]
Out[14]: array([], dtype=float64)
does this mean nothing in source_start:source_end
serene scaffold
karmic valley
i did this after converting to array:
```py
ys[source_start:source_end]
Out[13]:...
it means that those indices are out of range.
!e
nums = list(range(10))
print(f'{nums =}')
print(nums[20:30])
@serene scaffold :white_check_mark: Your eval job has completed with return code 0.
001 | nums =[0, 1, 2, 3, 4, 5, 6, 7, 8, 9]
002 | []
ah interesting
serene scaffold
20 to 30 clearly aren't valid indices for this list. but instead of giving an IndexError, Python just returns as much of the list as it can (none, in this case)
!e
nums = list(range(10))
print(f'{nums =}')
print(nums[5:30])
@serene scaffold :white_check_mark: Your eval job has completed with return code 0.
001 | nums =[0, 1, 2, 3, 4, 5, 6, 7, 8, 9]
002 | [5, 6, 7, 8, 9]
In this case, we gave a range that was partially valid, so it returned the part of the list that was in that range.
karmic valley
hmm okay i see. let me try change source start in my code and see if it works
just another thing, how do i see the last 5 values of an array
e.g. in console i was typing ys to see all y values but so many so takes long to load. can i specify just show last 5
serene scaffold
if it's a one-dimensional array, it's the same as getting the last five values with a list slice.
karmic valley
hmm im not sure what array it is i will try find out
serene scaffold
you can print the array.shape to see the shape as a tuple.
if the shape is just (n,), it is one-dimensional
sleek veldt
i want to change the format of this datetime in python with pandas. anyone can help me?
 karmic valley
okay yes they are 1 dimensiional
not sure how to get last 5 values of a list either lol
serene scaffold
sleek veldt
i want to change the format of this datetime in python with pandas. anyone can h...
are they currently encoded as strings or as datetimes?
karmic valley
i could find length of array and then specify but that seems longer
thorn venture
I have a dataframe. I need to select and add up entire row of same value from a specific column. For exmpl name is a column from where I wanna add up all rows for any specific name "John" , so all data willed added against name column if the value is john . Pls help me in this. Thanks.
karmic valley
is there a way to just say last 5 whatever length so i dont have to calculate
sleek veldt
serene scaffold
are they currently encoded as strings or as datetimes?
its string(i just downloaded dateset )
serene scaffold
sleek veldt
its string(i just downloaded dateset )
so, you should always store time information as an actual datetime and not as a string. so your first step is to parse the string into a datetime, and then change how the datetimes are presented.
karmic valley
okay i think this is right. but just wanted to double check. ys[-5:]
@serene scaffold
serene scaffold
karmic valley
okay i think this is right. but just wanted to double check. ys[-5:]
that looks right.
karmic valley
thansk
sleek veldt
serene scaffold
so, you should always store time information as an actual datetime and not as a ...
hmm, so first step is to encode datetime? and work with datetim lib to convert my goal format? i want to convert like : 2006 - 04 - 01
serene scaffold
sleek veldt
hmm, so first step is to encode datetime? and work with datetim lib to convert m...
!docs pandas.to_datetime
arctic wedgeBOT
pandas.to_datetime(arg, errors='raise', dayfirst=False, yearfirst=False, utc=None, format=None, exact=True, unit=None, infer_datetime_format=False, origin='unix', cache=True)#```
Convert argument to datetime.

This function converts a scalar, array-like, [`Series`](https://pandas.pydata.org/pandas-docs/stable/reference/api/pandas.Series.html#pandas.Series "pandas.Series") or [`DataFrame`](https://pandas.pydata.org/pandas-docs/stable/reference/api/pandas.DataFrame.html#pandas.DataFrame "pandas.DataFrame")/dict-like to a pandas datetime object.look at the examples in this link
sleek veldt
serene scaffold
look at the examples in this link
tnx
serene scaffold
keep in mind that moments in time are not strings. so whatever your reason is for wanting to format it as yyyy - mm - dd, think about what your actual goal is in terms of transforming the data.
karmic valley
im confused. i did length of my array so len(ys). does len give you the number of values in your array because i feel it is giving me wrong numbers
serene scaffold
karmic valley
im confused. i did length of my array so len(ys). does len give you the number o...
is ys a numpy array? because for arrays, len gives you the number of elements in the outer-most dimension. the number of elements is given by the .size attribute.
karmic valley
ah okay. ys is a array but 1 dimension. i will try size
serene scaffold
so if you have an array of shape (4, 3), the python len is 4, even though there's actually 12 (4 times 3) elements
karmic valley
ahh i see
desert oar
karmic valley
im confused. i did length of my array so len(ys). does len give you the number o...
if you want the total number of elements, look at the .size attribute. but consider that slicing only works on one dimension at a time anyway
desert oar
karmic valley
ahh i see
!e ```python
import numpy as np
2x3 array
x = np.array([
[1,2,3],
[4,5,6],
])
nrow = x.shape[0]
ncol = x.shape[1]
print(x[:, :(ncol-1)])
print(x[:(nrow-1), :])
@desert oar :white_check_mark: Your eval job has completed with return code 0.
001 | [[1 2]
002 |  [4 5]]
003 | [[1 2 3]]
Can I get size of all array at once
desert oar
karmic valley
Can I get size of all array at once
what do you mean by "all"?
!e ```python
import numpy as np
2x3 array
x = np.array([
[1,2,3],
[4,5,6],
])
print(x.shape)
print(x.size)
@desert oar :white_check_mark: Your eval job has completed with return code 0.
001 | (2, 3)
002 | 6
oh might have misunderstood before. does size() work on one dimension at a time or all at once
desert oar
karmic valley
oh might have misunderstood before. does size() work on one dimension at a time ...
all at once, look at the example i just posted! there are 6 elements in the array and the size is 6
!e ```python
import numpy as np
2x3 array
x = np.array([
[1,2,3],
[4,5,6],
])
print(x.shape)
print(x.size)
print(len(x))
@desert oar :white_check_mark: Your eval job has completed with return code 0.
001 | (2, 3)
002 | 6
003 | 2
oh okay thats great then
desert oar
len() is the outermost dimension, .size is the entire array
desert oar
.size is the product of all the .shape entries
thorn venture
thorn venture
I have a dataframe. I need to select and add up entire row of same value from a...
Any help pls??
 grave marten
 misty flint
ah i cant seem to ever run away from regex huh
anyway
just wanted to let peeps know nltk has a cool module for synonym generation
if youre into that
also google's documentation about regex is better than python's
thorn venture
pl someone help
misty flint
misty flint
also google's documentation about regex is better than python's <:kekHands:94869...

Google Developers
serene scaffold
thorn venture
I have a dataframe. I need to select and add up entire row of same value from a...
df.groupby('Name').sum()
This is assuming that "John" is in the Name column. If you need further help, please run print(df.groupby('Name').sample(3).to_dict('list')) and put that text in the chat, and we can get into it some more.
karmic valley
        df = pd.DataFrame(ys)
        filepath = f'C:/Users/samay/Downloads/testingtracking_{source_start}.xlsx'
        df.to_excel(filepath, index=False)
i have this code in a for loop with much more code in for loop. but it creates a new excel file after each loop. can i make it so it just puts next loop values in next column of same excel doc??
serene scaffold
karmic valley
```py
df = pd.DataFrame(ys)
filepath = f'C:/Users/samay/Downloa...
you could concatenate all the dataframes you want to be on the same sheet.
karmic valley
oh okay. which line of code would i have to change or do i have to add more code
serene scaffold
karmic valley
oh okay. which line of code would i have to change or do i have to add more code
!docs pandas.concat
arctic wedgeBOT
pandas.concat(objs, axis=0, join='outer', ignore_index=False, keys=None, levels=None, names=None, verify_integrity=False, sort=False, copy=True)```
Concatenate pandas objects along a particular axis with optional set logic along the other axes.

Can also add a layer of hierarchical indexing on the concatenation axis, which may be useful if the labels are the same (or overlapping) on the passed axis number.oh looks complicated lool
serene scaffold
pretty much every pandas function/method has a bunch of extra parameters that you don't need most of the time.
it will be less intimidating the more you refer to the docs. which you can practice right now 😄
karmic valley
which parameter should i focus on reading on
serene scaffold
karmic valley
which parameter should i focus on reading on
you will probably only need to use objs, and maybe also axis
karmic valley
the page you provided also recommends me to see these:
Series.append
Concatenate Series.
DataFrame.append
Concatenate DataFrames.
DataFrame.join
Join DataFrames using indexes.
DataFrame.merge
Merge DataFrames by indexes or columns.
are any of these better or not really
serene scaffold
karmic valley
the page you provided also recommends me to see these:
Series.append
Concatenat...
the append methods in pandas are the worst things about pandas. they don't append in-place--they return a new series or df with the new item added. which is very confusing for beginners, and should probably be avoided by everyone anyway.
join and merge are for SQL-style joins.
thorn venture
serene scaffold
This is assuming that "John" is in the `Name` column. If you need further help, ...
there are multiple repeat in name I wanna make those unique for expl 4 unique names are there but data are many so 10 columns I awanna sort those arrording to name and add all the rows against unique names (4)
serene scaffold
thorn venture
there are multiple repeat in name I wanna make those unique for expl 4 unique na...
Please run the code I provided to generate the data sample.
thorn venture
should I use openpyxl
karmic valley
to be honest im super confused how to do the concat for the excel sheet
the doc is really complicated for me
serene scaffold
karmic valley
to be honest im super confused how to do the concat for the excel sheet
you have a bunch of dataframes with one column, where each column has the same kinds of data, and you want them to be next to eachother on one sheet in excel, right? this is the same as concatenating all these one-column dataframes into one combined dataframe, and just writing that to excel.
karmic valley
basically i dont have the columns of data yet until i run the code. the code when it runs once makes a list of values and saves them in one column on a new excel sheet. when the loop runs again it takes another set of values and saves it to a column of a new excel sheet.
not sure how to make the code say just save each column on same excel file, still keeping them in different columns
serene scaffold
karmic valley
basically i dont have the columns of data yet until i run the code. the code whe...
you have to create and concatenate all the columns before you write anything to the excel sheet
karmic valley
!pastebin
arctic wedgeBOT
Pasting large amounts of code
If your code is too long to fit in a codeblock in discord, you can paste your code here:
https://paste.pythondiscord.com/
After pasting your code, save it by clicking the floppy disk icon in the top right, or by typing ctrl + S. After doing that, the URL should change. Copy the URL and post it here so others can see it.
karmic valley
this is the code i am working with. https://paste.pythondiscord.com/yacafatiki
the last 3 lines are the excel part
i have to fix it otherwise my boss will be made
mad
can you help me concatenate, im aweful
serene scaffold
@karmic valley you can't do any saving to excel in this for loop, because you can't write the new excel page until all the data that's going to go into it is ready
you'll have to save all of it somewhere (a list?) and concatenate it once the work of that for loop is done
I have to do some work as well, so try spending half an hour trying to figure it out on your own.
 chilly abyss
Hello pals, pls I am in need of python code for monte carlo simulation, I m very new to python/programming. But I want to replicate monte carlo simulation I did in MS Excel in python.
desert oar
chilly abyss
Hello pals, pls I am in need of python code for monte carlo simulation, I m very...
- why do you want to switch to python? it's important to understand your objectives for something like this
- can you describe the ms excel code? maybe show some formulas that you used, or even share an example xlsx using a file share service
small orbit
@mild dirge: Do you know how to setup GPU with tensorflow?
mild dirge
nope srr
small orbit
😦
chilly abyss
Thanks @desert oar , I m switching to python because MCS (monte carlo simulation) would be implemented in a set of other code i.e it is block.
What I have done in excel is
- find the mean and standard deviation of a series of data
- Simulate 1000 trial of monte carlo values using [norm.inv(rand(), mean,standard deviation ] function
desert oar
chilly abyss
What I have done in excel is
1. find the mean and standard deviation of a seri...
if you want to draw 1000 values from a normal distribution, you can use scipy.stats
chilly abyss
@desert oar what I did in xls
 desert oar
ok. you'd have to loop over the months, then you can use scipy.stats to generate 1000 values for that month
chilly abyss
alright, I will go through the documentation now
desert oar
import scipy.stats

months = {
    'Jan': {'mean': 89.21, 'st.dev': 8.40},
    'Feb': {'mean': 116.10, 'st.dev': 9.23},
    # ...
}

sims = {}
for month_name, month_data in months.items():
    sims[month_name] = scipy.stats.norm.rvs(
        loc=month_data['mean'], scale=month_data['st.dev'], size=1000
    )
@chilly abyss you can structure it like that
 drowsy wadi
chilly abyss
<@389497659087650836> what I did in xls
drowsy wadi
chilly abyss
<@389497659087650836> what I did in xls
u can sendme csv ?
chilly abyss
Ohh great. So greatful bro
chilly abyss
drowsy wadi
u can sendme csv ?
Is xls file okay? The data is actually in xls format
karmic valley
can someone help me a sex
sec
df = pd.DataFrame(ys)
        filepath = f'C:/Users/samay/Downloads/testingtracking_{source_start}.xlsx'
        df.to_excel(filepath, index=False)
i want it to give me txt not excel
how can i change code
chilly abyss
drowsy wadi
u can sendme csv ?
Hi @drowsy wadi here is csv file
ocean swallow
hey I am looking for modern and practical approach to sales forecasting, revenue analysis, price optimization? I just went through this Forecasting but would like something with python hands-on approach.