#data-science-and-ml
1 messages · Page 393 of 1
 desert oar
and yeah i didn't realize there was an actual spec forming around it
makes a lot of sense and is very welcome
might be useful even in other programming languages
matlab's last laugh 😆
 iron basalt
It kind of can't be for all languages, because it requires some stuff like operator overloading (and garbage collection). But certainly some other languages could.
BLAS was kind of for all languages and this is sort of an extension of that.
BLAS is so old, but still everywhere.
And still is great, a really good API design to last so long.
Numpy was BLAS for Python, and they slowly added more over time, so they decided to make that new API.
desert oar
indeed. i meant more broadly in terms of the feature sets that array libraries will be expected to implement
even the naming of things
iron basalt
Yeah BLAS included namings, but they were different in numpy because they decided they could have cleaner names (due to class methods and operator overloading).
desert oar
oh i was talking about the names in data-api, not blas. my impression of numpy is that it was meant to be "matlab, but it's python"
iron basalt
Matlab was also BLAS with more stuff.
desert oar
true
iron basalt
Numpy was like, hey, I like BLAS and LINPACK FORTRAN n-d-arrays, I want them in Python.
And Matlab was like, hey, I want FORTRAN but worse.
desert oar
hah
iron basalt
With some plotting.
 steady basalt
Why do we get taught to check assumptions when using logistic regression in stats but in ML analysis no one bothers
And also does anyone know any python library that allows for statistics such as odds ratios, lrts and linearity tests
desert oar
steady basalt
Why do we get taught to check assumptions when using logistic regression in stat...
because the distributional assumptions usually only matter if you're doing statistical inference
steady basalt
Yeah do you know how to do that in python?
desert oar
steady basalt
Yeah do you know how to do that in python?
there's the statsmodels library. but personally i still do statistics stuff in R
desert oar
!pypi statsmodels
 arctic wedgeBOT

Statistical computations and models for Python
desert oar
you can also use rpy2 and actually call r from python
less crazy than it sounds
!pypi rpy2
arctic wedgeBOT
Python interface to the R language (embedded R)
steady basalt
What do you think about stata capabilities
desert oar
i used it when i was in undergrad ~10 years ago so i can't really comment. i am told that there are still a lot of advanced econometrics and social science models that are only implemented in stata, so people in academia still use it
i switched to r in 2012 and never looked back, for what i needed to do it was much more powerful
steady basalt
It makes things easier to learn
What makes R so good at it?
Compared and also to python library
desert oar
indeed, it was good when i was learning
r is like stata but it's also a real programming language
so you have a lot more flexibility to do a wider variety of things with it
also it's open source, costs $0, and runs in a terminal - stata has none of those properties
steady basalt
What stuff is it poor for
desert oar
r also has an absolutely enormous community
it's just a somewhat awkward interface and you don't have the advantage of the huge r package ecosystem
steady basalt
I don’t really have the time and energy to learn R on top of my machine learning and stats classes tbh
desert oar
yeah use statsmodels, there's nothing wrong with it
again i think there are other libraries now too.. i don't remember the name
aha, pingouin
that's the one
try that and statsmodels, see which one you like better (or use both)
steady basalt
I’ll probly learn R AFTER I’m more knowledgable with inference… that’s the only thing I’d use it for, not for ML. What’s the best place to go for learning
desert oar
hm... it's been so long since i learned. i don't really know nowadays
maybe there is a good up-to-date o'reilly book. a lot of r stuff tends to focus on a specific ecosystem of libraries called "tidyverse"
steady basalt
I can’t imagine leaving python for R when I have pandas sklearn and keras at my fingertips
desert oar
yeah you don't need to imo
i use it because i already know it
maybe pingouin is really good too, never tried it
steady basalt
I feel with python I can do anything. And everything but R I’d be confined to stats
desert oar
that's not wrong
some people use r for "general purpose" programming and i think they're crazy
steady basalt
From what I’ve seen it at least looks more streamlined and simple
Down or sideways?
Concatenate on axis 1?
 mortal dove
Wondering if anyone knows about a dataset like this. Been searching myself, but so far it seems like I'll have to annotate it myself. I'm looking for an animal image dataset that also has human descriptions of the animals in the image without mentioning the animal name.
Examples:
Picture of an elephant, description says: "Big, grey animal with two tusks and a trunk"
Next picture of elephant, different description says: "Massive grey and brown animal with big ears and tusks"
etc.
Hoping for a dataset with 8+ classes. If there are boundary boxes for the animals that would be a massive plus, but it's not necessary.
desert oar
mortal dove
Wondering if anyone knows about a dataset like this. Been searching myself, but ...
you could probably synthesize this by replacing the name of the animal with "animal", if you can find a general animal dataset
re.sub(make_pattern_from_class_label(label), '', caption) something like that
make_pattern_from_class_label could use a handful of heuristics, like pluralizing etc
 stone marlin
I think the R vs. Python divide was a lot bigger a number of years ago, but most things that R can do are do-able in Python now in statsmodels or sk or pandas or numpy or one of those other specialized packages. I've only found a few very, very specific things which were not python-native and I needed R for.
Of course, Python plotting is definitely lagging behind R plotting... :']
desert oar
stone marlin
I think the R vs. Python divide was a lot bigger a number of years ago, but most...
good point. i actually think matplotlib is better for general purpose usage than r. ggplot is sometimes/often too high level, base r is too low level, and there's not much in between (lattice?)
if you need pixel-level control, base r is a lot better than matplotlib
mortal dove
That's a good idea, but I haven't really had any success with finding any datasets with descriptions of animals, even with the names in the captions
stone marlin
Yeah, mpl is really versatile, but for just the standard "plot" stuff it's kind of --- gross. And because it came from matlab's API, the API isn't really Pythonic at all. Yuck. But I've yet to find a really good plotting lib besides mpl, and it usually does the job w/ Seaborn. I love Altair, but I don't think that's gonna get super-popular any time soon, haha.
For the animal stuff, maybe some of the word2vec people know --- it might be the case that a dataset exists to describe animals like this, since word2vec is usually like, "car = boat - water" or something.
desert oar
mortal dove
That's a good idea, but I haven't really had any success with finding any datase...
fair enough. doesn't imagenet have a lot of animals? maybe you can just grab the subset of imagenet w/ animal labels
wordnet is a hierarchy, so you should be able to just look for "animal" or some equivalently general category
mortal dove
Does ImageNet have human captions describing the animals somehow? That's pretty important for what I need the dataset for
desert oar
oh right, captions. i thought there was a huge caption database too
but maybe you can at least make some progress w/ unsupervised learning on imagenet data
Microsoft COCO Captions
stone marlin
Holy moly, TIL about COCO. That's awesome.
iron basalt
desert oar
good point. i actually think matplotlib is better for general purpose usage than...
I mean, https://pypi.org/project/ggplot/ is a thing.
 desert oar
seaborn is ggplot too more or less 😛
isn't that ggplot one made by the same people who were making that "rodeo" ide?
iron basalt
Yeah.
 echo vigil
What would be the best way to get a fixed length vector representation of a relatively small, unevenly spaced time series? A use case would be if we had a vector containing the number of times a customer played each game at an arcade (number of games x 1 vector) along with the date of their visits, where they don't regularly visit the arcade.
iron basalt
 echo vigil
What would be the best way to get a fixed length vector representation of a rela...
echo vigil
echo vigil
What would be the best way to get a fixed length vector representation of a rela...
the end goal may be to predict whether or not they'll visit the arcade again.
iron basalt
One thing that makes all the plotting libs bad is that requirement to run in the browser.
It adds a ton of complexity and makes things really buggy.
And slow.
mortal dove
Data doesn't necessarily have to be unlabelled.
Microsoft COCO is really promising, but most of the images seem to describe what's actually happening in the scene and not really animal itself
I'll most likely subset from it if I end up creating my own dataset though
 misty flint
stone marlin
Yeah, mpl is really versatile, but for just the standard "plot" stuff it's kind ...
misty flint
stone marlin
Yeah, mpl is really versatile, but for just the standard "plot" stuff it's kind ...
bro the hack is just to switch out matplotlibs' backend for plotly

thats what i do

its literally life changing

steady basalt
stone marlin
I think the R vs. Python divide was a lot bigger a number of years ago, but most...
Why is python plot lagging?
I havnt seen any issues
I’d assume it’s basically the same as R? In terms of functions?
How much more control do u need over graphs
In everyday work
 serene scaffold
steady basalt
How much more control do u need over graphs
serene scaffold
steady basalt
How much more control do u need over graphs
graphs or plots?
misty flint
the better question is
what figure are you going to put on your report / paper / slides
the ugly one
or the not-ugly one
jk
or am i

echo vigil
mortal dove
Does ImageNet have human captions describing the animals somehow? That's pretty ...
what do you mean by describing them?
COCO labels have the classes bird, cat, dog, horse, sheep, cow, elephant, bear, zebra, giraffe. If that is descriptive enough
mortal dove
mortal dove
Wondering if anyone knows about a dataset like this. Been searching myself, but ...
Here's 2 examples
I need captions describing the animals, not labels
echo vigil
mb scrolled right past that
misty flint
hmm
what if you used a language model
to help you generate descriptions
the image dataset would have the normal label
feed the label into a generative language model
then output the description

desert oar
misty flint
to help you generate descriptions
valid approach, but fallible
this would be very useful if you wanted to hire people to assign or refine labels
you could use your bootstrapped model to autofill a label
then the reviewer only has to confirm that it's right, instead of figuring it out from nothing
misty flint
hmm thats a much better approach
desert oar
if it cuts review time down from 2 minutes to 30 seconds that's a big gain for thousands and thousands of images
misty flint
most def
desert oar
hell it might be good enough for production use in certain settings, if you are just trying to autofill stuff
if you are tracking when users reject the auto-fill value and what they replace it with, you get better labels
desert oar
in other news, i am finally understanding einsum thanks to https://stackoverflow.com/a/33641428/2954547

Stack Overflow
I'm struggling to understand exactly how einsum works. I've looked at the documentation and a few examples, but it's not seeming to stick.
Here's an example we went over in class:
C = np.einsum(&qu...
!e
import numpy as np

xy = np.arange(6).reshape((3, 2))
print(xy)

z1 = xy[:,0]**2 + xy[:,1]**2
z2 = np.sum(xy**2, axis=1)
z3 = np.einsum('ij,ij->i', xy, xy)

assert np.allclose(z1, z2) and np.allclose(z2, z3) and np.allclose(z1, z3)
@desert oar :white_check_mark: Your eval job has completed with return code 0.
001 | [[0 1]
002 |  [2 3]
003 |  [4 5]]
In [36]: %timeit z1 = xy[:,0]**2 + xy[:,1]**2
# 5.84 ms ± 395 µs per loop (mean ± std. dev. of 7 runs, 100 loops each)

In [37]: %timeit z2 = np.sum(xy**2, axis=1)
# 13.5 ms ± 514 µs per loop (mean ± std. dev. of 7 runs, 100 loops each)

In [38]: %timeit z3 = np.einsum('ij,ij->i', xy, xy)
# 4.93 ms ± 121 µs per loop (mean ± std. dev. of 7 runs, 100 loops each)
 broken quarry
anyone know Pandas here? I have a question pertaining to using that module.
misty flint
desert oar
in other news, i am finally understanding einsum thanks to https://stackoverflow...
oh this is a really good explanation
def saving this one

 lapis sequoia
does anyone have a problem where their jupyter notesbooks dont save when you hit save in vscode?
i cant tell if this is my emacs keybinds messing with me or it's counterintuitive
desert oar
broken quarry
anyone know Pandas here? I have a question pertaining to using that module.
this is the right channel for it. but you shouldn't "ask to ask". just ask your question, and someone will answer if they know an answer
desert oar
misty flint
oh this is a really good explanation
yeah i didn't realize it was just a matter of "if the letters are the same, multiply them"
broken quarry
@desert oar first time in channel
I have a dataframe where I will be making some calculations on columns in it and then adding that outcome back to the original dataframe in new columns. Question, is it "good practice" to try and stay working within the original dataframe, adding temp columns to it to aid in calculation that are later deleted -OR- create and use a small helper dataframe on the side to temporarily store data to be used in the calculations on the original dataframe?
desert oar
broken quarry
I have a dataframe where I will be making some calculations on columns in it and...
i just store standalone helper Series objects
tmp1 = some_calculation(df[['a', 'c']])
tmp2 = other_thing(tmp1, df['d'])
df['result'] = more_stuff(tmp1, tmp2)
obviously with better variable names than that
is_ok = df['a'].apply(a_check_valid) & df['b'].apply(b_check_valid)
df_ok = df.loc[is_ok]
or like this
i do actually use the name is_ok in code like this, to indicate a boolean Series that selects the "ok" rows
broken quarry
desert oar
i just store standalone helper Series objects
yeah, using them too. and am getting close to writing very cryptic search combined with calculations statements trying to stay within the one dataframe, but it looks hard as hell to read. was also wondering about performance.
steady basalt
serene scaffold
graphs or plots?
Interchangeable for my point
desert oar
broken quarry
yeah, using them too. and am getting close to writing very cryptic search combin...
i wouldn't worry about performance unless you need it. pandas is usually Fast Enough
iron basalt
desert oar
in other news, i am finally understanding einsum thanks to https://stackoverflow...
In mathematics, especially in applications of linear algebra to physics, Einstein notation (also known as the Einstein summation convention or Einstein summation notation) is a notational convention that implies summation over a set of indexed terms in a formula, thus achieving brevity. As part of mathematics it is a notational subset of Ricc...
steady basalt
misty flint
or the not-ugly one
I always make sure to use ones which blend in with my white paper background so usually slightly grey with no horrible margin lines around it
desert oar
iron basalt
https://en.wikipedia.org/wiki/Einstein_notation#Common_operations_in_this_notati...
indeed. i have tried to understand it a few times 😆
@broken quarry the difference between a series and a dataframe is that in a dataframe, pandas can group together several columns of the same type and store them as a single 2d array internally
but that's an implementation detail and an internal performance optimization and not something you need to worry about 99% of the time
broken quarry
k. thank you.
 grave frost
new model, new tasks, new capabilities https://www.reddit.com/r/MachineLearning/comments/tw9jp5/r_googles_540b_dense_model_pathways_llm_unlocks/

reddit
66 votes and 22 comments so far on Reddit
its a pity its not properly scaled according to the deepmind paper though
serene scaffold
steady basalt
Interchangeable for my point
graphs are nodes and edges, and plots are data visualizations. they can't be interchangeable.
 pseudo wren
I need to standardize my values
plt.show()```so in this data that i'm plotting,
the 'Watch Time' has over 100 different values in it
what are some ways that I can standardize this so as to organize this data a bit better
desert oar
pseudo wren
what are some ways that I can standardize this so as to organize this data a bit...
save the standardized dataframe to a separate variable
data_stdized = ...
data_stdized.plot(kind='scatter', x='Watch Time', y='Movie Rating')
plt.show()
don't worry so much about "micro style optimizations"
pseudo wren
desert oar
save the standardized dataframe to a separate variable
can you elaborate on this a little more? I've never done this before admittedly.
desert oar
pseudo wren
can you elaborate on this a little more? I've never done this before admittedly.
done what? make new variables to hold things?
pseudo wren
ah no
i thought you meant something else
i think more of what i'm asking is how can I cut down on the different movie times there are
i am not sure how to standardize the dataframe yet
desert oar
those are two different questions
"standardize" means something different
how many movie times are in this dataset? you can plot a pretty large number of points if you reduce the point size and add transparency
pseudo wren
this goes on for like 1000 rows. i'm trying to find a more optimal way to show you.
 desert oar
pseudo wren
this goes on for like 1000 rows. i'm trying to find a more optimal way to show y...
desert oar
pseudo wren
this goes on for like 1000 rows. i'm trying to find a more optimal way to show y...
100 or 1000?
desert oar
even 1000 isn't too many to plot, unless they are all really densely clustered in one area
ah i see
so they're all overlaid
pseudo wren
yes basically
pseudo wren
hexagonal binning?
desert oar
https://www.meccanismocomplesso.org/en/hexagonal-binning-a-new-method-of-visualization-for-data-analysis/
https://datavizproject.com/data-type/hexagonal-binning/

Hexagonal Binning is another way to manage the problem of having to many points that start to overlap. Hexagonal binning plots density, rather than points. Points are binned into gridded hexagons and distribution (the number of points per hexagon) is displayed using either the color or the area of the hexagons.This technique was first described ...
desert oar
it's not about "clutter"
it's about actually being able to see the data points
another option is to add random white noise to the data, a technique called "jittering"
but hexagonal binning might be better
pseudo wren
i'm trying to hexbin the columns
however it's saying it must be numeric
ah i see
i think the watch time may count as a string
 novel acorn
Hello, I have a question related to mean encoding. I'm supposed to encode based on the target variable, but in this case, I've already split the dataset into train and test, so, this splitting should be after I clean my data and am ready to evaluate or before? And how would I get the encoding if my X_train doesn't have the target?
I know it can be kind of a nooby question, but I'm kinda lost
desert oar
pseudo wren
i think the watch time may count as a string
based on the screenshot, it is definitely a string. you will have to process and convert it
desert oar
novel acorn
Hello, I have a question related to mean encoding. I'm supposed to encode based ...
you "fit" the encoding on the training set, and apply it on the test set
that is, you use the mean from the training set on the test set
generally you need to split your data processing into "before splitting" and "after splitting"
pseudo wren
desert oar
based on the screenshot, it is definitely a string. you will have to process and...
Trying to process it but I’m forgetting how to convert it
desert oar
pseudo wren
Trying to process it but I’m forgetting how to convert it
what do you have so far?
!d pandas.Series.astype
arctic wedgeBOT
Series.astype(dtype, copy=True, errors='raise')#```
Cast a pandas object to a specified dtype `dtype`.my_data_1['Watch Time'] = my_data_1['Watch Time'].astype(int)
i can see why this doesn't work
but i figured it was worth a shot
i'm trying to find out how to access the column in the series
misty flint
desert oar
https://www.meccanismocomplesso.org/en/hexagonal-binning-a-new-method-of-visuali...
this looks interesting

desert oar
pseudo wren
i'm trying to find out how to access the column in the series
a series is a column
misty flint
yeah
desert oar
pseudo wren
```my_data_1['Watch Time'] = my_data_1['Watch Time'].astype(int)```
!e ```python
import pandas as pd
times = pd.Series(['40 min', '30 min'])
print(times.astype(int))
@desert oar :x: Your eval job has completed with return code 1.
001 | Traceback (most recent call last):
002 |   File "<string>", line 3, in <module>
003 |   File "/snekbox/user_base/lib/python3.10/site-packages/pandas/core/generic.py", line 5815, in astype
004 |     new_data = self._mgr.astype(dtype=dtype, copy=copy, errors=errors)
005 |   File "/snekbox/user_base/lib/python3.10/site-packages/pandas/core/internals/managers.py", line 418, in astype
006 |     return self.apply("astype", dtype=dtype, copy=copy, errors=errors)
007 |   File "/snekbox/user_base/lib/python3.10/site-packages/pandas/core/internals/managers.py", line 327, in apply
008 |     applied = getattr(b, f)(**kwargs)
009 |   File "/snekbox/user_base/lib/python3.10/site-packages/pandas/core/internals/blocks.py", line 591, in astype
010 |     new_values = astype_array_safe(values, dtype, copy=copy, errors=errors)
011 |   File "/snekbox/user_base/lib/python3.10/site-packages/pandas/core/dtypes/cast.py", line 1309, in astype_array_safe
... (truncated - too many lines)
Full output: https://paste.pythondiscord.com/quvilibowa.txt?noredirect
desert oar
@pseudo wren ☝️ do you see the problem?
hint: " min" isn't a number
pandas is not quite as magical as that
(nor should it be imo)
pseudo wren
yeah
i figured that much
maybe if i do a for statement through everything in that particular column
like this?
  if i == type(str):
```data transformation hmm
desert oar
pseudo wren
```for i in my_data_1['Watch Time']:
if i == type(str):
```
that's one option. the "pandas way" is to a function and use .apply
or you can use the various string methods on the Series itself
!e ```python
import pandas as pd
times = pd.Series(['40 min', '30 min'])
times = times.str.removesuffix(' min')
times = times.astype(int)
print(times)
@desert oar :x: Your eval job has completed with return code 1.
001 | Traceback (most recent call last):
002 |   File "<string>", line 3, in <module>
003 | AttributeError: 'StringMethods' object has no attribute 'removesuffix'
aw
older version of pandas?
!e ```python
import pandas as pd
times = pd.Series(['40 min', '30 min'], dtype='string')
times = times.str.replace(' min', '')
times = times.astype(int)
print(times)
@desert oar :white_check_mark: Your eval job has completed with return code 0.
001 | 0    40
002 | 1    30
003 | dtype: int64
see that makes sense
however i need to get all the values in there
which is where it becomes a pain in the ass
desert oar
pseudo wren
however i need to get all the values in there
how do you mean?
times is already a Series. i think you're overthinking this
desert oar
pseudo wren
yeah i might be
do you know how to assign a column to a dataframe? either creating a new one or overwriting an existing one
pseudo wren
not sure
desert oar
!e ```python
import pandas as pd
data = pd.DataFrame({
'times': ['40 min', '30 min']
})
data['times'] = data['times'].str.replace(' min', '').astype(int)
print(data)
@desert oar :white_check_mark: Your eval job has completed with return code 0.
001 |    times
002 | 0     40
003 | 1     30
i recommend reviewing the pandas tutorials
 frigid elk
what's recommended for EDA on larger datasets. .. 12MM rows, 55cols, ~2.5gb, parquet dataset. .... working with 16gb ram, roughly 8 available
dask
dask distributed (local)
pandas w/ arrow
etc...?
desert oar
they do attempt to cover all this stuff, although they are somewhat scattered
but if you have a sample dataset to work with, you can learn from them
that's how i originally learned pandas, in 2015 when the docs were a lot less useful than they are today
pseudo wren
see i do completely understand what you did
but i'm wondering if i need to iterate over every value in that list to get them all to convert
desert oar
pseudo wren
but i'm wondering if i need to iterate over every value in that list to get them...
it's not a list, and no
pseudo wren
the answer is probably yes
desert oar
pandas does the iteration for you
desert oar
that's one of the big points of pandas
not only does it lead to much tidier code, it can also be significantly faster on larger amounts of data
sometimes you do have to write a for loop with pandas, but it's not typical
again, i suggest reviewing the pandas tutorials and user guides. there is a lot of information there even for people who think they know how to use pandas
desert oar
same with most of the industry 😆
misty flint
yeah im still learning pandas tricks all the time
then i feel like a noob every time
pseudo wren
desert oar
again, i suggest reviewing the pandas tutorials and user guides. there is a lot ...
i will definitely review it
i just started doing machine learning in conjunction with pandas
so i will need to review a lot
desert oar
serene scaffold
I'm gonna click it
 wheat ice
why can't we click on the pandas docs links 
lapis sequoia
Guys. Is it better to drop the null categorical values or replace them with mode
serene scaffold
I just did and I'm okay
serene scaffold
lapis sequoia
Guys. Is it better to drop the null categorical values or replace them with mode
so you're trying to impute missing ones? what is the end goal here?
lapis sequoia
Just cleaning the data
serene scaffold
that's your immediate goal, not the end goal.
lapis sequoia
My end goal is submitting the assignment. Haha 🤪
serene scaffold
and the assignment is just to clean the data?
lapis sequoia
Yup
serene scaffold
then yes, you can do mode imputation, I guess.
serene scaffold
imputing them is higher effort than dropping them, and if you're just doing an assignment, you might as well do the high effort option to show that you know stuff.
lapis sequoia
Oo
Is it really high effort. Cant we just column.fillna(column.mode)?
I just thought it wasn't a decent approximation to use the mode
That's why I didn't
serene scaffold
no, because mode returns a Series, since there can potentially be more than one mode if there are ties for most frequent.
lapis sequoia
Ah.
serene scaffold
so you'll have to find a way around that.
lapis sequoia
So if there are multiple highest frequency values. Can I just substitute either one without any reasoning?
serene scaffold
I guess. you could also see if there's another feature that strongly correlates with the feature you're trying to impute
and then use that feature to resolve ties in some way
I don't know what your instructor is looking for
lapis sequoia
Would be beyond the scope i think.
Btw. Is it possible to find a mode pair?
As in mode of a combination of columns
misty flint
wheat ice
why can't we click on the pandas docs links <:PensiveFluent:865332812042731539>
reverse psychology
misty flint
serene scaffold
tbh I've never done imputation in "real life"
me neither tbh but i see different papers on it occasionally
serene scaffold
though interestingly, during the first interview phase for the job that I currently have, the interviewer asked me how to deal with missing data, and I gave imputation as an option (and explained why I didn't think it was that great). and he mentioned that the previous person he interviewed said that they would "just delete it". so I suspect that my resume would have been thrown into the fire if I didn't know what imputation was.
serene scaffold
well, the person who said they would have deleted it didn't get the job.
misty flint
you just needed to beat the runner-up is all
 tough frigate
Or be a millionaire
 prisma mist
 stark breach
Need some help in understanding linear regression
stark breach
Need some help in understanding linear regression
y = mx + c ? type
 deft spire
a = np.array(((11, 4, 2), (5, 6, 9), (2, 1, 5)))```
How can I quickly get array of [:1] slices of each inner array? Is it possible with that `[:,2]` syntax or I have to iterate through it
Wanted output
```py
array([[11, 4], [5, 6], [2, 1]])```
Also if there's any guide about that item getting with the commas could you please share it with me tardy jolt
so hello is there a way a convnets middle layers output can be mapped to the kernel it caame from
prisma mist
stark breach
<@!210695037829251072> can you join voice
no i can't
prisma mist
deft spire
```py
a = np.array(((11, 4, 2), (5, 6, 9), (2, 1, 5)))```
How can I quickly get ...
a = np.array(((11, 4, 2), (5, 6, 9), (2, 1, 5)))
out = [i[:2] for i in a]
out = np.array(out)
?
deft spire
No other way right?
I thought you could do something with those commas
Like to select only first items a[:,0]
prisma mist
deft spire
Like to select only first items `a[:,0]`
unless this is some feature i don't know about i am sure this results in an error because you can't slice with a string plus index integer
 valid smelt

Medium
Research proposal for the sample-efficient method in a new domain
steady basalt
serene scaffold
though interestingly, during the first interview phase for the job that I curren...
They actually ask that? Isn’t this what every data scientist knows already?
steady basalt
serene scaffold
graphs are nodes and edges, and plots are data visualizations. they can't be int...
Graphs refer to plots in 99% of life, when you’re talking about matplotlib vs R it’s pretty obvious what I meant… you’d know if I was referring to the other graph based on context 😅
 vernal solstice
hi newbie here can i ask questions about yolov5? i have already claimed a channel here #help-popcorn I appreciate any help ❤️
 mint palm
after training a model how do i test it on a single example??
steady basalt
@mint palm because I don’t know how I would just ask for predictions and true values and then index it
Or just make a new array of one row and test on that
mint palm
steady basalt
<@!408337360548528138> because I don’t know how I would just ask for predictions...
i mean i dont want to train it before testing
basically i have to write a small pseudo code for model in actual action i mean application
 tacit basin
vernal solstice
hi newbie here can i ask questions about yolov5? i have already claimed a channe...
tacit basin
vernal solstice
hi newbie here can i ask questions about yolov5? i have already claimed a channe...
Do you run inference with
python detect.py --source 0
?
serene scaffold
steady basalt
Graphs refer to plots in 99% of life, when you’re talking about matplotlib vs R ...
I wasn't really looking at the context. I usually look at the last few messages to see if there's anything I know about.
serene scaffold
steady basalt
They actually ask that? Isn’t this what every data scientist knows already?
Well, the point of the question was to sus out the fakes.
 vivid bloom
Hi, I’m working about on a speech emotion recognition software and I’m starting to look at live detection software can anyone help point me to some resources that could help
steady basalt
serene scaffold
Well, the point of the question was to sus out the fakes.
Surprising there’d be so many fakes of this level of not knowing something so simple
I wonder how many “fakes” got the internships over me, I still can’t find one
Life as a masters student in UK is like hunger games…
serene scaffold
vivid bloom
Hi, I’m working about on a speech emotion recognition software and I’m starting...
which emotions do you want to be able to detect? you need to know which ones exactly. and what is the use case?
vivid bloom
serene scaffold
which emotions do you want to be able to detect? you need to know which ones exa...
im hoping to detect neutral, calm, happy, sad, angry, fearful, disgust and surprised
serene scaffold
vivid bloom
im hoping to detect neutral, calm, happy, sad, angry, fearful, disgust and surpr...
how quickly would the model need to be able to classify a 3s audio sample in order to be viable?
vivid bloom
and planning on using a website ( im looking into django to create the website )
vivid bloom
serene scaffold
how quickly would the model need to be able to classify a 3s audio sample in ord...
i would imagine on the quicker side just bc im looking at it from the users perspective on a website
serene scaffold
vivid bloom
i would imagine on the quicker side just bc im looking at it from the users pers...
in that case, how accurate does it need to be in order to be viable?
vivid bloom
ideally around 60% at the minimum
 next phoenix
Found this. Cluster Analysis using Python — Part 1
https://medium.datadriveninvestor.com/cluster-analysis-using-python-part-1-4ceee387d79a
serene scaffold
vivid bloom
ideally around 60% at the minimum
alright, I'll see if I can look into it later. though you can also look up papers about emotion classification from audio, see if they posted the source code or models, and see if the results section in the paper indicate that it would meet your accuracy threshold.
vivid bloom
serene scaffold
alright, I'll see if I can look into it later. though you can also look up paper...
Will do and thanks
serene scaffold
vivid bloom
Will do and thanks
what you'll probably see is that some of the emotions get mixed up frequently. like calm/sad, angry/disgust, happy/surprised
tacit basin
serene scaffold
what you'll probably see is that some of the emotions get mixed up frequently. l...
Eivl? When i see Eivl in general i always read Evil 😂
frigid elk
does anybody know of a dask discord?
frigid elk
outside of scaling to prod, .. are there any advantages to using dask distributed on a local cluster vs pandas and pyarrow for parquet files? working through eda/feature selection on ~3GB of compressed data.
desert oar
frigid elk
outside of scaling to prod, .. are there any advantages to using dask distribute...
3gb of data? meh. that will fit in memory and pandas will probably be fine processing it, albeit a little slow. the advantage of dask is that it can parallelize computations across the dataframe.
you don't need a local cluster though, why not just run dask on your machine?
 slim bone
Need a quick validation - Pytorch is mostly used for research, and TensorFlow is mostly used for industrial purposes?
serene scaffold
slim bone
Need a quick validation - Pytorch is mostly used for research, and TensorFlow is...
I suspect that it's the other way around
slim bone
Is that so? Huh. So many conflicting sources
serene scaffold
tensorflow has keras and keras lets you do rapid prototyping, I guess.
slim bone
Yeah, I've read about Keras as well.
desert oar
i think pytorch originally caught on with researchers because it was less fussy than tensorflow, whereas tensorflow had first-mover advantage and at least used to be faster historically because of lazy vs eager execution
 mild dirge
pytorch also has eager execution iirc
slim bone
That's interesting. I suppose I should just look at the syllabus of the university I'm trying to apply to huh?
desert oar
yeah pytorch was eager-only and tf was lazy-only at first
serene scaffold
pytorch always had eager execution. it's tensorflow that used to not.
desert oar
idk what things are like now. keras is pretty popular. the apis are equivalent imo
desert oar
slim bone
That's interesting. I suppose I should just look at the syllabus of the universi...
for high-level basic usage they're more or less interchangeable imo
pick one and learn it well. by the time you get around to learning the other one, you'll be enough of an expert that you can adapt quickly
heck you might use tf/keras in one course at your university and pytorch in another, depending on how coordinated the departments are
slim bone
Oh, they don't differ greatly? I imagined it being another "React vs Angular" situation, if you're familiar with frontend web development
desert oar
for basic usage they're pretty damn similar. at least keras and pytorch are
serene scaffold
inb4 they join up and create TensorTorch
slim bone
Honestly, I have no idea what would qualify as basic versus advanced. I'm just interested in the field
desert oar
slim bone
Honestly, I have no idea what would qualify as basic versus advanced. I'm just i...
as the saying goes: if you have to ask, don't worry about it
slim bone
Facebook and Google teaming up is a wonderful joke though
slim bone
desert oar
as the saying goes: if you have to ask, don't worry about it
Hahaha touche'.
desert oar
from an industry perspective, facebook and google are definitely "teamed up". there is a huge amount of tacit collusion between large players in most industries. partly to avoid antitrust regulation and partly because of long-term benefits outweighing short-term gains from direct competition
slim bone
Oh and another(hopefully small) question. I started learning Linear Algebra like... 1-2 months ago. Can I apply what I learned to ML or is that a little too early to make anythign meaningful?
frigid elk
desert oar
3gb of data? meh. that will fit in memory and pandas will probably be fine proce...
it's parquet, .. uncompressed is more like 8, ... but there's so much bloat on here sometimes it's questionable. ... at any rate, i wanted to check out distributed as a learning exercise, ... there's still some sysadmin left in my ds bones lol, who doesn't enjoy looking at a good performance monitoring dashboard?
serene scaffold
slim bone
Oh and another(hopefully small) question. I started learning Linear Algebra like...
you can always try
slim bone
desert oar
from an industry perspective, facebook and google are definitely "teamed up". th...
I don't know, late-news make it seem like the rivalry has never been bigger. With google... something something losing Facebook billions of dollars somehow.
desert oar
slim bone
Oh and another(hopefully small) question. I started learning Linear Algebra like...
yes, even if you just learned about vectors and matrix multiplication, that's enough to start reading and working with equations
slim bone
serene scaffold
you can always try
I would! if I had some free time.
Quite honestly, I already tried. But I realized that I don't like learning at my leisure, after I learn all day.
desert oar
slim bone
I don't know, late-news make it seem like the rivalry has never been bigger. Wit...
rivalry
imo this is a ruse promulgated for public perception. it's more like the 19th century colonial era; colonial powers generally recognized each other's empires and left each other alone (until ww1 that is)
slim bone
desert oar
yes, even if you just learned about vectors and matrix multiplication, that's en...
How motivating!
slim bone
desert oar
> rivalry
imo this is a ruse promulgated for public perception. it's more like t...
I'm a little too stupid for this analogy, you'll have to forgive me ^^;
desert oar
slim bone
I would! if I had some free time.
Quite honestly, I already tried. But I realize...
then don't! go outside. go to the gym. when you go to university next year, you'll have plenty of time to work hard and learn stuff
slim bone
I think I get what you are saying though
slim bone
desert oar
then don't! go outside. go to the gym. when you go to university next year, you'...
Oh I should've mentioned I'm already at university. I'm already in the mindset of a masters degree though haha
But I'll definitely try out ML as soon as I can. Interests the hell out of me and I find myself liking Linear Algebra 🙂 (At least, so far)
Thanks for the help peeps!
 eternal rover
how about OneFlow。the chinese framework
misty flint
slim bone
But I'll definitely try out ML as soon as I can. Interests the hell out of me an...
yeah give it a shot if youre interested. find an area that you particularly like and do a deep dive. see if its for you
tacit basin
slim bone
Need a quick validation - Pytorch is mostly used for research, and TensorFlow is...
I think you are right. Although pythorch use in production setting increases too, as there are more cutting edge models available for pytorch
slim bone
tacit basin
I think you are right. Although pythorch use in production setting increases too...
It seems like there's some conflict in the chat - some people claim this is no longer the case. I honestly don't think this matters as I'll just study whatever the syllabus follows. Thank you for your input though!
Most articles I read so mention that this statement is correct, so there is a good chance you're right(I, obviously, can't know myself)
tacit basin


AssemblyAI Blog
Should you use PyTorch vs TensorFlow in 2022? This guide walks through the major pros and cons of PyTorch vs TensorFlow, and how you can pick the right framework.
Pythorch with fastai. Fastai has layered API, so you can start with high level APIs, then you can move to mid, low level API as needed, or just pure pytorch
@tough frigate
slim bone
Haha this peep is bringing in the data with his claims. Looks like a 1 to 4 ratio. Pretty crazy honestly
Pytorch is it I suppose, whenever I get to it
 dusk tide
Anyone learning ML and need of a partner? . We could projects and learn together.
mild dirge
pytorch is pretty fire
tacit basin
dusk tide
Anyone learning ML and need of a partner? . We could projects and learn together...
Fastai is forming study group to go through the deep learning for coders course, if you're interested: https://forums.fast.ai/t/group-2022/94074

Deep Learning Course Forums
Hey there, can we please have a new course group of 2022? Thanks
 versed gulch
Hi guys I'm having trouble of showing an image via thresholding using the sobel filter first:
Here is my code:
# using the sobel filter
sobel_img = sobel(rnd_img_arr)  #Works only on 2D (gray) images
# Sobel filter then Otsu's thresholding
sobel_ret, sobel_thresh = cv2.threshold(sobel_img, 0, 255, cv2.THRESH_BINARY + cv2.THRESH_OTSU)

plt.imshow(sobel_thresh, cmap='gray')
 tough frigate
tacit basin
Pythorch with fastai. Fastai has layered API, so you can start with high level A...
tough frigate
tacit basin
Pythorch with fastai. Fastai has layered API, so you can start with high level A...
Tensorflow not any good?
Alright man, I'll look into pytorch first
tacit basin
tough frigate
Alright man, I'll look into pytorch first
Tensor flow with keras is also very good
 past parcel
I was wondering what online course is best for learning machine learning and data science with python ?
 tight glacier
Can someone help me I am rly struggling with pytorch

I keep getting this error

Would rly appreciate some help
tacit basin
Cannot see anything on these screenshot s on mobile
tight glacier
one second i will post the code
# Read training and test data
batch_size = 256
train_iter, test_iter = mu.load_data_fashion_mnist(batch_size)
# type(train_iter)

X,y = next(iter(train_iter))
print(X.size())
print(y.size())

Creating the Model

from einops import rearrange
patch = rearrange(X, 'b c (h p1) (w p2) -> b (h w) (p1 p2 c)', p1=4, p2=4)
print(patch.shape)

net_test= nn.Linear(16,4)

# Defining model class
class Net(torch.nn.Module):
    def __init__(self, num_inputs, num_hidden, num_outputs):
        super(Net, self).__init__()
        self.num_inputs = num_inputs
        self.num_hidden = num_hidden
        self.num_outputs = num_outputs

        # Stem
        self.Linear1 = nn.Linear(num_inputs, num_hidden)

        # Backbone
        # One block
        # First MLP
        self.Linear2 = nn.Linear(num_hidden, num_hidden)
        self.rel1 = nn.ReLU() # Non-linar activation function
        self.Linear3 = nn.Linear(num_hidden, num_hidden)

        # Second MLP
        self.Linear4 = nn.Linear(num_hidden, num_hidden)
        self.rel2 = nn.ReLU() # Non-linar activation function
        self.Linear5 = nn.Linear(num_hidden, num_hidden)

        # Classifier
        # Self.softmax = torch.nn.Softmax(dim=1)


       # Stem
    def forward(self, x):
        #x = x.view(-1, self.num_inputs)
        x = rearrange(X, 'b c (h p1) (w p2) -> b (h w) (p1 p2 c)', p1=4, p2=4)
        x = self.Linear1(x)

        #1st MLP
        x = torch.transpose(x,0,1)
        x = self.Linear2(x)
        x = self.rel1(x)
        O1 = self.Linear3(x)
        O1 = torch.transpose(O1, 0, 1)

        # 2nd MLP
        x = self.Linear4(O1)
        x = self.rel2(x)
        O2 = self.Linear5(x)

        #classification
        x = O2.mean(axis=1)
        return x
When i try to train I get this error
 serene scaffold
tight glacier
When i try to train I get this error
serene scaffold
tight glacier
When i try to train I get this error
the error message is also text that you can copy and paste.
tight glacier
ValueError: Expected input batch_size (256) to match target batch_size (96)
serene scaffold
it was better when you gave the whole thing.
tight glacier
oh sorry
ValueError Traceback (most recent call last)
<ipython-input-18-135278414a10> in <module>()
1 num_epochs = 10 # learning rate 0.1
----> 2 train_ch3(net, train_iter, test_iter, loss, num_epochs, optimizer)
4 frames
/usr/local/lib/python3.7/dist-packages/torch/nn/functional.py in cross_entropy(input, target, weight, size_average, ignore_index, reduce, reduction, label_smoothing)
2844 if size_average is not None or reduce is not None:
2845 reduction = _Reduction.legacy_get_string(size_average, reduce)
-> 2846 return torch._C._nn.cross_entropy_loss(input, target, weight, _Reduction.get_enum(reduction), ignore_index, label_smoothing)
2847
2848
ValueError: Expected input batch_size (256) to match target batch_size (96).
serene scaffold
the reason being that the whole error message tells you where in the code the error is coming from. the last line of the message by itself, without telling you where the error comes from, is almost useless.
 karmic valley

pls help
something wrong with lines 249-252
i need to specifiy unit8
how to do that
tight glacier
serene scaffold
the reason being that the whole error message tells you where in the code the er...
oh ok yh that makes sense
serene scaffold
karmic valley
somewhere in there you need .to(torch.uint8), but that's the most I'm willing to look at a screenshot.
karmic valley
out_path = OUT_IMAGE_DIR / "test" / "raw-image" / f"{i}.png"
        print(f"Saving raw: {out_path}")
        os.makedirs(Path(out_path).parent, exist_ok=True)
        torchvision.io.write_png(filename=str(out_path), input=pixel_array[0, ...], compression_level=7)
where can i write your code
serene scaffold
you might need to attach it to pixel_array[0, ...]
karmic valley
at the end of the aquare bracket?
serene scaffold
yep
karmic valley
okay let me try. before the comma yeah?
serene scaffold
indeed
just so you know, my time is more limited than it used to be, so in the future I'll ignore any questions you introduce with a screenshot
tight glacier
@serene scaffold I think the error is in the model class but I am unsure how to solve it
karmic valley
okay thanks for your time anyways
serene scaffold
karmic valley
okay thanks for your time anyways
did what I suggest work?
serene scaffold

karmic valley
i think maybe its not running fully - let me see
because it is still saying stop and rerun odd
tight glacier
tight glacier
```
# Read training and test data
batch_size = 256
train_iter, test_iter = mu.lo...
Can someone help me with this pls
serene scaffold
@karmic valley if the dtype is supposed to be uint8, that means you can have integers between 0 and 256. these are probably red-green-blue values. so if the values in the tensor weren't already those, converting it with .to won't fix it.
del can delete something from a list or a dictionary, or un-assign a variable.
 glossy berry
i have two ndarrays of shape (n, )
how do i combine them so that the shape is (n, 2)
ok found what i was looking for with column_stack
karmic valley
serene scaffold
<@!906320410382061599> if the dtype is supposed to be uint8, that means you can ...
hmm i see
  y_pred_raw = image_logit_overlay_alpha(logits=y_pred, images=None, cols=keypoint_cols)
        y_pred_raw = y_pred_raw.mul_(255).type(torch.uint8).cpu()

        out_path = OUT_IMAGE_DIR / "test" / "raw" / f"{i}.png"
        print(f"Saving raw: {out_path}")
        os.makedirs(Path(out_path).parent, exist_ok=True)
        torchvision.io.write_png(filename=str(out_path), input=y_pred_raw[0, ...], compression_level=7)
code below works
but not code i gave you
not sure why
out_path = OUT_IMAGE_DIR / "test" / "raw-image" / f"{i}.png"
        print(f"Saving raw-image: {out_path}")
        os.makedirs(Path(out_path).parent, exist_ok=True)
        torchvision.io.write_png(filename=str(out_path), input=pixel_array[0, ...].to(torch.unit8), compression_level=7)
another chunk not work
lapis sequoia
karmic valley
```py
out_path = OUT_IMAGE_DIR / "test" / "raw-image" / f"{i}.png"
prin...
def image_logit_overlay_alpha(logits, images=None, cols=None,
                              invert=False, cmap=None, alpha=None,
                              overlay_alpha=0.3, overlay_cols=None,
                              min_prob=0.5, min_logit=0.5,
                              **kwargs):
    """Overlays logit maps on top of RGB images.

    Args:
        logits (torch.Tensor): shape = (batch_size, 1, image_height, image_width)
        images (torch.Tensor): shape = (batch_size, 3, image_height, image_width)
        cols (None or list of tuples): list of (name, color) tuples. If None,
            defaults to keypoint_cols. If images is None, logits will be
            colored with these values.
        invert (bool): Invert the colormap if True.
        cmap (None or dict): dict(min=0, max=255) specifying the colormap
how do I run all the cells in a jupyter notebook from the command line? (I want to update the results in each cell and save the notebook in a github workflow)
karmic valley
@serene scaffold I would like to say thanks your code worked. The code just wasn't finishing but I realised my image was massive that's why so I specified to only save 1024 pixels and it worked now
lapis sequoia
lapis sequoia
how do I run all the cells in a jupyter notebook from the command line? (I want ...
You can use nbconvert to run all the cells in a notebook and then save the notebook.
 frozen marten
bias is calculated at training and variance during test
is this true?
or am i inferring it wrong?
ping me on reply
tacit basin
lapis sequoia
how do I run all the cells in a jupyter notebook from the command line? (I want ...
or you can use papermill tool and even parametrize notebook and save resulting notebook somewhere
lapis sequoia
this worked for me jupyter nbconvert --to notebook --execute file.ipynb.. but it saves it as file.nbconvert.ipynb separately rather than overwriting the file, I guess I'll live with that
 mellow vapor
So I am performing sentiment analysis using spacy textblob
the text is a column in pandas dataframe where I can fetch the task on which polarity can be calculated
sentiment_data['SENTIMENT']=0
for idx,text in enumerate(sentiment_data['text']):
    doc=nlp(text)
    sentiment_data.loc[idx,'SENTIMENT']='POSITIVE' if doc._.blob.polarity>0 else 'NEGATIVE'
sentiment_data.to_csv('final_results.csv')
I am running a loop like this where I declare the column as all zeros first
is there any better way to do this?
 fading wigeon
Does anyone have a favored non-parametric outlier detection model that works on n-dimensional data? Time complexity shouldn't be an issue, but preferred quadratic time complexity or less.
My problem is that I'm trying to detect and remove artifact from a digital signal, but I can't make assumptions about the amount of artifact that may (or may not) be present
steady basalt
fading wigeon
Does anyone have a favored non-parametric outlier detection model that works on ...
Cooks distance?
serene scaffold
mellow vapor
So I am performing sentiment analysis using spacy textblob
the text is a column ...
in this case it would be better to use apply and a lambda. also a better data model would be to have an is_positive column and store booleans in it, instead of strings.
something like sentiment_data['text'].apply(lambda text: nlp(text)._.blob.polarity) > 0
frigid elk
running into an issue where SparkSession.builder.appName('PySparkShell').master('spark://mylaptop.internalDomain.com:7077').getOrCreate() is always creating a new spark cluster, instead of attaching to the currently running one i spawned via cli. ... what am i doing wrong that it won't attach?
fading wigeon
steady basalt
Cooks distance?
Does this work for higher dimensional data? Like three or four d or more
novel acorn
Hello everyone, one question
I have a clean dataset where I dropped some rows (it has a length of 570), and I'm trying to train the model, but just realized that my y_train has the original amount of rows (712). So, what I want to do is to drop the rows in y_train where the index doesn't match the index in X_train_clean
How can I do that index matching?
Already did it, is quite long and I think is not a good way, but it worked hahahaha
y_train.drop(y_train.drop(X_train_clean.index).index)
arctic wedgeBOT
Pasting large amounts of code
If your code is too long to fit in a codeblock in discord, you can paste your code here:
https://paste.pythondiscord.com/
After pasting your code, save it by clicking the floppy disk icon in the top right, or by typing ctrl + S. After doing that, the URL should change. Copy the URL and post it here so others can see it.
 unborn dune
Can anyone tell me some good data augmentations which don't affect my bounding boxes?
I do lack data, about 100 images for training
karmic valley
i cant remember what size image i am meant to load into my AI. either 256 hight of 512. https://paste.pythondiscord.com/ifuleyejuq
can someone quickly help me out
 urban prism
unborn dune
I do lack data, about 100 images for training
urban prism
unborn dune
I do lack data, about 100 images for training
I'd recommend https://albumentations.ai/

Albumentations: fast and flexible image augmentations
unborn dune
Thanks @urban prism that looks useful
urban prism
No problem :)
misty flint
urban prism
I'd recommend https://albumentations.ai/
woah this looks good. saving this. thanks

urban prism
Yeah, it's a pretty good library
dusk tide
tacit basin
Fastai is forming study group to go through the deep learning for coders course,...
What programming framework will be used for leaning ?
tacit basin
dusk tide
What programming framework will be used for leaning ?
Pytorch and fastai
dusk tide
tacit basin
Pytorch and fastai
Well then I think then it'll be a problem for me as I going to learn tensorflow because it is more famous.
tacit basin
dusk tide
Well then I think then it'll be a problem for me as I going to learn tensorflow ...
It's not a problem. Both pytorch and tensorflow are great libs.
They will be soon replaced by Julia though.... Ok time will tell lol
 wise pelican
What would you guys recommend as an alternative to matplotlib for what I'm trying to do?
I have data I get from files where the X values are timestamps and the Y values are the actual values recorded t those timestamps.
Currently I generate an animated graph that has the current piece of data centered. Each new frame involves adding the next point of data to the figure, and shifting the x-limit one over ot keep that line centered
This video is what it looks like with very rudimentary data
The problems I'm facing are as follows:
- The line is very jittery, even though I've made sure to interpolate it to have 1 data point per frame
- The figure will randomly get a new line overlaid on top of mine - I have no idea where this comes from, and haven't been able to remove it. Even when I set my figure to not output the line, the random additional line still shows up. The attached image is an example of this happening

I've found plotly but it's just as if not more confusing to work with as matplotlib, and it doesn't have the same level of fluidity for animations that aren't scatter or bar charts
 trim marsh
i have designed an ai and a gui for it but the problem is i dont know when it is in speaking or listening mode so i want that the terminal output should be displayed in label in the GUi
help
anybody can help
 hybrid mica
are there any good tutorials teaching how to build an AI chatbot using deep learning, which uses relatively newer versions of libraries (i.e. not outdated)?
 topaz shale
How do I plot a Numpy Array to a Matplotlib Bar3d plot without an error. I used:
fig = plt.figure()
ax1 = fig.add_subplot(111, projection='3d')

ax.xaxis.set_major_locator(MultipleLocator(1))
ax.yaxis.set_major_locator(MultipleLocator(1))
ax.zaxis.set_major_locator(MultipleLocator(2))

Sample_Matrix = np.array([[0,1,2,3,4,5,6],
                          [2,4,6,8,10,12],
                          [3,9,12,15,18,21],
                          [4,8,12,16,20,24],
                          [5,10,15,20,25,30],
                          [6,12,18,24,30,36]])

nx = 10
ny = 10

width = depth = 0.1

for x in range(1,6):
    for y in range(1,6):
        ax.bar3d(x, y, 0, width, depth, Sample_Matrix[x,y])

plt.show()
without encountering a "too many indices for array: array is 1-dimensional, but 2 were indexed" error message?
prisma mist
If the array is one dimensional that means there is no y
 plush glacier
for school i have to do something for ml now and what would be a good thing to work on it can't be anything with images (i dont want anything to complex but it should still be a challenge i am used to working with images)
so what would be a good category of ml to do the assignment and with category i mean something like image segmentation or something with graphs or time series and those would be just some examples what i mean with category
mellow vapor
serene scaffold
in this case it would be better to use `apply` and a lambda. also a better data ...
oh great thanks alot!
mellow vapor
plush glacier
for school i have to do something for ml now and what would be a good thing to w...

Check out machine learning projects with source code for beginners, freshers, and experienced to gain practical experience and make yourself job ready.
trim marsh
hybrid mica
are there any good tutorials teaching how to build an AI chatbot using deep lear...
u need to learn it on your own just apply your knowledge
prisma mist
conda is the slowest package manager
I hope it wasn't written in python
i'd use mamba but it only gets fast after caching so that's just conda with caching
trim marsh
plush glacier
for school i have to do something for ml now and what would be a good thing to w...
u can make an ai such as tony starks jarvis
plush glacier
trim marsh
u can make an ai such as tony starks jarvis
i sadly dont have a few billion as budged
trim marsh
plush glacier
i sadly dont have a few billion as budged
bro do it on vs code
means u want to make a model?
plush glacier
trim marsh
means u want to make a model?
i dont have super computers available to train the model
trim marsh
plush glacier
i dont have super computers available to train the model
bro i have made jarvis for my self i can give you the code
plush glacier
oh so you just mean a stupid jarvis that can't really do anything got it (edit with stupid i mean predefined inputs and outputs)
trim marsh
plush glacier
oh so you just mean a stupid jarvis that can't really do anything got it (edit w...
what?
plush glacier
show code
trim marsh
dm
plush glacier
sure
 copper cave
Hello everyone, I hope you are well?
I wanted create a pipeline to do the automatic scraping of data from websites and I don't know what i must do firstly. Did someone can help me?
plush glacier
copper cave
Hello everyone, I hope you are well?
I wanted create a pipeline to do the automa...
this would probably be against the tos of a lot of websites so if you are doing that you might want to contact the support of the websites you want to scrape if you are allowed to do that or read the tos of the websites
although that is a pretty interesting and useful project
but because of that i sadly wont be able to help you
copper cave
plush glacier
this would probably be against the tos of a lot of websites so if you are doing ...
Sur, there is no problem in this level...
copper cave
plush glacier
although that is a pretty interesting and useful project
Okay, thanks for the feedback. 😊
 willow jasper
anyone have a dataset of employee name ??
 polar veldt
If I have a pandas dataframe like this:
   dat1         dat1           dat2     dat2
1     0         hsg             1      val
3     1         ddd             2      val
5     2         wsd             3      val
7     3         sad             4      val
How would I split it into two separate dataframes with all columns dat1 and dat2?
tacit basin
polar veldt
If I have a pandas dataframe like this:
```
dat1 dat1 dat2...
What's your desired output dataframes? Can you show?
polar veldt
yeah 1 sec
         dat2     dat2
0         1      val
1         2      val
2         3      val
3         4      val
         dat1     dat1
0         0      hsg
1         1      ddd
2         2      wsd
3         3      sad
something like this
polar veldt
no those are two seperate dataframes
willow jasper
how can we create datasets to 100 names
tacit basin
I mean the input dframe
tacit basin
willow jasper
how can we create datasets to 100 names
There's lib that can fake names
Faker
willow jasper
tacit basin
There's lib that can fake names
Faker
okhh thank
tacit basin
polar veldt
what is a multi index frame?
In your input dframe what's index and what's cols?
polar veldt
the column without a header is index
tacit basin
polar veldt
the column without a header is index
Ok. There's one column to the right with no name?
polar veldt
which one?
tacit basin
polar veldt
which one?
The one that you pasted above as input dframe
polar veldt
oh my bad
     dat1.1     dat1.2       dat2.1     dat2.2
0     1         hsg             1      val
1     2         ddd             2      val
2     3         wsd             3      val
3     4         sad             4      val
Ok. It's due to me viewing on mobile
Normally it's
df1 = df["dat1"]
But you have column names with the same name. Need to check it
polar veldt
tacit basin
Normally it's
df1 = df["dat1"]
But you have column names with the same name. Nee...
ooh no theyre not the same but similar, so what I want to do is all columns with dat1 in the header to one dataframe and headers with dat2 to the other
mellow vapor
So I have unlabeled text data on which I want to perform sentimental analysis
I have already used spacytextblob and vader
Can I use bert without training it on a labelled data ?
or do I have any other options? other than the ones mentioned above
On using BERT directly on the first 10 examples, it didn't perform that well
so I think it needs to realise the context and for that should I use the output labels form vader or spacytextblob?
as they may or may not be correct
tacit basin
You could get columns with dat1 dat2
columns = df.columns
dat1cols = [col for col in columns if col.startswith("dat1")]
dfdat1 = df[dat1cols]
@polar veldt
polar veldt
thanks
tacit basin
Or
dat1df = df.loc[:, df.columns.str.startswith("dat1")]
willow jasper
@tacit basin can i get a datasets for this attributes
 tacit basin
willow jasper
<@490342783572246538> can i get a datasets for this attributes
tacit basin
willow jasper
<@490342783572246538> can i get a datasets for this attributes
Check faker, most of it if not all can be created with it
Or just create with python
willow jasper
tacit basin
Check faker, most of it if not all can be created with it
🥲 me noob can u help me
willow jasper
tacit basin
Or just create with python
i have to create with python, but how
tacit basin
What format you need to create ? CSV, pandas data frame?
willow jasper
tacit basin
What format you need to create ? CSV, pandas data frame?
csv
tacit basin
willow jasper
csv
You can use randint for most of it, range for id
I guess it needs to be random
willow jasper
tacit basin
You can use randint for most of it, range for id
can u teach me syntax
tacit basin
import random
age = [random.randint(25,62) for i in range(100)]
employee_id = list(range(1,101))
Like that
willow jasper
@tacit basin should i then copy the output to excel sheet ?
tacit basin
You can create CSV file with these in python
willow jasper
tacit basin
You can create CSV file with these in python
wait let me do this first
@tacit basin m i doing right ?
 tacit basin
willow jasper
<@490342783572246538> m i doing right ?
tacit basin
willow jasper
<@490342783572246538> m i doing right ?
Yeah
I'd possibly not random, i mean up to you
willow jasper
tacit basin
Yeah
I'd possibly not random, i mean up to you
there was a range function also
tacit basin
Employee id from 1 to 101, that's how python range works
It's fine if you don't want random
employee_id = list(range(1,101))
Sorry you have ot right i was thinking list(range
 burnt citrus
Hey guys. Let's say i have 4 lists
list_2 = ['John', 'Rita', 'Martinez', 'Zoe']
list_3 = [1,2,3,4,5,6,7,8,9]
list_4 = ['apple','orange']```

Is there a quick way of getting a matrix of all possible combinations from list 1 to 4?
eg:
    [[False,Rita,2,orange],
    [False,Rita,2,apple],
    [False,Rita,3,orange],........]```
There are many ways. You can create pandas dataframes out of these lists and save to csv
willow jasper
tacit basin
There are many ways. You can create pandas dataframes out of these lists and sav...
how
burnt citrus
willow jasper
how
dataframe_name.to_csv('name_of_file.csv')
willow jasper
@burnt citrus
 tacit basin
willow jasper
<@887567839270141964>
tacit basin
willow jasper
<@887567839270141964>
Make data frame from lists first
burnt citrus
willow jasper
plz teach me with syntax
this covers everything
pandas has a lot of stuff, it's easier to point you to a guide
tacit basin
df = pd.DataFrame(zip(id, age), columns=["id", "age"])
willow jasper
@tacit basin its printing til 40 only
next phoenix
Advanced Pandas crash course. Found this amazing. https://medium.com/coders-mojo/day-1-day-60-quick-recap-of-60-days-of-data-science-and-ml-6fc021643d1?sk=4e75e043b7630a9f963562ebac94e129
 burnt citrus
next phoenix
Advanced Pandas crash course. Found this amazing. https://medium.com/coders-mojo...
burnt citrus
next phoenix
Advanced Pandas crash course. Found this amazing. https://medium.com/coders-mojo...
lemme ctrl+D that and never open it again 🤣
 mild sorrel
Hello, i want to learn machine learning as a small project to give myself the illusion i'm doing something meaningful, and it might be fun and something i can maybe use in the future. What resources would you guys recommend for me?
tacit basin
willow jasper
<@490342783572246538> its printing til 40 only
Can you show?
tacit basin
mild sorrel
Hello, i want to learn machine learning as a small project to give myself the il...

 weary niche
How can I get the best K for regression? I used k NN
tacit basin
willow jasper
<@490342783572246538>
Can you do
df.shape
weary niche
I have 6 plots, can I just compare the test MSE and the training MSE?
willow jasper
@tacit basin
 tacit basin
Can you paste the code you have so far?
willow jasper
import random
age = [random.randint(25,62) for i in range(100)]
employee_id = list(range(101))
basic_pay = [random.randint(15600,67000) for i in range(100)]
no_clients = list(range(1001))
y_of_service = list(range(41))
performance = [random.randint(0,1) for i in range(100)]
import pandas as pd
df = pd.DataFrame(zip(employee_id, age,basic_pay, no_clients,y_of_service, performance), columns=["employee_id", "age","basic_pay","no_clients","y_of_service","performance"])
df
@tacit basin
tacit basin
willow jasper
import random
age = [random.randint(25,62) for i in range(100)]
employee_id = li...
Zip stops when shorter list stops. You have some lists with range 41 that's wy
willow jasper
tacit basin
Zip stops when shorter list stops. You have some lists with range 41 that's wy
should i remove zip or i have to use anything else in place of range ?
karmic valley
hey
https://paste.pythondiscord.com/ifuleyejuq i cant remember if i feed in 512 pixel height image of 256 height
can someone tell from the code which would be right
 image = torch.sqrt(image*2)*1.5
        image = torch.clip(image, 0, 255)
        image = image / 255.0
what does this mean
what is 255
mint palm
a lower learning rate may give better result but takes more epoch to reach same percentage as compared to higher learning rate model.
Right??
tacit basin
willow jasper
should i remove zip or i have to use anything else in place of range ?
yofservice, numofclients,in the same way as age
tacit basin
mint palm
a lower learning rate may give better result but takes more epoch to reach same ...
In some way yes.
karmic valley
pls can someone help im desperate
serene scaffold
karmic valley
pls can someone help im desperate
you have to ask a question
willow jasper
@tacit basin thank u very much
serene scaffold
well, you're using 8 bit integers, right? 2 ^ 8 is 256.
karmic valley
my ultimate aim is this:
https://paste.pythondiscord.com/ifuleyejuq i cant remember if i feed in 512 pixel height image of 256 height
can someone tell from the code which would be right
i would be eternally grateful if you can tell which size image to feed in
tight glacier
Can someone help me with this?
# Defining model class
class Net(torch.nn.Module):
    def __init__(self, num_inputs, num_hidden, num_outputs):
        super(Net, self).__init__()
        self.num_inputs = num_inputs
        self.num_hidden = num_hidden
        self.num_outputs = num_outputs

        # Stem
        self.Linear1 = nn.Linear(num_inputs, num_hidden)


        # First MLP
        self.Linear2 = nn.Linear(num_hidden, num_hidden)
        self.Relu1 = nn.ReLU() # ReLu Activation Function
        self.Linear3 = nn.Linear(num_hidden, num_hidden)

        # Second MLP
        self.Linear4 = nn.Linear(num_hidden, num_hidden)
        self.Relu2 = nn.ReLU() # ReLu Activation Function
        self.Linear5 = nn.Linear(num_hidden, num_hidden)


    def forward(self, x):

        x = rearrange(x, 'b c (h p1) (w p2) -> b (h w) (p1 p2 c)', p1=14, p2=14)
        x = self.Linear1(x)

        #1st MLP

        #x = torch.transpose(x1,0,1)
        x = torch.transpose(x,1,2)


        x = self.Linear2(x)
        x = self.Relu1(x)
        x1 = self.Linear3(x)

        #x1 = torch.transpose(x1, 0, 1)
        x1 = torch.transpose(x1, 1, 2)


        # 2nd MLP
        x = self.Linear4(x1)
        x = self.Relu2(x)
        x2 = self.Linear5(x)

        #Softmac Regression classifier
        x = x2.mean(axis=1)
        return x
I changed my tranpose function from x = torch.transpose(x1,0,1) --> x = torch.transpose(x,1,2)
and x1 = torch.transpose(x1, 0, 1) ---> x1 = torch.transpose(x1, 1, 2)
But I get this error

/usr/local/lib/python3.7/dist-packages/torch/utils/data/dataloader.py:481: UserWarning: This DataLoader will create 4 worker processes in total. Our suggested max number of worker in current system is 2, which is smaller than what this DataLoader is going to create. Please be aware that excessive worker creation might get DataLoader running slow or even freeze, lower the worker number to avoid potential slowness/freeze if necessary.
cpuset_checked))
RuntimeError Traceback (most recent call last)
<ipython-input-110-135278414a10> in <module>()
1 num_epochs = 10 # learning rate 0.1
----> 2 train_ch3(net, train_iter, test_iter, loss, num_epochs, optimizer)
6 frames
/usr/local/lib/python3.7/dist-packages/torch/nn/functional.py in linear(input, weight, bias)
1846 if has_torch_function_variadic(input, weight, bias):
1847 return handle_torch_function(linear, (input, weight, bias), input, weight, bias=bias)
-> 1848 return torch._C._nn.linear(input, weight, bias)
1849
1850
RuntimeError: mat1 and mat2 shapes cannot be multiplied (25600x4 and 100x100)
Do i need to change my linear layers ?
# Creating model class
num_inputs, num_hidden, num_outputs = 196,100,10
net = Net(num_inputs,num_hidden, num_outputs)

print(net)
@serene scaffold
weary niche
is it okay if my test set mse is lower than my training set mse
 frozen furnace
This is so cringe
 fading wigeon
weary niche
is it okay if my test set mse is lower than my training set mse
fading wigeon
weary niche
is it okay if my test set mse is lower than my training set mse
Sounds inevitable
weary niche
fading wigeon
Sounds inevitable
wdym? as from what ive learned, test mse is usually higher than the training mse
fading wigeon
I think it depends. If the model is overfitting then the mse will be greater in the test set
weary niche
I have k from 1 to 11, the differences in mse for each k is no more than 1 although the training set mse is always higher
i think it should be okay
 astral storm
Yo, anyone got experience training PyTorch fasterrcnn_resnet50_fpn model on CPU?
I'm running a training on 700-800 images around which are 200-700kb each and it takes forever, a batch of 5 takes around 1 minute to handle.
I feel it shouldn't take this long, even if I run on CPU.
mild dirge
I think normally it's just "we think this will happen... " and maybe you could add some arguments explaining why you think that
I don't know if there are official standards for that
mild dirge
the error is pretty self explanatory
What's the problem?
Keep track of the dimensions of the features maps in your cnn, and see if a kernel size is bigger than the input
karmic valley
i dont know what it means
it only comes when i feed in a smaller image
the kernal size is 7,7 and i have image 512 hight x 350width
why it no work
@mild dirge
mild dirge
Because the resulting features maps are also smaller
willow jasper
@tacit basin hey sir how to delete adn item from csv from particular position
mild dirge
maybe further in the network it's only 4x4, and your kernel is 5x5 or w/e
karmic valley
!pastebin
arctic wedgeBOT
Pasting large amounts of code
If your code is too long to fit in a codeblock in discord, you can paste your code here:
https://paste.pythondiscord.com/
After pasting your code, save it by clicking the floppy disk icon in the top right, or by typing ctrl + S. After doing that, the URL should change. Copy the URL and post it here so others can see it.
mild dirge
Make sure your images are consistent in size
karmic valley
mild dirge
you shouldn't have different size inputs
karmic valley
this is my code
it works when i input different sizes but for some smaller images not working
but they not that small
mild dirge
:/
karmic valley
still 350 width
mild dirge
Read what I just said, try understand how a convolutional layer works and what it outputs
karmic valley
im new coding
mild dirge
Nothing to do with coding, has to do with understanding convolutional layers and pooling layers
karmic valley
mild dirge
Because the resulting features maps are also smaller
how do i check this
mild dirge
Stack Overflow
How do I calculate the output size in a convolution layer?
For example, I have a 2D convolution layer that takes a 3x128x128 input and has 40 filters of size 5x5.
karmic valley
i have to fix this by tomorrow is issue
will get fired
so output shape is min size
?
mild dirge
I'm not going to figure it out for you rn, if you don't understand CNNs, you maybe should look up how they work before using them
Might sound harsh, but there's no point spoonfeeding it rn, you'll run into trouble later on anyways then
 karmic valley
so output shape is min size
karmic valley
karmic valley
so output shape is min size
okay just this pls
mild dirge
min size?
karmic valley
because my code is not working only for smaller images so i assume maybe it accepts size only over certain value
mild dirge
Your model should be given equally sized images
there's no reason you are feeding smaller images to it
karmic valley
but i fed in image 350 width but kernal error
karmic valley
mild dirge
That's a terrible way to solve it
the image is repeating so doesnt matter what portion it takes
model.conv1 = nn.Conv2d(1,64,kernel_size=(7, 7), stride=(2, 2), padding=(3, 3), bias=False)
karmic valley
mild dirge
what is w for me
  #1
        out_path = OUT_IMAGE_DIR / "test" / "raw-image" / f"{i}.png"
        print(f"Saving raw-image: {out_path}")
        os.makedirs(Path(out_path).parent, exist_ok=True)
        torchvision.io.write_png(filename=str(out_path), input=pixel_array[0, :, :, 1024:4000].to(torch.uint8), compression_level=7)

        #2
        y_pred_raw = image_logit_overlay_alpha(logits=y_pred, images=None, cols=keypoint_cols)
        y_pred_raw = y_pred_raw.mul_(255).type(torch.uint8).cpu()

        out_path = OUT_IMAGE_DIR / "test" / "raw" / f"{i}.png"
        print(f"Saving raw: {out_path}")
        os.makedirs(Path(out_path).parent, exist_ok=True)
        torchvision.io.write_png(filename=str(out_path), input=y_pred_raw[0, ...], compression_level=7)

        del y_pred_raw
how to specify image length in #2 section like i did in #1 section
pls
tacit basin
willow jasper
<@490342783572246538> hey sir how to delete adn item from csv from particular po...
Which position?
willow jasper
like i want to delete 46 from age row, so how can i do this @tacit basin
 tacit basin
mint palm
some? please elaborate
tacit basin
mint palm
some? please elaborate
I recommend this article on this https://sgugger.github.io/the-1cycle-policy.html

Another data science student's blog
Properly setting the hyper-parameters of a neural network can be challenging, fortunately, there are some recipe that can help.
versed gulch
Does anyone know where I can find the Jerman Enhancement Filter in python?
 modest shuttle
Hello,
How to Merge(Sum) sales rows with same date?

 static pendant
Hi guys i need help with getting only price numbers here

i want to only show the price and get rid of {'BTC':{'USD':}}
misty flint
show code lol
static pendant
def fetch_price(self):
coin = self.comboBox.currentText()
price = str(cryptocompare.get_price(f'{coin}',currency='USD'))
self.coinLabel.setText(f'{coin} Price : ')
self.priceLabel.setText(price)
misty flint
just looks like a nested json for now
static pendant
so?
misty flint
try commenting out this line
self.coinLabel.setText(f'{coin} Price : ')
what do you get?
its tough to figure out a complete answer without knowing what the data exactly looks like and how its structured
this is just a function to pull said data and, looks like, return it in some UI
static pendant
misty flint
try commenting out this line
> self.coinLabel.setText(f'{coin} Price : ')
what ...
same result but withou the coin price text
misty flint
ah thats the left side
my bad
you must have a nested json as your data then
you will have to access the inside of it, if thats the case
try looking at the data itself if you can
misty flint
is this javascript or python
static pendant
python
misty flint
ok take a look at this https://realpython.com/python-json/

In this tutorial you'll learn how to read and write JSON-encoded data using Python. You'll see hands-on examples of working with Python's built-in "json" module all the way up to encoding and decoding custom objects.
 inland kite
 abstract sinew
standard deviation?
steady basalt
Guys, if you could chose between data analyst title and data engineer title, which one is better for the CV in terms of being able to move into data science after uni
In terms of first glance, without explaining the job
misty flint
yes thatll be confusing depending on your audience
misty flint
steady basalt
Guys, if you could chose between data analyst title and data engineer title, whi...
dunno i could see arguments for either

maybe data engineering since it seems many teams need it more
and you could bring that skill set to your future DS role..?
steady basalt
@misty flint assume both titles are for the same job where I’ve been given freedom to call it what I want. In actuality I’m a glorified spreadsheet uploaded
Do you think data science teams or HR people are looking more for DE or DA?
 odd meteor
steady basalt
<@!446424248479645706> assume both titles are for the same job where I’ve been g...
odd meteor
steady basalt
<@!446424248479645706> assume both titles are for the same job where I’ve been g...
Ain't nothing wrong with being a glorified spreadsheet Thanos. So long they cut you your paycheck on time. 😅
steady basalt
Well… would you put data engineer or analyst
odd meteor
steady basalt
Do you think data science teams or HR people are looking more for DE or DA?
I think both depending on the level of structure in the company and obviously the country you're in. Here, It's Data Analytics over Data Engineer
steady basalt
Where?
odd meteor
steady basalt
Where?
Nigeria
misty flint
steady basalt
Do you think data science teams or HR people are looking more for DE or DA?
you should also consider the title Analytics Engineer. look that one up. its becoming more popular recently
steady basalt
I don’t think I want to push it
 lapis sequoia
which loss function is best for a face classification problem?
i want to say for example that picture A belongs to person C
there are 40 persons
mild dirge
depends on how you do it
There are libraries to extract certain facial features, Think they simply use k-nearest neighbours
If you use a cnn I think the standard is categorical cross entropy loss for multi-class classification
mild dirge
you shouldn't look at how your model performs on the test data while tuning your parameters
That's what validation data is for
lapis sequoia
Ok
im confused as to why when i train my model it says there are only 69 images
when there should be 2000
mild dirge
are you training in batches?
lapis sequoia
Yes
mild dirge
how big is your batch size?
lapis sequoia
32
mild dirge
2000/32 is about 62 ish
mild dirge
Why do you think it's only showing 69 images?
lapis sequoia
because of the batch size
lapis sequoia
 lapis sequoia
So is it best to reduce the batch size since 2000 isnt a lot of images
lapis sequoia
Can i do 1 million epochs
mild dirge
I doubt that will give good results
It will very likely overfit
And your gpu might burn through your pc
lapis sequoia
Im assuming that this means the model is incompatible with my data?

The accuracy isnt changing at all
mild dirge
well with the entire process
if it thinks the loss is 0, it thinks it gives perfect outputs
lapis sequoia
Do u see a problme here
 mild dirge
Quite sure categorical cross entropy should not be used with a single output sigmoid
lapis sequoia
Idk i just copied a video
mild dirge
Right, try to understand what you are doing
instead of copying a video
that might help 😛
mild dirge
mild dirge
Right, try to understand what you are doing
^
Really this is the best advice I can give you atm
lapis sequoia
Plz just tell me bro im desperate
mild dirge
there's no point in continuously trial-and-error with machine learning
lapis sequoia
I understand everything
mild dirge
If you are using categorical cross entropy with a binary model using sigmoid and saying "I just copied a video" I highly doubt it
I'm not saying it to be mean, understand what all the parts do and what the video is saying
don't just copy it and ask for help if the program doesn't work
mint palm
I noticed branchin and concatenation reduce chances of overfitting, is it general behaviour?
lapis sequoia
what does a loss of NaN mean
mint palm
Compared tl normall nn
mild dirge
mint palm
Compared tl normall nn
You mean like with inception network?
I don't know the answer btw
mint palm
Like in resnets, feedforward etc
 karmic valley
   temp=image_t.numpy()
        temp=temp[0,0,...]
        fig = plt.figure(frameon=False,)
        ax = fig.add_axes([0, 0, 1, 1])
        ax.axis('off')
        ax.imshow(temp)
        ax.plot(xs,ys,"r-")
        plot_path = OUT_IMAGE_DIR / "test" / "plot" / f"{i}.png"
        plot_path.parent.mkdir(exist_ok=True, parents=True)
        fig.savefig(plot_path,dpi=300)
how to make figure in black and white or original collour
lapis sequoia
what does test loss mean?
abstract sinew
lapis sequoia
what does test loss mean?
loss is like the sum of errors
for each of your classes that's being predicted, the model is confident to some degree in each answer
lapis sequoia
what could ValueError: Shapes (None,) and (None, 50, 50, 38) are incompatible mean
abstract sinew
what are you trying to do
lapis sequoia

im trying to do this
this works though

im not sure what the difference is
do you know? @abstract sinew
abstract sinew
send the traceback
lapis sequoia
`ValueError Traceback (most recent call last)
~\AppData\Local\Temp/ipykernel_13872/2328703601.py in <module>
26 metrics=['accuracy'])
27
---> 28 model.fit(X, y, batch_size=32, epochs=10, validation_split=0.1)
29
30 print("Evaluate on test data")
~\anaconda3\lib\site-packages\keras\utils\traceback_utils.py in error_handler(*args, **kwargs)
65 except Exception as e: # pylint: disable=broad-except
66 filtered_tb = _process_traceback_frames(e.traceback)
---> 67 raise e.with_traceback(filtered_tb) from None
68 finally:
69 del filtered_tb
~\anaconda3\lib\site-packages\tensorflow\python\framework\func_graph.py in autograph_handler(*args, **kwargs)
1145 except Exception as e: # pylint:disable=broad-except
1146 if hasattr(e, "ag_error_metadata"):
-> 1147 raise e.ag_error_metadata.to_exception(e)
1148 else:
1149 raise`
i think its saying something is incompatible with the dense layers

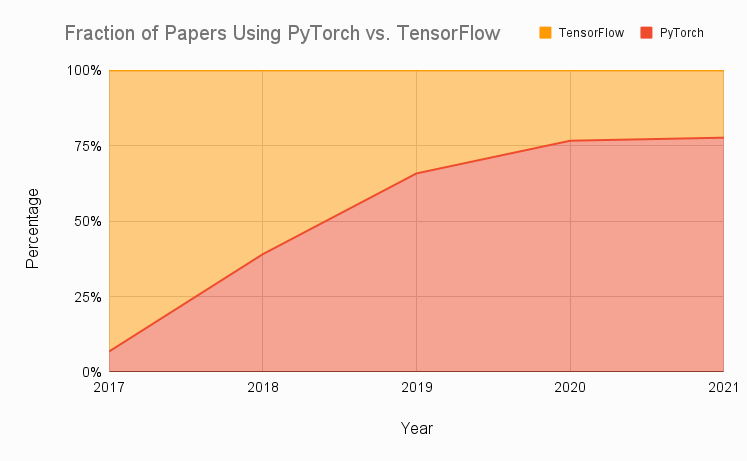 abstract sinew
I really don't know, mate
lapis sequoia
Anyone here a wiz with bigquery python packages?
Keep getting an error that won't let me import bigquery from google.cloud
misty flint
karmic valley
x and y must have same first dimension
 sharp rain
!d sklearn.model_selection.train_test_split
arctic wedgeBOT
sklearn.model_selection.train_test_split(*arrays, test_size=None, train_size=None, random_state=None, shuffle=True, stratify=None)```
Split arrays or matrices into random train and test subsets.

Quick utility that wraps input validation and `next(ShuffleSplit().split(X, y))` and application to input data into a single call for splitting (and optionally subsampling) data in a oneliner.

Read more in the [User Guide](https://scikit-learn.org/stable/modules/cross_validation.html#cross-validation).is train_test_split loss the data reality? Since some of the data split to test array
or train_test_split is only used for testing the model, not training the model?
trim marsh
!d time
arctic wedgeBOT
This module provides various time-related functions. For related functionality, see also the datetime and calendar modules.
Although this module is always available, not all functions are available on all platforms. Most of the functions defined in this module call platform C library functions with the same name. It may sometimes be helpful to consult the platform documentation, because the semantics of these functions varies among platforms.
An explanation of some terminology and conventions is in order.
• The epoch is the point where the time starts, and is platform dependent. For Unix, the epoch is January 1, 1970, 00:00:00 (UTC). To find out what the epoch is on a given platform, look at time.gmtime(0).
Similar names: ipython.time, django.time, django.fieldlookup.time
lapis sequoia

 versed gulch
does anyone know the difference between the Jerman enhancement filter and the frangi vesselness filter code wise?
 naive river
some interesting stuff from google research https://ai.googleblog.com/2022/04/pathways-language-model-palm-scaling-to.html

Google AI Blog
Posted by Sharan Narang and Aakanksha Chowdhery, Software Engineers, Google Research In recent years, large neural networks trained for l...
modest shuttle
Hello,
How to fix this problem?
 naive river
modest shuttle
Hello,
How to fix this problem?
naive river
modest shuttle
Hello,
How to fix this problem?
you are plotting the month, and the month wraps around
maybe convert your year and month into a datetime and use that?
modest shuttle
naive river
maybe convert your year and month into a `datetime` and use that?
It worked right.

 karmic valley
hey matplotlib changing colour of my image to like greeny tint

pls help. i want original colour
tacit basin
karmic valley
pls help. i want original colour
What's the original color?
karmic valley
It's like a black white image, but don't know if it is classed as gray-scale. Just want same image whatever it is not converted to like greeny tinge
Is there a way to tell matplotlib to not change colour of image
temp=image_t.numpy() temp=temp[0,0,...] fig = plt.figure(frameon=False,) ax = fig.add_axes([0, 0, 1, 1]) ax.axis('off') ax.imshow(temp) ax.plot(xs,ys,"r-") plot_path = OUT_IMAGE_DIR / "test" / "plot" / f"{i}.png" plot_path.parent.mkdir(exist_ok=True, parents=True) fig.savefig(plot_path,dpi=300)
!pastebin
arctic wedgeBOT
Pasting large amounts of code
If your code is too long to fit in a codeblock in discord, you can paste your code here:
https://paste.pythondiscord.com/
After pasting your code, save it by clicking the floppy disk icon in the top right, or by typing ctrl + S. After doing that, the URL should change. Copy the URL and post it here so others can see it.
tacit basin
karmic valley
<@490342783572246538>
Matplotlib has cmap parameter, you could try to pass desired color there
desert oar
karmic valley
It's like a black white image, but don't know if it is classed as gray-scale. Ju...
it's applying a "color map", mapping the intensity to a color as well as brightness
you just need to tell it to not do that
try cmap="grey", vmin=0, vmax=255
or use 0,1 instead of 0,255 if your image is normalized to 0,1
karmic valley
@desert oar should I write that in ax.plot or fig.savfig part
Says line2d has no property cmap
I put it in axplot
desert oar
karmic valley
<@389497659087650836> should I write that in ax.plot or fig.savfig part
sorry I had not looked at your code yet and i assumed you were using imshow
use imshow
ah yes, you are
those are imshow arguments
plot is for the line
desert oar
plt.imshow(temp, cmap="gray", vmin=0, vmax=255)
karmic valley
will the saved image still have those
desert oar
have the lines? don't overthink it, python just executes code from top to bottom
karmic valley
okay let me try now
desert oar
if you call plt.plot, it will plot a line
karmic valley
okay now it has removed the image background completely
just made the background black with the line
i still want the image behind it just without the image being altered into this weird colour
 woeful hound
I am currently learning Django. I am building a system that gets input from the user as image and throws back the segmented images using UNet. I have the python files all caught up. But I am having difficulty doing the Django part.
How do I get an image as input from the user and run the UNet model behind it to display the segmented images?
Thanks in advance
 mighty spoke
Hi does anyone know how I can loop through different values of the initial conditions in solve_ivp something like this for i in np.linspace(10**-7,1.8,1000):#list of denisties sol= scipy.integrate.solve_ivp(rhs3, [10**-7,3], [0,i], t_eval=x, dense_output=True)
 zealous burrow
here is how you can use @dataclass and type annotation to represent multimodal data
https://docarray.jina.ai/fundamentals/dataclass/
modest shuttle
Where Actual y?
 desert oar
karmic valley
okay now it has removed the image background completely
desert oar
karmic valley
okay now it has removed the image background completely
what are the actual values in your image array? please read what i wrote above. i said to adjust the vmax according to the range of your data
lapis sequoia
hi
 heavy wedge
Hello I have been directed to this channel
How does machine learning work?
Is there a good and free (very important) online course to learn machine learning?
 sweet sequoia
How can I grab data from certain rows in a pd dataframe?
desert oar
sweet sequoia
How can I grab data from certain rows in a pd dataframe?
.loc for boolean or index subsetting. .iloc for positional (row number)
sweet sequoia
desert oar
`.loc` for boolean or index subsetting. `.iloc` for positional (row number)
Okay. Thank you!
versed gulch
does anyone know how to reconstruct a 3D image using (many)2D images (slices) in python?does anyone know how to reconstruct a 3D image using (many)2D images (slices) in python?
karmic valley
Okay I will try 0 to 1
lapis sequoia
what does to_categorical do?
 slender osprey
Is this the channel to ask about pytesseract?
karmic valley
@desert oar tried 0 to 1 also but same result. Made background complete black
desert oar
karmic valley
<@389497659087650836> tried 0 to 1 also but same result. Made background complet...
remove the vmax and vmin entirely then
what are the max and min values in the image array?
karmic valley
In the numpy array?
How can I check that. My first like of code is temp=image_t.numpy()
How to see Mon and max
desert oar
karmic valley
How can I check that. My first like of code is temp=image_t.numpy()
temp.min() and temp.max()
also temp.shape just to be sure it's actually a flat matrix
karmic valley
Okay let me try now
I write print too?
Okay if I did right then
Max is 0.5
And min -0.4916811
desert oar
karmic valley
And min -0.4916811
looks like the range is -0.5 to 0.5 maybe?
so set vmin=-0.5, vmax=0.5
karmic valley
I'll check shape now
Shape says error. Says tuple object not callible
And why is min not 0.5 exact like max weird
Oh yeah that did basically work !
Thanks!
What does vmax mean
desert oar
karmic valley
Shape says error. Says tuple object not callible
temp.shape isn't a function, it's just an attribute. you don't need to call it with ()
desert oar
karmic valley
What does vmax mean
vmin and vmax set the minimum and maximum values of the array that matplotlib will use for the colors
karmic valley
Oh I see. I will try temp shape again!
desert oar
!d matplotlib.pyplot.imshow
arctic wedgeBOT
matplotlib.pyplot.imshow(X, cmap=None, norm=None, aspect=None, interpolation=None, alpha=None, vmin=None, vmax=None, origin=None, extent=None, shape=<deprecated parameter>, ...)```
Display an image, i.e. data on a 2D regular raster.Oh I see!
desert oar
latest docs are there
The input may either be actual RGB(A) data, or 2D scalar data, which will be rendered as a pseudocolor image. For displaying a grayscale image set up the colormapping using the parameters
cmap='gray', vmin=0, vmax=255....
vmin, vmaxfloat, optional
When using scalar data and no explicit norm, vmin and vmax define the data range that the colormap covers. By default, the colormap covers the complete value range of the supplied data. It is an error to use vmin/vmax when norm is given. When using RGB(A) data, parameters vmin/vmax are ignored.
karmic valley
Awesome didn't realize u can get negative number for colour
Cool
Okay shape is
256 by 1024
 desert oar
karmic valley
256 by 1024
desert oar
karmic valley
256 by 1024
good, should be fine then
karmic valley
One other quick question
desert oar
if you get an error, can you post it as text? screenshots are hard to read
karmic valley
basically i plot a different y value but i think there are more ys than xs
oksy sure
temp=image_t.numpy()
        temp=temp[0,0,...]
        fig = plt.figure(frameon=False,)
        ax = fig.add_axes([0, 0, 1, 1])
        ax.axis('off')
        ax.imshow(temp, cmap='gray', vmin=-0.4916811, vmax=0.5)
        ax.plot(xs,file.flow_true,"r-", linewidth=0.5)
        plot_path = OUT_IMAGE_DIR / "test" / "plot" / f"{i}.png"
        plot_path.parent.mkdir(exist_ok=True, parents=True)
        fig.savefig(plot_path,dpi=300)
 raise ValueError(f"x and y must have same first dimension, but "
ValueError: x and y must have same first dimension, but have shapes (1,) and (473612,)
2nd code is error
desert oar
which line is highlighted? the ax.plot line?
karmic valley
basically i think y values too much compared to x or something but not sure how to specifit number of y values
desert oar
what are the .shape attributes of xs and file.flow_true?
karmic valley
ill check now
i dont think it told me which line was the issue. but ill check shap enow
desert oar
karmic valley
i dont think it told me which line was the issue. but ill check shap enow
the "traceback" output should tell you
!traceback
arctic wedgeBOT
Please provide the full traceback for your exception in order to help us identify your issue.
While the last line of the error message tells us what kind of error you got,
the full traceback will tell us which line, and other critical information to solve your problem.
Please avoid screenshots so we can copy and paste parts of the message.
A full traceback could look like:
Traceback (most recent call last):
  File "my_file.py", line 5, in <module>
    add_three("6")
  File "my_file.py", line 2, in add_three
    a = num + 3
TypeError: can only concatenate str (not "int") to str
If the traceback is long, use our pastebin.
desert oar
read above ☝️
desert oar
and xs?
karmic valley
ill check
hmm weird not saying
AttributeError: 'list' object has no attribute 'shape'
desert oar
can you show the code where you define xs @karmic valley ? lists do not have a shape attribute, only numpy arrays