#data-science-and-ml
1 messages · Page 389 of 1
 serene scaffold
well, I don't know what you mean by "by hand", so we can just accept our differences.
serene scaffold
anyway, "clustering" requires an idea of there being points in space that can be close together or far apart
and words are not points in space
 proven meadow
I just had a massive loss of brain cells, it can be supervised (tested against real values)
 serene scaffold
 misty flint
inb4 text embeddings tho
misty flint
inb4 text embeddings tho
 misty flint

honestly i was always wondering this in the back of my head
when they taught us this in NLP
but like
we're going over this again in my DL class
proven meadow
so does this assume that a character will repeat a series of three words throughout their dialogue? Or by "counting" do you mean something else
serene scaffold
proven meadow
so does this assume that a character will repeat a series of three words through...
yes, the idea is that there might be three-word phrases that are predictive of a specific character. "predictive" means "able to tell you that something is a certain thing".
proven meadow
serene scaffold
yes, the idea is that there might be three-word phrases that are predictive of a...
But if like basically no trigrams repeat (if this is not realistic for a classic novel then you can ignore) then does the model go off of something else? 2-word groups?
serene scaffold
proven meadow
But if like basically no trigrams repeat (if this is not realistic for a classic...
if that turns out to be the case, you'd have to try a different technique, possibly with a lower value of n (the n in ngrams).
proven meadow
Can it go from an arbritrary n and iteratively go down?
serene scaffold
or maybe a higher value of n. you could use pentagrams and be a satanist.
serene scaffold
proven meadow
Can it go from an arbritrary n and iteratively go down?
yes, if you want to program it that way.
proven meadow
wait how would a higher value of n improve it
serene scaffold
proven meadow
wait how would a higher value of n improve it
if it just so happens that there aren't trigrams that help you distinguish between characters, but there are pentagrams that do. it depends on the data
also hail satan.
serene scaffold
look for the one that makes trigrams.
proven meadow
or like what should I look for in the docs
oh ok thats it?
just for making trigrams?
serene scaffold
do you know what lemmatizing is?
proven meadow
no ..
serene scaffold
the "lemma" of a word is the default form of it. the lemma of "running" is "run". the lemma of "went" is "go".
proven meadow
ah so that would help in ensuring that more trigrams repeat
serene scaffold
right 😄
it would make it so your model doesn't care where a trigram occurs grammatically
proven meadow
yeah that sounds nice
I think I have enough info to get started now, basically the teacher wants "effort" so I just have to show that I've been playing around with NLTK and trigrams
(for now at least)
serene scaffold
this assignment sounds about as difficult as the one my undergraduate students did when I was an nlp TA
so, I'd be surprised if you had to present an effective solution.
proven meadow
Yeah and it's also due before like April 2nd so not a lot of time
 iron basalt
Skimming through it, I think the biggest issue is that it's kind of hard to follow and too long. Which makes it feel suspicious.
It's kind of jumping around, a bit much for a reader all at once. If they maybe split it up into separate papers and laser focused on one thing in each it would have seemed better.
Also my general policy for this is always just "show code". Because then I can check it myself.
Especially since there have been many bugs found in some of the code for some pretty big papers.
 atomic tide
@edgy saffron Please keep on-topic in this channel.
 orchid moat
pls someone suggest book to start ai and ml
 mellow vapor
I have to predict if the stock price will go up or go down, based on the data collected in the past 3 years at 10 minute time intervals
I have tried to predict the price directly using arima and then compare the change booleans with the actual change booleans
But still that doesn't seem right as I am currently working in a classification problem rather than a regression problem
I have tried to use lstm with a series of change(goes up set value 1 and goes down set value 0) alongwith the closing prices
Bt that reaches to the accuracy of 51 or 52
So what am I missing?
Or what should I do to get better results?
 minor elbow
just predict its always going to go up
 prisma mist
 tacit basin
https://allendowney.github.io/ElementsOfDataScience/README.html
tacit basin
https://allendowney.github.io/ElementsOfDataScience/README.html
downloading notebooks doesn't work properly. it's giving the raw notebook along with the meta tags
 next phoenix
Found this on internet. For anyone who wants to get into data science and ML with projects -
 tacit basin
prisma mist
downloading notebooks doesn't work properly. it's giving the raw notebook along ...
tacit basin
prisma mist
downloading notebooks doesn't work properly. it's giving the raw notebook along ...
That's how notebooks look like. Open them in colab or with jupyter notebook / lab
 modest mulch
Anyone knows of papers about using GANS for object generation, not image only?
tacit basin
modest mulch
Anyone knows of papers about using GANS for object generation, not image only?
what do you mean by objects?
modest mulch
tacit basin
what do you mean by objects?
the output of the GANS is fed into an object detection network, hence we use GANS to generate images with bounding boxes around objects

 mint palm
how do i decide the functional api architecture?
for a neurAL network that can also be applied by sequential model easily
 blazing mountain
So I compile OpenCV for CUDA on a Jetson, it works, passes tests and imports as cv2 in my interpreter. Yet it doesn't show in pip freeze and the installation of other libraries such as pixellib are trying to install python-opencv on top of it....
 maiden pelican
Does anyone know where can I find BP(Back propogation) neural network algorithm code ?
 sick palm
How is a image rotated or say displaced? Like how to change the position of the pixels?
I know openCV,PIL and other different libraries provide this functionality, but how do I implement this from scratch?
 radiant trout
sick palm
I know openCV,PIL and other different libraries provide this functionality, but ...
radiant trout
sick palm
I know openCV,PIL and other different libraries provide this functionality, but ...
do u know about matrix transformation operation?
 sick palm
radiant trout
do u know about matrix transformation operation?
sick palm
radiant trout
do u know about matrix transformation operation?
I do know the math, but not how to use it here
radiant trout
sick palm
I do know the math, but not how to use it here
u can rotate a plane by angle theta using a rotation matrix
sick palm
Like I am only allowed to use numpy and matplotlib for doing this
sick palm
But how do I construct a mxn rotation matrix?
radiant trout
ur plane would be the location of the pixels not the values in them. When we say mxn image, the array we are talking about contains the pixel intesity, not the pixel location
sick palm
radiant trout
ur plane would be the location of the pixels not the values in them. When we say...
this is what I wasn't able to understand
How do I manipulate the location of the pixels, I mean first I'll have to know them, which is exactly what I wasn't able to do
radiant trout
but u do know the location of the pixel ! Assuming a mono-channel image, the location of the first pixel is [0,0]. Now you can do the rest, if u read up on the rotation matrix
radiant trout
mellow vapor
Or what should I do to get better results?
i wish i had a money printer as well
 wicked grove
To implement this should i use model.add after concatenation?
wicked grove
wicked grove
To implement this should i use model.add after concatenation?
Does the above require only concatenation or does it need tf.keras.model.add
Im not too sure if this is a skip connection or just a concatenated link
mellow vapor
radiant trout
i wish i had a money printer as well
Lol yeah idk why does everyone think that its for printing money.
Maybe my outline is too ambiguous ig
Bt still I would like to take my chances here,
I am currently using features like OHLC avg, RSI, ATR, closing SMA, EMA21 or EMA14 to determine the results
I do know that it cannot be highly accurate but I am expecting an accuracy around 65-70% atleast.
Does this still seem plausible for you to suggest me anything or still just a guy trying to print money?
 grave frost
iron basalt
It's kind of jumping around, a bit much for a reader all at once. If they maybe ...
grave frost
iron basalt
It's kind of jumping around, a bit much for a reader all at once. If they maybe ...
ye, and they push important information down 🙄
 lofty granite
Hi is there anyone who is in virtual reality field
serene scaffold
lofty granite
Hi is there anyone who is in virtual reality field
once again, just ask your actual question.
lofty granite
serene scaffold
once again, just ask your actual question.
Like I want to know about the how is the virtual reality career ahead and should I get into it or not?
I am strting my bachelor's this fall in computer science from csu sacramento
serene scaffold
lofty granite
Like I want to know about the how is the virtual reality career ahead and should...
I'm not familiar with "virtual reality" being a career track in itself. but now that your actual question is exposed, hopefully someone can answer.
lofty granite
yeah!!
lofty granite
serene scaffold
I'm not familiar with "virtual reality" being a career track in itself. but now ...
Also like the python live coding voice chats always stays on
is it a course or jst solving problems?
serene scaffold
lofty granite
is it a course or jst solving problems?
is what a course or just solving problems?
misty flint
im also curious about VR as a viable career track
all i know tho is that facebook hired like 10k engineers in europe for their vr stuff some time back

i wonder if they had slight trouble filling those roles
since i think the skill set is typically what youd see in game devs tbh
lofty granite
hmm
As I am starting my education so it's better to choose specific career now instead of wasting 1-2 semesters
lofty granite
serene scaffold
is what a course or just solving problems?
I am asking that there is a live coding voice channel
so in that what they are studing
serene scaffold
lofty granite
I am asking that there is a live coding voice channel
you can join it and see
lofty granite
They are like talking about python language but duw to ineligibility I ma unable to speak in that channel
 steady basalt
Guys, having scaled and normalised the liver dataset three times, accuracy only goes DOWN. Is this normal?
Why does everyone on Kaggle scale and not test whether it actually improved anything
misty flint
anybody have resources for parallel and distributed computing specifically for machine learning?
serene scaffold
misty flint
anybody have resources for parallel and distributed computing specifically for m...
isn't that basically what GPU computation is for?
misty flint
serene scaffold
isn't that basically what GPU computation is for?
just want to have some foundational understanding if someone asks me to setup multiples gpus to run models (no one is going to ask me tbh )
like which part can be parallelize-able
and which parts cant
serene scaffold
misty flint
just want to have some foundational understanding if someone asks me to setup mu...
you usually don't use more than one GPU, since the point is that the GPU itself is massively parallel on the inside, yes?
mint palm
5000 rtx5000 side-by-side
serene scaffold
tbh I've never heard of a model being trained using multiple GPUs in parallel
serene scaffold
my guess is that that's so rarely done that it's not worth looking into unless someone asks you to do it.
wicked grove
Hello, how can i implement a residual link when the tensor sizes dont match
I found a few answers but i cant understand the implementation
cn4 = tf.keras.layers.Add()([r12, r13, r14,r18])```ValueError: Inputs have incompatible shapes. Received shapes (64, 64, 64) and (64, 64, 16)
this is the error
serene scaffold
did you try printing the shapes of r12, r13, etc?
wicked grove
yeah
serene scaffold
what are
wicked grove
c13 = tf.keras.layers.Conv2D(64,3,padding='same',strides=(2,2))(bn3x)
b13 = tf.keras.layers.BatchNormalization()(c13)
r13 = tf.keras.activations.relu(b13)
those aren't the shapes.
wicked grove
i have done the same for r12 and r14
this is the shape of r12
(None, 64, 64, 64)
this is the shape of r18
(None, 64, 64, 16)
wicked grove
wicked grove
```py
cn4 = tf.keras.layers.Add()([r12, r13, r14,r18])```
i cant understand if the way i have implemented the residual link is right
wicked grove
serene scaffold
those aren't the shapes.
I was trying to implement this

 ashen lintel
Hi! Have a rather stupid question, but cannot think of a solution, which wouldn't have me manually managing the window size. I feel like it's an overkill, but correct me if I'm wrong.
So, say, I have a df with 4250 rows and I want to slice it into more manageable pieces of 500 or so (first 500 rows, then 500:1000 etc). Now, I don't want the remainder to be ignored, but rather just turned it into its own piece, despite the smaller size than 500 (e.g., 4000:4250).
What would be the most "pythonic"/elegant way of achieving that?
serene scaffold
ashen lintel
Hi! Have a rather stupid question, but cannot think of a solution, which wouldn'...
split it into chunks, for what purpose?
also, do the rows in each chunk need to be adjacent?
!e
import pandas as pd, numpy as np
df = pd.DataFrame(np.random.random((1234, 2)))
print(1234 / 4)
grouped = df.groupby(df.index % 4)  # make four groups
print(next(iter(grouped)))
 arctic wedgeBOT
@serene scaffold :white_check_mark: Your eval job has completed with return code 0.
001 | 308.5
002 | (0,              0         1
003 | 0     0.421947  0.652238
004 | 4     0.027740  0.918146
005 | 8     0.858377  0.128586
006 | 12    0.057140  0.795169
007 | 16    0.746168  0.388293
008 | ...        ...       ...
009 | 1216  0.333172  0.199419
010 | 1220  0.794829  0.842490
011 | 1224  0.460359  0.421489
... (truncated - too many lines)
Full output: https://paste.pythondiscord.com/fuqererile.txt?noredirect
mint palm
how to test train split when i have multiple input when using functional api
should i first split then devide inputs?
ashen lintel
serene scaffold
split it into chunks, for what purpose?
essentially, i'm plotting the data, but because i have a lot of "actors" aka lines it becomes quiet crowded over longer dfs. so want to plot it in smaller chunks instead
serene scaffold
ashen lintel
essentially, i'm plotting the data, but because i have a lot of "actors" aka lin...
then my solution should work
you can just do grouped = df.groupby(df.index % n) for n groups.
ashen lintel
serene scaffold
also, do the rows in each chunk need to be adjacent?
if i understand you question correctly, then yes
serene scaffold
oh
wicked grove
wicked grove
I was trying to implement this
Can i make the residual links the way i have done it...i dont know if a residual link can be done w different tensors
ashen lintel
actually, can you clarify what you mean?
like, i need first to get the first 500 rows, then the next 500 rows etc
serene scaffold
ashen lintel
actually, can you clarify what you mean?
see how in my result, it gives you every n rows? 0, 4, 8, etc?
 agile cobalt
serene scaffold
you can just do `grouped = df.groupby(df.index % n)` for `n` groups.
agile cobalt
serene scaffold
you can just do `grouped = df.groupby(df.index % n)` for `n` groups.
that would group 1, 5, 9, 13... instead of 1, 2, 3, 4.. for an example of n=4 though
serene scaffold
agile cobalt
that would group `1, 5, 9, 13...` instead of `1, 2, 3, 4..` for an example of `n...
I know
you can do grouped = df.groupby(df.index // n) instead for n groups of adjacent rows. I'd have to think about how to do it by rows-per-group instead of the desired number of groups.
actually

ashen lintel
i was thinking about just controlling the needed indices myself and then just using iloc
but it seemed like an overkill xD
serene scaffold
no, I think grouped = df.groupby(df.index // n) will make the groups have n elements.
ashen lintel
i'll give it a try, thanks for pinpointing me into (hopefully) the right direction!
serene scaffold
so, I guess iterate over df.groupby(df.index // 500) and plot each one
also that iterator will give you a tuple. the second element of the tuple is the df slice.
 fringe knoll
in the wolframappha docs it says
app_id = getfixture('API_key')
client = Client(app_id)
res = client.query('temperature in Washington, DC on October 3, 2012')
but how do i get the top result from that and the "client = Client(app_id)" gives an error for me because "Client" isn't defined
do i need to import wolframalpha or install it or something
oh i do lol
ok i worked it out
 wet wave
I'm getting a weird date when I try to convert int timestamp to reg string format.
Here's the int, 1638829538 and here's how I'm converting it, pd.Timestamp(ts_input=int_timestamp).
This is the result Timestamp('1970-01-01 00:00:01.638829538') but the expected result is 12-06-21. Any suggestions?
serene scaffold
wet wave
I'm getting a weird date when I try to convert int timestamp to reg string forma...
In [17]: pd.Timestamp(1638829538, unit='s')
Out[17]: Timestamp('2021-12-06 22:25:38')
Is it normal that hyper parameter tuning takes hours
MacBook 2015 btw
3 cvs
I left it on in the house I hope it doesn’t set fire
Hot and loud
Bad battery too
tacit basin
Probably. Depends how many hyperparams it needs to evaluate
steady basalt
I’ve give it uhh
Like 6 each with 2-4 possibility
Halving search speeds it up compared to full grid actually
tacit basin
So it's like 18 experiments, each with cross validation?
steady basalt
No less
Let’s just say 7000 total
It was 20000 but I cut it down
7000 will take me 2.5 hours
Normal?
tacit basin
Some libs would take advantage of multiple threads i think, so maybe faster
fringe knoll
guys how in the world do you fix "'pip' is not recognized as an internal or external command,
operable program or batch file."
im gonna re install python
mint palm
does functional api include training different attributes of dataset differently?
tacit basin
fringe knoll
guys how in the world do you fix "'pip' is not recognized as an internal or exte...
windows?
wet wave
serene scaffold
```py
In [17]: pd.Timestamp(1638829538, unit='s')
Out[17]: Timestamp('2021-12-06...
Thanks for the response!
 odd meteor
steady basalt
Guys, having scaled and normalised the liver dataset three times, accuracy only ...
odd meteor
steady basalt
Guys, having scaled and normalised the liver dataset three times, accuracy only ...
Is there any reason why you scaled and normalized your data three times?
serene scaffold
odd meteor
Is there any reason why you scaled and normalized your data three times?
tbh I was wondering about this as well, but I just figured their technique was beyond my comprehension
guess I should stop doubting myself.
odd meteor
I haven't seen it done before, hence my curiosity. I was asking to know if that's a new trick or something.
 timid kiln
Kind of a Statistics question, but I was hoping y'all could help me anyway.
I have a group of 1000 values. The values tend to be grouped around an average. So the first group of numbers might be centered around the value '25', but they're not all equal to 25 of course, and the next distinct group might be centered around 45, the next might be 125, and so on.
I'm not sure what terms to search for to start researching how to calculate how many groups there are and what that average value might be.
Anyone here know?
serene scaffold
timid kiln
Kind of a Statistics question, but I was hoping y'all could help me anyway.
I h...
you can ask statistics questions here as they relate to a DS/AI thing that you're trying to do in Python.
Sounds like you're trying to find local maxima in the distribution curve, or something like that.
timid kiln
OK.
I did manage to just find something that sounds like what I'm looking for:
https://stackoverflow.com/questions/47290732/group-numbers-in-an-array-by-step-value-changes

Stack Overflow
i have an array like [101, 107, 106, 199, 204, 205, 207, 306, 310, 312, 312, 314, 317, 318, 380, 377, 379, 382, 466, 469, 471, 472, 557, 559, 562, 566, 569...]
In this array, after a few integers,...
 lapis sequoia
timid kiln
Kind of a Statistics question, but I was hoping y'all could help me anyway.
I h...
lapis sequoia
timid kiln
Kind of a Statistics question, but I was hoping y'all could help me anyway.
I h...
wow that makes no sense to me
timid kiln
lapis sequoia
wow that makes no sense to me
Groups of numbers that cluster around a mean? Maybe that's a better description.
serene scaffold
timid kiln
Groups of numbers that cluster around a mean? Maybe that's a better description...
it made sense to me
lapis sequoia
timid kiln
Groups of numbers that cluster around a mean? Maybe that's a better description...
hmm but how can you know how many groups there are and their means? I don't think there is enough info to know that.
timid kiln
lapis sequoia
hmm but how can you know how many groups there are and their means? I don't thin...
Well, to implement this I'd have to give the function/calculation a number of groups to start with. Then I could isolate the groups and find the average, stdev, and so forth to determine if they're spread too much.
What "too much" is yet to be determined. I'll have to adjust certain parameter values to get what I'm looking for.
lapis sequoia
timid kiln
Well, to implement this I'd have to give the function/calculation a number of gr...
I can't really understand that, but it sounds very smart. Gl with it!
timid kiln
lapis sequoia
I can't really understand that, but it sounds very smart. Gl with it!
lol awesome.
serene scaffold
@timid kiln do you understand what I mean by finding local maxima in the distribution curve?
timid kiln
Nope! I was going to search for those terms and see what I came up with.
So actually, these are X/Y pairs, I graphed them in Excel:

So you can see how there are two columns that line up good, I did that on my own.
What I want to happen is for x and y, I want things to start to migrate together around averages but not overlap?
timid kiln
timid kiln
So you can see how there are two columns that line up good, I did that on my own...
(Meaning, I changed the x and y values manually)
Honestly, I could do this in Excel or I could do this in python. Either is fine. I know Excel much, much better.
tacit basin
timid kiln
Kind of a Statistics question, but I was hoping y'all could help me anyway.
I h...
kmeans or kmedoids
 desert oar
what are the constraints here @timid kiln do you know the number of clusters/groups in advance? is that big clump on the right a cluster, or "not a cluster"?
i would suggest against k-anything because those tend to find "round" equal-sized clusters, unless you can find a good vector embedding for this data
tacit basin
desert oar
i would suggest _against_ k-anything because those tend to find "round" equal-si...
you can run a number of k-something from 2 to 100 or more and find out which one works best
desert oar
tacit basin
you can run a number of k-something from 2 to 100 or more and find out which one...
sure, but i doubt that you will ever get good results on "linear" clusters like this, unless you can embed the data into a different space where those clusters are more "round" or "blob"-like
timid kiln
desert oar
what are the constraints here <@!434042443868930053> do you know the number of c...
Well, visually what I'm seeing is not much clustering. So I want to start to force clustering. What this is doing is it's going to take these x/y coordinates and adjust some objects I have in a pipeline modeling program. So this is going to help me with that software.
Well I'm happy with the vertical clusters. Those are good.
So I'll start to push things left, right, up, down, to adjust things in a more linear fashion which will make them easier to work with in the software.
I was thinking maybe of calculating the average of the entire 'x' group, and then looking at standard deviation.
desert oar
is this meant to be animated?
desert oar
are the other clusters at pre-defined point on the X axis? do you want to segment the un-clustered stuff into a fixed number of clusters?
yes, an example result would be helpful
timid kiln

SO that's what I'm looking at.
Python allows me to get an x and y value for all the gray dots.
I can move all those dots around manually, which is how I got things started, but then I pulled the x/y values into Excel and started looking for patterns to try to line things up so they are a bit easier to deal with.
It's interesting (and patently obvious now) that the x/y graph in Excel looks a lot like what I'm seeing in the software.
So, I want to start pushing all those gray dots around so they start to line up a bit better.
I see why you guys are suggesting that it would be necessary to have an idea of how many groups there's going to be.
This conversation has been quite helpful, actually. I appreciate you all!
desert oar
timid kiln
So, I want to start pushing all those gray dots around so they start to line up ...
hm, i think doing this by looking at the scatterplot of x/y coordinates is backwards
it sounds like you want to straighten out all these connected segments as much as possible
if so, i would focus directly on that task
maybe you can come up with some heuristic in terms of the scatterplot of coordinates
timid kiln
desert oar
it sounds like you want to straighten out all these connected segments as much a...
That's the end result of what I want to do.
So what's the best method of pushing those dots around so they end up lining up better? That's what I have to figure out.
desert oar
i see. maybe you need to define "lining up" mathematically somehow
timid kiln
Yeah. That's the "fuzzy" part.
desert oar
because if you move around points on the scatterplot, there's no guarantee that those points are actually connected to each other
timid kiln
It would help if I adjusted the objects a bit but I'm kind of wanting math to do that for me.
desert oar
now another possibility is to use the connected sections as pre-defined clusters
timid kiln
desert oar
because if you move around points on the scatterplot, there's no guarantee that ...
EXACTLY, and that's the hard part.
timid kiln
desert oar
now another possibility is to use the connected sections as pre-defined clusters
YES YES YES you are a genius.
desert oar
then you can try grouping the pre-defined clusters around their mean x value
timid kiln
You've caught on VERY quickly.
desert oar
the other challenge is to make sure that they are contiguous within that cluster
timid kiln
The next problem is how to do this via python because that's the scripting language used by this software.
desert oar
you have to assign some kind of ordering to the points
meh, that's easy
writing all this out as an unambiguous algorithm is the challenge
translating the algorithm from pseudocode & bullet points to python is not going to be the hard part
timid kiln
So I started by trying to build a dictionary of all the gray dots, called Junctions. I can get a dictionary that tells me the name of the Junction and what it's connected to.
desert oar
i have a feeling you can also do stuff like looking at the angles between line segments
minimize the sum of the angles across the segment, something like that
that said: what's stopping you from just making them all a perfectly straight line?
timid kiln
But all Junctions are connected to Flowlines. So I need to 1: find a junction attached to one Flowline, then get the name of the Junction attached to the other end of that Flowline.
desert oar
there must be some constraints on how you can move the points
timid kiln
I could make them all a straight line except for the fact that some of the lines would then be lying on top of each other. As you can see, some Junctions are connected to three or four Flowlines.
desert oar
timid kiln
I could make them all a straight line except for the fact that some of the lines...
so you can't have the flow lines overlap?
steady basalt
odd meteor
Is there any reason why you scaled and normalized your data three times?
Testing min max scaler, standard scaler, and normalise
Seeing if maybe one gives a boost
Answer is: 2.2% boost to KNN
But RF it’s -0.3%
RF doesn’t really need it but it’s annoying that it goes down
desert oar
steady basalt
But RF it’s -0.3%
0.3% seems like noise
steady basalt
Yeah but if it’s Down, shudnt I just not scale
timid kiln
desert oar
so you can't have the flow lines overlap?
Well, this view of the model is for ease of use. If the lines overlap I have to drag the topmost line out of the way to work with the line underneath.
steady basalt
For that model
At least and keep a scaled model being knn only
It’s still losing accuracy so..
iron basalt
timid kiln
Is this the input or the output? I thought you were trying to cluster points. Why are you moving points around? For testing?
timid kiln
iron basalt
Is this the input or the output? I thought you were trying to cluster points. Wh...
So what you're looking at is a software program called PIPESIM. That particular view of the objects within the software is difficult to use. I want to move the gray dots, thus moving the lines, around so everything lines up better. So my question was based on me thinking that, hey, if there's a bunch of gray dots that are near a value of "25", make them all "25". And so on.
But I don't want things to overlap. so there's that.
iron basalt
timid kiln
So what you're looking at is a software program called PIPESIM. That particular...
So you are trying to organize these components of this graph?
timid kiln
iron basalt
So you are trying to organize these components of this graph?
I think that's a very good way of explaining it.
The caveat is that I cannot make the gray lines overlap nor cross.
So part of what I'll need to do is find groups of connected objects. That's a bit of a struggle for me to do in python as I don't know if I should work with a list, or a dictionary, or what.
iron basalt
timid kiln
I think that's a very good way of explaining it.
For each component, do the points need to keep the same distance from each other within that component when that component is moved around?
In others words, can you deform the component however you want? Or is it rigid?
timid kiln
iron basalt
For each component, do the points need to keep the same distance from each other...
It would be nice to keep distances consistent to ensure it's easy to use. If the distances between objects gets to small, you can't click on them. You end up clicking on something nearby.
The lines are straight, always.
They are attached to the gray dots. Move a dot, the line moves with it.
Dots = Junctions
Lines = Pipelines
iron basalt
I meant if you are allowed to do this to a component when moving it around to organize the components.

Or does it need to remain a "V" shape in that case?
timid kiln
It can be a straight line. That's not a problem. But eventually I might run out of screen to be able to view and work with these things.
Actually in Excel I'm just pushing the values back and forth using CEILING. But it would be a lot more fun to do this in python using some brainpower.
desert oar
so it seems like you are just moving these around to make them visually easier to work with, and that's it?
timid kiln
Yes
Sorry if that seems... silly. I use this software a LOT and having to move these darn things around is a huge waste of time...
desert oar
you can try the igraph library, maybe they have some nice graph layout algorithm for this
iron basalt
Is each component a tree / is this graph a forest?
desert oar
there's also the old classic graphviz DOT algorithm
timid kiln
iron basalt
Is each component a tree / is this graph a forest?
I'm not sure how to answer that?
The gray lines are pipelines, and they connect to each other via the gray dots which are junctions. Some folks call them 'nodes' as well.
The gridlines are arbitrary. They're just there.
iron basalt
timid kiln
I'm not sure how to answer that?
Can a component contain a cycle (trees are graphs with no cycles).
timid kiln
iron basalt
Can a component contain a cycle (trees are graphs with no cycles).
I apologize. What is a cycle?
This isn't a graph
iron basalt
A connects to B, B connects to C, C connects to A. - cycle
timid kiln
I posted a graph but it was just the coordinates of the Junctions, the gray dots.
Ahhh
I mean, yeah, each of those things has a Name. The Junctions and Pipelines are all named Components.
You can name them whatever you want. J 1 connects to pipeline Pipe1 which then connects to J 2.
iron basalt
If they contain cycles straightening them becomes more difficult.
Is this a valid transformation that would be allowed?
 timid kiln
Yep, that's valid.
I can push them around however I want.
Just so it's visually easy to work with.
That's the end result. Move these things around so it's easier to work with within the software.
I'm kind of iterating through it via Excel but there's definitely a pattern to what I'm doing.
Basically use Ceiling to push all x's towards a certain value, and then all y's towards a certain value, check the graph for junctions (gray dots) that are encroaching.
It would be a lot better if I could isolate things into groups by themselves.
But, I don't know how to work with groups like this in python???
Like, do I use a dictionary, or a set, or a nested dictionary, I just don't know.
 mild dirge
or classes 👀
timid kiln
I mean, I'm here with my hat in hand hoping someone might have a clue as to how best to set this up.
iron basalt
Ok, so step 1, take each component and straighten it and compute its axis-aligned bounding box. Step 2, Move these components around such that no bounding boxes intersect and the axis-aligned bounding box of all of the axis-aligned bounding boxes together has minimum area.
timid kiln
Honestly, the math part of this is simple. It's the iterative process of putting the groups together, and then parsing through them over and over to move them into independent areas.
iron basalt
Step 2 is an optimization problem.
timid kiln
OK, so here is the dead-stupid simple question I have... how to I make the group?
I have a function that will tell me, given the name of an object in the software, what is connected to it.
misty flint
if your specialty is A/B testing https://engineering.atspotify.com/2022/03/comparing-quantiles-at-scale-in-online-a-b-testing/

Spotify Engineering
TL;DR: Using the properties of the Poisson bootstrap algorithm and quantile estimators, we have been able to reduce the computational complexity of Poisson bootstrap difference-in-quantiles confidence intervals enough to unlock bootstrap inference for almost arbitrary large samples. At Spotify, we c
more computationally efficient algo
timid kiln
So how do I group that information?
What I made yesterday might not be very "good". Let me get the output here...
iron basalt
timid kiln
So how do I group that information?
You make trees as you would any tree in Python for whatever algorithm (again, assuming each component is a tree / has no cycles (equivalent / def of tree)).
timid kiln
{'J': {'No. Conns': 3, 'Conn List': ['6_SDR11_232', '14_SDR17_610', 'SC 27-32']
So this is what this means, there's a gray dot, junction, named 'J". It has 3 connections. It's connected to 6_SDR11_232, 14_SDR17_610, and SC 27-32.
So then I need to find out what those three things are connected to. And so on, and so on. When I run into something that's only connected to one thing, that's the end of a pipeline.
So... I'm going to google "make a tree in python". Will that help me get started on this?
iron basalt
Or just make a giant adjacency matrix to start and do something else later.
timid kiln
But I could just as easily make a table of values:
J 3 [conn1, conn2, conn3]
I'm not good with dictionaries. They're kind of annoying lol.
So terms I'm noting at the moment:
• adjacency matrix
• trees in python
iron basalt
In graph theory and computer science, an adjacency matrix is a square matrix used to represent a finite graph. The elements of the matrix indicate whether pairs of vertices are adjacent or not in the graph.
In the special case of a finite simple graph, the adjacency matrix is a (0,1)-matrix with zeros on its diagonal. If the graph is undirected ...
serene scaffold
timid kiln
But I could just as easily make a table of values:
```py
J 3 [conn1, conn2, con...
I'm not good with dictionaries. They're kind of annoying lol.
on the flip side, I can't really imagine how dictionaries could be more straightforward for what they're supposed to do
iron basalt
This is starting to become more of a standard computer science question at this point, you can ask for help on how to represent graphs (and more specifically trees if there are no cycles) (data structures) in #algos-and-data-structs
timid kiln
Oh hey, I need to go (at work at the moment) but I'll pop back in later with more questions. Thanks @iron basalt and @desert oar and @tacit basin !
timid kiln
serene scaffold
> I'm not good with dictionaries. They're kind of annoying lol.
on the flip sid...
I am so used to working with tables that the structure of a dictionary, I think visually, is just different enough to throw me off. I fully acknowledge this is an issue with my ignorance and a lack of familiarity. 🙂
iron basalt
A bit of graph theory terminology would help you. Look up some of that, just the basic ideas.
iron basalt
*Graphs in graph theory refer to vertices and edges between them, not plots, like of y = mx + b.
It's about what is connected to what and information associated with that (and overall structure).
 iron basalt
Graphs are the most essential thing in all of programming (to visualize / conceptualize / organize stuff in software). Since pretty much every algorithm can be represented by one and pretty much all data structures too (in a way that allows one to quickly see the complexity of the problem and general approach quickly).
 gleaming finch

WHY is there not a SINGLE comma in those lists
I. DO. NOT. UNDERSTAND.
I'M CRYING
agile cobalt
looks like a numpy array?
gleaming finch
agile cobalt
looks like a numpy array?
OOOHHHHHH
MAKES SO MUCH SENSE
THATS WHY ITS SO WEIRD
im using matplotlib
 arctic crown
like 1d,2d,3d
arctic crown
arctic crown
like 1d,2d,3d
where are the dimensions used?
agile cobalt
arctic crown
can someone please explain numpy arrays
!e ```py
import numpy as np
for dimensions in [(8), (4, 2), (2, 4), (2, 2, 2)]:
print(dimensions)
print(np.array(np.arange(8)).reshape(dimensions), end="\n\n")
@agile cobalt :white_check_mark: Your eval job has completed with return code 0.
001 | 8
002 | [0 1 2 3 4 5 6 7]
003 |
004 | (4, 2)
005 | [[0 1]
006 |  [2 3]
007 |  [4 5]
008 |  [6 7]]
009 |
010 | (2, 4)
011 | [[0 1 2 3]
... (truncated - too many lines)
Full output: https://paste.pythondiscord.com/gizaxojuku.txt?noredirect
arctic crown
agile cobalt
!e ```py
import numpy as np
for dimensions in [(8), (4, 2), (2, 4), (2, 2, 2)]:
...
no like where are the dimensions used?
agile cobalt
you see how the first one is just a list with 8 elements? that's an 1d array
the second and third are 2x4 and 4x2, both of them are 2d
the last is 2x2x2, 3 dimensions
arctic crown
but do the dimensions have any use? or do we just say it
misty flint
yes they have use
arctic crown
misty flint
yes they have use
which is?
iron basalt
arctic crown
but do the dimensions have any use? or do we just say it
How would you represent a 2D grid? For example, the values for tic-tac-toe.
misty flint
how are you supposed to represent higher dimensions otherwise
theres a reason why its called tensorflow

insert mini-lesson about linear algebra
arctic crown
iron basalt
How would you represent a 2D grid? For example, the values for tic-tac-toe.
ah so these dimencions are used to plot data on graph
thats what i was confused about
ty
arctic crown
not if you are a begginer
iron basalt
arctic crown
ah so these dimencions are used to plot data on graph
Not exactly, try programming tic-tac-toe in Python.
arctic crown
iron basalt
Not exactly, try programming tic-tac-toe in Python.
hmm and then?
 wintry kettle
iron basalt
Not exactly, try programming tic-tac-toe in Python.
wintry kettle
iron basalt
Not exactly, try programming tic-tac-toe in Python.
ez
iron basalt
arctic crown
hmm and then?
Then add to ability to select what board size you want before it starts.
arctic crown
iron basalt
Then add to ability to select what board size you want before it starts.
i understand what dimencions are i just didnt know what they are used for in numpy
iron basalt
arctic crown
i understand what dimencions are i just didnt know what they are used for in num...
Give me some Python code right here that represents one specific board state of tic-tac-toe. Just plain old Python.
steady basalt
Alright guys the tunings almost finished
serene scaffold
 gaunt hedge
i want to start learning AI building techniques, where should i start?
gaunt hedge
i want to start learning AI building techniques, where should i start?
k nearest neighbors
misty flint
serene scaffold
misty flint
<:kekHands:948697940711587900>
well, I wasn't going to suggest BERT for where to start.
misty flint
speaking of BERT
i recently found out about ClinicalBERT
which im going to test for some stuff at work
alongside BioBERT probably
its interesting bc the lead author of the GPT-3 paper said some things that made me think BERT models might work better for our use case
she spoke on a podcast i heard recently and it was very interesting
highly recommend for commutes/down time/etc.
Listen to this episode from Super Data Science on Spotify. Natural language processing expert and PhD student Melanie Subbiah sits down with Jon Krohn to discuss GPT-3, its strengths and weaknesses, and the future of NLP.In this episode you will learn:• What is GPT-3? [6:24]• The strengths and weaknesses of GPT-3 [14:38]• What is autoregression?...
serene scaffold
@misty flint I finished scibert: https://github.com/allenai/scibert

GitHub
A BERT model for scientific text. Contribute to allenai/scibert development by creating an account on GitHub.
misty flint
she also spoke about the future of NLP
serene scaffold
if anyone else commits to scibert, you don't wanna find out what will happen.
serene scaffold
it has correct type hinting as of June 14, 2020.
next phoenix
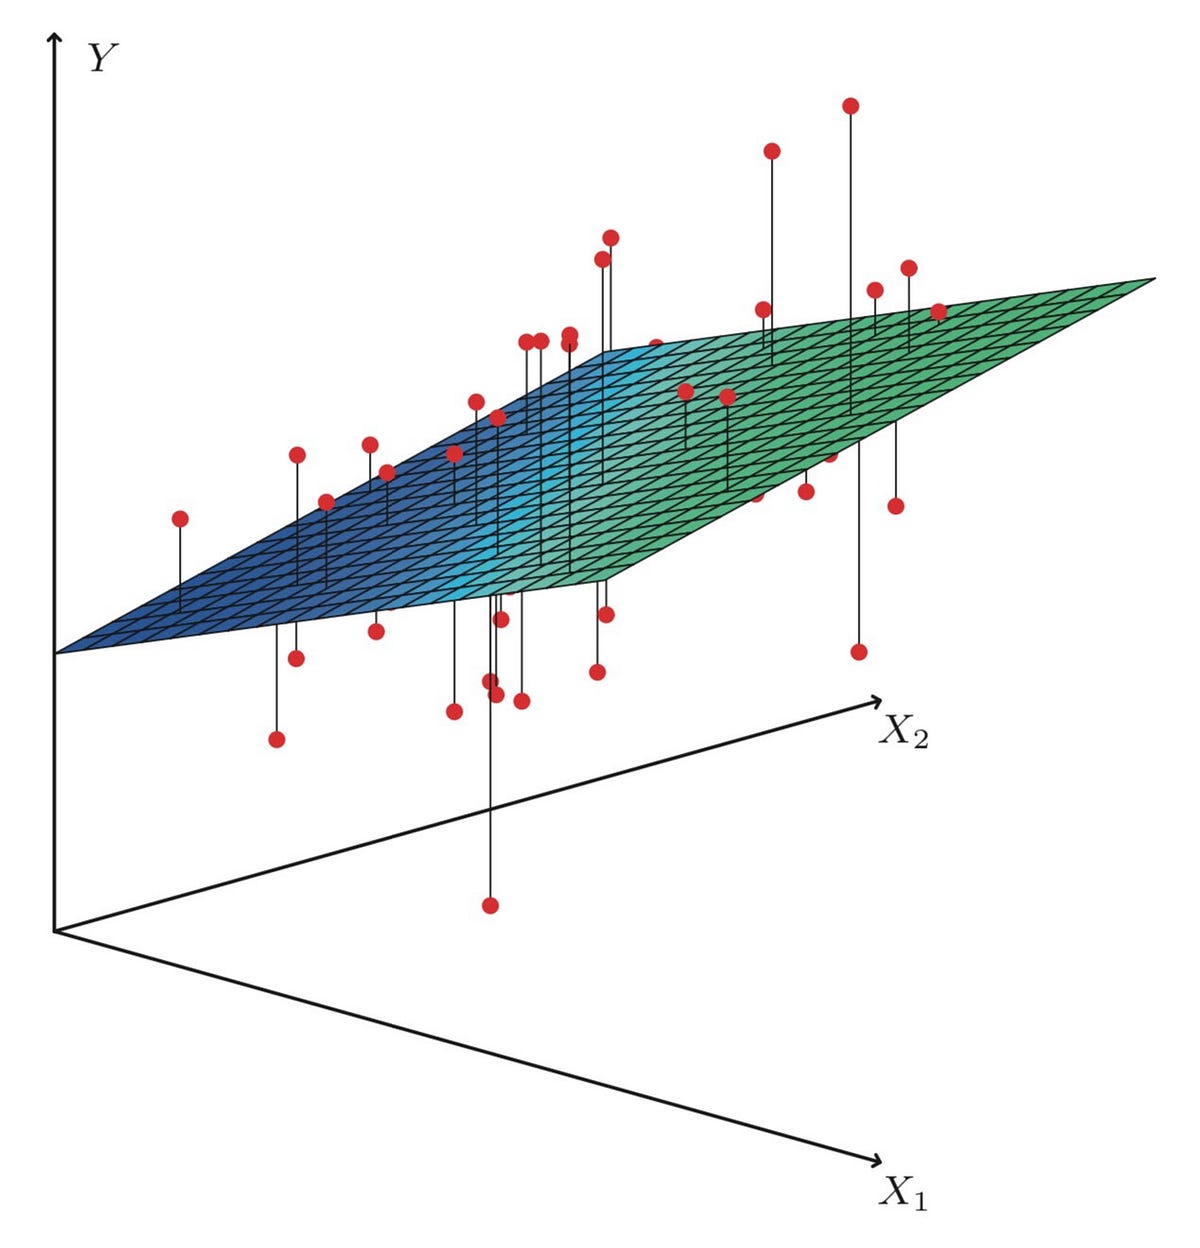
Found this. Simple Linear Regression, Multi Linear Regression, Polynomial Regression covered in detail : https://medium.datadriveninvestor.com/day-14-60-days-of-data-science-and-machine-learning-7486395061b
 iron basalt
gaunt hedge
i want to start learning AI building techniques, where should i start?
iron basalt
gaunt hedge
i want to start learning AI building techniques, where should i start?

MIT 6.034 Artificial Intelligence, Fall 2010
View the complete course: http://ocw.mit.edu/6-034F10
Instructor: Patrick Winston
In this lecture, Prof. Winston introduces artificial intelligence and provides a brief history of the field. The last ten minutes are devoted to information about the course at MIT.
License: Creative Commons BY-NC-SA
...
Then you want to learn some statistics and some machine learning (and artificial neural networks) (covered a bit in that course). And linear algebra and calculus will be needed.
Beyond that, the sky is the limit (unless you plan on putting an AI on a satellite).
serene scaffold
 plucky willow
does anyone have a tensorflow k means example
plucky willow
does anyone have a tensorflow k means example
Tensorflow is for neural networks and k means isn't that.
Is your goal just to understand how kmeans works?
plucky willow
i am working with a mentor to learn the basics of ml and we have been using tensorflow for everything so far
he told me to try and make a k-means project or apply k-means on some data he gave me
but idk how to start so i was wanting to look at an example
i understand the basic concept, but idk how to implement it
plucky willow
serene scaffold
Tensorflow is for neural networks and k means isn't that.
what should i do?
misty flint
plucky willow
he told me to try and make a k-means project or apply k-means on some data he ga...
look into scikit-learn
 lone drum
hello i am working with dash my code here https://paste.pythondiscord.com/yewonepepu i am getting error which i tried to search on SO but not able to solve my error here https://paste.pythondiscord.com/oyuwexefec can anyone guide me in this ping me when u reply
next phoenix
Found this : How To Choose Right Data Visualization Charts For Your Data?
https://medium.com/coders-mojo/how-to-choose-right-data-visualization-charts-for-your-data-f4dd49061aea?sk=7015ece56ed3f68f9b857d535e6b8c16

Medium
A crash course on practical Data Visualization …( Part 1)
tacit basin
lapis sequoia
can someone who knows how to use pandas quickly help me
What's your problem
lapis sequoia
so i got a column with numeric values
i want them ranked
currently the column is the mean price of grouped zipcodes
i want a column that is the zipcode ranking basically
mean price of grouped zip codes*
tacit basin
Can you show your input and expected output?
lapis sequoia
 tacit basin
What you want as output can you show?
lapis sequoia
Why are they overlapping. It's only this one instance. I have plotted 10 of them

At last it has an empty axis ploy too. Which I didn't want
maiden pelican
In bp neural network how to train the network and give it fresh input without output ?
lone drum
hello i am working with dash app for making dashboard. previously my code was working but now i am getting error loading layout can anyone help me in this? my code here https://paste.pythondiscord.com/lupiqequwu ping me when reply
lapis sequoia
What is latent_dim in seq2seq?
steady basalt
plucky willow
i am working with a mentor to learn the basics of ml and we have been using tens...
Probably should start on non neural network supervised models
Try logistic regression lol
K means is like
The unsupervised version of knn
So unless you’ve learnt how basic methods work, ur mentors an idiot
Is ur data not labelled
 orchid kayak
I have a previous keras model which I saved and now want to load. is there a way I can check some of the parameters of the model? such as the accuracy, loss, and epochs
mint palm
inp_1 = keras.layers.Input(shape=(16,), name="in1")
    inp_2 = keras.layers.Input(shape=(16,), name="in2")

    in_1 = layers.Dense(16, activation=keras.layers.LeakyReLU(alpha=0.1))(inp_1)
    in_1 = layers.Dense(14, activation=keras.layers.LeakyReLU(alpha=0.1))(in_1)
    in_1 = layers.Dense(12, activation=keras.layers.LeakyReLU(alpha=0.1))(in_1)
    in_1 = layers.Dense(10, activation=keras.layers.LeakyReLU(alpha=0.1))(in_1)
    in_1 = layers.Dense(8, activation=keras.layers.LeakyReLU(alpha=0.1))(in_1)
    in_1 = layers.Dense(6, activation=keras.layers.LeakyReLU(alpha=0.1))(in_1)

    in_2 = layers.Dense(16, activation=keras.layers.LeakyReLU(alpha=0.1))(inp_2)
    in_2 = BatchNormalization()(in_2)
    in_2 = layers.Dense(8, activation=keras.layers.LeakyReLU(alpha=0.1))(in_2)
    in_2 = BatchNormalization()(in_2)
    in_2 = layers.Dense(4, activation=keras.layers.LeakyReLU(alpha=0.1))(in_2)
    in_2 = BatchNormalization()(in_2)

    x = layers.concatenate([in_1, in_2])
    out_ = layers.Dense(5, activation=keras.layers.LeakyReLU(alpha=0.1), name="prediction")(x)
    out_ = layers.Dense(3, activation='tanh')(out_)
    out_ = layers.Dense(3, activation='softmax')(out_)

    model = tf.keras.Model(
        inputs=[inp_1, inp_2],
        outputs=out_
    )
    tf.keras.utils.plot_model(model, "functionalAPI.png", show_shapes=True)

    model.compile(
        optimizer=tf.keras.optimizers.Adam(0.0001),
        loss={"prediction": 'categorical_crossentropy'},
        metrics=["accuracy"]
    )

    model.fit({"in1": X_train, "in2": X_train}, {"prediction": Y_train},
              epochs=28,
              batch_size=32,
              validation_split=0.04
              )
'Found unexpected losses or metrics that do not correspond '

    ValueError: Found unexpected losses or metrics that do not correspond to any Model output: dict_keys(['prediction']). Valid mode output names: ['dense_10']. Received struct is: {'prediction': <tf.Tensor 'IteratorGetNext:2' shape=(None, 3) dtype=float32>}.
 urban lance
What are some automatic data labeling techniques for unlabeled datasets (other than clustering)
 upper spindle
could anyone help me at @help-bagel
does anyone know how to rename the first column as date

and re index it
serene scaffold
upper spindle
does anyone know how to rename the first column as date
that column is actually the index, so you can do df.index.name = 'date'
serene scaffold
upper spindle
it worked, thank you
you are welcome 💚
desert oar
upper spindle
it worked, thank you
just so you know in the future, the index is the array of row labels
learning to work with indexes can be very useful
upper spindle
desert oar
just so you know in the future, the index is the array of _row labels_
thanks for that
how would i sort the dates, cos when i plot the std, the plotted dates arent in order
 desert oar
upper spindle
how would i sort the dates, cos when i plot the std, the plotted dates arent in ...
desert oar
upper spindle
how would i sort the dates, cos when i plot the std, the plotted dates arent in ...
!d pandas.DataFrame.sort_index
arctic wedgeBOT
DataFrame.sort_index(axis=0, level=None, ascending=True, inplace=False, kind='quicksort', na_position='last', sort_remaining=True, ignore_index=False, key=None)```
Sort object by labels (along an axis).

Returns a new DataFrame sorted by label if inplace argument is `False`, otherwise updates the original DataFrame and returns None.and nobody knows about this? 😅
upper spindle
desert oar
!d pandas.DataFrame.sort_index
thanks
serene scaffold
urban lance
What are some automatic data labeling techniques for unlabeled datasets (other t...
I suspect that there aren't very many. All of the unsupervised classification algorithms that come to mind are some form of clustering.
urban lance
serene scaffold
I suspect that there aren't very many. All of the unsupervised classification al...
I've been having trouble for weeks now
trying to label data by means of clustering but the values of the formed clusters aren't substantially different
desert oar
urban lance
trying to label data by means of clustering but the values of the formed cluster...
do you know for a fact that the data points actually have different labels? can you describe the real-world task you are trying to complete?
tacit basin
urban lance
trying to label data by means of clustering but the values of the formed cluster...
Maybe you can hand label some data. Train a model using transfer learning on these. Then use this model to label the rest of the dataset and repeat.
steady basalt
Anyone know why KNN and RF are getting both 0.741 score on my test set
Shudnt they do differently
urban lance
desert oar
do you know for a fact that the data points actually have different labels? can ...
Well yea they are sorted in different clusters (I'm adding a feature 'cluster' to the data) the value each row gets is the cluster they've been classified in.
I'm trying to label data to predict the stage of the customer journey in which a customer is
desert oar
urban lance
Well yea they are sorted in different clusters (I'm adding a feature 'cluster' t...
but you don't know the actual customer journey stage? what features do you have? what exactly is each data point, a single customer, a customer at a specific point in time, etc?
it seems like you're trying to solve the wrong problem. there's no guarantee that any particular set of features is predictive for any particular label
that is, there is no guarantee that your labels are cleanly segmented in the feature space. if they aren't, then there's pretty much no hope of inferring them from those features
steady basalt
@tacit basin do u wana help me with my homework
misty flint
serene scaffold
that column is actually the index, so you can do `df.index.name = 'date'`
when data dont have indices
tacit basin
steady basalt
<@!490342783572246538> do u wana help me with my homework
What's your homework?
steady basalt
Basic ML stuff
But I’m confused how to CV properly and why it’s even important in this task
A few other issues such as parameter tuning is not improving score
And also test scores being the same across both models
And also feature selection reducing score for random forest
Even logistic regression is getting the exact same score
I’m confused
misty flint

misty flint
steady basalt
A few other issues such as parameter tuning is not improving score
this happens almost every time tbh
steady basalt
misty flint
this happens almost every time tbh
Lol scaling reduced score
urban lance
desert oar
but you don't know the actual customer journey stage? what features _do_ you hav...
I don't know the actually customer journey stage (nor how many there are)
These are supposed to be defined by me (after I have found the distinct amount of clusters)
Each data point is 1 month of actions by a user on a website
the features I'm using are:
- User ID
-
Website visits within interval
- min & max tstamps of interval
-
page 1 was looked at
...
-
page 5 was looked at
- a score (0-1) dependent on the amount of search params a user has given within said month
- distinct products viewed (within interval)
- ambiguous products viewed (within interval)
-
days the website was visited (within interval)
- Days since last product view
misty flint
steady basalt
Lol scaling reduced score
"let me try this" score goes down
"what about this" score goes even lower
steady basalt
I left a 2 hour tuning which did not increase score
Btw why do people use CV function to find performance on training data instead of train test split and score testing
Is it more honest result
The thing is I have 3 seperate classifiers all scoring the EXACT same for clf.score on test
Anyone know why this can be
lapis sequoia
can someone help me on how can I do this right


I tried 2 ways
Plt.figure gives 2 of my figures overlapped. Rest are good
And plt.subplot gives only 9 very small plots with last one replaced by some axes
steady basalt
Are you plotting a loop
lapis sequoia
Yes
steady basalt
I think that’s why
steady basalt
It’s probably a bad way to do it
steady basalt
Instead of pie chart try bars? 3 bars per bar
So there’s 10 groups and each has 3 colours
Sns count plot?
I’d had a hue function
lapis sequoia
steady basalt
Sns count plot?
I have been struggling with the use of these plotting libraries lately.
I need to watch some videos.
steady basalt
It’s still good to use one plot instead of 10 if possible
So u can compare directly
lapis sequoia
I will, after I get good 😅
steady basalt
That’s why sns count plot would work for you
It’s easy to use compared to matplot
Ud have to convert to percentages first tho
desert oar
urban lance
I don't know the actually customer journey stage (nor how many there are)
These ...
i see. have you discussed this with the business people? you'd probably be better off defining "customer journey" in terms of concepts, rather than cutoffs in some data points.
maybe if there are natural clusters in the data, you can use those to suggest some journey stages
but i wouldn't expect to be able to just slap some clusters on the data and call it a day
i would spend your energy understanding the business problem and discussing this at a conceptual level w/ the business people
consider whether the journey is a linear journey or not
steady basalt
As you can see both have same score is this possible
 desert oar
are these really stages in a linear journey? or are you interested more generally in customer archetypes? if it is a linear journey, that probably should inform your work, since a user in Stage 4 must necessarily also be in Stages 1-3. so it actually will never really work as a classification problem
 young narwhal
Hello there, I need to execute a procedure to count, sum and summarize the data in the rows of a Pandas dataframe (similar to the apply function but without modifying).
It is a little convoluted (because it needs to take into acount combination of rows, repetition and values of another columns) so I think groupby is not suitable.
I know that using the (not recommended) bad practice of "iterate/for loop the dataframe with the custom function" solves it, but I want to know which would be the most efficient way of doing this task.
agile cobalt
apply() does not modifies the dataframe itself, it creates a new one
there are some functions for that though, like df.describe
!d pandas.DataFrame.describe
arctic wedgeBOT
DataFrame.describe(percentiles=None, include=None, exclude=None, datetime_is_numeric=False)```
Generate descriptive statistics.

Descriptive statistics include those that summarize the central tendency, dispersion and shape of a dataset’s distribution, excluding `NaN` values.

Analyzes both numeric and object series, as well as `DataFrame` column sets of mixed data types. The output will vary depending on what is provided. Refer to the notes below for more detail.sometimes you have to write a loop 🤷♂️ otherwise you can try to write your own BaseIndexer for use with .rolling, but i've never managed to get that to works. the docs are sparse and the standard BaseIndexer implementations were too complicated for me to understand how to use it
young narwhal
I guess I would have to iterate then. Would try to optimize the number of rows at least. Thanks
prisma mist
endless deprecates
 agile cobalt
it'd be great if it included which line of the code is causing the warning
mint palm
when it comes to deciding architecture for in functional api, it branching and concatenating involve rng or is their any rule of thumb involved?
lapis sequoia
is it possible to regenerate or recreate a graph in matplotlib?
there's a graph in a book that I need to insert in my paper, but the image is very ugly since the book is old and doesn't seem to have a copy aside from the physical one that I have
but I don't have the data to generate it
serene scaffold
lapis sequoia
is it possible to regenerate or recreate a graph in matplotlib?
in computer science, "graph" refers to nodes and edges.
You can't really change a plot if you don't have the underlying data it represents.
lapis sequoia
serene scaffold
in computer science, "graph" refers to nodes and edges.
You can't really change...
so no way I can like recreate it?
serene scaffold
lapis sequoia
so no way I can like recreate it?
in this case, it sounds like your options are to create psuedodata that would result in a similar-looking plot, or to use a different tool.
lapis sequoia
serene scaffold
in this case, it sounds like your options are to create psuedodata that would re...
yeah as I thought, thanks!
prisma mist
lapis sequoia
is it possible to regenerate or recreate a graph in matplotlib?
not using matplotlib .. but you might be able to use pytesseract-ocr to read any data points i dunno 🤷♂️.. although if the image quality is bad it won't be much help
 proper swift
Q - What's the best way of replacing multiple values in a pandas column, based on around 50 different combinations of whether co1 == some val, and col2 == some value?
I.e. replace value in col3 - if col 1 == 'some_val', and col 2 == 'some_val'
lapis sequoia
prisma mist
not using matplotlib .. but you might be able to use pytesseract-ocr to read any...
I'll look into this one. Thanks a lot for suggesetion!
serene scaffold
proper swift
Q - What's the best way of replacing multiple values in a pandas column, based o...
so there are 50 possible cases? if you can make an additional column that indicates which case a given row belongs to, and have a dict of case -> replacement values, you can use the .replace method
proper swift
serene scaffold
so there are 50 possible cases? if you can make an additional column that indica...
yeah in my real datset there are around 50 different combinations - i've posted an example here https://discord.com/channels/@me/698594187439898761/956964368526999562
serene scaffold
proper swift
yeah in my real datset there are around 50 different combinations - i've posted ...
idk where that message is, but I can't go there.
prisma mist
proper swift
Q - What's the best way of replacing multiple values in a pandas column, based o...
or an additional column which returns True if the conditions are met... maybe using a lambda function
proper swift
serene scaffold
idk where that message is, but I can't go there.
https://discord.com/channels/267624335836053506/ 776184243570475048/956966697829548082 can you view this channel? - #help-honey
Discord
Discord is the easiest way to communicate over voice, video, and text. Chat, hang out, and stay close with your friends and communities.
desert oar
agile cobalt
it'd be great if it included which line of the code is causing the warning
you can run python with -Werror to turn warnings into errors, so you can get a full traceback
but yeah it would be really nice if you could tell python to format warnings with a traceback
prisma mist
why?


 lapis sequoia
 stuck schooner
stuck schooner
stuck schooner
I'm confused
hue should be a vector or key from data which would tell palette how to apply itself
i don't have data argument
I just want a simple color on the only feature I'm plotting
If I don't use hue palette doesn't apply
lapis sequoia
good point, I searched for sns.scatterplot, but it doesn't have the c parameter in the docs I found. Maybe they changed it up
stuck schooner
Just found out 'color' parameter from MatplotLib work in Seaborn
lapis sequoia
does that mean it works now ?
stuck schooner
Yes it does 🙂
lapis sequoia
ah cool I also found this, but it's probably not quite right for your case:
a = np.array([[ 1, 2, 3, 4, 5, 6, 7, 8 ],
              [ 1, 4, 8, 14, 12, 7, 3, 2 ]])

categories = np.array([0, 0, 0, 0, 0, 0, 0, 0])

colormap = np.array(['r'])

plt.scatter(a[0], a[1], s=100, c=colormap[categories])

plt.savefig('ScatterClassPlot.png')
#Show the map of all red dots
plt.show()
It should work but it's overkill for simple color mapping and every example I found was based on hue / categorical coloring and I was getting mad about it
lapis sequoia
yes very true
 flat hollow
I have a windows laptop for my uni work and it's giving me a headache trying to get Spyder to work on it. A completely fresh reinstall of anaconda seems to make it work, but this morning I've updated navigator and pretty much anytime I update anything in my venv with the Spyder in it and launch Spyder it gets stuck on "Loading Breakpoints", just before it gets stuck I see 2 command prompt-like windows flash on the taskbar and nothing happens after that. When I ran it with debug settings it said something about connecting to some server. Anyone has had similar issues? Have you managed to resolve it? I am too used to the variable explorer and VSCode just isn't doing it for me 😦
prisma mist
flat hollow
I have a windows laptop for my uni work and it's giving me a headache trying to ...
i've never used spyder but when anaconda was giving me problems i found that using miniconda was much better .. didn't take up as much space and installed exactly what i wanted .. no unnecessary bloat
flat hollow
My personal laptop is a macbook and spyder is working just fine on full anaconda, so I was hoping someone would know how to get it to work on windows as well, but I appreciate the tip
prisma mist
flat hollow
My personal laptop is a macbook and spyder is working just fine on full anaconda...
mac and linux are *nix based so conda behaves differently in those os. windows is problematic. you need to start a separate powershell.. in some versions you must be admin to run it properly. you cant view the logs easily and so on. conda works perfectly in my personal linux but on my windows work laptop anaconda was a huge problem, even miniconda is a pain
flat hollow
by the separate powershell do oyu mean using Anaconda Prompt instead of Command Prompt? that's something I've already noticed. Damn I got a really nice laptop to do my uni work on and spent a lot of my stipend to get it, I guess I will try to reinstall anaconda again tomorrow and see if it works at least for a moment
prisma mist
flat hollow
by the separate powershell do oyu mean using Anaconda Prompt instead of Command ...
yes.. iirc the anaconda prompt or anaconda powershell required admin run to work properly... it was enough of a problem for me to remove anaconda completely and install miniconda via a package manager like chocolatey.... after that it was straight forward... select miniconda powershell.. conda deactivate; conda create --name workdir -c conda-forge python pip pandas numpy etc and everything worked. anaconda is buggy
flat hollow
I don't actually have any issues with creating venvs, updating, installing anything, it's literally just Spyder not working. VSCode, jupyter, pycharm everything else works fine, but I'm just so used to that IDE :/
 mortal heron
flat hollow
I don't actually have any issues with creating venvs, updating, installing anyth...
mortal heron
flat hollow
I don't actually have any issues with creating venvs, updating, installing anyth...
I use Spyder on Windows all the time, it stopped working for me and I uninstalled everything and then reinstalled anaconda and started again. The first thing I did was upgrade Spyder to the latest version and I made a setting to sync conda and pip packages. I try to manage my envs in Anaconda GUI where possible. This is the setting I used https://docs.conda.io/projects/conda/en/latest/user-guide/configuration/pip-interoperability.html
I'm running Spyder 5.1.5 and Python 3.9.7
misty flint
interesting when i switched from pycharm to vscode, i never looked back
flat hollow
Cheers, I was considering reinstalling anaconda and just keeping it out of date for a while
I'm not using pycharm 😄
 stone marlin
Everyone in my dept uses pycharm and I'm over here like, "hm, but my VSC..."
Unlike some mods in this chat ( 😉 ) I do like EDA in notebooks as well --- so I do jupyter, but I do the VSC embedded jupyter stuff. Having said that, if you run notebooks, your cells better be idempotent, dangit.
misty flint
stone marlin
Unlike _some_ mods in this chat ( 😉 ) I do like EDA in notebooks as well --- so...
have you seen any of the modern notebook tools lately
stuff like deepnote
or hex
theyre pretty dope

arctic crown
what are the first machine learning algorithms i should learn?
 woven fractal
arctic crown
what are the first machine learning algorithms i should learn?
woven fractal
arctic crown
what are the first machine learning algorithms i should learn?
linear regression, logistic regression, decision tree
mint palm
"mapping inputs individually", what does this mean?
 bold timber
Hi, I have a question: Why the shape of the feature is 16, whereas I set a batch_size as 32?
 lone drum
hello i am working with dash app for making dashboard. previously my code was working but now i am getting error loading layout can anyone help me in this? my code here https://paste.pythondiscord.com/lupiqequwu ping me when reply
lapis sequoia
does doing save version save the file system as well in kaggle?
I'm saving weights in appropriate folders, will I get them?
lapis sequoia
bold timber
Hi, I have a question: Why the shape of the feature is 16, whereas I set a batch...
i assume 16 here is column right?
well batch takes N data together, so its like taking N rows, so Nx16 in your case(hence 32x16)
tacit basin
Anyone tried EIN emacs as a jupyter client? Just installed emacs, didn't know how to exit lol
Then read about spacemacs and vim mode in emacs. It gets complex lol
bold timber
lapis sequoia
i assume 16 here is column right?
well batch takes N data together, so its like ...
I think 16 is not a column because I create data as a random number
 prisma mist
bold timber
Hi, I have a question: Why the shape of the feature is 16, whereas I set a batch...
prisma mist
bold timber
Hi, I have a question: Why the shape of the feature is 16, whereas I set a batch...
for feature, target, that extra comma is bothering me... doesn't the interpreter ask for a variable there?
prisma mist
bold timber
Hi, I have a question: Why the shape of the feature is 16, whereas I set a batch...
try feature.shape if it shows 16, 2 then the rest of the values moved over to the other column
bold timber
prisma mist
`for feature, target,` that extra comma is bothering me... doesn't the interpret...
Sorry, I don't understand clearly what you mean. Can you explain me again?
bold timber
prisma mist
try `feature.shape` if it shows 16, 2 then the rest of the values moved over to ...
The total shape of feature is 16, 4
I'm so curious about this why the feature of feature.shape[0] taking a 16, not 32
prisma mist
bold timber
Sorry, I don't understand clearly what you mean. Can you explain me again?
well i've never seen an empty comma before like this for feature, target,... usually its for feature, target .. i am not sure if it does something to the code like put the values in 4 columns: feature, target, feature, target.. instead of two col: feature, target... can you try removing the extra comma at the end of target and then checking the shape? i also want to see if having an extra comma changes or not has any effect
bold timber
prisma mist
well i've never seen an empty comma before like this `for feature, target,`... u...
Sorry, that is my fault for putting extra comma. But, the result still same

by the way this is my data
 prisma mist
bold timber
Sorry, that is my fault for putting extra comma. But, the result still same
prisma mist
bold timber
Sorry, that is my fault for putting extra comma. But, the result still same
you ran all the cells again and got the same result? must be something with the way the data is in the array 🤷♂️
bold timber
prisma mist
you ran all the cells again and got the same result? must be something with the ...
actually the data is array, but I converting to torch tensor
I have run all the cells many times and got the same result
 tacit grail
Hi everyone, I need few suggestion from experts here on a task,
The task is following:
there is a document simlar to attached images. the I ask my students to create the same word document.
so I want to check the similarity between submitted document and my actual document using machine learning.
I need some guidance on what modal is best suitable?
 modest mulch
tacit grail
Hi everyone, I need few suggestion from experts here on a task,
The task is foll...
modest mulch
tacit grail
Hi everyone, I need few suggestion from experts here on a task,
The task is foll...
You need to provide more info on how you want to compare similarity, is it by content, or by having the same template as the document
or idk what else
tacit basin
tacit grail
Hi everyone, I need few suggestion from experts here on a task,
The task is foll...
Just train CNN classifier if you have enough training data
stuck schooner

X is single feature dataset with which I manually do Polynomial regression from degree degree 1 (single feature) [x] to degree 20 [x, x^2, x^3, ..., x^20]
Dataset looks like this

Do you think score list makes sense ?
Isn't score = 1 means prediction perfectly match Y ? Why is this diverging to -inf ?
Overfitting parameters to training dataset is a problem but in a dataset that actually look like like a polynomial expression I didn't thought it wouldn't be a problem
 somber prism
guys i am currently looking at neural style transfer in coursera, but i am not sure what this means fully for computing the cost function step. Make Generated Image G Match the Content of Image C One goal you should aim for when performing NST is for the content in generated image G to match the content of image C. To do so, you'll need an understanding of shallow versus deep layers : In practice, you'll get the most visually pleasing results if you choose a layer in the middle of the network--neither too shallow nor too deep. This ensures that the network detects both higher-level and lower-level features. After you have finished this exercise, feel free to come back and experiment with using different layers to see how the results vary! To forward propagate image "C:" Set the image C as the input to the pretrained VGG network, and run forward propagation. Let 𝑎(𝐶) be the hidden layer activations in the layer you had chosen. (In lecture, this was written as 𝑎[𝑙](𝐶) , but here the superscript [𝑙] is dropped to simplify the notation.) This will be an 𝑛𝐻×𝑛𝑊×𝑛𝐶 tensor. To forward propagate image "G": Repeat this process with the image G: Set G as the input, and run forward progation. Let 𝑎(𝐺) be the corresponding hidden layer activation. In this running example, the content image C will be the picture of the Louvre Museum in Paris. Run the code below to see a picture of the Louvre.
i can understand that we have to pass the content ( input ) image to the model for the forward propagation and stop it at the lth middle layer to G but why do we have to pass that G image again and repeat the process. can someone tell me why ?
 supple leaf
Hi, Im trying to mark the extreme values in the red function in the graph with this code:
import pandas as pd
import matplotlib.pyplot as plt
import numpy as np
from scipy.signal import find_peaks

var = pd.read_excel(r'/Users/pontusskol/Desktop/data.xlsx')
print(var)

x = list(var['X values'])
y = list(var['Y values'])


plt.figure(figsize=(10,10))
plt.style.use('seaborn')
plt.plot(x, y, '-o', label='x, y')
plt.xlabel('Tidsperiod')
plt.ylabel('öre/kWh')
plt.scatter(x, y, marker="o", s=100, edgecolors="black", c="yellow")
plt.title("Excel sheet to Scatter Plot")
np.asarray(x)
np.asarray(y)
z = np.polyfit(x,y,38)
#print(z)

poly = np.poly1d(z)
new_x = np.linspace(x[0],x[-1])
new_y = poly(new_x)
peaks, _ = find_peaks(new_x,height=0)
plt.plot(x,y,'o', new_x,new_y, peaks, new_x[peaks], 'x')
#plt.plot(x,y,'o', new_x,new_y, )
derivative = poly.deriv()
print("Derivative, f'(x)= \n", derivative)
plt.show()
print(poly)

But I just cant make it work... Any ideas?
mild dirge
I already trained a network on some data of bird images (400 classes, 100-ish images per class), assuming all classes had the same amount of images, but later found that the distribution of images for classes looks like this:

Would this be a problem concerning bias towards classes with more images?
lapis sequoia
Why is it not coloring each bar
 supple leaf
How do I find the max and min values of an array that looks like this for example:
3x^2+3x+6
serene scaffold
supple leaf
How do I find the max and min values of an array that looks like this for exampl...
what do you mean, an array that looks like that? that looks like polynomial expression
.wa f(x) = 3x^2 + 3x + 6
 strange elbowBOT
 serene scaffold
we can see from the plot that there is one minimum

so we know that the x coodrinate of the minimum is -.5. you can find the y coordinate by solving f(1.5)
I can't remember how you determine if it's a minimum, maximum, or saddle point without plotting it.
I guess if the derivative is a line with a positive slope, then the function itself has to be a parabola that goes up, and would thus only have a minimum.
@supple leaf does that help?
wicked grove
hello
i want to add an svm classifier at the end of my cnn instead of a softmax
but i cant understand how im supposed to to do this
 supple scroll
this is the WORST loss i have ever seen

 dark wasp
Is a second-degree graph a graph with 2+ points where each point has two edges and together they create a cycle?
 unborn summit
Hey folks, I've been trying to get a help channel, all morning, but I would be super appreciative if someone could point me in the right direction of a model that would help me in a game I play with my friends. The idea of the game is Player A guesses a number between 1-1000 inclusive followed by Player B guessing a number between 1-1000 inclusive, where the goal is for Player B to get as close to the number as Player A guessed, using the shortest distance between the two numbers (so the difference between 997 and 1 is 4).
I'm honestly not sure which packages/models to look at, any ideas would be much appreciated, thanks.
I'm trying to get a function to predict player A's next guess
The game does have a data set for each Player A, so there would be a training set
I guess my thing is I have no idea what avenue to pursue, whether its ML or just looking at sequences
 vapid zealot
unborn summit
Hey folks, I've been trying to get a help channel, all morning, but I would be s...
vapid zealot
unborn summit
Hey folks, I've been trying to get a help channel, all morning, but I would be s...
This isn't even a problem you can solve algorithmically, the expected distance of the guess is the same no matter what number you guess (ie completely random)
unborn summit
vapid zealot
This isn't even a problem you can solve algorithmically, the expected distance o...
I may have worded this poorly
It's not a guess (random), player A is submitting a number with the intent of being furthest away from player B
Some players do use random numbers, but usually there is a plan
I've seen outputs like this
vapid zealot
unborn summit
Some players do use random numbers, but usually there is a plan
Does Player B know the output of Player A?
unborn summit
vapid zealot
Does Player B know the output of Player A?
They do afterwards
 unborn summit
Interesting
oddly enough using straight RNG has been ruthlessly effective for my friends as Player B lol
I just thought it was small sample size
vapid zealot
I'm thinking what happens is that the model overfits on itself (quite common in minimax games) and causes all sorts of funny results
serene scaffold
@unborn summit if the game quickly boils down to random guessing, there's no way an AI could do better than random chance, either.
vapid zealot
Kinda how you try to "out predict" your friends in rock paper scissors
When the optimal strategy is just randomly playing
unborn summit
So in actuality, straight RNG over the aggregate would beat someone who is even not being random?
like the "chaser" being RNG vs. Player A who is being chased?
vapid zealot
unborn summit
So in actuality, straight RNG over the aggregate would beat someone who is even ...
Well yes
vapid zealot
no prob 🙂
wicked grove
i want to add an svm classifier at the end of my cnn instead of a softmax, how can i store the extracted features from cnn
serene scaffold
wicked grove
i want to add an svm classifier at the end of my cnn instead of a softmax, how c...
I'm not sure I follow. softmax is an activation function, and SVM is a whole algorithm
vapid zealot
wicked grove
i want to add an svm classifier at the end of my cnn instead of a softmax, how c...
Feed the latent code into the svm
But it's probably much simpler if you use a Linear layer as your classifier
wicked grove
vapid zealot
Feed the latent code into the svm
i didnt get it , how can i do that
vapid zealot
wicked grove
i didnt get it , how can i do that
Recommendation: Don't do that
wicked grove
serene scaffold
I'm not sure I follow. softmax is an activation function, and SVM is a whole alg...
yess, umm i want the svm to classify all the extracted features
vapid zealot
wicked grove
yess, umm i want the svm to classify all the extracted features
Does it have to be SVM
vapid zealot
wicked grove
Or any ml classifier
Then use Linear layers
wicked grove
 wicked grove
Im trying to implement this and they have fed the 32 features into an ml classifier
wicked grove
vapid zealot
Yeah it's the fully connected layer
I did
vapid zealot
Well then you should get your classification?
wicked grove
But after 32 features idk how to put it in an ml classifier
vapid zealot
wicked grove
But after 32 features idk how to put it in an ml classifier
Use another FC to shrink it to 1
Or whatever number of classes you have
wicked grove
vapid zealot
Use another FC to shrink it to 1
You mean using softmax right?
vapid zealot
wicked grove
You mean using softmax right?
Ok how many classes are there?
wicked grove
3
vapid zealot
Ok so shrink the output to 3 using another Linear layer
Then apply your softmax on that
wicked grove
vapid zealot
Then apply your softmax on that
Yeah that's what i did,but But this has used J48 classifier after getting 32 features
And i wanna try using the ml classifier to see if the performance improves
vapid zealot
wicked grove
And i wanna try using the ml classifier to see if the performance improves
But how would you train the model
Unless you want to freeze the CNN
and train it solely on the SVM
wicked grove
vapid zealot
Unless you want to freeze the CNN
Yeah that's what i cant understand how do i use it as a feature extractor
wicked grove
vapid zealot
and train it solely on the SVM
Yeah something like that ig
vapid zealot
wicked grove
Yeah that's what i cant understand how do i use it as a feature extractor
You would feed the 32 outputs (raw) into the SVM
But like why
vapid zealot
wicked grove
I thought it'll improve my accuracy
Even if it does it won't be significant
Plus it just adds extra dependencies
Just because a paper or textbook says so doesn't mean that it's correct or the best approach
wicked grove
vapid zealot
Just because a paper or textbook says so doesn't mean that it's correct or the b...
ohh
really?
vapid zealot
wicked grove
really?
Critical thinking my dude
vapid zealot
wicked grove
thanksss!!
np
 sour summit
is the pandas module normally good for data science using python? I've normally used R for data science and I want to see if I can use python
serene scaffold
sour summit
is the pandas module normally good for data science using python? I've normally ...
pandas is basically the data.frame from R
sour summit
ok makes sense
serene scaffold
and pretty much everyone who does data science in python uses it.
sour summit
yeah, I mean when I went and did some data science classes in college, we only used R
and I wanted to see if I can try something other than R like using Python (specific modules from python)
serene scaffold
sour summit
and I wanted to see if I can try something other than R like using Python (speci...
I think both languages have full support for any scientific programming one would ever want to do, but that R is more widely used by those who aren't computer scientists.
serene scaffold
tidyverse?
misty flint
hmm
its like an ecosystem of libraries
that are very intuitive
since Hadley Wickham was focused on design principles when he made them
wicked grove
vapid zealot
But how would you train the model
Should i bring it to 32 in the fc and then put it in a softmax?
Or should should i use some other number of nodes in the last fc?
I have been trying to bring a 7% increase in accuracy on my test data but idk what im supposed to do
sour summit
serene scaffold
I think both languages have full support for any scientific programming one woul...
yeah sounds about right
 robust charm
Has anyone here ever used stable baseline 3?
mint palm

in architectures like this. how to decide when to branch out and when to concatenate?
sometimes after dividing we process both the branch, unlike above.
how to know that.
 warped hill
i have some rendering code and i need to speed it up because rendering a single shape takes multiple seconds. the largest part of the overhead is due to the need to call the distance function multiple times per pixel. i went looking for a faster replacement (most of the overhead of the standard function coming from the exponentiation), and for some reason the cdist version is running about 8.5 times slower than the standard version, any idea what the issue is? it should run faster since cdist runs in C shouldn't it?
def _cdist_circular_distance(p1, p2):  # runs for a total of 34.793s
    d = cdist([p1], [p2], metric='euclidean')
    return d


def _standard_circular_distance(p1, p2): # runs for a total of 3.955s
    d = math.sqrt((p1[0] - p2[0]) ** 2 + (p1[1] - p2[1]) ** 2)
    return d

# this is the shape they draw :
shape = (Rectangle([0, 0], [250, 250]) &
             (Circle([250, 250], 150) ^ Circle([250, 250], 50)) |
             Rectangle([250, 250], [500, 500]) &
             ~(Circle([250, 250], 150) ^ Circle([250, 250], 50)))
full code : https://www.toptal.com/developers/hastebin/hucomujewe.py
Hastebin is a free web-based pastebin service for storing and sharing text and code snippets with anyone. Get started now.
why the frick does discord think this is a download link
the red shape (yes it is a single shape) is the one defined in my code snippet
 agile cobalt
warped hill
*why the frick does discord think this is a download link*
agile cobalt
warped hill
*why the frick does discord think this is a download link*
it ends with .py
!paste use ours instead 😉
arctic wedgeBOT
Pasting large amounts of code
If your code is too long to fit in a codeblock in discord, you can paste your code here:
https://paste.pythondiscord.com/
After pasting your code, save it by clicking the floppy disk icon in the top right, or by typing ctrl + S. After doing that, the URL should change. Copy the URL and post it here so others can see it.
warped hill
makes sense
agile cobalt
if cdist is using numpy arrays, then it might be converting p1 and p2 from python lists to numpy arrays each iteration? which is extremely expensive
warped hill
oh. well. crap. i would guess creating a numpy array is just as expensive as converting to an array, and so switching out my lists for array would only move the overhead somewhere else no?
agile cobalt
Creating it once then working exclusively with numpy arrays should speed it all up by a lot
warped hill
well yes but i need to create a 2d array containing the 1d 2 element arrays i use in the rest of my code directly in the distance function, thus creating arrays just as often as i'm currently converting them
since cdist takes 2d arrays
since it's not really made for calculations as small as 2 point distance
agile cobalt
reshaping should be somewhat cheap if you use array.reshape
or just rewrite your standard but with numpy functions
warped hill
agile cobalt
or just rewrite your standard but with numpy functions
that's a failure ig

i would guess once again most of the slowness comes from the few asarray(point) that i had to introduce
actually nevermind. i tried keeping the asarray but having the distance function not compute anything and my code runs in 3s instead of 24 still not fast, but the as array calls are definitely not the issue
steady basalt
One day I’m going to learn how to use the pipeline function instead of having a 50cell pipeline
X)
Does anyone know if using over sampling such as smote is even “fair”, I’m working on disease data and obviously it massively boosts score, but the bias just seems unrealistic as irl you’d never get a balanced sample
 arctic blade
Can i do an a level in AI in the UK? If so, what are the requirements?
mild dirge
steady basalt
Does anyone know if using over sampling such as smote is even “fair”, I’m workin...
Does it boost the performance on the test dataset too?
And if you did do it on testing data, did this have equal class distribution
And especially when you work with diseases, it is more important to not get false negatives, than minimizing the amount of false positives
lapis sequoia
arctic blade
Can i do an a level in AI in the UK? If so, what are the requirements?
I don't think there are, but some schools do offer computer science as an A-level like this one https://www.ocr.org.uk/Images/170176-programming-languages-guide.pdf
steady basalt
mild dirge
Does it boost the performance on the test dataset too?
What do you mean?
I am using cross validation, so yes?
I tested performance on k=10
mild dirge
are you including upsampled data in that?
mild dirge
It would perhaps be good to keep some data separate for testing
and do cross validation on train and validation data
steady basalt
Btw, my roc area is 0.98 how do I solve the overfitting
mild dirge
and later test the best model on the test data
steady basalt
What do u mean
Cross validation function automatically holds back 10% 10 times and averages on unseen
arctic blade
lapis sequoia
I don't think there are, but some schools do offer computer science as an A-leve...
I see
mild dirge
Right, but some of data is created artifically
steady basalt
Yes
mild dirge
so the results might not be accurate
arctic blade
Also is machine learning a good industry to get into?
steady basalt
I’ve tested before and after synthesising
Ofc
So I saw a big boost
Like 8%
BTW, how can I fix this:
 mild dirge
Right, but the data you test on is not just real data points, it is also artificial data
steady basalt
Yes I tested on artificial data too
Aren’t you supposed to when evaluating re balanced data?
mild dirge
You shouldn't is what I'm saying haha
steady basalt
Huh?
mild dirge
you can use whatever artifically inflated data you want for training the model, but the data you test on should be real data
steady basalt
What do you mean by training model?
lapis sequoia
arctic blade
Also is machine learning a good industry to get into?
Sure there are many job opportunities and it will be relevant for some time to come.
However, from what I've seen you need at least Intermediate Python and a good understanding of mathematics to really work with it
steady basalt
@mild dirge do you mean using train test split?
mild dirge
Yes, and on the train split you can use cross validation
steady basalt
I have no such need because cross validation basically does that
mild dirge
for finding correct hyper-parameters
mild dirge
So you can see the unbiased performance on test data that is not used for creating the model
mild dirge
:/
steady basalt
What do you mean biased?
 river quarry
@steady basalt i think you should reconsider the darta and then touch base
steady basalt
LOL
mild dirge
I'm just saying how it may influence the accuracy, if you don't like the idea of using separate test data and testing on artificially created data, then I can't help
river quarry
hello im try to build virus for computer who can help??
steady basalt
Oh, do you mean hold back say
100 values of y and then test vs 100 values of rebalance data?
Uhh
Hmmm
?
mild dirge
Feel like this comment on hold back gets the point across pretty well
 steady basalt
I actually do cv all over again when tuning parameters
And have it shuffled
Tho it’s always the same random state…
mild dirge
Yeah but you use the same data for tuning your hyper-parameters as you do for testing the "unbiased performance"
steady basalt
I then do cv again after doing smote on purely rebalanced data, are you saying I should perform cv instead on rebalanced X data but old and real y values?
mild dirge
There might be some pattern in your data that allows certain hyper params to give a better performance on your data, while it would not give good performance on new data
steady basalt
mild dirge
Yeah but you use the same data for tuning your hyper-parameters as you do for te...
Unbiased performance?
mild dirge
yeah, you want to know the performance of the classifier on new data
but you tune hyper-parameters on the same data
steady basalt
It’s unseen data that’s been hidden
When I do that I make sure to state a new model variable
mild dirge
How have you been tuning hyper parameters then?
steady basalt
Btw
I will create a new model variable
And cross validate
The paremeters which give a highest average score wins
I used octuna but it’s the exact same process as sklearn GS
arctic blade
lapis sequoia
Sure there are many job opportunities and it will be relevant for some time to c...
The python part i think ive got down, maths i might need to work on 😂
mild dirge
right, so you tune the hyper-parameters on the same data that you test on
This is a good post on how to deal with upsampling and cross validation
 mild dirge
You wouldn't know yet, your performance is not tested on new data
so you can't know if it is overfitted
stone marlin
-
Make two sets: your training set, and a hold-out set. Think of the hold-out set like a "test set for CV". Make it something like 70%-30% or so.
-
Train using CV on the training set. If you are using SMOTE, you can do that in your preprocessor.
-
You have a model now.
-
Score the model using the hold-out set, but do not SMOTE this set. You will see some people and papers say to SMOTE the test/holdout set, but my strong feeling is that you should not do this --- it creates artificial points in the test set, which, I've found, biases score significantly.
steady basalt
So holdback data at the very start of the pipeline? Say 10%? And then begin working on the 90% as normal
Use the 10% for final evaluation
mild dirge
mild dirge
https://kiwidamien.github.io/how-to-do-cross-validation-when-upsampling-data.htm...
And if you read this, you also see that smote should be used only on the training fold
not the test fold
steady basalt
Ah I understand
stone marlin
You can now iterate. Your holdout data will never be seen by the model or the CV, so this is good sanitation. Moreover, the holdout will not contain artificial smote points, like "real data".
steady basalt
👍
I have uhhh
Like 100 cells of code
Optimal way to restructure with hold out data
?
stone marlin
No better time than now to learn pipelinezzzz.
steady basalt
🙂 true
So doing this my accuracy will probably stay fairly high but my auc will reduce and look realistic
stone marlin
I'd honestly recommend learning pipelines --- it simplifies your code so much, and it's such a great organizational thing. IIRC, SMOTE isn't part of the sklearn fit-transform stuff --- I'm not sure how people "usually" put it in preprocessors. I make a fit-transform thing out of the smote function.
stone marlin
Haha, one of the first things we teach DS entry-level peeps (and some others!) at the place I'm at now is: how to use pipelines, how to make your cells as idempotent as possible.
mild dirge
More data in the test set means your test accuracy/f1-score etc. has more meaning
steady basalt
20%?
stone marlin
It depends on your data. I try for a larger holdout/test set.
mild dirge
But more data for training/validation means you might get better results
stone marlin
I tend to go for 20-30% yeah.
steady basalt
So you hold out at the start of the pipeline
mild dirge
Yes
steady basalt
And scale,sample and tune only on the train set
And then the test set is used at the final stage where you derive AUC?
As well as other metrics like precision
stone marlin
[Most of my data is imbalanced around 1 - 2.5%, but I have many, many datapoints, so 20-30% is not affecting my training much. If you have like, 100 points, then, you know, adjust accordingly.]
steady basalt
My data’s heavily imbalance why I was using smote
stone marlin
The holdout/test set (the thing you're not using in CV) is used for scoring at the end, yeah.
steady basalt
I will learn pipeline eventually but I just wana get this converted in my main code first
It’s gona take some time to rename everything
Unless I just hold out as a new variable and keep all others the same and just a single re run will work?
stone marlin
Yeah, you could just take the holdout right when you load in the data if you want.
steady basalt
And the train set will keep the name “X” and y or whatever was before
I think not about thst
I don’t want to preprocess twice
I’ll take it out after I select features ?
stone marlin
Yeah, sure. You can keep all that the same. Just remember that, at the end, you need to score on your holdout.
mild dirge
And you should basically only do that once to get a good idea of the performance of your model
if you start tuning stuff differently because the test accuracy was low, you might already get a model that is overfitted
steady basalt
Tunings based just on train data shudnt he a issue then
mild dirge
jup for sure
and to do that tuning, you can use cross validation with only your training data
steady basalt
This will kinda suck on datasets with like 7 features and 509 rows
Just to clarify, fine to holdout AFTER feature selection?
Saves time
mild dirge
Optimally you'd holdout right at the start
nothing about the test data should influence any decisions you or the algorithm makes when training
steady basalt
So I’d have to do the entire process again for the test set ???
mild dirge
entire process?
steady basalt
Feature selection, scaling and tuning and then rebalancing and retuning? That’s the amount of steps in my first try
mild dirge
no, you can just test your finished model on the test set, and you should scale it the same way you did with the training set
steady basalt
Oh yeah ofc
But one more thing
I want to see how each process has an effect on the final model
Hence why I’ve done testing constantly all along to measure gains
This means I’ve gotta do those steps all over again for each model iteration
mild dirge
If you want to get some idea of the loss over iterations, you could take a validation set out of your training set
and check the performance on this validation set
steady basalt
That’s even more lost data I have small set
 rapid fog
Please try to refrain from using ableist language here, thanks.
steady basalt
Is it enough to measure this via accuracy or as you say do I need to measure loss too?
steady basalt
I don’t know how to plot loss well
Anyway I’m going to go for a bit and redo this with a hold out and see if it fixed the auc
Although 0.98 isn’t 1
And if it was cheating as much as you imply it shud get 1 right?
mild dirge
that depends on way too many things to tell
some problems can't even be estimated correctly 100%
steady basalt
Do u use test train split to hold out the quickest in terms of code
mild dirge
quickest?
steady basalt
yeah and do u shuffle
mild dirge
you should basically always shuffle yeah
steady basalt
Do u know the code structure for obtaining probas if you have the holdout made
Idk this guy I see on SOF is saying y_train[test] it’s confusing me
Think I got it
Will post new roc shortly
Should I report train AND test score at each model processing step?
mild dirge
You can only get the test score (on the held out test data) after done with training
You could train the model with the final tuned parameters, and then test on test set each training batch
steady basalt
@mild dirge I have to remove features from the holdout that I removed via feature selection on the training set of obvious reason that it requires the same features to predict
@mild dirge thanks for the help!!!!
Clearly not overfitting like before

Ahhh. I broke it again 0.5 now

 misty flint
curious, any reason why you dont just screenshot instead of taking a pic with your phone
mild dirge
Is there some method for finding an input that maximizes the activation of a neuron in a neural network?
steady basalt
misty flint
curious, any reason why you dont just screenshot instead of taking a pic with yo...
Key broken
I can’t think of why this is happening, my predict probas are all giving the same prediction for every test point giving me 0.5 auc
