#data-science-and-ml
1 messages · Page 387 of 1
 steady basalt
 tacit basin
the only data you have is train data, then you train your mode and you predict on data you have never seen.
so the data you have never seen it's test data from train test split
steady basalt
 tacit basin
well if its a kaggle then everyting is allowed which increases your score on lb
steady basalt
i mean i jut see this and decide
if someone says its convention then ill just do it
tacit basin
yes so google says the same as i say right?
 steady basalt
I split in the first line you can see in the screenshot, then i am running a sklearn model for selection
tacit basin
steady basalt
I split in the first line you can see in the screenshot, then i am running a skl...
but you run selecton on X
X_train X_test is split
so you should run feature selection on X_train, y_train
tacit basin
i mean it's only 30% less data, so i wouldn't expect it will take that much less time
but it's the correct approach 🙂
 stone marlin
Yes, this is the answer, haha, I was gonna pop in, but always run your stuff on train split (or the non-val part of CV). I don't think it'll save much time though if it's been running for that long.
tacit basin
now thre may be a way to speed up scikit learn in some way,
stone marlin
How big is the data set? How many rows? How many features?
steady basalt
8500
stone marlin
That's a lot of features, dang.
steady basalt
rows
stone marlin
Oh, okay.
stone marlin
How many features after the one-hot?
steady basalt
lemme check
stone marlin
Like, if you one-hot'd a continuous var, that could easily have made, you know, 8500 new features.
And that would make RFE take a while.
steady basalt
oh jesus christ
6000 features
not sure how this has happened
im so sure i only encoded the right features thugh
Yeah i did only encode my categorical columns
This is the Space Titanic dataset btw, maybe its cuz of the cabins?
tacit basin
just train xgboost on gpu and dont reduce the number of features 🙂
steady basalt
it kinda makes sense tho iguess, with 8000 people and lets just guess theres like 200 cabins thats a lot of unique 0s and 1 s
ah, yeah theres 6500 cabins
on a space ship
odd
steady basalt
tacit basin
just train xgboost on gpu and dont reduce the number of features 🙂
Is this the best way to move forward, then?
tacit basin
steady basalt
Is this the best way to move forward, then?
don't know, just an idea
steady basalt
maybe the thing to do is to find relationship for maybe X character in cabin and survival
tacit basin
not sure which model is best for this dataset, but for tabular data you can't go wrong with xgboost usually, or lgbm or catboost, or adaboost, or random forest
steady basalt
or just remove cabin
tacit basin
yeah also good option
steady basalt
but it could be possible to try see cabins beginning with a certain letter correlate, and then do someting with that info?
idk im kinda stuck
tacit basin
so someone there tested 27 different models and all gradient boosted things on top, then rf

but differnece not that big though

Explore and run machine learning code with Kaggle Notebooks | Using data from Spaceship Titanic
steady basalt
tacit basin
so someone there tested 27 different models and all gradient boosted things on t...
Im not advanced enugh to get into this stage yet
im still trying to find if theres a relationship between cabin location
and outcome
is it best to just group them all into A-G and one hot encode the group
tacit basin
that's one way of doing this, another is to grab all features and do xgboost on them 🙂
steady basalt
it wudnt take ages?
tacit basin
you can use gpu for that xgboost supports that
steady basalt
what about logistic regressin I rly wanted ot try
tacit basin
logistic regression is usually a baseline mode, so it's good to have baseline. go for it
steady basalt
if it took infinite time to feature select using LR, why would it be much faster to just do the model training with all features
oh damn I think how it works now
it has to run 6500 times
with this selection model
holy moly
 lapis sequoia
16 gb gpu!!!
gift me that, i really need a nice gpu for some training
Been running on my institutes gpu but just 3 gb is free
tacit basin
lapis sequoia
Been running on my institutes gpu but just 3 gb is free<:lemon_pensive:754441880...
38 free hours a month on kaggle platform 🙂 P100, maybe not the fastest by todays stanadard but OK it's free 🙂
 lapis sequoia
tacit basin
38 free hours a month on kaggle platform 🙂 P100, maybe not the fastest by today...
lapis sequoia
tacit basin
38 free hours a month on kaggle platform 🙂 P100, maybe not the fastest by today...
Oh no damn. 38 hours for one acc?
lapis sequoia
tacit basin
38 free hours a month on kaggle platform 🙂 P100, maybe not the fastest by today...
Oh its fine. My institute got a p500 i think. And with 16 gb. So kinda same. This will be a relief for me.
tacit basin
data / output is saved if run in commit mode
lapis sequoia
tacit basin
data / output is saved if run in commit mode
What do you mean by commit mode?
tacit basin
lapis sequoia
What do you mean by commit mode?
they used to call that in the past, now they call it save (run and save) i think. it runs the code in the 'background' so you don't need to keep browser open and stores the output (model, etc)
lapis sequoia
tacit basin
they used to call that in the past, now they call it save (run and save) i think...
Oh. Like nohup?
When i use on ssh, i just use nohup and save outputs in a file
tacit basin
lapis sequoia
When i use on ssh, i just use nohup and save outputs in a file
they provide notebooks with some option to use scripts.
lapis sequoia
Oh i see.
Well damn, thats way better than colab for high computation.
Atleast they don't want us to keep the site open.
tacit basin
yep
stone marlin
I had to go into a call, haha, but I'm glad I called it. :'] I always check after one-hot encoding for exactly this reason.
Nohup is awesome. Tmux also keeps ssh stuff upen by default.
steady basalt
damn, prediction index length doesnt match test
lapis sequoia
stone marlin
Nohup is awesome. Tmux also keeps ssh stuff upen by default.
Whats tmux?
tacit basin
tmux user here 🙂
stone marlin
tmux is really fun. :']
It's kind of like, uh, "screen" and those other terminal window-splitting things.
steady basalt
anyone know how to fix?
lapis sequoia
Is it like already in there or do we need to install it?
steady basalt
my_submission = pd.DataFrame({'Id': test_df.PassengerId, 'Prediction': prediction})
ValueError: array length 2608 does not match index length 4277
tacit basin
never used screen...
lapis sequoia
steady basalt
ValueError: array length 2608 does not match index length 4277
Seems self explanatory. Different number of rows.
stone marlin
Yeah, you'd have to show your code for how you're getting prediction.
My guess is you're predicting on the wrong thing?
steady basalt
how the hell did my test set shrink in half
tacit basin
lapis sequoia
Is it like already in there or do we need to install it?
there a lot of packages pre-installed, you can also install packages as well, then just click save, just make sure it will not run for longer than 12 hours, as the session will be terminated, or save checkpints after epochs, etc. this will be saved and available
lapis sequoia
steady basalt
how the hell did my test set shrink in half
Galdalf came and did it. Yes.
steady basalt
X_train, X_test, y_train, y_test = train_test_split(X, y, test_size = 0.3, random_state=42) this is how X_test was formed
used for predictions
of course, X had 8000 rows
and test df only 4000
lapis sequoia
tacit basin
there a lot of packages pre-installed, you can also install packages as well, th...
Yeah so in my current setup, I'm saving checkpoints. As in my institute computer. The only problem is...some other people are using it too. Giving me 3 gb left out.
But i think for now nohup is a good enough thing for me. Saving output in a file and saving checkpoints for just in case or later restarting from same point.
steady basalt
ah im stupid i made X with train df
tacit basin
don't know if that's stupid. seems fine to me.
lapis sequoia
steady basalt
<@!490342783572246538> pls help
Hm you seem to have a really small problem. Take one step at a time. What are the shapes of both test and train x and y?
And what exactly are you passing to the predict function.
steady basalt


arent I supposed to submit a dataframe of my predictions and the ID column of the testdf?
test_df is 4277 rows
without ids
@lapis sequoia
lapis sequoia
Hm okay the one x you're passing in predict has shape of?
tacit basin
steady basalt
then why do my test rows not match
what do you do to your test rows? show me pls
steady basalt
lapis sequoia
Hm okay the one x you're passing in predict has shape of?
2608 just like X_test
lapis sequoia
Hm
 tacit basin
i don't see test df here
steady basalt
test_df is just kaggles un ID'd data
steady basalt
test df
lapis sequoia
If your test df has like 4k rows you're passing wrong thing for predict.
 lapis sequoia
steady basalt
test df
lapis sequoia
steady basalt
test df
Yeah so use x of this
 tacit basin
steady basalt
tacit basin
steady basalt
seems fine
lapis sequoia
As much i can see, you don't even need to split, they gave both different.
steady basalt
I thought I'd need to use X where I have the y values, ID which is train data
tacit basin
so you split train df to train and test, train on train, validate on test and predict on test df (the one provided by kaggle with not y)
and submit to kaggle that one
steady basalt
 lapis sequoia
Hm but currently they're giving more of validation y to kaggle instead of test y.
tacit basin
you get two datasets from kaggle: train and test
steady basalt
Yea
tacit basin
you split train set into, and that's confusing train and test, but it's bettter to think of it as vaidate set
you train on train, validate on test/validate set
and predict on the test set provided by kaggle
and submitt that
steady basalt
wheres the error in the code
tacit basin
can you show your code
steady basalt
i trained on x train y rain
lapis sequoia
steady basalt
wheres the error in the code
Error is you're giving wrong X to your predict.
tacit basin
steady basalt
i trained on x train y rain
that's good
steady basalt
 tacit basin
if you want to submit to kaggle you need to predict on test data tehy provide
not the one that was split from train set
steady basalt
oh
lmao, thanks
now the error is
could not change string to float
cause it has categoricals
 eager wedge
How many epochs should I have?
tacit basin
you need to make the same transformations to the test set as you did to yur train set
 brave granite
can anyone get voice chat and help mw with SQLite studio not rushing anyone'
 mint palm
Confusion_matrix doesnt affect the model, right?
Its just for our own reference
I knew it but i just changed a attribute of confusion matrix, even though i have seeded everything as far as i know my accuracy has started to dance
Lifes tough😫
brave granite
[21:23:12] Error while executing SQL query on database '4005_coursework': foreign key mismatch - "Attendant_detail" referencing "Genrel_flight_detail" i keep geting this error
steady basalt
thanks for the help, I have almost got the submission done
tacit basin
mint palm
I knew it but i just changed a attribute of confusion matrix, even though i have...
did you train model again? if not then how it's possible that stuff changed?
steady basalt
lets see for any more error
mint palm
I trained again but seeded every thing, dont know how
 tacit basin
mint palm
I trained again but seeded every thing, dont know how
tacit basin
mint palm
I trained again but seeded every thing, dont know how
there is a lot of stuff to seed in python...
 tacit basin
steady basalt
tacit basin
steady basalt
you need to apply the same transforms to test set as you applied to train set whentraining the model
tacit basin
steady basalt
I did i did
perhaps not?
steady basalt
deffo did
mint palm
I will see to it...
tacit basin
steady basalt
deffo did
most likely not 🙂 computers are usually right 🙂
steady basalt
the error here is because regression expects something else, didnt think it worked that way tho
tacit basin
steady basalt
the error here is because regression expects something else, didnt think it work...
model is expectin the same data fromat, shape as it was trained with, so you need to apply alll the transforms to test set as you applied to train set when you trained the model
steady basalt
I thought it fits the model regardless like linear regression?
tacit basin
steady basalt
I thought it fits the model regardless like linear regression?
test set need to have all transforms applied as train set
tacit basin
steady basalt
test_df and train_df underwent the same transformations
can you show this code?
 tacit basin
steady basalt
before assigning x and y
tacit basin
steady basalt
before assigning x and y
what do you mean before assigning x and y?


 tacit basin
why error say X has xxx columns? shuld it be test_df?
how about number of cols in test set that you want to predict on and in the X_train dataframe?
steady basalt


this is because i cudnt take the bool along with the objects from earlier
as u cant use OR in the statement when creating cat table
i.e object OR bool
tacit basin
minmaxscaler fit_transform on train set and transform on test set (tehe same scaler), the same problem as with splitting, data leakage, but this is not the problem for this error, but also a problem in general
eager wedge
How do I see the image in a .mat file?
tacit basin
steady basalt
is this a serious mistake
data leakage. normally you don't know the test set, so you need to treat it as such. when you fit scaler on test date, its cheating / data leakage
tacit basin
eager wedge
How do I see the image in a .mat file?
what is .mat file?
eager wedge
idk, but it is supposed to have an image
steady basalt
im minmax scaler on test set with its own fit
tacit basin
steady basalt
probably best to fix this error first
yes. if you do shape/size for your train set (the one that yu trained a model on) and shape/size for transformed test set. what do you get? shuld be same
steady basalt
u can see x2 is using test values
tacit basin
steady basalt
im minmax scaler on test set with its own fit
minmaxscaler fit on train set and transform on trian and the same one transform on test set
tacit basin
steady basalt
u can see x2 is using test values
it should not

 serene scaffold
Just to interject: every time you fit, you completely reset the preprocessor. fit_transform is actually two operations--it's just there for convenience.
tacit basin
steady basalt
test_df_num_scaled = min_max_scaler.transform(test_df_num.values)
steady basalt
@serene scaffold did you work out why i am getting the logistic error
serene scaffold
steady basalt
<@!253696366952316929> did you work out why i am getting the logistic error
No. I don't look at screenshots of text (including code or error messages)
steady basalt
tacit basin
test_df_num_scaled = min_max_scaler.transform(test_df_num.values)
same for train?
tacit basin
steady basalt
same for train?
train you got it right
steady basalt
serene scaffold
No. I don't look at screenshots of text (including code or error messages)
the error is that when doing the clf predict the logisticregression expected size x but i am giving it y

?
serene scaffold
steady basalt
the error is that when doing the clf predict the logisticregression expected siz...
it looks like miwojc is helping you anyway. In the future, if you ask questions where you don't post screenshots of the code or the error messages, but do provide them as text, I may attempt to answer as I'm available.
tacit basin
steady basalt
the error is that when doing the clf predict the logisticregression expected siz...
waht's the size of you train (the one that you trianed mode on) set and test set (the one that you want to make prediction)?
steady basalt
do you mean the dataframes kaggle provides, or train/test after split
tacit basin
steady basalt
do you mean the dataframes kaggle provides, or train/test after split
i mean the dataframes you trained yourmodel on and the one that you want to predict on and gives you error
they should be the same in terms of number of features. the errror you get suggest that they are not.
 tacit basin
steady basalt
X_train and y_train
tacit basin
steady basalt
X_train and y_train
ok and the one you want to predict on?
steady basalt
(4277, 13)
tacit basin
steady basalt
(4277, 13)
exactly they are not the same
steady basalt
this error was solved
the new one is
ValueError: X has 3282 features, but LogisticRegression is expecting 6577 features as input.
tacit basin
they need to be the same
tacit basin
steady basalt
ValueError: X has 3282 features, but LogisticRegression is expecting 6577 featur...
exactly the model expects different number of features that you provide in test set so you need to apply all transforms to test set as ypu applied to train set
steady basalt
i showed you transforms, didnt they all look the same
tacit basin
steady basalt
i showed you transforms, didnt they all look the same
computer is usually right. so we need to listen to it. 🙂
tacit basin
steady basalt
let me see if i rejoined
yeah i suspect something wasn't perfromed on test set
do you code in notebook?
steady basalt
 tacit basin
but you need to be sure to not delete a cell for example, if you delete a cell the computation perofomed in that cell is still in memeory, etc

 tacit basin
just execute the cells again using restart and run all (if it doesn't take too long to compute)
steady basalt
do u wana watch live
tacit basin
yeah can try this
tacit basin
steady basalt
I dont have permission
in one of the rooms i guess
serene scaffold
We don't give out streaming permissions unless a mod is already there.
steady basalt
u need perms here
 mild dirge
Not sure if completely relevant to the channel, but I am using some sliding window to compare two images. Every time I have to compare two windows of pixels with each other on some kind of distance measure. Currently using sum of squares on the flattened windows, or absolute difference, but is there a better measure?
steady basalt
@serene scaffold It'l just be my chrome
serene scaffold
steady basalt
<@!253696366952316929> It'l just be my chrome
We won't give out streaming perms unless a moderator is already in the vc; sorry
tacit basin
steady basalt
u need perms here
just restart and run all in your notebook, will see if that clear things
steady basalt
ill dm u invite to a server i can stream on (im owner there 😛 )
tacit basin
there is a command like that. first it restarts the notebook so all hidden state is gone and then it runs the code top to bottom to make sure all code is run
i suspect you performed some code on trian that you didn't on test set
steady basalt
i sent u
 jolly knoll
Can the .corr() function be used for binary against integer column values? Does it make sense?
eager wedge
cnn = tf.keras.models.Sequential()
cnn.add(tf.keras.layers.Conv2D(filters=32, kernel_size=3, activation='relu'))
cnn.add(tf.keras.layers.MaxPooling2D())
cnn.add(tf.keras.layers.Conv2D(32, 3, activation='relu'))
cnn.add(tf.keras.layers.MaxPooling2D())
cnn.add(tf.keras.layers.Conv2D(32, 3, activation='relu'))
cnn.add(tf.keras.layers.MaxPooling2D())
cnn.add(tf.keras.layers.Flatten())
cnn.add(tf.keras.layers.Dense(units=255, activation='relu'))
cnn.add(tf.keras.layers.Dense(units=1, activation='softmax'))
cnn.compile(optimizer='adam', loss='categorical_crossentropy', metrics=['accuracy'])
cnn.fit(x=train_set, validation_data=test_set, epochs=25)
What is wrong? Error message: Error occurred when finalizing GeneratorDataset iterator: FAILED_PRECONDITION: Python interpreter state is not initialized. The process may be terminated. [[{{node PyFunc}}]]
 gloomy anvil
Somehow my evaluation of my binary classifier does not add up. This is the evaluation of my model:
True Positive(TP)  =  75
False Positive(FP) =  64
True Negative(TN)  =  47
False Negative(FN) =  34
Accuracy of the binary classification = 0.554545
precision: [0.58024691 0.53956835]
recall: [0.42342342 0.68807339]
fscore: [0.48958333 0.60483871]
support: [111 109]
Now so far it looks good, but I just realized that it doesn't really add up. As I see it support should return the total true values in each class. since I have only two, 75+47= 122 and not 111 for the true class. accordingly the other class should be 98, right? Or do I not understand support correctly? Here for the first class False Positives was added to True Negatives. That doesn't make sense, does it?
So either I do not understand what support means, or maybe my code is wrong, but I looked at the documentation and made sure, that the values returned are assigned accordingly for the confusion matrix as well as precision_recall_fscore_support.
eager wedge
If my CNN has a 100% accuracy, does that mean there is something wrong?
serene scaffold
eager wedge
If my CNN has a 100% accuracy, does that mean there is something wrong?
it probably means that you're overfitting, or (though some accident) the training data is in the test data.
 brave sand
does anyone know how to install box2d?
eager wedge
serene scaffold
it probably means that you're overfitting, or (though some accident) the trainin...
ok, thx
mild dirge
eager wedge
ok, thx
Make sure you have enough points to test on too
100% would be pretty likely if you have a hand-full of datapoints to test on
eager wedge
I found the problem, but I got a point where my training accuracy was very high, but my test accuracy was still 70%. I do not believe I am overfitting my data as it peaked at around 70%. What could be the problem?
 distant berry
is it possible with python you can controle a servo with your mouse
mild dirge
eager wedge
I found the problem, but I got a point where my training accuracy was very high,...
Having a really high training accuracy and a much lower test accuracy is probably the most clear sign of over-fitting on your training data
Can solve this by trying to use a less complex neural network (remove a layer, or reduce amount of nodes), can also try training for less epochs
 fresh moss
Hello.. is anyone familiar with data analysis or text classification? I want to ask a few things because my final project takes that topic.. 🥺
 royal crest
Don't ask to ask, just ask.
 misty flint
fresh moss
Hello.. is anyone familiar with data analysis or text classification? I want to...
misty flint
fresh moss
Hello.. is anyone familiar with data analysis or text classification? I want to...
just ask
if people can answer/are free, they will
misty flint

LinkedIn
Learn the principles of supporting DevOps and how to apply them to data science.
pretty good resource
if you need to deploy models
misty flint
mild dirge
Not sure if completely relevant to the channel, but I am using some sliding wind...
basically this https://datascience.stackexchange.com/questions/48642/how-to-measure-the-similarity-between-two-images
but usually you get improvements when there is some image processing done beforehand

Data Science Stack Exchange
I have two group images for cat and dog. And each group contain 2000 images for cat and dog respectively.
My goal is try to cluster the images by using k-means.
Assume image1 is x, and image2 is y.
but dont ask me since CV isnt my specialty
i miss raggy since he could give the SoTA on this type of stuff
guy wrote blogs about convolution

fresh moss
misty flint
https://www.linkedin.com/learning/devops-for-data-scientists/
woah thank youu ^^
For my final project to get a bachelor's degree, I wanna perform text data analysis using machine learning, specifically the Bert method. I wanna get words that appear frequently based on certain keywords... Then from the words that often appear, I can find out what other people often mention when discussing those keywords. Is it a text classification?? or anybody have any advice about my method or general description of the project?
 pseudo wren
I am attempting sentiment analysis for the first time on a csv and am not totally sure how to fully approach this
the goal of this project is to make visualizations out of dating app reviews

i am looking to make 3 visualizations out of three key pieces of data
the first is how many times to negation words show up in good reviews vs bad reviews
what are the similarities between neutral reviews and good reviews
and what words are more likely to show up with a 3 star rating and above or 2 and below
to accomplish this, i know i will need to do work on sentiment analysis
i've looked up a few tutorials and understand a good bit of what i'm supposed to do but am not totally sure how i want to code this
mint palm
i just realised i use Label encoding to represent X while training and One_hot encoding for representing output Y
so thats actually two types of encoding
so will changing encoding of Y affect my accuracy?
cuz i will actually have to changing last layer's dimension as well according to Y encoding
 warm stirrup
hey guys, was wondering if you could help me work out how to create a chart like this where the data labels (columns of a dataframe) are depicted on their respective lines (instead of a legend on the side etc)

been googling for ages and haven't found anything, feel like it should be a simple change somewhere
 still dirge
warm stirrup
been googling for ages and haven't found anything, feel like it should be a simp...
still dirge
warm stirrup
been googling for ages and haven't found anything, feel like it should be a simp...
https://stackoverflow.com/questions/52666450/put-text-label-at-the-end-of-every-line-plotted-through-matplotlib-with-three-di this seems to be what you're looking for?

Stack Overflow
I am having four different lists-
x=['18ww25', '18ww27', '18ww28', '18ww28.1', '18ww29', '18ww29.1', '18ww29.2']
r=[[27, 27, 27, 27, 27, 27, 27, 43, 43, 43],
[18, 18, 20, 23, 30, 30, 30, 16, 1...
 bold timber
Hi, I have a problem like this. Why I get an error "ValueError: Data must not be constant." ?
 tacit basin
bold timber
Hi, I have a problem like this. Why I get an error "ValueError: Data must not be...
tacit basin
bold timber
Hi, I have a problem like this. Why I get an error "ValueError: Data must not be...
where it fails in your code?
 abstract sundial
I'm doing some optimization using scipy methods but the input matrix is something like 16GB and my RAM is only like 8GB, any suggestions for what I could do?
tacit basin
abstract sundial
I'm doing some optimization using scipy methods but the input matrix is somethin...
Try if dask supports these methods
abstract sundial
tacit basin
Try if dask supports these methods
I'm looking for the linear programming methods but I don't think dask has it
steady basalt
@tacit basin It runs now but kaggle says failed to save
why does kaggle get error and not me lol


oh you have no name it how they want?
0.50689
V4
: (((((
ok its terrible score
I See others get a good score fill na likethis

do yu have to do it feature by feature? I thought it works to just do it once for entire df
doenst that command fillna each row by each rows median
Can anyone explain to me why people do this?
Because a df median command calculates every columns median value by defualt
Hence why I split into categorical and numerical tables
tacit basin
steady basalt
oh you have no name it how they want?
yes correct
 green zinc
steady basalt
Hence why I split into categorical and numerical tables
green zinc
steady basalt
Hence why I split into categorical and numerical tables
you can take a sample and test if it does the same or if its behaviour is different. If its the same maybe there is something else which is different on better submissions
Can you link me the competition?
tacit basin
steady basalt
do yu have to do it feature by feature? I thought it works to just do it once fo...
i think you are right
df = pd.util.testing.makeMissingDataframe()
df_1 = df.fillna(df.median())
df.A.fillna(df.A.median(), inplace=True)
df.B.fillna(df.B.median(), inplace=True)
df.C.fillna(df.C.median(), inplace=True)
df.D.fillna(df.D.median(), inplace=True)
df.equals(df_1)
returns True
mild dirge
misty flint
basically this https://datascience.stackexchange.com/questions/48642/how-to-meas...
Already used sum of squared differences and cross correlation, but appreciate the reply
All other suggestions in that thread would have been too computationally heavy (it already took like 10 seconds for an image, also using multiprocessing)
tacit basin
green zinc
Can you link me the competition?
space titanic or something like that
 odd mason
Stack Overflow
I am trying to make forecasting with LSTM but when I do MinMax Normalization my prediction is being terrible. When I check autocorrelation, data looks stationary before and after MinMax normalizati...
steady basalt
tacit basin
i think you are right
```py
df = pd.util.testing.makeMissingDataframe()
df_1 = d...
So people do this cause they wana just write longer code? I don’t get it
It’s a pattern I see constantly on Kaggle
@tacit basin also logistic regression only scored 0.5 for some reason, is it my fault or the model is no use, have you tried
tacit basin
steady basalt
It’s a pattern I see constantly on Kaggle
i guess ppl just copy others code
tacit basin
steady basalt
<@!490342783572246538> also logistic regression only scored 0.5 for some reason,...
it's usually baseline model, but from the comparison i found there in one of hte notebooks accuracy could be around 0.7
i didn't do this comp myself
other technique for missing data is that apart from imputting median you can also create a new column which will have information that data was missing there. depends on data but sometimes information that data was missing is also important. you do it for all columns with missing data
steady basalt
tacit basin
it's usually baseline model, but from the comparison i found there in one of hte...
Do you have any idea why I got 0.5
You saw my method I would expect at least 0.7
I mean the regression literally totally missed
tacit basin
not sure, i can only repeat after Jeremy Howard, "I hate machine learning" 🙂
steady basalt
Maybe I trained and tested on the wrong data
I don’t think that if it’s done correctly it would find 0 relationship
Like 0.5 is basically just random thesses
Guesses
Or maybe Kaggle score is not accuracy
I should check accuracy
 hollow sentinel
anyone ever heard of pyforest?
pretty cool stuff
just lazily imports your typical data science python packages
so once i do pip install pyforest in my terminal i can just start using pandas, matplotlib etc. instantly and check what libraries i have with active_imports()
pretty slick stuff
 spring marsh
can someone here help me open jupyter notebook on a virtual ubuntu machine I am using aws EC2? I am getting permission denied errors
 arctic crown
is pytorcxh used for ml or dl
serene scaffold
arctic crown
is pytorcxh used for ml or dl
pytorch is used for deep learning, and deep learning is a subset of machine learning.
what matters is where it is in relation to the current working directory, which you can get with os.getcwd()
arctic crown
serene scaffold
pytorch is used for deep learning, and deep learning is a subset of machine lear...
okay, i need a ml libary with a bit of an easy syntax any recomendations?
lapis sequoia
Thanks I resolved it
serene scaffold
arctic crown
okay, i need a ml libary with a bit of an easy syntax any recomendations?
what are you trying to do?
arctic crown
learn ml
serene scaffold
arctic crown
learn ml
that's going to be quite an undertaking. you should probably find a book that teaches it from the basics.
arctic crown
serene scaffold
that's going to be quite an undertaking. you should probably find a book that te...
instead is there any online course i can take?
serene scaffold
arctic crown
instead is there any online course i can take?
I've heard people recommend Andrew Ng's course, but I haven't taken it. Keep in mind that ML requires university-level math.
spring marsh
@serene scaffold can u please check #help-carrot
serene scaffold
spring marsh
<@!253696366952316929> can u please check <#696840664435916950>
No, I don't engage with questions that involve screenshots of text. Sorry.
lapis sequoia
Btw guys, i have a question. How important are the libraries like matplotlib, seaborn and pandas. I am learning them in college. But they basically go through it all in one class. I wanted to know if I should spend time on it myself to understand various syntaxes and their roles better. Or just having a rough idea would suffice and I can look up the rest as per requirements.
serene scaffold
lapis sequoia
Btw guys, i have a question. How important are the libraries like matplotlib, se...
So, no library has "syntax". Syntax is part of the language. That said, I wouldn't recommend "learning libraries". I would learn how to do different things, and figure out how to use the libraries to arrive at the solution.
misty flint
mild dirge
All other suggestions in that thread would have been too computationally heavy (...
10 seconds even with multiprocessing? thats wild. maybe shouldve tried some PCA or Autoencoding or another dimensionality reduction technique
arctic crown
serene scaffold
I've heard people recommend Andrew Ng's course, but I haven't taken it. Keep in ...
i am in grade 11, can i still do it?
lapis sequoia
arctic crown
i am in grade 11, can i still do it?
Have you studied matrices yet?
serene scaffold
arctic crown
i am in grade 11, can i still do it?
you can always try, and I'm sure you'll learn something
lapis sequoia
In our school they were in 12th class
arctic crown
lapis sequoia
Have you studied matrices yet?
not yet
lapis sequoia
They actually give a review at the start. So you can try it out.
mild dirge
misty flint
10 seconds even with multiprocessing? thats wild. maybe shouldve tried some PCA ...
To give a bit of context, I have two images from a stereo camera (left and right) and try to find corresponding pixels. Then calculate the horizontal distance between corresponding pixels to get disparity (can be sued for a depth map) @misty flint
lapis sequoia
serene scaffold
So, no library has "syntax". Syntax is part of the language. That said, I wouldn...
Makes sense, ty.
mild dirge


And to find the pixel corresponding to each left pixel, I use this distance function on multiple windows of the right image, which does take a bit of time
So I don't think pca would be super helpful in reducing computation time as the problem is more having a lot of comparisons, instead of super complex comparisons
misty flint
hollow sentinel
pretty slick stuff

ah i see
thats tough tbh and seems more like a computing problem
hollow sentinel
it's like standard libraries like visualization and computational /cleaning stuff like numpy pandas etc.
idk if it adds scipy and scikitlearn
or statsmodels
haven't looked deep into it enough, maybe later today
misty flint
misty flint
thats tough tbh and seems more like a computing problem
honestly i feel like ive seen this type of problem before in my feature engineering class
i would have to look at my notes since i dont remember the approach + im not a CV guy
hollow sentinel
would you guys say that feature engineering falls under the category of exploratory data analysis?
or is it the next step of the process
like after EDA
misty flint
yeah
 pastel valley
yo in cnn models
convolutional layers are like the one learning or extracting features?
then the dense layers are the one understanding those features and adjusting neurons to match the class?
misty flint
hollow sentinel
like after EDA
feature engineering (in ML world not SWD) is basically creating meaningful variables to use for your model
hollow sentinel
yes
misty flint
so you typically do it after understanding your data better
hollow sentinel
i see
yeah, that makes sense
i think people really underestimate eda
when they first come into the field
hollow sentinel
they like jam their data into the model and then just pull metrics without understanding the data
i'm guilty of this ^^^
but i'm improving
misty flint
sometimes you never know what you might find so you have to pursue more stuff
so EDA by nature is hard to time-box
misty flint
hollow sentinel
💀
serene scaffold
misty flint
so EDA by nature is hard to time-box
just get a bigger time box, like a tardis.
hollow sentinel
put yourself on another planet
so seconds are millenia
💀
all jokes aside, once you get better at eda you will be able to do it more effectively
and efficiently
 odd meteor
1. Supervised Learning: This is the type of machine learning where the labels of the data are known.
Example
Regression & Classification
2. Unsupervised Learning: This is the type of machine learning where the labels of the data are unknown.
Example
Clustering
3. Semi-supervised Learning: This is the type of machine learning that uses the combination of supervised and unsupervised learning. That means you can train a model to label data without having to use as much labelled training data.
Example
Using clustering algorithm to get the target labels for a classification problem
4. Self-supervised Learning: This is type of machine learning that obtains supervisory signals from the data itself, often leveraging the underlying structure in the data. The basic concept of self-supervision relies on encoding an object successfully. Technically, a computer capable of self-supervision must know the different parts of any object so it can recognize it from any angle. Only then can it classify the thing correctly and provide context for analysis to come up with the desired output
Example
In NLP, we can hide part of a sentence and predict the hidden words from the remaining words. We can also predict past or future frames in a video (hidden data) from current ones (observed data). The closest we have to self-supervised learning systems are “Transformers.” These are ML models that successfully use natural language processing (NLP) without the need for labelled datasets.
5. Reinforcement Learning: This is the type of machine learning that deals with the behaviour of agents in an environment where they must make decisions in order to maximize some notion of cumulative reward. In Reinforcement Learning (RL) agents are trained on a reward and punishment mechanism. The agent is rewarded for correct moves and punished for the wrong ones. In doing so, the agent tries to minimize wrong moves and maximize the right ones.
steady basalt
anyone know how to make this xgboost regressor work when the y is categorical
not going to onehot encode every single id surely?
its better to switch to classifier?
odd meteor
odd meteor
**1. Supervised Learning**: This is the type of machine learning where the label...
cc: @serene scaffold
steady basalt
oh im an idiot nvm
Experimental support for categorical data is not implemented for current tree method yet.
What does this mean
guess i have to encode the y column as its True and False
and then remerge it?
serene scaffold
odd meteor
**1. Supervised Learning**: This is the type of machine learning where the label...
@odd meteor YAY
steady basalt
Dammit, y has to be not encoded
did you ever jsut give up? like I can sit for 15 hours and still not manage to make it work
guess u have to map true and false to 1 and 0 and keep 1 col
RMSE: 0.492661
 odd meteor
steady basalt
anyone know how to make this xgboost regressor work when the y is categorical
odd meteor
steady basalt
anyone know how to make this xgboost regressor work when the y is categorical
If your label is discrete, then it's definitely a classification problem. So if you're using pd.get_dummies() you can OHE and use drop_first = True or you can convert the label from categorical to numeric using either replace or map method
 half kraken
lapis sequoia
pls help on how to run pip on idle
half kraken
lapis sequoia
pls help on how to run pip on idle
i think cant
lapis sequoia
half kraken
i think cant
i cant run pip?
then?
bruh
do you know how to hack?
||i think you dont kow||
know
odd meteor
lapis sequoia
pls help on how to run pip on idle
If you're using JNB, do
import sys
!{sys.executable} -m pip install the_name_of_the_library
As supposed, ensure your Internet connection is turned on before running the cell.
odd meteor
lapis sequoia
what is jnb
Sorry, It's Jupyter Notebook.
tacit basin
odd meteor
If you're using JNB, do
```py
import sys
!{sys.executable} -m pip install the_n...
What sys.executable is for?
Would that be equivalent to '%pip install libname' ?
 wheat ice
don't ping random people for any reason please
steady basalt
odd meteor
If your label is discrete, then it's definitely a classification problem. So if ...
I just did astype int
and it converts to 1 and 0
odd meteor
tacit basin
What sys.executable is for?
I once was advised that using pip to install packages directly from JNB isn't so cool as it could mess up a lot of things for me.
So using sys.executable installs the package in its absolute path so it can be globally accessible.
tacit basin
odd meteor
I once was advised that using pip to install packages directly from JNB isn't so...
I need to check what %pip install magic does. Possibly similar?
 urban lance
can you map an ID to a row index (so when you drop the id column, you get get the right values back afterwards 🤔 )
I don't wanna cluster with the IDs
(Im dropping the IDs before I use a subset of athe dataframe to cluster
tacit basin
odd meteor
I once was advised that using pip to install packages directly from JNB isn't so...
Yeah looks the same
%pip
Run the pip package manager within the current kernel.
Usage:
%pip install [pkgs]
https://ipython.readthedocs.io/en/stable/interactive/magics.html#magic-pip
steady basalt
After making some changes I get error submission csv not found?
I definitely turned it to_csv as it worked on a prior version
odd meteor
tacit basin
I need to check what %pip install magic does. Possibly similar?
I actually have no idea. But I confirmed what I was told after reading about the implications online.
https://link.medium.com/MYclPvv3uob

Medium
Installing packages globally and locally
tacit basin
odd meteor
I actually have no idea. But I confirmed what I was told after reading about the...
Thanks. They didn't mention %pip magic for some reason
lapis sequoia
Guys. I am only able to do one operator at a time on a pandas series. How can I get an interval?
Like 0<series<20
Rn I am only able to do either 0<series or series<20
steady basalt
Use brackets ?
Do post solution when you find it, I expect it’s similar to when you use WHERE with brackets
lapis sequoia
Actually the bracket only solved individual series. It's still not getting processed as whole.
 odd meteor
lapis sequoia
odd meteor
lapis sequoia
Remove the 0 < you added in front of all the conditions.
misty flint
odd meteor
**1. Supervised Learning**: This is the type of machine learning where the label...
bro did you type all this on your phone? i was wondering if you were going to send a message earlier
but yeah thanks for doing this
should help beginners a lot
odd meteor
misty flint
bro did you type all this on your phone? i was wondering if you were going to se...
😀 Thanks. I used my pc to type it.
steady basalt
lapis sequoia
Actually the bracket only solved individual series. It's still not getting proce...
I had this error yesterday
It’s because u can’t use OR with pandas dtypes
I think u need |
Well u used and
Coredrlt
Correctly
lapis sequoia
odd meteor
Remove the `0 < ` you added in front of all the conditions.
Why lol
odd meteor
lapis sequoia
I need the 0<
Can you briefly explain what exactly you wanna do?
misty flint
mild dirge
So I don't think pca would be super helpful in reducing computation time as the ...
i looked at my slides and your problem reminded me of this concept https://en.wikipedia.org/wiki/Scale-invariant_feature_transform
does it have to be comparing exact pixels? or can you compare image features? if so, you can use this approach. matlab has a bunch of functions for this if so.
The scale-invariant feature transform (SIFT) is a computer vision algorithm to detect, describe, and match local features in images, invented by David Lowe in 1999.
Applications include object recognition, robotic mapping and navigation, image stitching, 3D modeling, gesture recognition, video tracking, individual identification of wildlife and ...
lapis sequoia
Put up a constraint on the values. They have to be greater than zero and less than a value
misty flint
misty flint
i looked at my slides and your problem reminded me of this concept https://en.wi...
 lapis sequoia
I looked online about np.logical_and but it's killing my kernel for some reason
odd meteor
lapis sequoia
Why lol
Because removing it will get your code to run and output the dataframe that satisfies the set conditions
lapis sequoia
It wouldn't give me a data frame which satisfies the conditions. There are negative values too in the df
I need to remove them
tacit basin
lapis sequoia
Guys. I am only able to do one operator at a time on a pandas series. How can I ...
df.query("1 < A < 2")
A is col name
odd meteor
lapis sequoia
I need to remove them
I understand now. You would have to bring the 0 < condition inside the bracket as well.
Or better still you can use for loop
tacit basin
odd meteor
I understand now. You would have to bring the `0 <` condition inside the bracket...
For loop in pandas code? Can you give example?
 desert oar
tacit basin
For loop in pandas code? Can you give example?
desert oar
tacit basin
For loop in pandas code? Can you give example?
pandas is still just a python library. you can combine it with literally any other python code
tacit basin
desert oar
pandas is still just a python library. you can combine it with literally any oth...
Correct. But using for loop with pandas it's usually a code smell no?
desert oar
often, but not always. it depends on what you are looping over and why
e.g. if you are looping over a list of data frames, there's no problem with that
and sometimes you do actually need to use a loop
tacit basin
desert oar
often, but not always. it depends on what you are looping over and why
I agree
That's why I was interested to see the loop that was suggested for this example. As df.query("1 < A 2") does not need loop i think
lapis sequoia
desert oar
and sometimes you do actually need to use a loop
yeah, other thing may be to create a bunch of columns with some condition.
however for creating one col using others, .apply works even in worst case IMO.
assuming multiple rows' data is not required
however in above case by Kolv loves, .apply will work perfectly.
desert oar
lapis sequoia
Rn I am only able to do either 0<series or series<20
just use &, pandas doesn't support a between operator, and it doesn't implement operator "chaining" like for base python types
actually my mistake, it does have a between method!
!d pandas.Series.between
 arctic wedgeBOT
Series.between(left, right, inclusive='both')```
Return boolean Series equivalent to left <= series <= right.

This function returns a boolean vector containing True wherever the corresponding Series element is between the boundary values left and right. NA values are treated as False.was just gonna share it lol
desert oar
yeah i didn't know about this. well that should solve the original problem at any rate
@lapis sequoia ☝️ see above
steady basalt
@lapis sequoia solved?
Lemme get this straight
This function allows u to say
Dtype object & bool
?
When selecting data
From a data frame
Cuz that’s something I never was able to find out
lapis sequoia
Oh
So do I use series.between &series.between &series.between &series.between
Like that?
Yeah
arctic wedgeBOT
Hey @lean kindle!
It looks like you tried to attach file type(s) that we do not allow (). We currently allow the following file types: .gif, .jpg, .jpeg, .mov, .mp4, .mpg, .png, .mp3, .wav, .ogg, .webm, .webp, .flac, .m4a, .csv, .json.
Feel free to ask in #community-meta if you think this is a mistake.
 lean kindle
Hello, I am trying to extract invoice data from an image with easyocr. I have written a python code to extract the fields after creating bounds (boxes ) around the texts in the invoice. But my output dataframe is mixing the rows. Can anyone please advise and help ?
Desired output is this


 quasi parcel
Hello everyone, i hope everyone is doing well
i have a problem
there are two data frames
let me share the sample
i need to compare 4th column in df1 with pincode column in df2
and get df1 1st column if it matches and assign to another df column
can anyone help
i tried these
pincodes_df['warehouse_id']=warehouses_db_df.loc[warehouses_db_df['pincode'].isin(pincodearr), 'id']
pincodes_df['warehouse_id']=warehouses_db_df.loc[warehouses_db_df['pincode'].isin(pincodearr), 'id']
so basically these i have tried
even though the pincodes matches
the data is empty for pincodes_df['warehouses_id']
can some one please help me its really urgent
please
i am requesting everyone
 agile cobalt
quasi parcel
i am requesting everyone
agile cobalt
quasi parcel
i am requesting everyone
in case you still need of help: see https://pandas.pydata.org/pandas-docs/stable/user_guide/merging.html
sounds like you wanted something kind like that? ```pycon
df1.merge(df2, left_on=4, right_on="Pincode").iloc[0]
0 124618
1 VIGINI
2 LKO_PPMP_01
3 NaN
4 201301
5 NaN
6 Gautam Buddha Nagar
7 UTTAR PRADESH
8 NaN
9 2250669
10 2022-03-18 01:56:49
11 2022-03-18 01:56:49
Warehouse code BLR_PPMP_01
Product type DG
Pincode 201301
City GAUTAM BUDDHA NAGAR
State Uttar Pradesh
Zone North
Country IN
Warehouse SLA 1
Courier SLA 3
Days to deliver 4
COD courier BLUEDART
PG courier BLUEDART
RPU courier DELHIVERY
Exchange courier DELHIVERY
``` you can slice which columns you want to keep fromdf2before merging
lapis sequoia
steady basalt
<@456226577798135808> solved?
Yup. Between function worked well
agile cobalt
the stickers are very cursed... don't mind them
lapis sequoia
agile cobalt
 jagged summit
Do I need to learn math?
jagged summit
Do I need to learn math?
you need to understand linear algebra and some calculus / probability stuff in order to understand how things work
agile cobalt
"how to play """"a game""""" is fairly advanced. No clue about where to start
lapis sequoia
jagged summit
On yt?
Ye
agile cobalt
tbh I would just google "flappy bird ai" and go to whichever videos I find, then poke around the github repository or look up terms they use

Lean how to program an AI to play the game of flappy bird using python and the module neat python. We will start by building a version of flappy bird using pygame and end by implementing the evolutionary neat algorithm to play the game.
Get a free $20 credit when you sign up at this link: https://www.linode.com/techwithtim
Thanks to Linode for...
lapis sequoia
Which level of education are you in.
Guys I had to clean a dataset. I added the value constraints, stripped whitespaces, dropped empty values, removed delimiters and there was a total column, I removed the observations whose sum was not adding up to total column.
Is there something else I can check for? Other than domain specific things.
steady basalt
jagged summit
Do I need to learn math?
If you want to really understand how it works on a deep and real level, yes
agile cobalt
lapis sequoia
Guys I had to clean a dataset. I added the value constraints, stripped whitespac...
keep in mind that "dropping empty values" is not something you should always do
steady basalt
Tbh I don’t even know how a lot of it works mathematically
agile cobalt
and it should be worth it to investigate the rows whose sums do not match the total before dropping them
 soft seal
Minimax guide for Dummies book pls
steady basalt
lapis sequoia
Guys I had to clean a dataset. I added the value constraints, stripped whitespac...
Instead of drop empty values did you try replacing them with medians or modes
lapis sequoia
It's not for my company or anything 🤪
But yes I know about replacing it with mean is also possible. Still would have had to drop the string empty values
steady basalt
jagged summit
How tp play a game
That’s an extremely hard thing to do from scratch btw. I’d say even experienced developers find that hard
I’d say ignore maths and learn coding
Focus on
steady basalt
lapis sequoia
But yes I know about replacing it with mean is also possible. Still would have h...
What do u mean string empty values
lapis sequoia
Umm. Like. A column of car brands with empty entries
steady basalt
lapis sequoia
Umm. Like. A column of car brands with empty entries
Replace empty with mode, the most frequent brand
steady basalt
Theroritdally it’s the most likely right
And maybe cuz u end up with more data points it perform better than deleted
Even if some are wrong
Depends o the distribution
lapis sequoia
Can I get median mode directly like mean?
Column.median()?
steady basalt
That’s median not mode
But yes there’s a fillna command which u then set the argument to mode
steady basalt
Yes
lapis sequoia
Yes
steady basalt
What do u do
lapis sequoia
I could have done that extra work. But I just dropna()'ed that shit. Haha
lapis sequoia
steady basalt
What do u do
I am in college. Studying a paper named "practical data science"
steady basalt
What’s ur major
lapis sequoia
Data science. First sem
steady basalt
Oh nice
That’s a very hard degree at certain unis
Especially the coding and maths
lapis sequoia
Not at mine
soft seal
Sorry to interrupt, but does anyone have any useful guides on Minimax? I want to learn it to apply into Tic Tac Toe but I want to see examples that arent "perfect", this way I have something to improve and work on
steady basalt
In the uk it’s omega hard
lapis sequoia
Mine doesn't have much maths. More applied
 steady basalt
Sorry bro I don’t use
lapis sequoia
@steady basalt hbu? Are you working?
lapis sequoia
soft seal
I'll just work it out <:brainmon:439516188771483658> <:brainmon:4395161887714836...
Good luck mate!
soft seal
@lapis sequoia thanks ;)
steady basalt
lapis sequoia
Mine doesn't have much maths. More applied
Dude I saw my friends assignment for his DS masters and almost fainted
Like it was grad level probability problems and coding AI from scratch first semester
I am also a masters student but mines also fairly applied like u, cause it focuses on medical data
Except for Danm stats and ML modules
lapis sequoia
Yes I have seen US masters DS syllabus. They have good amount of maths
What I learn at uni is more like bootcamp material
lapis sequoia
steady basalt
I am also a masters student but mines also fairly applied like u, cause it focus...
Is the uni good though?
Good teachers?
steady basalt
@lapis sequoia yes it’s one of the best in world
In terms of rankings etc
But no so far admins been quite stressful so has teaching some sessions have tech issues and stopped us doing anything
steady basalt
It’s pretty depressing how any FAANG company internship requires a PhD
Bastards !
Don’t want to do a PhD for academia but it’s starting to look more and more required to earn a lot
misty flint
have you ever tried to rewrite queries without knowing db schema, db fields, or even tables?
i highly, highly do not recommend
idk how they expect this to get done
just let me read minds i guess
i feel like if you want anything you have to give db access
 plucky saddle
Where’s a good place i can get sample data to test my linear regression formula?
Basically just want a bunch of points with a trend
steady basalt
California uni
desert oar
plucky saddle
Where’s a good place i can get sample data to test my linear regression formula?
figuring out how to create your own is a great exercise
soft seal
Well, the logic wasn't perfect, but I managed to build the Minimax. Only problem is, it doesn't know how to win 
lean kindle
lean kindle
Hello, I am trying to extract invoice data from an image with easyocr. I have wr...
Hello everyone. I humbly request everyone to please have a look and guide me if possible 😖🙏🏻
tacit basin
lean kindle
Hello everyone. I humbly request everyone to please have a look and guide me if ...
you define idx and i in the loop and dont' use that?
perhaps not the issue you describe but every little helps.
also can you paset your code here
!code
arctic wedgeBOT
Here's how to format Python code on Discord:
```py
print('Hello world!')
```
These are backticks, not quotes. Check this out if you can't find the backtick key.
wheat ice
he-he-he-he-heeelp
i am using pandas..
so i have data like this
VENDOR1
ITEM1
ITEM2
ITEM3
VENDOR2
ITEM1
ITEM2
ITEM3
VENDOR3
ITEM1
ITEM2
ITEM3
these items are not unique
but i need to be able to categorize them by their vendor
and the way i do that i just the order of the rows.
all the items under VENDOR1 are from VENDOR1 until i hit a new vendor
for some of these vendors, there are some characteristics in the item names that i can use to distinguish what vendor they are from
but for a couple vendors, the patterns overlap, so i'm going to have to rely on the ordering of the rows in the file i'm pulling from
arctic wedgeBOT
Hey @lean kindle!
You either uploaded a .txt file or entered a message that was too long. Please use our paste bin instead.
Hey @lean kindle!
You either uploaded a .txt file or entered a message that was too long. Please use our paste bin instead.
lean kindle
tacit basin
you define idx and i in the loop and dont' use that?
perhaps not the issue you d...
Sorry I am trying to paste the code here.
total_cols = []
all_dates = []
all_prices = []
all_descriptions = []
all_names = []
got_first_date = False
first = 0
appended_name = False
appended_description = False
for idx, i in enumerate(bounds):
# print(i[1])
if i[1] == "Old balance":
break
try:
    all_dates.append(parse(bounds[first][1]))
    got_first_date = True
    first += 1
    continue
except:
    pass
if not got_first_date:
    total_cols.append(bounds[first][1])
    first += 1
    continue

if appended_name == False:
    all_names.append(bounds[first][1])
    first+=1
    appended_name = True
    appended_description = False
    continue
if appended_description == False :
    all_descriptions.append(bounds[first][1])
    first+=1
    appended_name = False
    appended_description = True
    continue
@tacit basin
This is the output I am getting

😦
tacit basin
lean kindle
Sorry I am trying to paste the code here.
total_cols  = []
all_dates = []
all_prices = []
all_descriptions = []
all_names = []
got_first_date = False

first = 0
appended_name = False
appended_description = False
for idx, i in enumerate(bounds):
    # print(i[1])
    if i[1] == "Old balance":
        break

    try:
        all_dates.append(parse(bounds[first][1]))
        got_first_date = True
        first += 1
        continue
    except:
        pass
    if not got_first_date:
        total_cols.append(bounds[first][1])
        first += 1
        continue

    if appended_name == False:
        all_names.append(bounds[first][1])
        first+=1
        appended_name = True
        appended_description = False
        continue
    if appended_description == False :
        all_descriptions.append(bounds[first][1])
        first+=1
        appended_name = False
        appended_description = True
        continue
!code
arctic wedgeBOT
Here's how to format Python code on Discord:
```py
print('Hello world!')
```
These are backticks, not quotes. Check this out if you can't find the backtick key.
tacit basin
@lean kindle ☝️ that's how you paste code with syntax
tacit basin
lean kindle
total_cols = []
all_dates = []
all_prices = []
all_descriptions = []
all_names ...
so you enumerate bounds but not use the i and idx, i wonde why?
lean kindle
Actually I tried with idx but I am unable to convert lists into dataframe. So I tried this code
lean kindle
tacit basin
```py
total_cols = []
all_dates = []
all_prices = []
all_descriptions = []
all_...
This is what I tried
tacit basin
lean kindle
This is what I tried
waht is bounds[idx] ?
lean kindle
tacit basin
waht is bounds[idx] ?
I wanted to extract the text from bounds based on indexes. I actually initialized it and couldn’t print the output. Sorry for the confusion but I forgot to remove it.
It’s actually not used
tacit basin
lean kindle
It’s actually not used
can you paset the current code?
plucky saddle
desert oar
figuring out how to create your own is a great exercise
Hmm yeah true, but i kinda also wanted a real world example, so i could kinda predict what might happen next. Randomly generated points doesnt rlly feel the same
 grave frost
plucky saddle
grave frost
plucky saddle
Alr, where could i find that?
tacit basin
plucky saddle
Alr, where could i find that?

Apply what you learned in the Machine Learning course on Kaggle Learn alongside others in the course.
kaggle is full of datasets
misty flint
wheat ice
for some of these vendors, there are some characteristics in the item names that...
interesting. if i was home on my laptop, i might be able to help
wheat ice
you can help later :D im not in a rush. in the meantime i will be iterating
lapis sequoia
which lib is the best for face recognition in games and best performance?
wheat ice
wheat ice
he-he-he-he-heeelp
i am using pandas..
so i have data like this
```
VENDOR1
ITE...
is this the right approach:
!e ```py
import pandas as pd
df = pd.DataFrame(
{"itemdes": ["vendor_a", "thing", "thing", "thing", "vendor_b", "thing", "thing", "vendor_c", "thing", "thing", "thing", "thing"]}
)
for row in df.itertuples():
if "vendor" in row.itemdes:
current_vendor = row.itemdes
df.at[row.Index, "vendor"] = current_vendor
print(df)```
arctic wedgeBOT
@wheat ice :white_check_mark: Your eval job has completed with return code 0.
001 |      itemdes    vendor
002 | 0   vendor_a  vendor_a
003 | 1      thing  vendor_a
004 | 2      thing  vendor_a
005 | 3      thing  vendor_a
006 | 4   vendor_b  vendor_b
007 | 5      thing  vendor_b
008 | 6      thing  vendor_b
009 | 7   vendor_c  vendor_c
010 | 8      thing  vendor_c
011 | 9      thing  vendor_c
... (truncated - too many lines)
Full output: https://paste.pythondiscord.com/ijifaqewuq.txt?noredirect
agile cobalt
wheat ice
!e ```py
import pandas as pd
df = pd.DataFrame(
{"itemdes": ["vendor_a", "t...
!e Might be - but in a vectorized way...```py
import pandas as pd
df = pd.DataFrame(
{"itemdes": ["vendor_a", "thing", "thing2", "thing3", "vendor_b", "thingx", "thing", "vendor_c", "thingfoo", "thing", "thingbar", "thing"]}
)
is_vendor = df["itemdes"].str.startswith("vendor")
df["vendor"] = df[is_vendor].reindex(df.index, method="ffill")
df = df[~is_vendor]
print(df)
@agile cobalt :white_check_mark: Your eval job has completed with return code 0.
001 |      itemdes    vendor
002 | 1      thing  vendor_a
003 | 2     thing2  vendor_a
004 | 3     thing3  vendor_a
005 | 5     thingx  vendor_b
006 | 6      thing  vendor_b
007 | 8   thingfoo  vendor_c
008 | 9      thing  vendor_c
009 | 10  thingbar  vendor_c
010 | 11     thing  vendor_c
ffill hmmm
agile cobalt
it might not work very well if you have an actual index instead of just the default range index
wheat ice
is there a way to retain the vendor values in the itemdes column?
agile cobalt
ah, I thought you would want to remove them
the df = df[~is_vendor] line is for removing it
agile cobalt
somewhat :p
wheat ice
oh you're doing it on the series
agile cobalt
it seems like you could use reindex_like(df) instead of reindex(df.index) but that's not a big difference I imagine
another way could be quite much the same thing but using fillna ```py
df.loc[is_vendor, "vendor"] = df["itemdes"]
df
itemdes vendor
0 vendor_a vendor_a
1 thing NaN
2 thing2 NaN
3 thing3 NaN
4 vendor_b vendor_b
5 thingx NaN
6 thing NaN
7 vendor_c vendor_c
8 thingfoo NaN
9 thing NaN
10 thingbar NaN
11 thing NaN
df.fillna(method="ffill")
itemdes vendor
0 vendor_a vendor_a
1 thing vendor_a
2 thing2 vendor_a
3 thing3 vendor_a
4 vendor_b vendor_b
5 thingx vendor_b
6 thing vendor_b
7 vendor_c vendor_c
8 thingfoo vendor_c
9 thing vendor_c
10 thingbar vendor_c
11 thing vendor_c
^ that is much easier for me to grasp conceptually, and i use .fillna all the time
@agile cobalt this is beautiful, ty 
misty flint

 north saddle
Hi folks. Hope everyone is doing well. I’m working in pharma and biotech and I’m very interested to learn Python Data Science. Please share how can I get starts? Any free courses or paid courses that you can recommend? Anything can help a visual learner ? I really appreciate!
misty flint
north saddle
Hi folks. Hope everyone is doing well. I’m working in pharma and biotech and I’m...
take a look at data professor on youtube. he has free content on getting started with bioinformatics and data science
arctic wedgeBOT
Hey @lean kindle!
You either uploaded a .txt file or entered a message that was too long. Please use our paste bin instead.
Hey @lean kindle!
You either uploaded a .txt file or entered a message that was too long. Please use our paste bin instead.
misty flint

lean kindle
I Am still not able to paste the python code
urghhhhh
all_dates = []
all_prices = []
all_descriptions = []
all_names = []
got_first_date = False

first = 0
appended_name = False
appended_description = False
for idx, i in enumerate(bounds):
    # print(i[1])
    if i[1] == "Old balance":
        break

    try:
        all_dates.append(parse(bounds[first][1]))
        got_first_date = True
        first += 1
        continue
    except:
        pass
    if not got_first_date:
        total_cols.append(bounds[first][1])
        first += 1
        continue

    if appended_name == False:
        all_names.append(bounds[first][1])
        first+=1
        appended_name = True
        appended_description = False
        continue
    if appended_description == False :
        all_descriptions.append(bounds[first][1])
        first+=1
        appended_name = False
        appended_description = True
        continue

    if idx%5 ==4:
        all_prices.append(bounds[idx][1])

print(all_dates, all_names, all_descriptions, all_prices)
@tacit basin
tacit basin
lean kindle
I Am still not able to paste the python code
!code
arctic wedgeBOT
Here's how to format Python code on Discord:
```py
print('Hello world!')
```
These are backticks, not quotes. Check this out if you can't find the backtick key.
tacit basin
lean kindle
urghhhhh
total_cols  = []
all_dates = []
all_prices = []
all_descriptions = []
all_names = []
got_first_date = False

first = 0
appended_name = False
appended_description = False
for idx, i in enumerate(bounds):
    # print(i[1])
    if i[1] == "Old balance":
        break

    try:
        all_dates.append(parse(bounds[first][1]))
        got_first_date = True
        first += 1
        continue
    except:
        pass
    if not got_first_date:
        total_cols.append(bounds[first][1])
        first += 1
        continue

    if appended_name == False:
        all_names.append(bounds[first][1])
        first+=1
        appended_name = True
        appended_description = False
        continue
    if appended_description == False :
        all_descriptions.append(bounds[first][1])
        first+=1
        appended_name = False
        appended_description = True
        continue

    if idx%5 ==4:
        all_prices.append(bounds[idx][1])

print(all_dates, all_names, all_descriptions, all_prices)
you enumerate bounds but you are not using i or idx. i wonder why?
lean kindle
I used idx for prices at the end
tacit basin
what is bounds
lean kindle
the last if loop
mint palm
why my accuracy varying between 100 to 72
thats too much veriation
i even seeded my shuffle and numpy
lean kindle

This is bounds
I am using easyocr to create boxes around the text which I am extracting
I print those and I use condition to extract and display only selected fields
tacit basin
so you want to go from bound to bound and read text?
lean kindle
correct
IT should be extracted in such a way that I store them in different list, then combine them into a dataframe
that dataframe can be converted into excel and exported

Expected output
tacit basin
so someting like: would be more readable i think
for count, bound in bounds:
  <do something with bond>
  if count == 3:
    break
Okay let me try that
lean kindle
tacit basin
what's the problem with the code?
My output right now 😦

net price items are going under "For" and "Item description" too
Also I dont know why there is NAT in the rows as well
misty flint
🕯️
tacit basin
but how that compre to the bounds?
lean kindle
sorry I dont understand. You mean how it will compare to bounds ?
tacit basin
lean kindle
sorry I dont understand. You mean how it will compare to bounds ?
yess
trying to understand wheres the problem
lean kindle
tacit basin
trying to understand wheres the problem
I am also trying to understand. I think when the net price , for and description column extraction is not correct. I have to change the condition. If you have any suggestions please let me know. This is the invoice I am extracting. So you can see that my output and the actual invoice columns have different contents

@tacit basin
mint palm
how to know number of neuron and layer where there is cardinal data involved?
my whole data is categorial
X = [300, 4]
Y = [300,1]
and what if i choose more then required layer or neurons?
 timber fable
Can i know the best cnn model for image classification?
 karmic valley
import cv2
import numpy as np
import matplotlib.pyplot as plt


# load image
img = cv2.imread(r'C:\Users\Guest_\Downloads\Screenshot 2022-03-18 154330.png')

# convert the image to grayscale
gray = cv2.cvtColor(img, cv2.COLOR_BGR2GRAY)

# read each column of the image from left to right and save it to a list
cols = []
for i in range(gray.shape[1]):
    cols.append(gray[:, i])

# average every 3 columns
avg_cols = []
for i in range(0, len(cols), 1):
    avg_cols.append(np.mean(cols[i:i+5], axis=0))

# graph the average of each column (reversed)
plt.plot(avg_cols[60][::-1])
plt.show()

print (avg_cols[60][::-1])
can someone add a savgol filter to smooth line to my graph please. no idea how.
just message me to get my attention
misty flint
me neither
i know you can do it in matlab https://www.mathworks.com/help/signal/ref/sgolayfilt.html
This MATLAB function applies a Savitzky-Golay finite impulse response (FIR) smoothing filter of polynomial order order and frame length framelen to the data in vector x.
but matlab is typically pretty good on image processing
even when i used opencv it didnt have everything i needed sometimes
 violet tusk
Hey guys, I was wondering how I would animate the next row of my dataframe for yield curve. The picture is part of the data i'm working with. Also I'm trying to animate this in a jupyter notebook. I can graph one row at a time put i'm not able to get the matplotlip.animation to work. Any suggestions?
`import pandas as pd
import requests
import matplotlib.pyplot as plt
import matplotlib.animation as animation
url = r"https://home.treasury.gov/resource-center/data-chart-center/interest-rates/TextView?type=daily_treasury_yield_curve&field_tdr_date_value=2022"
page = requests.get(url, headers = headers).text
df = pd.read_html(page)
df = df[0].dropna(axis=1)
df.set_index('Date', inplace=True)
df
fig = plt.subplots()
def animate(i):
data = df.iloc[i]
return data
ani = matplotlib.animation.FuncAnimation(fig, animate, frames=53, interval=700, repeat=True)`


 misty flint
umm ive never tried the animation feature and im not sure if it will work in jupyter
maybe look into streamlit if you want something interactive
lapis sequoia
violet tusk
Hey guys, I was wondering how I would animate the next row of my dataframe for y...
try launching via command line? or maybe try it in R Studio or Spyder first
 tiny tendon
yo guys , how to get started with data science.
tacit basin
tiny tendon
yo guys , how to get started with data science.
Allen Downeys Elements of Data Science book: https://allendowney.github.io/ElementsOfDataScience/README.html
tiny tendon
tacit basin
Allen Downeys Elements of Data Science book: https://allendowney.github.io/Eleme...
thanks
jolly knoll
How to display 799 individuals bars on a bar chart? Else, what other visualization should I go for instead?
 steady basalt
@jolly knoll the first individual has 2500?
tacit basin
jolly knoll
How to display 799 individuals bars on a bar chart? Else, what other visualizati...
You can make graph really loooooong :)
jolly knoll
steady basalt
<@!427893025654571010> the first individual has 2500?
yes, 2.68k
jolly knoll
steady basalt
How does histogram look
Thanks, it doesnt look too cluttered anymore. Originally wanted barchart to show each route's count, but this should be fine too.
steady basalt
Now, max y axis capped at 1000
Btw, are routes just names
Or numbers
Is there any way to sort them
And then multi plot
jolly knoll
routes are names eg. MELPEN, ICNSYD etc
jolly knoll
steady basalt
And then multi plot
tbh, i dont know how to do that. so i kinda settled on showing the top 10 in routes since the first one had 2.68k values anyway
 radiant trout
jolly knoll
How to display 799 individuals bars on a bar chart? Else, what other visualizati...
radiant trout
jolly knoll
How to display 799 individuals bars on a bar chart? Else, what other visualizati...
considering u got 799 of the, better to consider an 'OTHERS' category rest after considering the top 10or 20. If not u can use plt.xticks(rotation = 45) to rotate the labels
steady basalt
@tacit basin hey!

so the lesson is logistic regression does not work on this one, xgboost is the best
not sure why...
next step is to get the cabin levels and maybe i will score 0.8 thats top 50
steady basalt
radiant trout
considering u got 799 of the, better to consider an 'OTHERS' category rest after...
this is why categories + historgram can be useful
@jolly knoll
u can make a category for like the bottom 10%
and another for the 10% above that
well, smaller but
u can make a nice distribution curve
bold timber
why i get an error like this? My cuda version is 11.4 and my pytorch version is 1.11, how to handle this problem?
 steady basalt
does anyone know why someone would OHE and LE the same dataset just on different cat features?
jolly knoll
radiant trout
considering u got 799 of the, better to consider an 'OTHERS' category rest after...
Thanks, I'll try implementing it later.
My kernel is still running after 50 mins while doing feature selection with RFE. Is this normal btw?
The dimensions are 50000 rows × 925 columns
radiant trout
steady basalt
does anyone know why someone would OHE and LE the same dataset just on different...
OHE leads to curse of dimensionality, if i have a huge number of categories in a feature (lets say over 300) ( which in true most real world data ive ever seen), its better to either label encode or look towards target encoding.
radiant trout
jolly knoll
My kernel is still running after 50 mins while doing feature selection with RFE....
an estimator is being fit , and considering the size of data, its understandable that it is taking that long. But if u have 925 features, u might wanna look into reducing the feature size by other methods first before running an RFE
jolly knoll
radiant trout
an estimator is being fit , and considering the size of data, its understandable...
Oh. I thought RFE would reduce the amount of features, what should I have done first?
radiant trout
jolly knoll
Oh. I thought RFE would reduce the amount of features, what should I have done f...
RFE will reduce your feature set ! its just better to remove the unnecessary features before RFE because you have over 900 features (and the huge set is adding onto the time taken by the RFE )!!. you can look into some standard methods like correlation , variance or any other that suits you.
misty flint
tacit basin
Allen Downeys Elements of Data Science book: https://allendowney.github.io/Eleme...
nice link

looks good for beginners
mint palm
Whats the difference in "unsupervised pretraining" and "encoding"
I mean what difference does the two make
Also i dont fet get how the output of unsupervised pretraining looks compared to raw input That might have been fed to neural network with just encoding.
karmic valley
hi i want to work out gradient of line inn graph from top y value to near bottom y value. anyone suggest a way?

this is my code that creates the graph
#using py27

import pandas as pd
import numpy as np
import matplotlib.pyplot as plt
from scipy.signal import savgol_filter, general_gaussian

#I think wl is reading column labelled X on spreadsheet and X is reading column named Y on spreadsheet.
data=pd.read_excel('C:\Users\Guest_\Downloads\exporting.xlsx')
wl=data['X'].values
X = data['Y'].values

#mess around with these numbers
w = 31
p = 4
X_smooth_1 = savgol_filter(X, w, polyorder = p, deriv=0)

#sawa code which used interval=... and then in plt.plot did plt.plot(wl[interval], X_smooth_1[interval], 'r', ...) but i couldnt get that to work not sure if its important
plt.figure(figsize=(9,6))
#interval = np.arange(0,200,1)
plt.plot(wl, X_smooth_1, 'r', label = 'Smoothing: w/p = 2.5')
plt.xlabel("X")
plt.ylabel("Whiteness")
plt.legend()
plt.show()
it gets data from 2 columns in excel , i shall share the data in pastebin
 unreal crest
hello, new to ml and AI. I am learning from AndrewNGs ML course. Any advice that professionals can provide will be very much appreciated! PLS tag me!
steady basalt
jolly knoll
The dimensions are 50000 rows × 925 columns
What specs
U might wana drop a few hundred useless ones if they are there
I found out lately rfe will take many hours to run for many features
steady basalt
radiant trout
OHE leads to curse of dimensionality, if i have a huge number of categories in a...
I mean this was done for like only a hand full of categories
 burnt robin
unreal crest
hello, new to ml and AI. I am learning from AndrewNGs ML course. Any advice that...
burnt robin
unreal crest
hello, new to ml and AI. I am learning from AndrewNGs ML course. Any advice that...
I am not professional but I highly recommend checking out made with ml
burnt robin
unreal crest
hello, new to ml and AI. I am learning from AndrewNGs ML course. Any advice that...
Learn how to responsibly deliver value with ML.
tacit basin
unreal crest
hello, new to ml and AI. I am learning from AndrewNGs ML course. Any advice that...
Depends what you aim for. Practical stuff? Then practice code etc.
steady basalt
Yes I think most useful after learning theory and reading about models is simply documentation for libraries and using it
 glacial flax
Hello guys, I need to write a report about the radial basis function network and I need to try python codes using the radial basis function. Do you think I should use scipy rbf command or would it be better to write it manually? Or does anyone have a better library idea for this topic? (for radial basis function)
steady basalt
 jade vale
Does anyone know of a good Watson IBM course with Python?
jade vale
Does anyone know of a good Watson IBM course with Python?
IBM data science might have
I did most of it and I can tell u now watsons shit
It feels super slow their entire sights heavy af
jade vale
steady basalt
IBM data science might have
which one do you recommend?
pseudo wren
trying to graph sentiment analysis and not sure where to go from here

i aim to graph at least 3 different answers
one being
"how many times do negation words show up in good reviews vs bad reviews"
"what are the similarities between neutral reviews and good reviews"
"what words are more likely to show up with star ratings 3 and above or 3 and below"
So far i've gotten an answer on polarity and subjectivity
but i want to figure out how to now transform it with the questions asked
serene scaffold
pseudo wren
i aim to graph at least 3 different answers
if you're talking about data visualizations, we usually call those "plots", and then a "graph" is an abstract representation of related data.
for "how many times do negation words show up in good reviews vs bad reviews", you can select the Review column for positive or negative reviews and join them all into one big string, and then count the negation words in each.
 vagrant monolith
Hi guys
i have a problem
a have a rating column with floats and i want to convert those floats to string ratings like "Very good" " good"
for example if a rows rating is 8 replace it with "good"
can anyone help me ?
serene scaffold
I'm heading out soon; probably not. Sorry!
serene scaffold
vagrant monolith
Hi guys
i have a problem
a have a rating column with floats and i want to conver...
!docs pandas.Series.replace
arctic wedgeBOT
Series.replace(to_replace=None, value=NoDefault.no_default, inplace=False, limit=None, regex=False, method=NoDefault.no_default)```
Replace values given in to\_replace with value.

Values of the Series are replaced with other values dynamically.

This differs from updating with `.loc` or `.iloc`, which require you to specify a location to update with some value.@serene scaffold thanks a bunch
serene scaffold
if you're putting stuff into a neural network, it has to be numbers.
vagrant monolith
@serene scaffold the thing is i have float numbers and i have condition like if df["rating"] < 9.0 && df["rating] > 7 then replace that value with "very good"
serene scaffold
tokenizing is just where you determine word boundaries. you have to also encode them into numbers.
serene scaffold
vagrant monolith
<@!253696366952316929> the thing is i have float numbers and i have condition li...
there's also pd.Series.between, I think
!docs pandas.Series.between
arctic wedgeBOT
Series.between(left, right, inclusive='both')```
Return boolean Series equivalent to left <= series <= right.

This function returns a boolean vector containing True wherever the corresponding Series element is between the boundary values left and right. NA values are treated as False.@serene scaffold thank youuu
vagrant monolith
@serene scaffold i tried it the problem is when i replace the float with "very good"
then do it again for other condition like < 7 when it finds "very good" it cant do comparison with a string
serene scaffold
@vagrant monolith try storing the string version in a separate column, then
you usually don't want to write over high-resolution data (an exact score) with low-resolution data (a label that only tells you which range the score was in)
vagrant monolith
@serene scaffold im working on a recommendation system so the idea of converting rating to string would be good for the vectorizer to make clustering patterns i think
 scarlet light
` import pandas as pd
import folium
import glob
from ipywidgets import interact, interactive, fixed, interact_manual, Layout
import ipywidgets as widgets
from IPython.display import display
import datetime as dt
all_files = glob.glob("*.csv")
li = []
#function to make a color code for distance
def color_producer(total_distance):
if 4100 < total_distance < 4300:
return 'green'
else:
return 'red'
map = folium.Map(zoom_start=14, control_scale=True,tiles='Stamen Terrain')
def change_parameters(start ,end ):
for filename in all_files:
date1 = filename.split('_')[1] #split filename to name and date
date1 = date1.replace('.csv','')
date2 = dt.datetime.strptime(date1, "%Y-%m-%d")
if start <= date2 <= end: #compare the file if it falls within the range
df = pd.read_csv(filename, index_col=None, header=0)
li.append(df) #append to the list
car_location = pd.concat(li, axis=0, ignore_index=True)
total_distance = pd.concat(li, axis=0, ignore_index=True)
car_location = car_location[["Latitude", "Longitude"]]
total_distance = total_distance[['total_distance']]
total_distance = (total_distance).iloc[-1] #To read last value in "total_distance" column
total_distance = int(total_distance)
folium.PolyLine(car_location, color=color_producer(total_distance), weight=3.0, opacity=1).add_to(map)
li=[]
map
start_date = widgets.DatePicker(
description='Start Date',
disabled=False
)
end_date = widgets.DatePicker(
description='End Date',
disabled=False
)
widgets.HBox([start_date, end_date])
out = widgets.interactive_output(
change_parameters,
{'start': start_date,
'end': end_date
}
)
ui = widgets.HBox(
[widgets.VBox(
[widgets.Label(), start_date, end_date])
],
layout=Layout(display='flex', flex_flow='row wrap', justify_content='space-between')
)
display(ui, out) `
Can some help me what’s wrong
It does take input but doesn’t seem to plot map !!
steady basalt
jade vale
which one do you recommend?
Google cloud
Watson’s just so slow and clunky
 hollow belfry
has anyone here worked with mhe moving horizon estimation?>
 empty furnace
Is anyone interested collaborating on an F1 statistical analysis project with me? No defined exploratory questions at the minute, planned output would be a plotly dash app hosted on heroku. Really my main learning goal out of this is to work on collaboration on Github. DM me and I can share the source data. Happy to brainstorm
Aside from summary type views, I have an interest/experience in time series forecasting, random walk/multivariate simulations
eager wedge
why is this happening
 tacit basin
eager wedge
why is this happening
tacit basin
eager wedge
why is this happening
What exactly?
eager wedge
Loss is decreasing but training accuracy is staying the same
tacit basin
eager wedge
Loss is decreasing but training accuracy is staying the same
Loss and accuracy are different things
eager wedge
But if loss decreases would the model get better, hence, the accuracy should increase
tacit basin
eager wedge
But if loss decreases would the model get better, hence, the accuracy should inc...
Valid loss is increasing, so most likely overfitting
eager wedge
but training accuracy is not increasing
tacit basin
eager wedge
But if loss decreases would the model get better, hence, the accuracy should inc...
Loss and accuracy are similar but different things
eager wedge
either way, why is my model have such a low accuracy after 11 epochs
does this mean it is just a bad model?
tacit basin
Loss is used by model to adjust weights. Accuracy is a metric.
eager wedge
I understand, however, if the weights become better shouldnt the accuracy also improve
tacit basin
eager wedge
does this mean it is just a bad model?
Model, data, hyperparams
eager wedge
tacit basin
Model, data, hyperparams
ok thx
tacit basin
eager wedge
I understand, however, if the weights become better shouldnt the accuracy also i...
That's likely
tacit basin
eager wedge
I understand, however, if the weights become better shouldnt the accuracy also i...
Training loss would be improving most of the time. We are more interested in valid loss. It's increasing. Suggesting overfitting
lapis sequoia
Any time series expert?
tacit basin
More data, less complex model maybe, less epochs, lower learning rate, not sure, usually trial and error for me.
pseudo wren
serene scaffold
if you're talking about data visualizations, we usually call those "plots", and ...
That’s a really good solution thanks!!!
I want the interpreter to be able to pull out negation words as well
How can I train it to read the negation words
eager wedge
tacit basin
More data, less complex model maybe, less epochs, lower learning rate, not sure,...
ok thx
scarlet light
scarlet light
` import pandas as pd
import folium
import glob
from ipywidgets import interac...
Pls help me with this
arctic wedgeBOT
Star / Wildcard imports
Wildcard imports are import statements in the form from <module_name> import *. What imports like these do is that they import everything [1] from the module into the current module's namespace [2]. This allows you to use names defined in the imported module without prefixing the module's name.
Example:
>>> from math import *
>>> sin(pi / 2)
1.0
This is discouraged, for various reasons:
Example:
>>> from custom_sin import sin
>>> from math import *
>>> sin(pi / 2)  # uses sin from math rather than your custom sin
• Potential namespace collision. Names defined from a previous import might get shadowed by a wildcard import.
• Causes ambiguity. From the example, it is unclear which sin function is actually being used. From the Zen of Python [3]: Explicit is better than implicit.
• Makes import order significant, which they shouldn't. Certain IDE's sort import functionality may end up breaking code due to namespace collision.
How should you import?
• Import the module under the module's namespace (Only import the name of the module, and names defined in the module can be used by prefixing the module's name)
>>> import math
>>> math.sin(math.pi / 2)
• Explicitly import certain names from the module
>>> from math import sin, pi
>>> sin(pi / 2)
Conclusion: Namespaces are one honking great idea -- let's do more of those! [3]
[1] If the module defines the variable __all__, the names defined in __all__ will get imported by the wildcard import, otherwise all the names in the module get imported (except for names with a leading underscore)
[2] Namespaces and scopes
[3] Zen of Python
steady basalt
pseudo wren
How can I train it to read the negation words
U doing NLP?
 unique tartan
pls someone helps me to start machine learning or ai
well, I'm intermediate in Python , and also I know some ai libraries such as Tensorflow, Keras, Sickit-learn and so on
I'll be thankful
 safe viper
Udemy courses are quite helpful
lapis sequoia
How could I read the hex color code (#FFFFFF) of a pixel from a video file? My main goal is to have somthing that can go through a video file and write every pixel from every frames hex color code to a text file.
safe viper
Stack Overflow
I am trying to change a pixel in a specific video frame using OpenCV in Python.
My current code is:
import cv2
cap = cv2.VideoCapture("plane.avi")
cap.set(1, 2) #2- the second frame of my video
res,
quick google search would probably be most helpful for you
steady basalt
unique tartan
well, I'm intermediate in Python , and also I know some ai libraries such as Te...
How do u need help learning ML when u know already tensorflow lol
 rapid knoll
If im creating a neural network for a self driving car system (like a codebullet video) and the inputs for that neural network arethe distances between the car and the wall at different angles, is it possible for the inputs to constantly be changing as my car moves
steady basalt
I have no idea about self driving but wouldn’t it re run every half second or so and work that way?
rapid knoll
yh thats what i was worried about
steady basalt
Or is it sensor based
steady basalt
Are you creating a self driving software
rapid knoll
im making a self driving car system in unity using deep q learning so basically a simulation
its for a school project
steady basalt
Quick rundown on deep q
What does model free mean
Ah it’s trial and error
Why is deep q good for cars?
rapid knoll
i just thought it'd be interesting to do for my course tbh
also yh its basically trial and error
steady basalt
Lol sounds like a school from out of this world
In school I made PowerPoints
Is deep q like optimal for self driving or something? For real time use
If so why
rapid knoll
wait sorry im in a call and keep dissappearing
i cant even remember anymore why i picked deep q learning
hang on im almost finished with this other thing im doing
steady basalt
Well surely u picked it for a good reason
rapid knoll
it kind of makes sense, it works through checkpoints and each checkpoints giving the agent a reward
everytime the car drives into a wall, the car is punished, everytime it drives into a checkpoint, it gives a reward
karmic valley
anyone help me with code to work out bgr of image been trying all day
plucky saddle
Formula I made to find the line of best fit given a list of points
def regression(points: list[tuple[int, int]]) -> tuple[float, float]:
    x, y = [i[0] for i in points], [i[1] for i in points]
    ax, ay = sum(x) / len(x), sum(y) / len(y)
    acx, acy = sum([x[i+1]-x[i] for i in range(len(x)-1)])/len(x), sum([y[i+1]-y[i] for i in range(len(y)-1)])/len(y)
    return acy/acx, acy/acx*(-ax)+ay
Returns the slope of the line and the y intercept
safe viper
Just spent 10 hours on an assignment for my NLP class. A "simple" multi-class classification task. I have tried over 20 different classifiers with 3 different text encoders but my best F1 score was 50%. I've never felt so helpless in my life. Any advice?
 spark dirge
Karan, I have this bookmarked. Maybe it will help: https://towardsdatascience.com/multi-label-multi-class-text-classification-with-bert-transformer-and-keras-c6355eccb63a
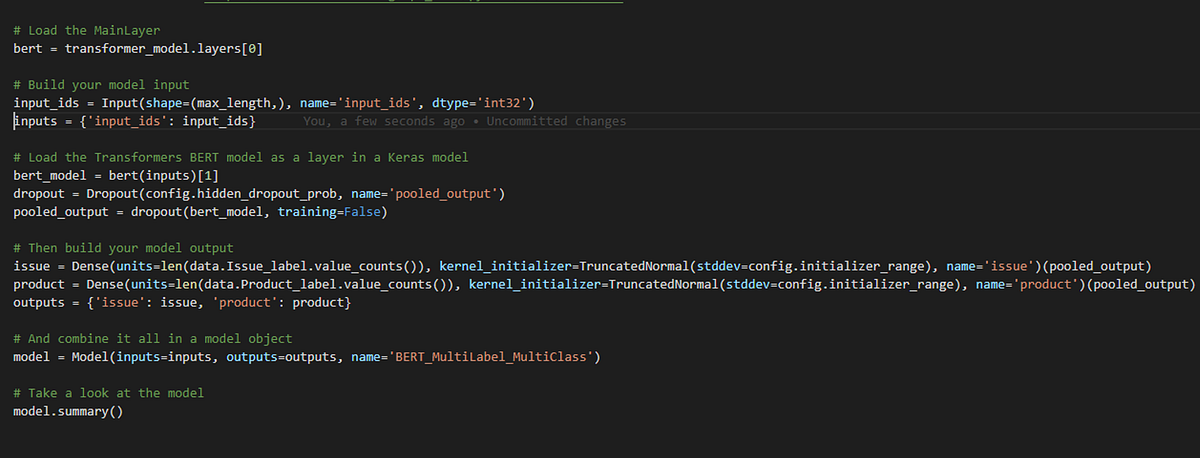
Medium
In this article, I’ll show how to do a multi-label, multi-class text classification task using Huggingface Transformer library and…
safe viper
Thanks so much for the article, I'll be sure to bookmark it. unfortunately I am not allowed to use tensorflow, just sklearn and imblearn 😦
misty flint
hmmm is there a reason nobody really talks about cloud stuff on this server 
im sure peeps deploy ML models to the cloud
i mostly bring this up bc i saw this https://www.techradar.com/news/amazons-new-role-playing-game-can-help-you-build-your-aws-skills

TechRadar
Learn hands-on cloud computing skills in a virtual 3D world
misty flint
safe viper
Just spent 10 hours on an assignment for my NLP class. A "simple" multi-class cl...
honestly this sounds about right. we spent multiple days on assignments in my own NLP class and the prof always had to extend the deadlines