#data-science-and-ml
1 messages · Page 384 of 1
 arctic wedgeBOT
 graceful glacier
 lyric tartan
i am working on face recognition project i want to display details from csv file
 lapis sequoia
lyric tartan
i am working on face recognition project i want to display details from csv file
lapis sequoia
lyric tartan
i am working on face recognition project i want to display details from csv file
okay. so some specific column?
lyric tartan
like name address contact etc
lyric tartan
lapis sequoia
okay. so some specific column?
yes
lapis sequoia
okay i see. have you used pandas before?
lyric tartan
no bro
lapis sequoia
we kinda use pandas to read csv(or csv module)
lyric tartan
i am beginner
import csv
import os
from pathlib import Path
faces_path = "C:\Users\kingm\Desktop\pythonProject\faces"
def search():
face_names = os.listdir(faces_path)
for i, name in enumerate(face_names):
filename = os.path.basename(name)
numm = Path(filename).stem
num = numm
read = csv.reader(open('C:\Users\kingm\Desktop\test.csv'))
for row in read:
if num == row[0]:
print(row)
search()
check this
lapis sequoia
okay. so what is the issue in this?
lyric tartan
i rename jpg name to number
then use that text to find specific colum in csv and print
but prob is i am unable to use in apply in opencv
lapis sequoia
okay so your csv has the path to each face right?
lyric tartan
and display it
yes
noo bro faces folder different
means when any face detect in cam it recog face and get number of jpg using name of that pic and find number in csv file and give result in opencv putText func
this is output
 lapis sequoia
okay and now you want to show the face?
 charred light
lol, so apparently pyspark dataframe.dropDuplicates() causes the issue of giving me an entire new set of data 
lyric tartan
no to show details in csv file to putText of open cv
like current face name , phone, address like that
lapis sequoia
put text as in you want to put some text on the face?
lapis sequoia
charred light
lol, so apparently pyspark dataframe.dropDuplicates() causes the issue of giving...
that is how it works no? you need to store things usually.
lapis sequoia
lyric tartan
are you free i can show what i make current now
not too much free but i can give 10 mins, then i need to mess up in my stuff.
lyric tartan
lapis sequoia
not too much free but i can give 10 mins, then i need to mess up in my stuff.
ok bro i share screen personal
charred light
lapis sequoia
that is how it works no? you need to store things usually.
As in, my original spark.dataframe row values are entirely different after using dropDuplicates.
lapis sequoia
no personal.
lyric tartan
how i can share screen then bro?
lapis sequoia
charred light
As in, my original spark.dataframe row values are entirely different after using...
WHAT
charred light
Yes, my thoughts exactly
I query, limit 20, I see 20 IDs. I drop duplicates on these 20 IDs, I see 20 NEW IDs. I feel like I'm being trolled.
lapis sequoia
did you figure out to read the image? @lyric tartan
charred light
Like it's just querying 20 new Ids
lyric tartan
yes
lapis sequoia
charred light
I query, limit 20, I see 20 IDs. I drop duplicates on these 20 IDs, I see 20 NE...
hold on, Ids being changed should be okay. what about rows?
lapis sequoia
lyric tartan
yes
share the code?
charred light
Ids in this case, is my row values. Not index
charred light
yea, all of col1 values are different after "droping duplicates"
 arctic wedgeBOT
Hey @lyric tartan!
It looks like you tried to attach a Python file - please use a code-pasting service such as https://paste.pythondiscord.com
lyric tartan
charred light
man, I really hate pyspark and Sql
lyric tartan
this is csv
 lapis sequoia
            cv2.putText(image, name, (left * scl, bottom * scl + 20), font, 0.8, (255, 255, 255), 1)
            cv2.putText(image, name, (left * scl, bottom * scl + 40), font, 0.8, (255, 255, 255), 1)
            cv2.putText(image, name, (left * scl, bottom * scl + 60), font, 0.8, (255, 255, 255), 1)
            cv2.putText(image, name, (left * scl, bottom * scl + 80), font, 0.8, (255, 255, 255), 1)
i can see this code in your codebase
lyric tartan
yes
lapis sequoia
so...what is the issue?
lyric tartan
how i can use csv details to show in this
import csv
import os
from pathlib import Path
faces_path = "C:\Users\kingm\Desktop\pythonProject\faces"
def search():
face_names = os.listdir(faces_path)
for i, name in enumerate(face_names):
filename = os.path.basename(name)
numm = Path(filename).stem
num = numm
read = csv.reader(open('C:\Users\kingm\Desktop\test.csv'))
for row in read:
if num == row[0]:
print(row)
search()
with this i am getting all pic info from folder of faces
lapis sequoia
just read the image here and do what you did there?
also If you are new to python, why are you even doing this?
shouldn't you...do simple things before?
lyric tartan
yes but all simple available in internet
lapis sequoia
means?
its not about availability, its about understanding how you are making the pizza if you're making pizza.
lyric tartan
i got assingment to make some different
lapis sequoia
did you even write above code? that big code of video?
lyric tartan
i mix 3 codes by watch explaination😅
lapis sequoia
ok so here's what you need to do.
in that loop, read the image. like you did in video one.
then get the text from csv, then put the text on various places using
cv2.putText(image, name, (left * scl, bottom * scl + 20), font, 0.8, (255, 255, 255), 1)
and then save the file
lyric tartan
yes
but
def get_face_encodings():
face_names = os.listdir(faces_path)
face_encodings = []
for i, name in enumerate(face_names):
face = fr.load_image_file(f"{faces_path}\{name}")
face_encodings.append(fr.face_encodings(face)[0])
face_names[i] = name.split(".")[0] # To remove ".jpg" or any other image extension
return face_encodings, face_names
with this func it encode only one word
and return that'
lapis sequoia
and what do you want?
 lapis sequoia
can't see error
lyric tartan
there are two different files
arctic wedgeBOT
Hey @lyric tartan!
It looks like you tried to attach a Python file - please use a code-pasting service such as https://paste.pythondiscord.com
lapis sequoia
im running out of time
but i repeat, you have path of image so read image.
use putText to put ANYTHING right now
once you can do it, you can put specific things using csv data.
lyric tartan
lapis sequoia
once you can do it, you can put specific things using csv data.
ok bro thanks for time👍
lapis sequoia
np
lyric tartan
lapis sequoia
np
hey bro thankks
lyric tartan
lapis sequoia
but i repeat, you have path of image so read image.
this works as i wanted
 drifting lion
can training and validation curve be plotted for KNN algorithm?
 somber prism
can someone tell me how did this save the model ??? i set the condition to save the model only if the current loss < best loss ```
Loss improved from 1.4632604568237027e+25 to 2.870723255799304e+19, saving the model to best_model.pth ...
 mellow vapor
On a current set of features if I am training a model with certain paramters
when should I know if I need to perform hyperparamter tuning or change the set of features to improve the accuracy
like any rough idea to determine that?
lapis sequoia
lyric tartan
this works as i wanted
I'm glad it did.
lapis sequoia
lyric tartan
ok bro thanks for time👍
np
somber prism
omggggg, what did i wrong here ??? Epoch : 1 / 2: 100%|██████████| 171/171 [09:06<00:00, 3.19s/it, Loss=396824940101292940853248.0000]
 tacit basin
somber prism
can someone tell me how did this save the model ??? i set the condition to save ...
tacit basin
somber prism
can someone tell me how did this save the model ??? i set the condition to save ...
it says that loss improved by a lot, so that's why the model was saved. no?
 brazen sandal
I have a dataset time series with 8 features. I want to predict one of the features one hour ahead. I use 1 hour data of 8 features to predict 1 hour ahead(this process). What do you call this process?
 mighty summit
IDK if this question really belongs here but
I am trying to get to know, is there anyway we can scrape a website that uses JS to change pages? Like the URL stays same but they page and the contents are updated, so how will I fetch those new contents, using bs4
 blissful bone

SerpApi
IntroThis is a part of the series of blog posts related to Artificial Intelligence Implementation. If you are interested in the background of the story or how it goes: #1) How to scrape Google Local Results with Artificial Intelligence? #2) Real World Example of Machine Learning on Rails #3) AI
 desert bear
do you know how to make this a offline model?
tacit basin
desert bear
do you know how to make this a offline model?
What do you mean by offline model?
tacit basin
brazen sandal
I have a dataset time series with 8 features. I want to predict one of the featu...
Multivariate time series forecasting i think
brazen sandal
tacit basin
Multivariate time series forecasting i think
thanks for the answer. but the process that I meant is not when predicting happen. but when pre-processing happen. when I use 1 hour data of 8 features and use 1 label of one hour ahead.
this is a visualization of what happened in pre-processing and what I asked. I just don't know what it's called

 marble tulip
I want to write custom Text instead of 1 and 0, how can I achieve that
This is the code
ax=sns.countplot(x='Survived', hue='Sex', data=df)
 tacit basin
brazen sandal
thanks for the answer. but the process that I meant is not when predicting happe...
tacit basin
brazen sandal
thanks for the answer. but the process that I meant is not when predicting happe...
so you want to predict at time Te based on time at Tp(30-3)? i would say this is still prediction? not?
lapis sequoia
def search(search_terms):
    files = ["1.csv", "2.csv", ...]
    for f in files:
        df = pd.read_csv(f)
        #for key in query:
         #   df.loc[df[key] == query[key]]
         #search by the columns in search_terms

    print(df)
    print("done")


search({
    "date": "1980",
    "animal": "dog"})
 lusty bay
Hello, I occupied a help channel (#help-mango) but someone from this channel might have ran into this problem.
I am bucketing my variables by using qcut(), I have a dataset that is kinda uneven, so if I divide the data into same amount of labels, some columns won't have enough data for let's say 5 labels. How can I decide amount of labels for each column? Is there a way that I don't have to decide amount of labels myself?
tacit basin
lapis sequoia
```py
def search(search_terms):
files = ["1.csv", "2.csv", ...]
for f in...
What's your desired output?
lapis sequoia
a df of rows that matched the criteria of having collum "year" = 2018 and column "typ" = "animal"
tacit basin
lapis sequoia
a df of rows that matched the criteria of having collum "year" = 2018 and column...
One df? Of as many DFs as CSV files?
lapis sequoia
a search of all the rows in the csv files that contatining colums match, into one df
i want the user to click dropdown or checboxes of search queries such as year=2018, type=animal and have the backend read all the data for those inputs and send back one df
and result
{
[
2017 dog ... ... ...
2018 dog ... .. .
]
}
i havent done the api calls yet
so i havent found a way to map searchdf to the function search etc.
@tacit basin
tacit basin
lapis sequoia
<@!490342783572246538>
You could possibly using streamlit for buttons and stuff
lapis sequoia
nice
ill look into tat
the only way i can do this problem
is by creating a main data frame
and appending the results to it i guesss?
some guy called me an idiot for it tho lol
it is slow
tacit basin
lapis sequoia
and appending the results to it i guesss?
Yes concat i think. https://stackoverflow.com/a/36416258

Stack Overflow
I would like to read several csv files from a directory into pandas and concatenate them into one big DataFrame. I have not been able to figure it out though. Here is what I have so far:
import glob
tacit basin
lapis sequoia
some guy called me an idiot for it tho lol
Why is that?
lapis sequoia
becuase its slow
tacit basin
lapis sequoia
becuase its slow
Did he suggest alternative?
lapis sequoia
well he didnt call me an idiot
but i feel like one anyways so
its in #help-candy
get_a_life(1e+99, null)
 subtle spoke
I've been stuck trying to do this one thing for the past couple of days. Basically I have 3 mp4 video files which I'm processing with OpenCV to save each frame in a folder. It works fine saving it in one folder, but 17,861 frames is too much for a single folder, so I made a script which made 180 new folders in another folder and they're all empty so far. The thing I want to do is save 99 frames in one folder then move on to the next 99 frames and save that in the second folder, etc. I tried processing the actual images from the single file they're saved in but my code raised the img.empty() error, so now I'm working on a script that processes the video itself to do this, but that's where I'm stuck. I'm not sure how to iterate through the first 99 items, and then the next 99, and the next 99 after that, etc, while simultaneously going back and forth in the directory and iterating through each of the 180 folders individually to save each iteration of images.
This is the code I used to save each frame into a folder:

I'm not sure how to make the for loops for this. I even tried writing out the loop tasks on a paper in plain English but that just left me even more confused.
 mild dirge
Not really sure how to help with your problem, but saving the images individually in 180 folders seems like a bit of a code smell lol @subtle spoke
Would it not be better to iterate through the video and get the frames while you need them?
subtle spoke
mild dirge
Not really sure how to help with your problem, but saving the images individuall...
well normally I wouldn't do that but I want to upload the frames on my GitHub repo, but GitHub doesn't allow attaching 100 or more files at once
mild dirge
So you are going to upload 180 folders with 99 images each?
subtle spoke
yes
subtle spoke
mild dirge
Would it not be better to iterate through the video and get the frames while you...
I was thinking of making an empty list and appending the file length to it and using the list indexed into parts to get the exact frames, but I'm not sure how to exactly do this.
or a dictionary with 180 key:value pairs where the values are lists of length 99
at this point I think I'll just make 180 json files 🤣
or wait, maybe I can delete the 180 folders I made with my other script and just add that into the while or for loop so that it changes directory and makes a new folder, then dumps 99 images in and then makes a new folder, etc
OK so now I added in a for loop but I'm not sure how to iterate through each set of 99 subsequent frames.

I'll break my head on it soon, for now I'll take a break
tacit basin
subtle spoke
OK so now I added in a for loop but I'm not sure how to iterate through each set...
Does this work?
somber prism
anyone know why its not outputting bbox, labels and scores for test image prediction ? https://colab.research.google.com/drive/1BVgQavtcEqAABkmhebXQ1kNqulecn8tc?usp=sharing
 subtle spoke
tacit basin
Does this work?
subtle spoke
tacit basin
Does this work?
haven't tried it yet
tacit basin
subtle spoke
haven't tried it yet
Seems like it's not...
subtle spoke
yeah the for loop is too simple for what I'm planning
 pastel valley
steps_per_epoch=np.floor(train_generator.n/batch_size)
is that the same as like batch size?
if i have the batch size = 32 then 32 images are being fed to the model per batch?
 carmine rain
Hey, I’m creating an AI and I’m getting to the point where I’m adding voice commands though I’m trying to make it so it only responds to certain voices and haven’t been able to find any docs to match certain voices. Is this possible? (Ex: I execute a command using my voice and it works, my friend then executes the same command and it doesn’t work as his voice isn’t registered)
 serene scaffold
carmine rain
Hey, I’m creating an AI and I’m getting to the point where I’m adding voice comm...
serene scaffold
carmine rain
Hey, I’m creating an AI and I’m getting to the point where I’m adding voice comm...
models that enroll voice profiles and check if a given sample belongs to one of the profiles is a thing that exists, yes.
desert bear
tacit basin
What do you mean by offline model?
now if iam no t connectit to the interwebs it das not work so is tere a way to use it offlie
carmine rain
serene scaffold
models that enroll voice profiles and check if a given sample belongs to one of ...
Thank you
 willow crypt
not sure if this is the best channel for it but here goes
i have a dataframe consisting of different words and their ranks by years
i would like to plot a graph that will show how each word's rank change through the years
something like this:

any ideas how to go about it?
serene scaffold
!docs pandas.DataFrame.plot.line
arctic wedgeBOT
DataFrame.plot.line(x=None, y=None, **kwargs)```
Plot Series or DataFrame as lines.

This function is useful to plot lines using DataFrame’s values as coordinates.that doesn't work
serene scaffold
willow crypt
that doesn't work
It does. If it didn't work when you did it, you have to show exactly what you did and what the result was
willow crypt
    df = pd.read_excel("topWords.xlsx")
    tdf = df.drop(columns=df.columns[0]).set_index("Words").transpose()
    tdf.plot(figsize= (10, 6), linewidth= 5, style= "o-", colormap= "tab20")
    plt.grid()
    plt.subplots_adjust(left= 0.05, right= 0.8, top= 0.9, bottom= 0.15)
    plt.gca().invert_yaxis()
    plt.xticks(rotation= 45, ha= "right", rotation_mode= "anchor")
    plt.yticks(np.arange(1, 11, 1))
    plt.legend(loc="center left", bbox_to_anchor=(1.03, 0.5))
    plt.show()
and the result is

it's a similar solution but not the one i'm looking for
this is how the df looks like:
arctic wedgeBOT
Hey @willow crypt!
You either uploaded a .txt file or entered a message that was too long. Please use our paste bin instead.
willow crypt

i know it's a complex problem xD
do you have any ideas or need further explanation?
@serene scaffold
serene scaffold
willow crypt
how is this different from what you wanted?
is the problem that there are gaps in the lines when a value isn't defined?
charred light
I have a Pyspark DataFrame. I have a column of IDs, values, and I want to create a flag variable to detect if there is a change or not.
In pandas, I would approach this with apply and a function. In pyspark, I know how to create a flag variable if I was simply creating the flag based on same row calculations. I know there is lag but I"m not sure how to apply it to only the same ID.
https://paste.pythondiscord.com/uzaduceyuv
 vagrant field
https://pandas.pydata.org/docs/reference/api/pandas.Series.name.html says "The name of a Series becomes its index or column name if it is used to form a DataFrame" but how? I can't seem to make a Series' name become an index in a DataFrame
lyric tartan
@lapis sequoia hi
pastel valley
what does top 1 and top-5 accuracy?

is it the highest accuracy during testing? and the 5th highest accuracy during testing?
so top 1 is like max(history['val_accuracy'])?
tacit basin
pastel valley
is it the highest accuracy during testing? and the 5th highest accuracy during t...
What is top-1 and top-5 accuracy?.
lyric tartan
tacit basin
https://www.kaggle.com/questions-and-answers/164379
hello sir
tacit basin
lyric tartan
hello sir
Hi
lyric tartan
sir can you help me
tacit basin
lyric tartan
sir can you help me
I can try
lyric tartan
cv2.putText(image, row[0], (left * scl, top * scl + 10), font, 0.8, (255, 255, 255), 1)
cv2.putText(image, row[1], (left * scl, bottom * scl + 20), font, 0.8, (255, 255, 255), 1)
cv2.putText(image, row[2], (left * scl, bottom * scl + 45), font, 0.8, (255, 255, 255), 1)
cv2.putText(image, row[3], (left * scl, bottom * scl + 65), font, 0.8, (255, 255, 255), 1)
this is current
i need like this

cooridinates prob
lyric tartan
tacit basin
I can try
hello sir?
 scarlet light
Stack Overflow
I have folder with a lot of csv files. I wanted to search for csv files in certain date range using datepicker feature in plotly and to be able to plot the selected range of files.
files have a nam...
Can anyone help me pls !!
tacit basin
lyric tartan
cooridinates prob
You want to draw square and 4 lines?
lyric tartan
rectangle already there but that four lines for text
pastel valley
tacit basin
https://www.kaggle.com/questions-and-answers/164379
oh iguessed it too far hahaa
scarlet light
scarlet light
https://stackoverflow.com/questions/71425808/how-to-fix-datepicker-issue-in-plot...
Pls help me
pastel valley
is something like this still overfitting?

but i think 89% is pretty good for me but is it still overfitting?
tacit basin
pastel valley
but i think 89% is pretty good for me but is it still overfitting?
If your test metric is increasing then you are not overfitting. Providing that train test split is correct that is .
Those drops around 20 and 59 epoch is 'intetesting '.
But also from epoch 20-40 is not improving much seems
lapis sequoia
pastel valley
seems okay to me. your test accuracy is not like hella droping so its okay.
pastel valley
tacit basin
If your test metric is increasing then you are not overfitting. Providing that t...
i did 80-20 split its the common split right? considering i dont have alot of samples
pastel valley
tacit basin
Those drops around 20 and 59 epoch is 'intetesting '.
what intetesting?
here what could be the explanation for this phenomenon 😅

the loss is like the calculated distance of the output to the correct output right?
pastel valley
lapis sequoia
seems okay to me. your test accuracy is not like hella droping so its okay.
nice nice i havent touched the learning rate or experimented hyperparameters so there could be some room for improvement there
 hardy blade
hey guys anyone can help with this?
 serene scaffold
hardy blade
hey guys anyone can help with this?
serene scaffold
hardy blade
hey guys anyone can help with this?
I've never heard about "fully observable environments", though if the rules of the game are known, it looks like every bit of information that's relevant to winning the game is there
as opposed to an agent that's supposed to win Super Mario, or something, where you don't necessarily know what the NPCs are going to do.
the second question is a combinatorics one. I'm not sure how to answer it.
lapis sequoia
pastel valley
nice nice i havent touched the learning rate or experimented hyperparameters so ...
Increasing learning rate may converge bit faster but i don't think it would improve much.
somber prism
anyone know why its not outputting bbox, labels and scores for test image prediction ? https://colab.research.google.com/drive/1BVgQavtcEqAABkmhebXQ1kNqulecn8tc?usp=sharing
tacit basin
pastel valley
i did 80-20 split its the common split right? considering i dont have alot of sa...
It's fine. Also you want to make sure that your test set has examples of all classes ideally in similar qty each
tacit basin
pastel valley
what intetesting?
Why it drops so much at certain epochs?
 exotic thicket
Hello people is there anyone here from a computer vision background or had taken any courses on computer vision particularly in numerical problems (there's a lot of numerical problems which it takes time to understand)
serene scaffold
exotic thicket
Hello people is there anyone here from a computer vision background or had taken...
your best bet is to just ask your actual question.
mild dirge
exotic thicket
Hello people is there anyone here from a computer vision background or had taken...
Currently taking a cv course, but yeah just ask
 modern cypress

Hmm, can anyone explain this please? (i think im overfitting)
But I thought with Image classification this was not a thing?
How comes categorical_accuracy is so high, but validation categorical accuracy is shockingly low
 winter spire
Hi, I would like to ask if someone doesn't know how can I solve my issue using Python / Javascript / SQL. I have website that should search EXCEL database of school absolvents. I can transfer this excel database to SQL if it would be needed, but I will probably need help with this as well.
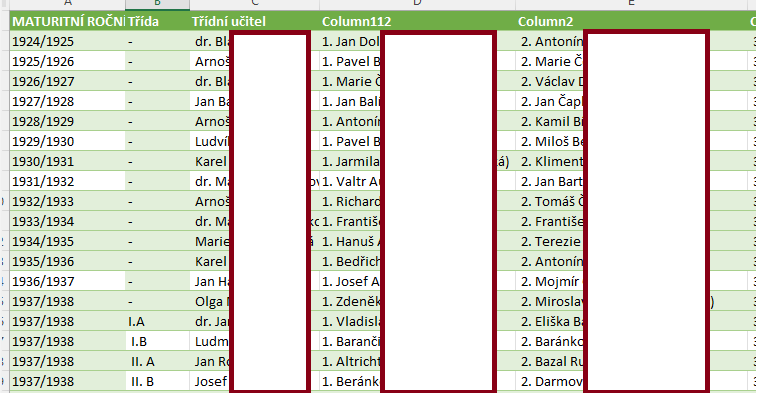
So, I have school database, it looks like this - firstly, there's a maturity year, then class index, then class teacher and then search results - dynamically from tab completing the text. https://i.imgur.com/TFqJZC1.png (hidden parts due to GDPR)
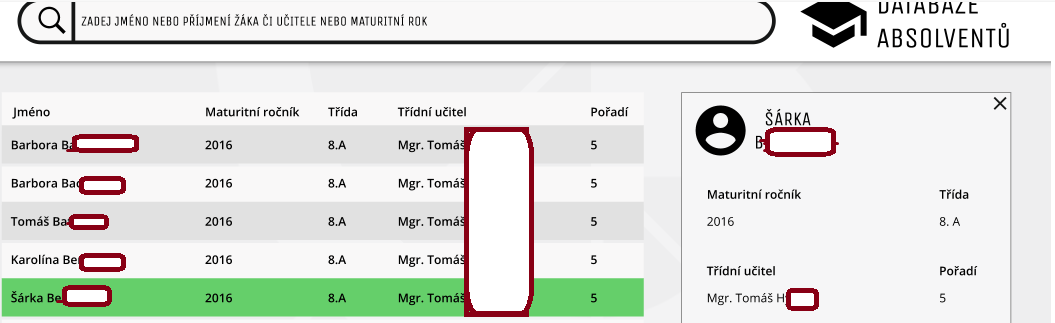
I need to make search bar (I've already managed it with HTML and CSS) where people will type PART of first name / last name / maturity year and it will show the result. I would like to make it work for just part of text as well and with tab completing, so if someone start typing "Ba" it will show the names under Ba..., etc.
https://i.imgur.com/mmKwQ5s.png
But I absolutely don't know how to do it. I've tried some code using pandas and openpyxl, I've it to work, but I have to enter there full name instead of just part of the name. Also, it doesn't show more results than just one and I'm not sure how to do it "live action - automatically tabcompleting to show results when people will type).
So, if someone can help me with this, I would be really glad, I don't neither know what to search... and if I should do it via Python and pandas or via SQL - if it would be easier. But I still probably don't know how to make it "live searching" and showing multiple results.
My code: https://pastebin.com/in8tp9fA
Current output isn't bad, it shows maturity year, class index, class teacher and I've also managed how to show other students. It also shows the person classmates, that isn't bad.
But now, I need few improvements, or redone it, but as mentioned I absolutely don't know how to continue.
- I need to make it only part search
- Dynamically showing results
- Way to show multiple results no just one
Pastebin
Pastebin.com is the number one paste tool since 2002. Pastebin is a website where you can store text online for a set period of time.
tacit basin
modern cypress
Image classification can overfit too. Val accuracy didn't really improve after epoch 1
tacit basin
modern cypress
How comes categorical_accuracy is so high, but validation categorical accuracy i...
That's your train and valid metrics right?
modern cypress
tacit basin
Image classification can overfit too. Val accuracy didn't really improve after e...
Oh I must have read something wrong, my bad
modern cypress
tacit basin
That's your train and valid metrics right?

This is my current model. I am unsure how I can improve it

I commented the dropout layer for that 20 epoch test, Im going to put it back and try run the test again
 iron basalt
serene scaffold
I've never heard about "fully observable environments", though if the rules of t...
iron basalt
serene scaffold
I've never heard about "fully observable environments", though if the rules of t...
Fully observable means no hidden state. Like chess. A game with hidden state (and therefor much harder) would be something like Mario, Starcraft, etc. Also real life is ofc very full of hidden state, much more than non-hidden.
 neat anvil
winter spire
Hi, I would like to ask if someone doesn't know how can I solve my issue using P...
neat anvil
winter spire
Hi, I would like to ask if someone doesn't know how can I solve my issue using P...
Maybe consider using plotly dash - https://dash.plotly.com/introduction - to build your website. Their search bars and dropdowns and other various doodads natively support fuzzy-finding and autocomplete. edit: That'd require completely rebuilding your website, but making good frontends for data dashboarding is really hard, and standing on the shoulders of giants is an easier way to do a decent job than rolling it yourself
A short introduction to Dash.
iron basalt
iron basalt
Fully observable means no hidden state. Like chess. A game with hidden state (an...
An example of hidden state that would make the 8 puzzle harder is if you could only see the values of the tiles surrounding the current empty tile.
serene scaffold
iron basalt
Fully observable means no hidden state. Like chess. A game with hidden state (an...
great, so my intuition was correct 😄
iron basalt
iron basalt
An example of hidden state that would make the 8 puzzle harder is if you could o...
Because now you need to infer where the other tiles are and you can't possibly guess correctly 100% without having first encountered them. So by default it will always take more moves now, no matter how good the agent is (information collection moves, and it needs to good enough short and long term memory to keep that).
tacit basin
modern cypress
This is my current model. I am unsure how I can improve it
you removed dropout? didn't help?
you can try: larger model, larger images, augmentation, learning rate scheduling, weight decay, different optimizer, different learning rates, make sure train/test split contains all clases in train/val and not duplicates...
modern cypress
tacit basin
you removed dropout? didn't help?
you can try: larger model, larger images, augm...
Mhmm, I split my initial data 70 train 30 test. I'm looking into augmentations now, such as flipping and some rotations on the images. For now I added the horizontal images for all classes. I added another Conv2D layer just to see what happens
tacit basin
modern cypress
Mhmm, I split my initial data 70 train 30 test. I'm looking into augmentations n...
so say you have 10 classes, 100 images. your split is 70/30. 70 images in train and 30 images in test. Now in your test you only have 3 out of 10 classes. That wouldn't be a good split. just an example.
tacit basin
modern cypress
But I do understand your premise
you can check the distribution of your classes in train and valid. just to confirm randomness
 hollow sentinel
wow .reshape in numpy is cool
my_lst1=[1,2,3,4,5]
my_lst2=[2,3,4,5,6]
my_lst3=[9,7,6,8,9]

arr=np.array([my_lst1,my_lst2,my_lst3])

arr[:,:]
i don't understand the slice syntax here
 thin palm
what's up Python gang, I'm trying to upload my .joblib into GCP with Python, and for some reason I can upload a folder, but I cant get that .joblib file inside the folder? Any pointers?
here's the code
from google.cloud.storage import bucket
from google.resumable_media.requests import upload
from termcolor import colored
import pandas as pd
import joblib
import os

BUCKET_NAME = "xxx"  # BUCKET NAME
MODEL_NAME = "xxx" #MODEL NAME
STORAGE_LOCATION = 'models/' # STORAGE LOCATION

#upload our model.joblib to the GCP
def upload_model_to_gcp(model_name):
    client = storage.Client()
    bucket = client.bucket(BUCKET_NAME)
    blob = bucket.blob(STORAGE_LOCATION)
    blob.upload_from_filename(model_name)
    print(colored('Success!'))
if __name__ == '__main__':
    upload_model_to_gcp('model.joblib')
this looks like aws
thin palm
hollow sentinel
this looks like aws
No it's google, it says google.cloud
thin palm
hollow sentinel
with the buckets and all
all good, ended up using another code that worked even though they do the same thing
some times code is super frustrating
 misty flint
hollow sentinel
*nervous laughter*
misty flint
hollow sentinel
*nervous laughter*

lapis sequoia
Can someone help me with a code for this? I am confused.
y = a * x + b
y = [1,5,3,2.5,2.4,5.6]
x = [0.5,3.4,3,1,4,2.5]
Find a value for a that gives the lowest possible MSE. Implement the following procedure:
*initially set a to 10
*repeat the following procedure 100 times:
*decrease a by 0.1
*re-calculate y using the modified a
*re-calculate the MSE check if the new MSE is smaller than the previous one if it is smaller, keep the new values for the MSE and a, otherwise discard it
*print the final value for a and the corresponding MSE
*Modify b given the modified b
 unkempt quartz
Heya! So I am trying to train a logistic regression model on mobile app usage. So far I have outlined some datapoints that I want to collect but I'd like some input. This model will be queried by a microservice every 2 weeks and I'd like to know how to represent date data. I collect the registration date (among other things) but should I transform that data to something like: days since registration?
I am quite a noob when it comes to data science so feel free to correct me and offer any advice for how to scale different kinds of data.
hollow sentinel
lapis sequoia
Can someone help me with a code for this? I am confused.
y = a * x + b
y = [1,5,...
mean squared error would just be the distance from the residuals to the line of the best fit

you can use numpy for this
A simple explanation of how to calculate mean squared error in Python.
 prime hearth
@lapis sequoia this is for linear regression
have you tried watching youtube videos?
specifically gradient descent
lapis sequoia
prime hearth
<@456226577798135808> this is for linear regression
yes i have. I came up with this code but i wonder if it repeats the process 100 times;
a = 10
mse = []
results = 0
while a > 0:
y_new = (a-0.1)*dataset.x
mse = sum(((dataset.y - y_new)**2))/20
a-=0.1
if min([mse]) > results:
print (mse)
print (a)
break
prime hearth
have you learned about for loops?
whe it says prcoess 100 times
it means 100 iterations for all those steps
so
a=10
for i in range( 100 times):
# code goes below here
lapis sequoia
I ended up with this code but i get a traceback

 haughty ibex
I have the following json obejects in a column called locations how can I extract any of these objects into their own separate columns?
[{'latitude':34.71666666667, 'longitude': 114.35, 'geoHash': '1ts3', 'latitudeString': '344300N', longitudeString: '1142100E'}, {'latitude':34.71666666667, 'longitude':, 'geoHash': '1ts3', 'latitudeString': '344300N', longitudeString: '1142100E'}]
prime hearth
for floats
one simple way is just
min= 100
do for i in (mse):
if i < min then set min to i
since min() wouldnt work with flaots in this case
there is more pythonic way using reduce but yeah
 fading gate
what do you guys use for pdf reporting including pandas tables + matplotlib plots?
 grand vapor
i have 8 dataframes that each contain a good bit of data, about 3.5 GB each. so it all adds up to about 28GB. my memory can't really handle using all of them at once. is there a way to keep my dataframes without having to always commit them to memory?
 inland zephyr
does anyone have suggestion for reading reference about image embedding and the evaluation method for evaluate it?
serene scaffold
grand vapor
i have 8 dataframes that each contain a good bit of data, about 3.5 GB each. so ...
look into dask. also this SO answer: https://stackoverflow.com/questions/61920105/dask-applying-a-function-over-a-large-dataframe-which-is-more-than-ram
Stack Overflow
It is believed that Dask framework is capable of handling datasets which are more than RAM in size. Nevertheless, I wasn't able to successfully apply it to my problem, which sounds like this:
I ha...
 ocean pier
Hey guys! I need a help regarding the courses for data science and ai. Anyone here got any idea of any good free online course available for data science and ai?
 rapid urchin
I'm trying to categorise keyword for PESTLE analysis, is there dictionaries that can identify whether the word is used in either politic, economic, social, tech, legal, environmental...?
exotic thicket
@mild dirge computer vision course which I'm struggling to understand it's physical and mathematical underpinning..
I find hard solving it
Like finding irradiance, radiance , radiosity, lambertarian surface and many more mathematical problems which is difficult
Which courses should I take for linear algebra?
arctic wedgeBOT
Hey @exotic thicket!
It looks like you tried to attach file type(s) that we do not allow (.pdf). We currently allow the following file types: .gif, .jpg, .jpeg, .mov, .mp4, .mpg, .png, .mp3, .wav, .ogg, .webm, .webp, .flac, .m4a, .csv, .json.
Feel free to ask in #community-meta if you think this is a mistake.
exotic thicket
 exotic thicket
exotic thicket
exotic thicket
Particularly problems like this I'm finding hard
It's mathematical and physical underpinning of Computer vision
iron basalt
exotic thicket
Which courses should I take for linear algebra?
It's algebra and calculus.
For physics concepts, I recommend this reference: http://hyperphysics.phy-astr.gsu.edu/hbase/hframe.html
 river maple
i've trained a custom yolov4 model but its not detecting objects more than 50
is it capped at 50?
exotic thicket
iron basalt
For physics concepts, I recommend this reference: http://hyperphysics.phy-astr.g...
Thank you dude is there particularly for computer vision bcas it's saves my time
tacit basin
river maple
i've trained a custom yolov4 model but its not detecting objects more than 50
You mean 50 per image?
 urban lance
I'm trying to use chi-square distance to calculate the difference between 2 arrays. Unfortunately when 2 values equal 0 the whole row get's a value of nan (basically 0)
this is true for all rows in my dataset (as I have a lot of 0s and I can't drop them cause 0 is also a valid value)
I wanna use chi2 distance as affinity for hierarchical clustering but that means values cannot be nan
What would be the best way to approach this problem
(I also looked into fisher exact but it's expecting an array of just 2 values)

 tidal bough
urban lance
I'm trying to use chi-square distance to calculate the difference between 2 arra...
tidal bough
urban lance
I'm trying to use chi-square distance to calculate the difference between 2 arra...
Chi2 isn't defined for two zeros, so it's your call what to do here, I think. What about replacing all the nans with, say, zeros after calculating the distance?
urban lance
well I've replaced them with 0s
but the issue is that every row results in a nan
@tidal bough
so I have no distance data
tidal bough
Oh, I see
I guess the reason scipy.stats.chisquare doesn't have a parameter determining how to handle the zero values is because:
This test is invalid when the observed or expected frequencies in each category are too small. A typical rule is that all of the observed and expected frequencies should be at least 5.
urban lance
of I'm doing this:
def chi2_distance(A, B):
    #A = np.array(A, dtype='int64')
    #print(A, B)
    chi = 0.5 * np.sum((A - B) ** 2 / (A + B))
    if chi != chi:
        #print(0)
        return 0
    #print(chi)

return chi```the scipy function is giving me a whole sorts of other problems
this method is way better
tidal bough
yeah, manually implementing chi2 with whatever behaviour you want would be a solution
You can then make it replace nans with zeros before summing.
urban lance
there are no nan values in my dataset
it's returning nan when 2 values of the given arrays are 0
tidal bough
Yeah, hence you probably want to do
# (optionally) make sure there's no nans in A and B
dists = (A - B) ** 2 / (A + B)
# replace all nans(which would occur where A==B) with zeros in dists
chi = 1/2 * dists.sum()
I'm unable to see why that would help 🤔
 nova widget
Im using a confusion matrix in sk-learn. IndexError: index 1 is out of bounds for axis 0 with size 1. What is axis 0?
tidal bough
Because here you'd be replacing the nans before summing them. So it isn't the overall result you're replacing, but the individual distances between pairs of elements.
tacit basin
river maple
yeahh
Which repo are you using for inference?
 regal gale
 urban lance
now I'm dumbfounded by me result
I'm printing the distance matrix here

but when I do it again it has no clue what the distance matrix is

(it's not to do with global variables
tidal bough
huh, you're getting internal errors in both cells
tidal bough
if you haven't spent much time customizing your jupyter/ipython, I'd try reinstalling them
 river maple
tacit basin
Which repo are you using for inference?
river maple
tacit basin
Which repo are you using for inference?
not sure what you mean by that. im following the ai guy tutorial. He used tensorflow to implement the yolov4
tacit basin
river maple
not sure what you mean by that. im following the ai guy tutorial. He used tensor...
can you share link, i want to look at the code. thanks!
river maple
GitHub
A Wide Range of Custom Functions for YOLOv4, YOLOv4-tiny, YOLOv3, and YOLOv3-tiny Implemented in TensorFlow, TFLite, and TensorRT. - GitHub - theAIGuysCode/yolov4-custom-functions: A Wide Range of ...
tacit basin
river maple
https://github.com/theAIGuysCode/yolov4-custom-functions
you can try with lower confidence threshold to see if that changes aything:
--score: confidence threshold
(default: 0.25)
on your picture i see the score is quite low for some ppl on the image. if you lower that threshold you can detect more ppl, but you aslo can have more false detections
pastel valley
tacit basin
It's fine. Also you want to make sure that your test set has examples of all cla...
my test set is like 20% of each class
so its not that balanced
 urban lance
but when I do it again it has no clue what the distance matrix is
urban lance
urban lance
but when I do it again it has no clue what the distance matrix is
has anyone got a clue?
making a deep copy of the matrix doesn't work either
 river maple
tacit basin
you can try with lower confidence threshold to see if that changes aything:
-...
river maple
tacit basin
you can try with lower confidence threshold to see if that changes aything:
-...
i did that in 0.1 confidence threshold
still it doesn't gives me more than 50 objects
urban lance
urban lance
the issue was with %%timeit somehow
tacit basin
river maple
still it doesn't gives me more than 50 objects
Do you get objects with confidence around 0.1?
 mint palm
i was able to understand DL without getting any intro to ML......is there a need to go back to ML for any reason.....
just checked out......ML is just DL without layers lmao
 odd meteor
regal gale
odd meteor
regal gale
Hi Jessica, this is quite easy. What you're asked to do is to use the three explanatory variables you're privy to, to fit a linear regression model using eqn(3)
You're also specifically told to set a seed or random_state. So ensure to use that value.
Then, you're also told to use statsmodel library instead of sklearn to get the work done.
I hope you understand it now. If you understand regression and can do that using sklearn, I believe you can easily get it done with statsmodel as well. In fact, result gotten from statsmodel is quite rich in detail unlike sklearn. It makes you appreciate Statistics even more!
tacit basin
mint palm
i was able to understand DL without getting any intro to ML......is there a need...
depends if you want / need to do ML stuff. if not then develop further your DL skills i would say.
exotic thicket
iron basalt
For physics concepts, I recommend this reference: http://hyperphysics.phy-astr.g...
Well organized thank you so much I'm getting the concepts now little by little
river maple
tacit basin
Do you get objects with confidence around 0.1?
i got 50 when i used 0.1. It was lesser when i used greater confidence
 hollow sentinel
pastel valley
why are the first epoch taking longer time during training?
hollow sentinel
pastel valley
why are the first epoch taking longer time during training?
possible answer: https://stackoverflow.com/questions/55730488/why-do-my-earlier-epochs-take-longer-than-subsequent-epochs
Stack Overflow
I am training a model in keras, and experimenting with how the amount of data I feed in affects my resulting accuracy. I noticed something interesting though.
training samples: 5076
epoch 1: 142s
...
odd meteor
regal gale
can u help
Hi, helping you solve the assignment would mean depriving you the opportunity to learn.
This will help you out
import statsmodels.formula.api as smf
results = smf.ols('y ~ X1 + X2 + X3', data = your_df). fit()
print(results.params)
X1, X2, X3 = are your explanatory variables. So replace them with the appropriate column names in your data.
y = your response variable. So replace this with the appropriate column as well.
I believe you should be able to continue from here. If you encounter any issues, you can easily get more information online.
urban lance
what clustering methods work with custom distance matrices?
pastel valley
https://keras.io/api/metrics/classification_metrics/#precision-class
https://keras.io/api/metrics/classification_metrics/#recall-class
yo i have been using this on my evaluation is this for binary class only?
 somber prism
can someone help me with this https://www.reddit.com/r/deeplearning/comments/tbqn9l/pytorch_outputting_long_int_loss_and_showing_zero/?utm_source=share&utm_medium=web2x&context=3

reddit
0 votes and 0 comments so far on Reddit
pastel valley
pastel valley
https://keras.io/api/metrics/classification_metrics/#precision-class
https://ker...
this is what it says idk if it means binary or categorical classification

i used it on my multiclass model and resulting with this numbers which is i think correct but i saw a post that its only for binary classification so i am now confused if what am seeing is the right numbers
 regal gale
Hello
Any kind soul familiar with bootstrapping and regression model can help me out?
 torpid arrow
Hey guys, been out of the ML audio synth loop for a while - whats the best fidelity Mel Spectrogram and Audio Generator combo to use right now? looking for the bleeding edge stuff to play around with while ive got some time off from work 🙂
somber prism
regal gale
Any kind soul familiar with bootstrapping and regression model can help me out?
there are lot of good tutorials in yourtube
regal gale
I am watching them alrdy
I need someone to verify if my answer is correct
I am working ona set of qns but I have to pay
to get rhe answer
just want to compare wif someone
can u help?
somber prism
regal gale
can u help?
if i know ill help
regal gale
U dont know?
 gloomy anvil
Hello everyone! I am searching for a LSTM tutorial. I need an LSTM example, that is Multivariate and Single-Step Prediction. I find only univariate and single step or multivariate and multistep predictions. Do you know an example/tutorial, that uses multivariate data, a lag/lookback window and predicts the next step for a test dataframe?
Or maybe do you know what I can search for so that I can find a code example or tutorial?
mint palm
what is meant by "modelling" in: Modeling uncertainty in computer vision
lapis sequoia
Hi there
 modest shuttle
what is cv2.dnn.readNet?
pastel valley
i stil cant figure out if tensorflow.metrics.recall and precision is multiclass able
i saw some posts saying its not supported but its on lower versions but i cant see if its added on newer version either ahahaha
 sage fulcrum
hello 😦
does anyone finish project "song retrieval by lyrics query" 😦
i have search but didnt see any clue 😦, anyone have any idle
 rough mountain
When training my model I had it set to save with model checkpoint. Now I'm trying to load this model. For some reason it always predicts one (binary classification). Any way I can fix it without retraining the model from scratch or how can I make sure this does not happen again.
somber prism
gloomy anvil
Hello everyone! I am searching for a LSTM tutorial. I need an LSTM example, that...
check andrew ng lstm course, i didnt see that course yet but check that anyway
 spiral gale
i am baffled by the speed of some pandas dataframe functions.
how does it work that one line of code does what a nested loop would need minutes for within some seconds? e.g. groupby functions
serene scaffold
spiral gale
i am baffled by the speed of some pandas dataframe functions.
how does it work ...
The easy answer is "it's implemented in C", though I wonder if there are additional optimizations as well. (ie optimizations in the algorithms themselves.)
misty flint
mint palm
what is meant by "modelling" in: Modeling uncertainty in computer vision
probably bayesian-type of models
regal gale
I need to do a bootstrap sampling for regression
misty flint
you can find stuff for that online
regal gale
I did
misty flint
ok then youre good
spiral gale
serene scaffold
The easy answer is "it's implemented in C", though I wonder if there are additio...
so the functions are not doing it in python somehow? (I don't know much about languages)
misty flint
no, im not really here to help, sorry. just to discuss.
serene scaffold
spiral gale
so the functions are not doing it in python somehow? (I don't know much about la...
nope. they're written in C using Python's language API, so they can do CPU-bound operations much faster.
 spiral gale
serene scaffold
nope. they're written in C using Python's language API, so they can do CPU-bound...
spiral gale
serene scaffold
nope. they're written in C using Python's language API, so they can do CPU-bound...
that's crazy
serene scaffold
also, when a dataframe has numbers in it, those numbers aren't python objects
so they can exist as adjacent elements in a C array
spiral gale
i see
pastel valley
yo anyone here tried precision and recall on multiclass on tensorflow? does tf.metrics.precision good for multiclass?
spiral gale
damn that's interesting as hell
serene scaffold
pastel valley
yo anyone here tried precision and recall on multiclass on tensorflow? does tf.m...
example? you can have precision and recall scores for multiclass classification, yes.
pastel valley
serene scaffold
example? you can have precision and recall scores for multiclass classification,...
these are my metrics and i have 6 classes
 misty flint
this was interesting
 pastel valley
so this precision and recall scores are correct?
 serene scaffold
please do actual text, not screenshots.
 severe girder
Hi everyone, is there anyone know R programming
serene scaffold
looks like loss, accuracy, precision, recall, and f1 to me. I'm not sure what the question is.
pastel valley
METRICS = [
      keras.metrics.CategoricalAccuracy(name='accuracy'),
      keras.metrics.Precision(name='precision'),
      keras.metrics.Recall(name='recall'),
      tfa.metrics.F1Score(num_classes=6, average='weighted', threshold=0.7)
]

base_model = Sequential()

base_model.add(resnet50_model)

base_model.add(Flatten())
base_model.add(Dense(1024, activation='relu'))
base_model.add(Dropout(0.5))
base_model.add(Dense(512, activation='relu'))

base_model.add(Dense(6, activation='softmax'))

base_model.compile(optimizer='adam', loss='categorical_crossentropy', metrics=METRICS)

base_model.summary()
that's out of scope for this server; sorry
pastel valley
serene scaffold
looks like loss, accuracy, precision, recall, and f1 to me. I'm not sure what th...
does it compute the macro precision and recall ?
serene scaffold
pastel valley
does it compute the macro precision and recall ?
not sure. where does METRICS get used in the rest of the code?
pastel valley
because i saw a post somewhere saying that precision and recall doesnt support multiclass but its on older versions of tensorflow and i cant find any post saying its supporting multi class now in latest version
serene scaffold
alright, let me check.
pastel valley
serene scaffold
not sure. where does `METRICS` get used in the rest of the code?
i editted the code with METRICS
serene scaffold
thanks, I'm looking through the docs
I haven't found an answer but unfortunately I need to get back to what I was doing
TensorFlow
Public API for tf.keras.metrics namespace.
pastel valley
ive been there it says labels but its not clear to me if its good for multiclass but i dont get an error but there is also a possibility that the results precision and recall are not correct hahhaa
anyways thank you for your time 😅 👍

does anyone use tensorflow for multi class classification then used precision and recall for evaluation? what you guys used? tf.metrics?
there is this tfa.metrics.f1score where it computes the f1score directly
should i just create confusion matrix and calculate the precision and recall manually?
or there are things for this problem?
lapis sequoia
@terse oracle you can ask here instead of DM.. I'm sorry I've been busy lately so couldn't reply.
rough mountain
rough mountain
When training my model I had it set to save with model checkpoint. Now I'm tryin...
ugg, I can't even find a single example of this happening on google.
After doing some more testing my binary classification models always produce ones when using model checkpoint.
But not if I just load them from a model.save()
callbacks.ModelCheckpoint(f"checkpoint/{name}.h5", monitor='val_loss', save_best_only=True, save_freq='epoch')``` frosty flower

Anyone know how the highlighted part is derived?

Cross Validated
I am reading a book on linear regression and have some trouble understanding the variance-covariance matrix of $\mathbf{b}$:
The diagonal items are easy enough, but the off-diagonal ones are a bit...
 serene crystal
Hello everyone, I'm looking for some advice, it fits a little bit under UI as well, but more so here I believe. If this isnt the right place for this please let me know!
So for a club I'm part of I'm on the receiving end of data from a bunch of sensors, and I need to basically make a program that can read in that data and display it. Currently I have a rough working program but it's messy and isn't great. It needs to
a.) display realtime data received as bytes via serial connection and be able to change what is being displayed based on user designation (so like graphs with drop downs for what to show, would be ideal)
b.) be able to be stored as a csv (this parts not to hard)
c.) display data like above but instead of realtime data, have it be read from a CSV
I was wondering how you all would go about something like this? like what kinds of libraries would you use, how would you generally approach this problem? My current program can read the data, and display it however what is being displayed has to be hard coded, and it's messily done, it's kinda just a proof of concept. It currently uses pyserial, matplotlib, and pandas to do this, which may not be the most ideal libraries
I've included a picture of kinda the rough end goal UI, here are the labels
(1) dropdown menu to select which line to display
(2) button to delete that line
(3) button to add a line (will make another dropdown appear
(4) button to delete plot
(5) button to add plot
(6) Store data
(7) Select file to read from
 neat anvil
serene crystal
Hello everyone, I'm looking for some advice, it fits a little bit under UI as we...
neat anvil
serene crystal
Hello everyone, I'm looking for some advice, it fits a little bit under UI as we...
I would use plotly dash. You can do all that just using it, and more. I'd say it's easy but it's not cus what you're describing is complicated, but it's not so hard https://dash.plotly.com/
Plotly Dash User Guide & Documentation
serene crystal
neat anvil
I would use plotly dash. You can do all that just using it, and more. I'd say it...
tysm!
 ashen umbra
Hey is anyone here open to do a intermediate level data science project together in python?
I have 1+ years of experience in python esp in pandas numpy and I have been involved in couple of personal ML projects
I haven't solidified any ideas yet but I am open to brainstorm ideas! Dm me if you are down!
 steep lotus
Sorry for late reply never got a notification. This was really helpful thank you Rex
lapis sequoia
ashen umbra
Hey is anyone here open to do a intermediate level data science project together...
pinged you! interested. 👏🏽
iron basalt
serene scaffold
The easy answer is "it's implemented in C", though I wonder if there are additio...
I'm guessing not really, because it does not really need it. Although I would not be surprised if it uses multiple threads (given a large enough df) and SIMD when available. I have read through numpy's source, but not pandas yet. Might do it later, can let you know then.
neat anvil
A huge factor is that Pandas data frames are structured in memory in a columnar data structure, with some intelligent optimization. Meaning operations on a column in pandas done in the right way are ludicrously fast. even if there is a thousand columns and gigabytes of data in a single data frame, when you do operations on one or a few columns, it only has to read from memory and work on a tiny fraction of the data at once.
 iron basalt
DataFrame is a 2-dimensional labeled data structure with columns of potentially different types. You can think of it like a spreadsheet or SQL table, or a dict of Series objects.
Series is a one-dimensional labeled array capable of holding any data type (integers, strings, floating point numbers, Python objects, etc.). The axis labels are collectively referred to as the index.
Since each series in a nice contiguous homogeneous chunk of data, running over them in order in a loop (in C) will be very fast.
(This is for the ideal just numbers Series, more complicated data types might become slower again)
neat anvil
Series<object> 🤮
 pseudo wren
Greetings
I am trying to compare two rows at time
i'm struggling a little with remembering the syntax
the example i'm using is a Titanic Dataframe
there is a column for survivors
and i want to count all women who survived
there's a separate column for sex
neat anvil
it'll be easier to get help if you paste your code into a snippet
pseudo wren
here's the csv i'm using
I want to count all the women who have survived
but i am struggling to find the syntax in the docs
prime hearth
you can do:
df.loc[(df.sex==''f' ) & (df.survive==1)] then add .count() etc
df.locate on condition is meaning of loc
() used to group by condition i think it required
and we use only one & not && for dataframe loc
pseudo wren
@prime hearth hm
so
it says the syntax is wrong
searching the docs but cant find anything
prime hearth
it right
i think i just added an extra '
next to female
and df is the dataframe variable object name
if cant use .columnName
use ['']
it does work this but like im assuming you have knowledge of dataframes , pandas
pseudo wren
i do
prime hearth
yeah it should work then
df.loc[(df['sex']=='f' ) & (df.survive==1)]
i not sure if those are the correct column names
pseudo wren
so
i get an output
but it doesn't say how many women survived
it just outputs the survived column
for some reason
prime hearth
oh
you can also do
temp =df[df[sex] == female]
that will return df of all females
then repeat with same df ( temp in this case) but add condition for survive
then use pandas.count or describe method to see count of surival
pseudo wren
hm
prime hearth
if not, maybe someelse can help, both of these methods should work though just slight tweaking
but can try watching tutorial on pandas they might show or remind how to do locate on conditions
 loud thicket
Hello,
I need help regarding object counting in a tensor flow model, I am able to detect objects but not count them
i am able to get the detection classes, boxes and scores
but not able to come up with a system to track them,
regal gale
Hello
graceful glacier
i asked this quesion in the wrong channel before
so here is my table

.
the year column is from 2017 - 2020
are there any tools i can use to get a YTD and a MTD column
or am i missing somthing and theres a simpler way to do it?
.
what i am thinking of doing is creating a helper table,
using shift() to get the previous period numbers,
and then joining back up with the original table
.
 forest bluff
- Dataset intelligentGuessingDataSet.csv has a format of [rownum,firstname,lastname,email,Email Pattern,Comments]
rownum 1 to 22 has got the patterns for the left part of the email. Your task is to complete the patterns for rownum 23 to 53. The submission file problemset1_submission.csv must have headers [rownum,firstname,lastname,email,Email Pattern]
Example of pattern:
<11> - Firstname
<22> - Lastname
<1> - First letter of firstname
<2> - First letter of lastname
<20> First part of lastname
<21> Second part of lastname
<11-f2l>first 2 letters of firstname
and more.
help me solving this problem
regal gale
Hello
 terse oracle
I did apply tf-idf to my text, and used NB as my classifier, it worked but the accuracy could be improved I guess, I will show you the pre-processing that I did.
@lapis sequoia


does anyone have any idea how to improve accuracy?
pastel valley
this validation scores are the calculated metrics based on the output of
predictions = gt_model.predict(test_generator)
where test_generator is my validation data during training
but when i tried to create confusion matrix and calculate the accuracy precision etc its different than the validation scores of the last epoch of my training
 terse oracle
pastel valley
this validation scores are the calculated metrics based on the output of
```pyt...
terse oracle
pastel valley
this validation scores are the calculated metrics based on the output of
```pyt...
are you talking to me or asking a question?
pastel valley
terse oracle
are you talking to me or asking a question?
sry its a question
terse oracle
ok
forest bluff
import pandas as pd
import re
df=pd.read_csv(r'C:\Users\GGMU\Desktop\Data Engineer\TEST\intelligentGuessing\intelligentGuessingDataSet',encoding='latin-1')
df=df.set_index('rownum')
print(df)
h = re.findall('[A-Za-z0-9.+-]+@[A-Za-z0-9.-]+.[a-zA-Z]*', str(df))
email_users = [ x.split('@')[0] for x in h ]
email_name=[x.split('.')[0] for x in email_users]
email_name
email_users
how can i print pattern matching below condition
<11> - Firstname
<22> - Lastname
<1> - First letter of firstname
<2> - First letter of lastname
<20> First part of lastname
<21> Second part of lastname
<11-f2l>first 2 letters of firstname
and more.
 regal gale
hi
Fit a logistic regression model using 70%-30% of the data for training-testing the model. Report the
area under the roc-curve, simply called AUC, for the test sample
Anyone know how to do this
tacit basin
regal gale
Fit a logistic regression model using 70%-30% of the data for training-testing t...
Use train test split from svikit learn to split to 70/30
Use logistic regression from scikit learn on train data
Calculate auc for test data
forest bluff
tacit basin
Use train test split from svikit learn to split to 70/30
Use logistic regression...
how can i
tacit basin
forest bluff
how can i
from sklearn.model_selection import train_test_split
X_train, X_test, y_train, y_test = train_test_split( X, y, test_size=0.3, random_state=42)
cant we do it from regular expresssion ??
forest bluff
tacit basin
```py
from sklearn.model_selection import train_test_split
X_train, X_test, y_tr...
?
pastel valley
what is difference of model.evaluate vs model.fit validations scores?
tacit basin
forest bluff
cant we do it from regular expresssion ??
Do what from regular expression?
 hollow zephyr
Hello i use pandas to convert csv into xslx, how can i use wrap text on all cells on created xlsx
hollow sentinel
url = 'https://www.fdic.gov/bank/individual/failed/banklist.html'

dfs = pd.read_html(url)

Look up information on failed banks, including how your accounts and loans are affected and how vendors can file claims against receivership.
!pastebin
arctic wedgeBOT
Pasting large amounts of code
If your code is too long to fit in a codeblock in discord, you can paste your code here:
https://paste.pythondiscord.com/
After pasting your code, save it by clicking the floppy disk icon in the top right, or by typing ctrl + S. After doing that, the URL should change. Copy the URL and post it here so others can see it.
hollow sentinel
there is clearly a table here
unless they removed scraping privileges
no, it wouldn't be on the documentation page of pandas if it wasn't allowed to be used
or the format is not what i think it is
is this necessarily scraping?
actually, it is
that's unbelievable
i love pandas
regal gale
hi\
hollow sentinel
shit is amazing
regal gale
Fit a logistic regression model using 70%-30% of the data for training-testing the model. Report the area under the roc-curve, simply called AUC, for the test sample.
hollow sentinel
do you know what a ROC and AUC is
hollow sentinel
well what i'm thinking is you call traintest split and split the data into training like .7 and test .3
there should be some sort of metric to get the auc
as for logistic regression, importing scikit learn and then using the logistic regression object should do the trick
but is this data you scraped?
regal gale
no
hollow sentinel
don't dm me the csv, thanks
just put it here
https://www.kaggle.com/startupsci/titanic-data-science-solutions good implementation of logistic regression

Explore and run machine learning code with Kaggle Notebooks | Using data from Titanic - Machine Learning from Disaster
it's not very difficult to implement, what's key here is having a basic idea of what it is

Logistic regression is a traditional statistics technique that is also very popular as a machine learning tool. In this StatQuest, I go over the main ideas so that you can understand what it is and how it is used.
For a complete index of all the StatQuest videos, check out:
https://statquest.org/video-index/
If you'd like to support StatQuest...
i'm a big fan of statquest
and i would recommend these videos for classification metrics

Please join as a member in my channel to get additional benefits like materials in Data Science, live streaming for Members and many more
https://www.youtube.com/channel/UCNU_lfiiWBdtULKOw6X0Dig/join
Please do subscribe my other channel too
https://www.youtube.com/channel/UCjWY5hREA6FFYrthD0rZNIw
Connect with me here:
Twitter: https://twitt...

Please join as a member in my channel to get additional benefits like materials in Data Science, live streaming for Members and many more
https://www.youtube.com/channel/UCNU_lfiiWBdtULKOw6X0Dig/join
Complete ML Playlist: https://www.youtube.com/playlist?list=PLZoTAELRMXVPBTrWtJkn3wWQxZkmTXGwe
Please do subscribe my other channel too
https://...
confusion matrices are always nice

In this video we go over the basics of logistic regression, a technique often used in machine learning and of course statistics: what is is, when to use it, and why we need it. The intended audience are those who are new to logistic regression or need a quick but thorough review. Thank you and please subscribe! - Brandon
For my complete video ...
and this can start explaining the math behind it, if you're interested.
would recommend that you gain a conceptual understanding of it first, because jumping into the math beforehand can overwhelm you
tacit basin
regal gale
Fit a logistic regression model using 70%-30% of the data for training-testing t...
I already provided you with 30% of code needed. Did you see it?
tacit basin
hollow sentinel
my bad
That's fine. No worries. No sure why the question is still the same. Maybe they are looking for all the code needed with no interest to learn. It seems like an assignment anyways
hollow sentinel
yeah, i thought the question seemed very assignment worded
not a very focused question more like a i need the code question
so i gave a more general answer
regal gale
hollow sentinel
looks like you’re gonna have to do some data cleaning and exploratory data analysis
regal gale
u can download
hollow sentinel
i am not clicking that lmao
regal gale
I am not sure what is x and Y
hollow sentinel
that looks sus to me
hollow sentinel
here’s an idea for you
read it as a csv with pandas
and give us the first 3 lines of the dataset
 hollow sentinel
yeah so here your output is either a 0 or 1
regal gale
but X i am not sure
regal gale
how do I store the X?
hollow sentinel
var 1 etc.
terse oracle
Hello, I used Naive Bayes to classify my data, the accuracy tho didnt turn out to be that great, only 0.72, any idea on how to improve it? this is my pre-processing.
 regal gale
import matplotlib.pyplot as plt
import seaborn as sns
import numpy as np
from sklearn.model_selection import StratifiedShuffleSplit
import pandas as pd
import statsmodels.api as sm

df=pd.read_csv("santander_dataset.csv")

y=df['target']```you can do stemming so the words being together will be in just one feature giving your model a better picture.
do note that your test data will be needed to stemmed as well.
lapis sequoia
so which features do you need for X?
lapis sequoia
okay i got it.
you can just get
y = df['target'].to_numpy() # check method name for surity

# then you can either do something like
var_cols = [f'var{i}' for i in range(10)]
x = df[*var_cols].to_numpy()

# or you can delete other cols
del df['target']
# and so on
what?
lapis sequoia
what?
regal gale
range (10)?
lapis sequoia
oh. so hold on. i was too lazy to write every name so i just made a list for it.
!e
print([f'var_{i}' for i in range(10)])
arctic wedgeBOT
@lapis sequoia :white_check_mark: Your eval job has completed with return code 0.
['var_0', 'var_1', 'var_2', 'var_3', 'var_4', 'var_5', 'var_6', 'var_7', 'var_8', 'var_9']
just change it to the number you want. i think you can handle it.
regal gale
this cant run
lapis sequoia
why not? lemme try.
regal gale
import matplotlib.pyplot as plt
import seaborn as sns
import numpy as np
from sklearn.model_selection import StratifiedShuffleSplit
import pandas as pd
import statsmodels.api as sm

df=pd.read_csv("santander_dataset.csv")

y=df['target']


# then you can either do something like
var_cols = [f'var{i}' for i in range(2000)]
x = df[*var_cols].to_numpy()

# or you can delete other cols
del df['target']
# and so on```lemme try. it will probably work.
!e
import pandas as pd
d = {'var_0': [1,2], 'var_1': [1,2], 'whatever': [1,2]}
df = pd.DataFrame(d)
var_cols = [f'var_{i}' for i in range(2)]
x = df[var_cols]
print(x)
hm hold on
arctic wedgeBOT
@lapis sequoia :white_check_mark: Your eval job has completed with return code 0.
001 |    var_0  var_1
002 | 0      1      1
003 | 1      2      2
import matplotlib.pyplot as plt
import seaborn as sns
import numpy as np
from sklearn.model_selection import StratifiedShuffleSplit
import pandas as pd
import statsmodels.api as sm

df=pd.read_csv("santander_dataset.csv")

y=df['target']


# then you can either do something like
var_cols = [f'var{i}' for i in range(2000)]
x = df[var_cols]

print(x)```this?
"None of [Index(['var0', 'var1', 'var2', 'var3', 'var4', 'var5', 'var6', 'var7', 'var8',\n 'var9',\n ...\n 'var1990', 'var1991', 'var1992', 'var1993', 'var1994', 'var1995',\n 'var1996', 'var1997', 'var1998', 'var1999'],\n dtype='object', length=2000)] are in the [columns]"
lapis sequoia
regal gale
```# load libraries
import matplotlib.pyplot as plt
import seaborn as sns
import...
did you understand what i did?
terse oracle
lapis sequoia
you can do stemming so the words being together will be in just one feature givi...
the stemmer made my accuracy worse haha
 wide helm
Hey i have a gan model and first epoch has 1.0 accuracy and all the other ones has 0.5 someone wants to help or knows what to do?
lapis sequoia
terse oracle
the stemmer made my accuracy worse haha
Aw shit.
terse oracle
lapis sequoia
Aw shit.
should I try using lemmatization? or any other ideas you got? should I even try another classifier in your opinion?
lapis sequoia
terse oracle
should I try using lemmatization? or any other ideas you got? should I even try ...
Of course you can try other methods! You are not at all restricted to use one classifier.
Also I'm not aware how much words you have. If they are a lot, it's better to apply log on both sides in naive bayes since values can become very very very small
And our dear computers are not too comfortable with very very small values to compare.
It will most probably improve the performance.
Moreover since you have the data as a tfidf table now, god forbid you can even use your own NN models.
terse oracle
I did not implement it my self, i used from sklearn.naive_bayes import MultinomialNB
lapis sequoia
terse oracle
I did not implement it my self, i used from sklearn.naive_bayes import Multinomi...
Ah okay.
lapis sequoia
!e
arctic wedgeBOT
 Command Help
!eval [code]
Can also use: e
*Run Python code and get the results.
This command supports multiple lines of code, including code wrapped inside a formatted code block. Code can be re-evaluated by editing the original message within 10 seconds and clicking the reaction that subsequently appears.
We've done our best to make this sandboxed, but do let us know if you manage to find an issue with it!*
 burnt lance
Hey people… can someone with a few years of business experience please inform me the core skills for python and python libraries, and also how much and how advanced sql one usually needs. Appreciate a good overview of this. Cheers
lapis sequoia
!e
arctic wedgeBOT
Command Help
!eval [code]
Can also use: e
*Run Python code and get the results.
This command supports multiple lines of code, including code wrapped inside a formatted code block. Code can be re-evaluated by editing the original message within 10 seconds and clicking the reaction that subsequently appears.
We've done our best to make this sandboxed, but do let us know if you manage to find an issue with it!*
@lapis sequoia :x: Your eval job has completed with return code 1.
001 | Traceback (most recent call last):
002 |   File "<string>", line 2, in <module>
003 | ModuleNotFoundError: No module named 'selenium'
@lapis sequoia :x: Your eval job has completed with return code 1.
001 | Enter a number: This is finalyy
002 | Traceback (most recent call last):
003 |   File "<string>", line 16, in <module>
004 |   File "<string>", line 4, in new_func
005 | EOFError: EOF when reading a line
@burnt lance depends on the job
some companies may use 100+ libraries (exaggeration but the point is a lot)
so python alone and flask alone isnt everything
but for entry positions, like internships or maybe even juniors
or for any general role, good knowledge of programming is needed in this case for python, need to know OOP and basic coding
and knowledge of one framework in this case can be flask for python
and knowledge of. good software design patterns ( SOLID), facade pattern or stragety pattern etc...
and good coding practice ( organizing files correctly allowing for modularity, and good naming conventions)
and how to use version control
if intertested in specific field then can find what tools companies are using for that in general like what are the most common
for the techs that companies use are not all the same
as for sql, again depends on job may not even work with sql, but for backend need to know enough sql to be able to solving coding problems involving sql
burnt lance
Thank you so much for the response. 🙏 I understand it does depend. But let’s do this. I describe what I know currently and you recommend me what I can do to fill out. I know python basics, have started to do recursion and a few search and sort algorithms. Most used libs include pandas, numpy, sqlalchemy, seaborn, flask/fast API, bs4 and requests. I know basic CRUD against MySQL, Microsoft SQL, postgres and mongoDB. I am azure focused and have light knowledge of data facorty and databricks. Learned to work with Microsoft graph api and some azure sdk for python. I know basic Linux with zsh, git and have also started to learn some yaml. I am adept at modeling and visualization with power BI. Where do I need to look and improve myself to land a data engineer/analyst/science job? Please point out my weak spots.
prime hearth
i think raymond might help
neat anvil
Sounds like a reasonable list of skills
prime hearth
^ yeah might as well as apply and see what job requires
neat anvil
You don’t mention any version control experience, but that’s not a dealbreaker for most junior positions
prime hearth
i would say also ^ not to keep learning more technologies as you can end up in loop hole trying to learn every stack and focus on one area daat engineering if intersted or data anaylst( this require like working with data and lots of youtube guides on what to lean for this role)
just apply to jobs interested and if get interview thats great
if fail interview, can learn from those mistakes
for data science, it very broad but for data science related to ML then you would need to know ML or Deep learning, and specific like NLP or time series etc dependign on job description
neat anvil
Yeah I mean that’s a very broad list. If you know all that stuff in depth, you can run a whole company’s tech stack with it. So learning more different stuff at this point would probably benefit you less professional than digging deeper into those things you’re already somewhat familiar with
pastel valley
how to calculate precision and recall for multiclass on keras?
also what does one hot label mean?
burnt lance
Great advice guys. I will take you up in your recommendation and just dig deeper into the things I mentioned and keep interviewing. (Ps. I use basic azure devops and GitHub functionality almost daily , but I don’t know how to work in a team). At least it seems my “map” is pretty accurate. Nice to get that confirmation. ( I can probably pick up scikit, PyTorch in addition)
 warm valley
Hello, I have a question.
I want to make a customer classifier.
Normally, for feature detection, I would use Resnet or vgg.
But what to do if it not at all connected to it.
For ex, hair style detection
pastel valley
does anyone use this metrics on keras? for multiclass models?

is it accurate? i mean i see example of precision and recall for binary only and to compute for multiclass its kinda different so i dont know if this also works for multiclass
maybe someone here used those before of multiclassification model?
serene scaffold
@pastel valley just so you know, I'm making a note not to answer any questions you ask that involve screenshots of text anymore. Please make things easier for answerers by giving code and error messages as text.
 gilded kestrel
if you have a set of categorical variables, for which the interaction is important (meaning the combination of these variables), which is the most suitable encoding?
serene scaffold
gilded kestrel
if you have a set of categorical variables, for which the interaction is importa...
not sure I follow. what are the categories?
gilded kestrel
hmm ok, for example imagine a dataset made up of 1v1 matches in a video game where players can pick between 4 different factions
so I'd have player1_faction and player2_faction and then several other attributes for each player
*_faction takes 4 values, 0, 1, 2, 3 but what is important is the combination of these e.g. 1 vs 3, 0 vs 2 etc
gilded kestrel
serene scaffold
not sure I follow. what are the categories?
^
also to note that would be for something simple such as log reg or rf, dt...
pastel valley
serene scaffold
<@!694276264273641483> just so you know, I'm making a note not to answer any que...
i dont know what to post i just want to make sure if keras.metrics.precision and recall works on multiclass and i dont see on docs that it doesnt work for multiclass but it doesnt also say it works for multiclass
i dont get any error but i dont know if the scores i get is the right precision and recall for my model
so maybe the question will be
how to get the precision and recall on multiclass on keras? does keras.metrics.precision work correctly?
serene scaffold
pastel valley
i dont know what to post i just want to make sure if keras.metrics.precision and...
I wasn't able to answer this question when you asked it yesterday; I'm just letting you know that I won't attempt any future questions you ask that involve screenshots that could have been copy/pasted text.
serene scaffold
gilded kestrel
hmm ok, for example imagine a dataset made up of 1v1 matches in a video game whe...
is the model supposed to predict which team won?
gilded kestrel
serene scaffold
is the model supposed to predict which team won?
yes
serene scaffold
gilded kestrel
yes
what information does the model use to make that judgement?
gilded kestrel
serene scaffold
what information does the model use to make that judgement?
elo + the difference of around 15 shifted rolling averages for the rest of the attributes + hopefully each player's faction (but my intuition says that the previous 15 attributes depend on the faction and the matchup faction combination to some degree)
i believe there is no data leakage if that's what you're asking
serene scaffold
gilded kestrel
i believe there is no data leakage if that's what you're asking
idk what you mean by data leakage, at least not by that name.
gilded kestrel
serene scaffold
idk what you mean by data leakage, at least not by that name.
In statistics and machine learning, leakage (also known as data leakage or target leakage) is the use of information in the model training process which would not be expected to be available at prediction time, causing the predictive scores (metrics) to overestimate the model's utility when run in a production environment.[1] from wikipedia but it gives an ok definition
anyway, do you have any suggestion for my question?
serene scaffold
interesting. anyway, I would probably arrange each training instance to have information about the "left team" and "right team", and then the target can just be [1, 0] if the left team won or [0, 1] if the right team won.
gilded kestrel
yup I have that already, but my question is more geared at the 'faction' attributes, e.g. I could do one hot encoding (so from 2 cat features -> 8 binary features (or N-1 twice can't remember if it works with N or N-1)) but I'm not sure if that can capture the interaction of these. I had a look at 'effect coding' which seems like the right direction but I don't really know much about it. Another thought was, maybe merge the two attributes into one e.g. player1_faction: 1 vs player2_faction: 2 becomes matchup_factions '12' and the do some cat encoding
serene scaffold
I should probably just keep quiet to make way for someone with more experience with this kind of model
gilded kestrel
hmm ok but anyway any suggestion or idea is welcome
serene scaffold
be careful opening yourself to any and all suggestions on a Discord 😛
regal gale
Hi
Anyone know how to add y-intercept to regression model
x_train,x_test,y_train,y_test=train_test_split(x,y,test_size=0.3)
logistic_regression = sm.Logit(y_train, x_train)
fitted_model = logistic_regression.fit()
print(fitted_model.summary())```You are hired by Santander Consumer Bank as data scientist and your first task is to identify which customerswill make a specific transaction in the future, irrespective of the amount of money transacted. To that end, an analyst delivers to you a data set ready for modeling purposes. The file santander_dataset.csv contains 200 numerical features, one binary response variable and one customer identifier for a total of 200 000 customers. Further, the binary variable indicates whether that customer made a purchase in the future.
You are eager to deliver some results to your boss and
4.1 Fit a logistic regression model using 70%-30% of the data for training-testing the model. Report the area under the roc-curve, simply called AUC, for the test sample.
Note: You are advised to use sm.Logit from statsmodels, otherwise make sure the library that you choose does not include a regularization term by default. You are also advised to use an intercept in your logistic regression model.
gloomy anvil
Is there a good soul, that can help me understand the dimensionality of a data array for LSTMs? My question was not really well received at Stackoverflow: https://stackoverflow.com/questions/71452208/i-need-help-understanding-and-reshaping-inputs-and-dimensions-for-lstms
I know it is a long post but essentially I have an X_train dataset that has the shape (819, 80), then I run this line of code:
X_train = np.array([X[:,0:][i : i + history_points].copy() for i in range(len(X) - history_points)])
history_points is 7 btw. When I run it, X_trains shape is 812, 7, 80. As I see in axis 0 there are 7 rows and 80 columns. Axis 1 has 812 rows and 80 columns. Axis 2 has 812 rows and 7 columns.
Can you explain to me the 3 dimensions of this array? I understand the 7 means the lookback window, 812 is the number of rows (819 minus lookback window of 7) and 80 is the number of features, but I am unable to see the 3 dimensions of this array
 gloomy anvil
my goal is to train an LSTM and need the input shape for it: Model.add(LSTM(units=100, return_sequences=True, input_shape=(???)))
gloomy anvil
hollow sentinel
IDE tool 💀💀: Jupyter notebook
well jupyter kinda is a development environment ....
misty flint
hollow sentinel
the stuff i see on linkedin makes me die inside
i mean nowadays they have ways to deploy notebooks
surprisingly
gloomy anvil
yeah, i dont understand why there is anaconda and jupyter but no spyder 😄 at least be consistent haha
misty flint
hollow sentinel
idk if i’d label it as an IDE
true. i wouldnt either tbh especially for software dev stuff
misty flint
gloomy anvil
yeah, i dont understand why there is anaconda and jupyter but no spyder 😄 at le...
spyder always forgotten

hollow sentinel
i use spyder
well, used to use spyder
i use thonny now
and sometimes i use jupyter notebook bc i like quickly being able to see what i do with my data
without having to write a print line or anything
modern cypress
Does this model make sense? or do you guys instantly spot major errors or ways to improve it?

I'm trying, but honestly it just feels like putting random pieces together trying to improve the accuracy
I read something about MaxPooling, but I'm not sure where to implement this and whether it will affect the result
tacit basin
modern cypress
Does this model make sense? or do you guys instantly spot major errors or ways t...
what problem you are you tyring to solve?
did you look at existing architecutes like AlexNet: https://d2l.ai/chapter_convolutional-modern/alexnet.html#alexnet
modern cypress
Just a simple image classification problem for these classes:

I can't use existing models as this will be marked ^^
Unless I recreate them? hmm
tacit basin
modern cypress
Unless I recreate them? hmm
anyway for example Alexnet shows you where to put maxpooling layers 🙂
modern cypress
tacit basin
anyway for example Alexnet shows you where to put maxpooling layers 🙂
Mhmm. How do I decide the pool size and strides?
regal gale
Hi
tacit basin
modern cypress
Mhmm. How do I decide the pool size and strides?
looking at existing architectures they are usually 3x3
regal gale
How do I deal with non stationery data
How do I deal with non stationery data for time series analysis #help-pancakes
modern cypress
tacit basin
looking at existing architectures they are usually 3x3
Ahh right, I saw that on the link you sent but just wanted to make sure. Thanks for your help 🙂
tacit basin
modern cypress
Ahh right, I saw that on the link you sent but just wanted to make sure. Thanks ...
how many training images do you have? data augmentation help a lot usually.
regal gale
How do I deal with non stationery data for time series analysis help-pancakes
modern cypress
tacit basin
how many training images do you have? data augmentation help a lot usually.
About 3000 for the 4 classes together and 3000 for the default class. I also flip horizontally for all the images 6k actually
I was thinking about doing some rotations, but will see how the pooling affects ^^
Currently at 71% accuracy. Class 4 is my fire and smoke class, which is what I am mainly looking for
 tacit basin
modern cypress
Currently at 71% accuracy. Class 4 is my fire and smoke class, which is what I a...
tacit basin
modern cypress
Currently at 71% accuracy. Class 4 is my fire and smoke class, which is what I a...
you have unbalanced dataset?
tacit basin
modern cypress
About 3000 for the 4 classes together and 3000 for the default class. I also fli...
are thes on validation set?
modern cypress
tacit basin
you have unbalanced dataset?
unfortunately I do, is this something I should fix? I got tired of having to go through and remove pictures that included more than one of the classes I was looking for
modern cypress
tacit basin
are thes on validation set?
what do you mean?
Oh, yeah those results are from my x_test and y_test
regal gale
How do I deal with non stationery data for time series analysis help-pancakes
modern cypress
 tacit basin
modern cypress
tacit basin
modern cypress
you can also check these two papers on how to improve CNN: https://arxiv.org/pdf/2110.00476v1.pdf
https://arxiv.org/pdf/1812.01187v2.pdf
modern cypress
tacit basin
you can also check these two papers on how to improve CNN: https://arxiv.org/pdf...
I'll take a look at these thank you!
 magic dune
serene scaffold
magic dune
serene scaffold
I just heard the sentence "up to petabyte scale" for the first time and I don't know what to do with that.
 stone marlin
Haha, oh no. From databricks? They usually try to flex their scaling.
Related to this channel also, I started my "Machine Learning Engineer" job a few weeks ago, which is pret much DataOps, and I've been swamped having to learn better the ins and outs of Kafka, Kubernetes, and a whole bunch of other wacky names.
But, maybe more interesting to this channel, is what our DS people are required to know. They're required to know Python, how to use Jupyter Notebooks (and how to share them), how to create Docker images with their model inside of them, and how to use Airflow. I was sort of surprised at the last two, but just wanted to note it.
Most of our models are tree-ensembles, some xgboost or lightgbm, a few linear models. I think they were talking about integrating some autoencoder preprocessing models, but not there yet.
tacit basin
stone marlin
---
Related to this channel also, I started my "Machine Learning Engineer" job a...
congrats!
in three ds/ml positions i had, at each company the job was completely different lol
stone marlin
Haha, same! I was very surprised that they had to know docker + airflow.
It is actually something we're working on eliminating, and giving them a platform to smooth over model deployment (this would actually be my job to architect with the other MLE) but for three years they've been doing this.
tacit basin
sounds like an interesting assignment
stone marlin
I'm excited to learn about a lot of this DataOps stuff, but I've got a long way to go, certainly!
I might be coming back here a bit and askin' y'all how you feel about some of the solutions we think of. :']
tacit basin
with the team we are now working on integrating a bunch of tools to help DS/ML teams to start a project. Azure, Databricks, mlflow, terraform, pyscaffold, ci/cd, this kind of stuff.
misty flint
stone marlin
---
Related to this channel also, I started my "Machine Learning Engineer" job a...
oh nice! thats the type of DS role i would want but i also banged my head when i tried to work with docker the first time

stone marlin
Haha, docker is very cute, and I've worked pretty extensively with deploying models in Docker containers at my last gig (orchestrated by K8s, but I didn't have to manage it at the last job!). It does take a bit of time to learn about it and learn why the heck you'd ever need it.
misty flint
airflow i think i tried before and i liked it
i want to try some of the automl tools they have out there
stone marlin
Yeah, Azure is a good one --- we use AWS, same deal though. Databricks we might be going to. Terraform is awesome for making configs and deployments for AWS / other cloud stuff. I also have exactly one contribution to MLFlow's codebase, but I love it. :'] We use this for single-model run analysis.
misty flint
seems like you could iterate through experiments pretty quickly
stone marlin
I have not ever heard of Pyscaffold, I'll look into that now.
misty flint
honestly sounds like you would enjoy the podcast im currently listening to
stone marlin
Yeah, AutoML is interesting (h2o is pretty cool), but you can also fairly easily set up your own "AutoML" using models that are common to your subject matter and grid over those in parallel. I'm weirdly biased against integrating automl solutions, if only because (so far as I've seen) they were slightly limited in the model types and ensembling they could do. But they're definitely a legit solution.
Haha, which podcast?
iron basalt
stone marlin
Haha, docker is very cute, and I've worked pretty extensively with deploying mod...
"why the heck you'd ever need it" - Operating systems have failed at their job.
misty flint
stone marlin
Haha, which podcast?
stone marlin
Haha, or you just want a throw-away container to run something, or you want isolation, or --- haha.
NIce, I'll check that out.
iron basalt
stone marlin
Haha, or you just want a throw-away container to run something, or you want isol...
All of which an OS is suppose to provide xd
misty flint
iron basalt
"why the heck you'd ever need it" - Operating systems have failed at their job.
true
stone marlin
I hope the OS isn't suppost'a be disposabe!
Also, docker's a nice way to make something (essentially) OS independent. I can spin up the same image if I'm on my mac, my windows, or in the cloud on some *nix.
misty flint
stone marlin
Yeah, AutoML is interesting (h2o is pretty cool), but you can also fairly easily...
thats true. i guess its just something i want to try a bit lol
stone marlin
Pyscaffold looks pretty cool! I wish I knew this before we created our own cookiecutter template, haha.
Yeah, def try out automl. You'll never know if it'll be useful to you unless you try it out!
iron basalt
stone marlin
Also, docker's a nice way to make something (essentially) OS independent. I can...
OS independent executable was also a job of the OSs.
It used to be a thing.
stone marlin
? What do you mean? Like, one file in an OS was suppose'ta be readable by every other OS?
iron basalt
Yeah.
stone marlin
That seems like a wild effort at standardization, which would have been nice to see.
Alas, if that was attempted, it seems like it failed pretty spectacularly.
iron basalt
When a program is actually in memory it's running the same instructions no matter the OS, the difference is how each OS decides to get it there, which caused the cross-OS break to happen.
stone marlin
The same instructions, regardless of CPU architecture?
iron basalt
On the same CPU.
stone marlin
Ah, I see, that's the second part of what you said.
iron basalt
But alas here we are stuck with the big three Windows, Linux, Mac. So in a similar fashion to how cmake is to patch C/C++'s lack of modules, docker (and others) patches the lack of compatibility or at least ease of transferring an executable.
stone marlin
Yep, it was not meant to be. In this regard, perhaps Docker can be considered a remedy to these failures of various OSes.
Regardless, I don't think anyone would disagree it's an important tool currently in the data science / data engineering field, at least.
 iron basalt
stone marlin
Regardless, I don't think anyone would disagree it's an important tool currently...
iron basalt
stone marlin
Regardless, I don't think anyone would disagree it's an important tool currently...
It is yeah, but it's existence (that it had to be made) also upsets me.
stone marlin
Yeah, I guess if an OS had the ability to isolate running code, be able to destroy that code + anything that code made, run in parallel and distribute, and be able to share that with a config, then we'd have no real good need for containerization beyond that.
 stone marlin
Yeah, it's def important in the software world as well!
Regardless of how it got here, it's currently what we have and it's ubiquitous in the industry. Ditto for cloud tech (for its ability to go serverless and distribute, etc.).
Both great things to learn, imo, regardless of job title.
iron basalt
The closest thing I have seen to what all operating systems should be providing is Qubes, although it's still Linux and so it's a non-ideal / slightly messy solution (and also meant for single-user desktop computing).
 wary citrus
Just asking out of curiosity, what source do y'all find best (and preferably free) to start learning about Neural Networks (any type is fine).
 pliant sundial
Can someone tell me what a data scientist is?
serene scaffold
always ask your actual question, not if someone knows about a question you haven't asked.
serene scaffold
@lapis sequoia I wasn't volunteering to help, necessarily. but you should post the code and the whole error message as text. Please never share code or error message as screenshots.
!code
arctic wedgeBOT
Here's how to format Python code on Discord:
```py
print('Hello world!')
```
These are backticks, not quotes. Check this out if you can't find the backtick key.
misty flint
pliant sundial
Can someone tell me what a data scientist is?
thats a loaded question. means different things to different people. companies arent even sure about what a data scientist is.
however, data scientists usually solve problems using data. often, there is some form of coding and machine learning in their skill set. again, the term is very broad IRL.
serene scaffold
misty flint
thats a loaded question. means different things to different people. companies a...
companies aren't even sure what a data scientist is
😂
 royal crest
I don't think the title matters much, it's more about what you do
serene scaffold
 hollow sentinel
i’m thinking about doing a project where i scrape tables of rising food prices in the world… maybe showing how they relate to each other?
hollow sentinel
serene scaffold
> companies aren't even sure what a data scientist is
😂
truer words could not be spoken
companies see the words “machine learning” and think i gotta have this as if it’s a new shiny toy
i see people use LSTMs (i don’t even know LSTMs well) when i know for sure they could’ve used simpler models
just for the hell of the LSTM
hollow sentinel
^
yep
don’t throw neural networks at a problem when you haven’t done any eda kids
wise words to live by
☕️
misty flint
we basically go back to monica rogati's DS hierarchy of needs
 hollow sentinel
what’s linear regression
misty flint
sometimes companies be like that
misty flint
hollow sentinel
i’m thinking about doing a project where i scrape tables of rising food prices i...
thats a nifty idea. you could compare between countries or something
misty flint
hollow sentinel
💀💀💀
💀
hollow sentinel
i was also thinking of scraping tables off of soccer websites
misty flint
oh nice
hollow sentinel
and using certain variables like age and weight
etc.
to predict how many successful dribbles a player can make
a successful dribble means being able to beat their marker and get past them
misty flint
i was thinking of scraping job listing info, then i realized why am i trying to do an extra project when i have negative time

misty flint
 hollow sentinel
microsoft access is the FUTURE
misty flint
even tho my company is microsoft heavy we use sql server for our stuff
hollow sentinel
microsoft 🅰️ccess
hollow sentinel
making my brain micromush
misty flint
xlookup is pretty cool
misty flint
beats all those previous lookups
misty flint
before:
let me add a column
everything breaks
hollow sentinel
😡😡😡
misty flint
misty flint
some people really love pivot tables
hollow sentinel
why write code? just make a spreadsheet
hollow sentinel
yessir
you can save your pandas stuff to excel files
and a ton of other types of files
formats i mean
misty flint
yep yep
hollow sentinel
i’m just gonna try to introduce simple small scripts
at the summer internship
just to help
hollow sentinel
defo, i actually have a series where i’ll be learning that soon
misty flint
noice bud
its easy to pick up
but business folks seem to eat it up
i just recommend optimizing it for your use case
hollow sentinel
yep
misty flint
cole knaflic writes a lot about storytelling with data that is very applicable
hollow sentinel
i’ll check him out
misty flint
she has a podcast if you listen to those
misty flint
rip
funny enough i use podcasts to save time
i listen to them during commute and workouts
misty flint
anything??

not even music?
@hollow sentinel https://www.youtube.com/watch?v=nIleuj43Jqk

#myHRfuture #DigitalHRLeaders
In the second episode from series 7 of the Digital HR Leaders podcast, David Green speaks to Cole Nussbaumer Knaflic, CEO at storytelling with data about the importance of using storytelling in people analytics. In this clip, Cole shares her tips on how to improve your skills in storytelling with data.
In the Digi...
only 5 min
hollow sentinel
misty flint
not even music?
nope
not even music
i like hearing my own breathing


 misty flint
oh bro
hollow sentinel
i don't know, i think a large part of exercise comes down to your breathing
it does
misty flint
i found a better google colab for working with others
hollow sentinel
a ton
misty flint
Deepnote
Managed notebooks for data scientists and researchers.
hollow sentinel
misty flint
i found a better google colab for working with others
ooh what is it
ooh