#data-science-and-ml
1 messages · Page 383 of 1
 serene scaffold
 violet gull
why not
serene scaffold
because each prediction counts towards tp, fp, tn, or fn
violet gull
what
serene scaffold
and then you pick a performance metric that best reflects what you want to know about the model's performance
true positive, false positive, true negative, false negative
if there's only two classes, you can basically just look at true positives and false negatives.
and then the performance is tp / (tp + fn)
violet gull
i not understand
serene scaffold
do you understand what classification is? and what a prediction is? if not, I can explain it to you.
violet gull
classification does the maffs to see what it looks most like
serene scaffold
sort of. classification is when you have categories ("classes") and you have a program that looks at data points and decides ("predicts") which category they belong to.
so you're making a classifier that predicts if something "is square" or "is not square"
make sense?
violet gull
ye
serene scaffold
so if your model says its a square, and it is a square, that's a true positive
violet gull
yes
serene scaffold
if it says it's a square, but it's not a square, that's a false positive
violet gull
ye
serene scaffold
so, why don't you rewrite your code so that it counts tp, fp, tn, and fn
and then reports (tp + tn) / (tp + fp + tn + fn) at the end
violet gull
so just redo the score function
violet gull
@serene scaffold ```py
def score(self):
tp = 0
tn = 0
fp = 0
fn = 0
for square in squares:
if self.classify(square) == True:
tp += 1
else:
fn += 1
for notSquare in notSquares:
if self.classify(notSquare) == False:
tn += 1
else:
fp += 1
return (tp + tn) / (tp + fp + tn + fn)
Generation: 1 Score 0.5!
Generation: 2 Score 0.5!
Generation: 3 Score 0.5!
Generation: 4 Score 0.5!
Generation: 5 Score 0.5!
Generation: 6 Score 0.5!
Generation: 7 Score 0.5!
Generation: 8 Score 0.5!
Generation: 9 Score 0.5!
Generation: 10 Score 0.5!
Generation: 11 Score 0.501!
Generation: 12 Score 0.5!
Generation: 13 Score 0.503!
Generation: 14 Score 0.501!
Generation: 15 Score 0.501!
Generation: 16 Score 0.501!
Generation: 17 Score 0.501!
Generation: 18 Score 0.502!
Generation: 19 Score 0.503!
Generation: 20 Score 0.503!
replace if self.classify(square) == True: with if self.classify(square):, and the other one with if not self.classify(notSquare):
so that I can be happy
violet gull
ok
serene scaffold
anyway, since there are only two classes, this means that your model is pretty much random.
serene scaffold
right
violet gull
ok
what does this decimal made by (tp + tn) / (tp + fp + tn + fn) mean btw?
its up to 0.55
serene scaffold
violet gull
its up to 0.55
in simple terms, it means that your model is 55% good
and 45% bad.
violet gull
thats better than 50% good and 50% bad
serene scaffold
well, if there are only two classes, and the chances of it being in either class are 50/50, then 50% isn't really good.
 iron basalt
violet gull
thats better than 50% good and 50% bad
iron basalt
violet gull
thats better than 50% good and 50% bad
If you flip a coin and guess heads every time you will also be 50% good and 50% bad on average.
serene scaffold
by 5% 😛
iron basalt
It is, but you want to beat it by a lot.
serene scaffold
have fun losing all your money 😛
serene scaffold
except for the people who lose everything
iron basalt
The casinos have a lot of money, on average over time they win, but it takes a while and a bunch of money.
violet gull
alright how i make my thingy more accurate
iron basalt
(And they do way more than 1% for other "games")
serene scaffold
violet gull
alright how i make my thingy more accurate
can you explain how it is that the model "learns"?
violet gull
so it makes a neural net that has 3 doing thingy matrixes
if puts in the 121 data points
it does the first doeey thingy matrix and brings it to 80 data points
it does it again and brings it to 40
then 2
it does 100 of these
it takes the best 50 and copies them over the bad 50
changes one of the matrix numbers by a tiny amount
and repreat
@serene scaffold
serene scaffold
I don't really know about neural architectures for identifying shapes, esp when they're clearly rule-based. but it sounds like you're on the right track.
serene scaffold
all models have limits 😛 but I'm sure there's one that suited to this task.
 urban prism
I'm trying to calculate the jaccard score between two values that are like:
[[[0]
[0]
[0]
...
[1]
[0]
[0]]
[[0]
[0]
[0]
...
[1]
[1]
[1]]
(dims=(256, 256, 1))
Though sklearn.metrics.jaccard_score seems to only compare lists with structures like [0,0,0,1,1,0,1]
Any ideas on how can I calculate this?
iron basalt
urban prism
I'm trying to calculate the jaccard score between two values that are like:
[[[0...
Have you tried to make it flat? .ravel().
urban prism
ValueError: Classification metrics can't handle a mix of continuous
and binary targets
Alright .astype("uint8") worked
violet gull
is there one of these that would work best for my squares and not squares?
Logistic Regression
Decision Tree
SVM
Naive Bayes
kNN
K-Means
Random Forest
Dimensionality Reduction Algorithms
Gradient Boosting algorithms
GBM
XGBoost
LightGBM
CatBoost```Thank you
serene scaffold
violet gull
is there one of these that would work best for my squares and not squares?
```Li...
try reading about what those algorithms are for, and you'll get a sense for whether or not they can be applied here
violet gull
@serene scaffold logistic regression looks good
serene scaffold
violet gull
<@!253696366952316929> logistic regression looks good
logistic regression is a component of a lot of algorithms
violet gull
so good?
serene scaffold
can you explain what logistic regression is, according to your understanding?
violet gull
Let’s say your friend gives you a puzzle to solve. There are only 2 outcome scenarios – either you solve it or you don’t. Now imagine, that you are being given wide range of puzzles / quizzes in an attempt to understand which subjects you are good at. The outcome to this study would be something like this – if you are given a trignometry based tenth grade problem, you are 70% likely to solve it. On the other hand, if it is grade fifth history question, the probability of getting an answer is only 30%. This is what Logistic Regression provides you.
thats from the website i look at
serene scaffold
sure, but you just copied that. that doesn't tell me if you understand it
violet gull
it has 2 outcomes and uses a big data set to increase the probability of getting it right
@serene scaffold
urban prism
I have a custom data generator that I feed into model.fit(). Is there a way for me to access to some of that data outside of .fit()?
 misty flint
just create an intermediate object like a pandas dataframe
then you can access said dataframe later
if its something like randomly generated values, store them into a list, a np array, etc.
urban prism
Memory is an issue tho
serene scaffold
@urban prism does the algorithm you're using support partial_fit? Because if you're passing a generator to a function, the things that generator generates doesn't get saved anywhere else, no.
But with partial_fit, you don't have to have every training instance in memory at once.
urban prism
Thanks for the idea. I'll check on it
urban prism
Is there a guide for postprocessing? Been trying to apply morphological expressions to some semantic segmentation outputs to no avail
serene scaffold
urban prism
Is there a guide for postprocessing? Been trying to apply morphological expressi...
what do you mean by "apply morphological expressions to some semantic segmentation outputs"? I'm a trained linguist and know what all these words mean individually, but I'm not really sure beyond that.
urban prism
Like applying closing, opening, erode and such to the predicted masks to make them better
Make them look closer to the actual masks
serene scaffold
erode?
urban prism
cv2.erode
serene scaffold
are you basically trying to take a sequence that represents some passage of text, and break it down into subsequences that correspond to sentences and sub-sentence units?
urban prism
urban prism
cv2.erode
Hence open-cv
serene scaffold
why do you need open cv for a natural language problem?
urban prism
Its an image segmentation problem
 frank moth
Hello, I'm trying to use pmdarima in my jupyter notebook. I've tried uninstalling and using conda, uninstalling and using pip but I can't seem to import pmdarima. When trying to install it from conda it keeps going through:
Solving environment: failed with initial frozen solve. Retrying with flexible solve.
Solving environment: failed with initial frozen solve. Retrying with flexible solve.
if pmdarima isn't a conda-only dependency, try doing the whole thing without using conda.
frank moth
I've tried uninstalling conda and using pip as well but it won't seem to import
serene scaffold
conda sucks you in to an approach to dependency management that no one outside of data science uses, yet data science instructors tell people to use it before those people even know when using it might be advantageous.
serene scaffold
frank moth
I've tried uninstalling conda and using pip as well but it won't seem to import
I don't know what you mean by "it won't seem to import". if there's an error message, I need to see the whole thing.
frank moth
Should i try uninstalling everything again and doing pip?
I'll do that rn and get the error message
serene scaffold
if there's an error message, I need to see the whole thing.
oh, you're talking about the "solving environment" one
that means you're still using conda.
before I tell you to uninstall anaconda, who told you that you need to use it? an instructor for a class that you're taking?
frank moth
Yeah, I'm getting rid of conda atm to try another way
yeah the previous classes told me to use conda and when i use the school VM it's all conda
serene scaffold
then I guess you have to stick with it. but I can't help, in that case.
for what it's worth, I work for a research company, and we're moving away from anaconda.
frank moth
We don't have to use it, it's just recommended. I just really need to get my code to work in the end, so I'll try any other way. Do you have another recommended way?
serene scaffold
and the python channel on our slack is pretty much always people complaining about conda.
Do you have another recommended way?
just making a virtual environment (which is a feature that comes with python) and using actual pip, not the pip that interacts with conda.
I mean I guess it's the same pip under the hood, but if you use a normal python virtual environment without touching conda, pip won't install it to a conda-based environment
frank moth
You mean after uninstalling everything, reinstall python and using jupyter separately or something like pycharm then doing pip install pmdarima from cmd?
misty flint
@serene scaffold have you worked with knowledge graphs before stelercus
serene scaffold
frank moth
You mean after uninstalling everything, reinstall python and using jupyter separ...
you can just pip install jupyter. it's a python package.
misty flint
or just formal ontologies?
serene scaffold
misty flint
<@!253696366952316929> have you worked with knowledge graphs before stelercus
yes, why?
misty flint

serene scaffold
still learning more about them though.
serene scaffold
misty flint
ah, just wanted to ask about any resources
this library is under active development, but I haven't formed an opinion about it yet: https://github.com/usc-isi-i2/kgtk

GitHub
Knowledge Graph Toolkit . Contribute to usc-isi-i2/kgtk development by creating an account on GitHub.
misty flint
oh man this looks super promising
thanks bud. definitely going to look through this one
serene scaffold
let me know what you think. I think I saw that they use TSV files pretty extensively, and that makes one wonder how it performs as compared to a "proper" graph database like neo4j.
 serene scaffold
the neo4j query language, cypher, is pretty fun
iron basalt
You may want to ask in #databases for advice on this.
serene scaffold
here's their discord: https://discord.gg/aacYZEqu
misty flint

misty flint
iron basalt
You may want to ask in <#342318764227821568> for advice on this.
thats true this is getting more into database territory
I do have a DS question tho
im being asked if i could "use ML to improve search results" for this company platform thing
and im like...idek where to look to solve that type of problem
me: just throw elasticsearch at it 
frank moth
is there a python version that definitely works with pmdarima?
serene scaffold
misty flint
me: just throw elasticsearch at it <:RunFail:793712787692060723>
what exactly is the point of elasticsearch again? is it about making searches faster by distributing the operation somehow? or does it do something "fancy" like semantic search?
iron basalt
misty flint
im being asked if i could "use ML to improve search results" for this company pl...
What are "search results" and what does it mean to "improve" them?
misty flint
iron basalt
What are "search results" and what does it mean to "improve" them?
excellent questions that i will somehow try to sneak in in my next meeting with the director of software architecture guy
misty flint
serene scaffold
what exactly is the point of elasticsearch again? is it about making searches fa...

the answer to your question is: idk but it seems like a lot of things 💀
frank moth
serene scaffold
you can just `pip install jupyter`. it's a python package.
It's working now. Thanks!

 lapis sequoia
 graceful glacier
what have you tried so far?
lapis sequoia
can you show the code?
graceful glacier
but inefficient
sure
{'Age Group': {0: '13-14', 1: '15-16', 2: '17-18'}, 'Hours teaching per week': {0: 1, 1: 2, 2: 4}, 'Start_age': {0: 13, 1: 15, 2: 17}, 'End_age': {0: 14, 1: 16, 2: 18}}
df_hours['Range'] = [list(range(i, j+1)) for i, j in df_hours[['Start_age', 'End_age']].values]
i see. lemme think.
i think .apply would be faster.
but I'm trying to find something better than that.
but yeah .apply would be faster than this.
!d pandas.Series.apply
 arctic wedgeBOT
Series.apply(func, convert_dtype=True, args=(), **kwargs)```
Invoke function on values of Series.

Can be ufunc (a NumPy function that applies to the entire Series) or a Python function that only works on single values.@lapis sequoia :x: Your eval job has completed with return code 1.
001 | Traceback (most recent call last):
002 |   File "<string>", line 4, in <module>
003 |   File "/snekbox/user_base/lib/python3.10/site-packages/pandas/core/frame.py", line 8740, in apply
004 |     return op.apply()
005 |   File "/snekbox/user_base/lib/python3.10/site-packages/pandas/core/apply.py", line 688, in apply
006 |     return self.apply_standard()
007 |   File "/snekbox/user_base/lib/python3.10/site-packages/pandas/core/apply.py", line 812, in apply_standard
008 |     results, res_index = self.apply_series_generator()
009 |   File "/snekbox/user_base/lib/python3.10/site-packages/pandas/core/apply.py", line 828, in apply_series_generator
010 |     results[i] = self.f(v)
011 | TypeError: <lambda>() missing 1 required positional argument: 'y'
will mess in bot commands
!e
import pandas as pd
d = {'Age Group': {0: '13-14', 1: '15-16', 2: '17-18'}, 'Hours teaching per week': {0: 1, 1: 2, 2: 4}, 'Start_age': {0: 13, 1: 15, 2: 17}, 'End_age': {0: 14, 1: 16, 2: 18}}
df = pd.DataFrame(d)
df['lst'] = df[['Start_age', 'End_age']].apply(lambda x: list(range(x.Start_age, x.End_age+1)), axis=1)
print(df.lst)
@lapis sequoia :white_check_mark: Your eval job has completed with return code 0.
001 | 0    [13, 14]
002 | 1    [15, 16]
003 | 2    [17, 18]
004 | Name: lst, dtype: object
@graceful glacier this would be faster
i can't seem to find better solN right now since this is not the usual operation we do in pandas.
there are hella vectorized methods but can't find one for this.
graceful glacier
thanks for helping
 solar phoenix
Hi
I started exploring concepts in AI and machine learning. I watched a workshop about Reinforcement Learning where we used the Open AI Gym and used Q-Learning. I did some reading on approaching the MountainCar-v0 environment as well.
If I would like to do a side project at some point using an ML concept, do you advise me to continue to explore other topics before starting or do you think that I should try to do something with what I've learned about Reinforcement Learning as the base?
 prime hearth
Are these the only algorithms you know for ML? Also side projects are to target a field of ML and showcase skills related to jobs in area
 worldly dawn
solar phoenix
Hi
I started exploring concepts in AI and machine learning. I watched a workshop...
worldly dawn
solar phoenix
Hi
I started exploring concepts in AI and machine learning. I watched a workshop...
doing something to solidify the current learning can be useful
solar phoenix
prime hearth
Are these the only algorithms you know for ML? Also side projects are to target ...
Sort of. I've seen linear regression, but that's basic
Oh I see thanks
solar phoenix
worldly dawn
doing something to solidify the current learning can be useful
Noted. Thank you
prime hearth
Oh okay, i mean i never learned reinforcement learning but like a lot of the problems on Kaggle use other ML algos
Like NN or regression classification etc
And if building a ML project, the solution may require to try other ML algos for best accuracy
solar phoenix
Oh that's good to know
There are other workshops that I have access to about other topics
prime hearth
So you are on right track , yeah try learning bit more not too much though like there no need to learn all ML algos just a few so you have knowledge
This is just my opinion but cus like if want to build ML project, need to find a problem or can use one you know or kaggle etc and part of ML lifecycle is trying other solutions that are appropiate
solar phoenix
prime hearth
This is just my opinion but cus like if want to build ML project, need to find a...
Oh I see
Thanks for all the advice. I appreciate it
frank moth
Hello, I've differenced a timeseries so that I could put it in an arima, after I got the fitted prediction I am trying to reverse the differencing by using cumsum but it does not seem to work, the prediction is shifted downward and I'm not sure how it became that way. Here's an image of my fitted model on top of the differenced original data
datatimeseries.diff(1)
 prime hearth
No problem and also when building ML project it be good idea to learn best practices and how to deploy ML model, usually this involves dockers and frameworks with python…
solar phoenix
prime hearth
No problem and also when building ML project it be good idea to learn best pract...
Good to know
Thanks
iron basalt
solar phoenix
Hi
I started exploring concepts in AI and machine learning. I watched a workshop...
Reinforcement learning is one of the approaches. For AI I recommend knowing at least one algorithm from each of these: https://en.wikipedia.org/wiki/Machine_learning#Approaches

Machine learning (ML) is the study of computer algorithms that can improve automatically through experience and by the use of data. It is seen as a part of artificial intelligence. Machine learning algorithms build a model based on sample data, known as training data, in order to make predictions or decisions without being explicitly programmed ...
With that knowledge you should be able to come up with some ideas on how to tackle just about any problem.
There are others but these are the most commonly known / used.
Combing approaches is common and often required (for getting any decent results).
Note that in the models section of this page artificial neural networks seem to have the most stuff going on but that is in large part due to many models being labelled as such even though their connection to actual neural networks is near non-existent in many cases (other than nodes that feed into each other with some kind of "activation" value and parameters).
(Which is kind of cheating since pretty much all algorithms can be represented in some way by a (compute) graph (a good way to visualize it though))
solar phoenix
Thanks @iron basalt for this. Appreciate your help
iron basalt
Reinforcement learning on its own (tabular) does not give you much, it always needs something else to support it.
solar phoenix
Oh I see
iron basalt
It's in part due to RL being flawed (for another discussion though), and also because RL is kind of high level thing.
It being high level means it needs some other parts to do a bunch of work for it to make the problem more approachable.
And that typically involves one or more of the other approaches to ML/AI (some of them produce intermediate results which act as a simplified "view" of the problem and/or give some structure to make it easier (may even be problem-specific structure knowledge for best results)).
 night gorge
#Scaling data
from sklearn.preprocessing import StandardScaler

scaler = StandardScaler()

# transform data
dfScaled = scaler.fit_transform(df[["satisfaction_level","last_evaluation","average_montly_hours","Age"]])

dfScaled =pd.DataFrame(dfScaled,columns=list(df[["satisfaction_level","last_evaluation","average_montly_hours","Age"]]))

dfScaled = df.drop(["satisfaction_level","last_evaluation","average_montly_hours","Age"],axis=1).append(dfScaled)

dfScaled.head()```

All 4 colums are giving NaN when appending. Why is that and how to avoid it?what exactly are you trying to do here?
in simple words?
 tacit basin
night gorge
```CS
#Scaling data
from sklearn.preprocessing import StandardScaler
scaler = S...
tacit basin
night gorge
```CS
#Scaling data
from sklearn.preprocessing import StandardScaler
scaler = S...
are they not NaNs before append?
i think it's because there are no columns with such name in the df dataframe
also:
append is deprecated since version 1.4.0: Use concat() instead.
lapis sequoia
here energies are scalar values, what should i use to show it? the boxes are simply matrices and last circles are neurons, but how to show energies part?

 desert minnow
Hello all, Im trying to build a ordinal classification model (basically ranking prediction). Is there a python library that has ordinal regression(rank)
misty flint
ah i figured out my search issue
i think im going to take my web search/info retrieval class first
to understand more of the fundamentals in the field
before looking at state-of-the-art
 pastel valley
earlystopping by definition is stoping the training if it observes that the performance of the model is not improving right?
is there any drowbacks with using this for example i traing with 100 epochs and used earlystopping and the training stopped with 23rd epoch with an accuracy of 89% is there a possibility that if i did not use earlystopping i could gain more accuracy ?
 agile cobalt
probably depends on which model you're using?
if it has reached the local (or global) minimum/maximum, further training wouldn't help much, but you could try modifying the learning rate
pastel valley
it means there is still that possibility that if you dont use earlystopping your model will learn more?
misty flint
earlystopping is used to mitigate overfitting. thats why we use it in the first place. if you think your model wont overfit, i guess you could not use earlystopping.
pastel valley
how is this performance? is it over fitting weird bad or ok?

based on the tutorials i see the patterns they get is pretty good like steady increase no big spikes like that
tacit basin
pastel valley
based on the tutorials i see the patterns they get is pretty good like steady in...
You can set patience, how many epochs are you willing to wait for an improvement
pastel valley
tacit basin
You can set patience, how many epochs are you willing to wait for an improvement
using this as example if i set patience to 5 then may model will stop at this point?
 tacit basin
pastel valley
using this as example if i set patience to 5 then may model will stop at this po...
tacit basin
pastel valley
using this as example if i set patience to 5 then may model will stop at this po...
It would stop after 5 points with no improvement. In addition you could also set what difference you are interested in. Like any difference (>0), or more than 0.05 etc
pastel valley
tacit basin
It would stop after 5 points with no improvement. In addition you could also set...
oh so in my example it will stop 5 epochs after that blue lined spike?
tacit basin
pastel valley
oh so in my example it will stop 5 epochs after that blue lined spike?
I think it's improvement to last point. So in this graph with patience of 5 would not stop at all. But i would need to verify that in docs. Do you use keras?
pastel valley
yes
this one gives me the best state of the model when earlystopped? did i understand it correctly?
 tacit basin
Correct. Re patience you were right it's compared to the best result https://stackoverflow.com/questions/45028582/keras-earlystopping-patience-parameter#45028934

Stack Overflow
I'm trying to do some binary classification and I use Keras's EarlyStopping callback. However, I have a question regarding patience parameter.
In the documentation it is stated
patience: number...
pastel valley
btw also another question aside from earlystopping
resnet final layer is 1000 fc softmax layer so if i plan to add another layer then the number of units should be less than 1k?
 tacit basin
pastel valley
btw also another question aside from earlystopping
resnet final layer is 1000 f...
tacit basin
pastel valley
btw also another question aside from earlystopping
resnet final layer is 1000 f...
It could be more. Design decision.
pastel valley
tacit basin
It could be more. Design decision.
its like fc 1000 next fc 2000 next fc 200 is a thing? its possible but the perfomances still depends? and the commong practice is decreasing units right?
tacit basin
pastel valley
its like fc 1000 next fc 2000 next fc 200 is a thing? its possible but the perfo...
I think decreasing number is a common practice
pastel valley
tacit basin
Correct. Re patience you were right it's compared to the best result https://sta...
i still dont understand on which part the model will stop is it minus the patience or in the patience?
pastel valley
tacit basin
I think decreasing number is a common practice
nice nice
btw i just use summary() in the resnet50 on keras

it doesnt include the fc on keras right?
the architecture i see on google it has 1000 fc
this is the resnet50 right? what flops mean?

 neat anvil

In computing, floating point operations per second (FLOPS, flops or flop/s) is a measure of computer performance, useful in fields of scientific computations that require floating-point calculations. For such cases, it is a more accurate measure than measuring instructions per second.
I'm guessing they're saying that's the required FLOPs to perform some constant number of predictions with that model architecture per second
over the different model architectures
pastel valley
oh thats for efficiency maybe
pastel valley
neat anvil
https://en.wikipedia.org/wiki/FLOPS
thank you
tacit basin
pastel valley
the architecture i see on google it has 1000 fc
Depends if you set include top or not
tf.keras.applications.ResNet50(
    include_top=True,
    weights="imagenet",
    input_tensor=None,
    input_shape=None,
    pooling=None,
    classes=1000,
    **kwargs
)
is this the right place to ask query on .fits image
serene scaffold
@lapis sequoia I don't know what that is, but you can ask and cut/paste your question to the correct channel once we have enough information to ascertain what it's about.
lapis sequoia
I have a folder in which I have 500 . FITS images. This images are opened using astropy.io import fits (just for information). I have written code lines which reads through the header of each image and measures a desired angle parameter. The range of the angle needed for my study is 60 deg. My question is how can I delete the image if the condition is not met ?
I can write a if condition loop. But how exactly can the .FITS image be deletedi
 chrome ferry
Hi, what degree you need to become a data scientist?
tacit basin
lapis sequoia
I can write a if condition loop. But how exactly can the .FITS image be deletedi
It can be deleted in the same way as any file. For example
from pathlib import Path
Path('path/to/image.FITS').unlink()
A question for anybody
serene scaffold
chrome ferry
Hi, what degree you need to become a data scientist?
there's a lot of variation in what a "data scientist" actually does but you probably need a computer science degree or similar.
@lapis sequoia you want to actually delete the file from you computer's hard drive? you can import os and use os.remove("path/to/file").
lapis sequoia
tacit basin
It can be deleted in the same way as any file. For example
```py
from pathlib im...
Thanks a lot. it worked. But is there a way to save those deleted files. I am thinking to append those files to an empty list and then do the Path routine you suggested. But i would like to ask, is there a better way to do this or what I am thinking is good enough?
 tall crest
Hi, i was bored this afternoon and started making chess in order to make an ai for it, i am a beginner at python but i still really would love to code a genetically improving ai, i know i will probably fail terrebly but does anyone have some tips for me? (i am not looking to use libraries)
serene scaffold
tall crest
Hi, i was bored this afternoon and started making chess in order to make an ai f...
you should at least allow yourself to use numpy. otherwise it will be very difficult to encode a solution that anyone can follow, including yourself.
tall crest
yes, of course i use numpy and stuff if i were to need it
i meant i did not want to use neat or something
serene scaffold
anyway, what do you mean by "genetically improving"?
tacit basin
lapis sequoia
Thanks a lot. it worked. But is there a way to save those deleted files. I am th...
wdym to save deleted files?
yes deleting files in a loop is fine.
lapis sequoia
Those files do contain some other important information which I may need in case. So wanted to save them seperately
tacit basin
lapis sequoia
Those files do contain some other important information which I may need in case...
so you don't want to delete them?
you want to save them in a different location?
lapis sequoia
delete and save them in a different location
tacit basin
lapis sequoia
delete and save them in a different location
Stack Overflow
I want to move all text files from one folder to another folder using Python. I found this code:
import os, shutil, glob
dst = '/path/to/dir/Caches/com.apple.Safari/WebKitCache/Version\ 4/Blobs '...
lapis sequoia
my aim is to remove the un-necessary image which does not fulfil the condition, so that the main folder consists of only the correct images which I will use for the next image processing. But we need few information from the deleted image, which will be useful in future.
lapis sequoia
tacit basin
https://stackoverflow.com/a/41827240
Okay I will go through this. seems a good idea.
tacit basin
lapis sequoia
Okay I will go through this. seems a good idea.
yeah stackoverflow is a great source of python code snipetts. look for solutions with green checkmark, with high numer of upvotes, but also read commetns to understand it better.
lapis sequoia
tacit basin
yeah stackoverflow is a great source of python code snipetts. look for solutions...
just a small doubt, this codes are for shifting the entire directory to new, but I need to save only selected files to the new destination(folder)
tacit basin
lapis sequoia
just a small doubt, this codes are for shifting the entire directory to new, but...
import shutil
import os

source_dir = '/path/to/source_folder'
target_dir = '/path/to/dest_folder'

file_names = [file1, file2,...] # list of files to be moved

for file_name in file_names:
    shutil.move(os.path.join(source_dir, file_name), target_dir)
 stone marlin
Yeah, follow miwojc's code to move then, then maybe use something like regex or some kind of subsetting to get the information out that you want. Either way, you might want to ask this in one of the other help rooms since this isn't related to data science.
 fierce dawn
hi guys, do you know if it's possible to create something which is able to detect a hand? for example i pause a video and the software is able to take characteristics of the hand and recognise that it's my hand?
 mild dirge
Depends on how many different hands it must be able to distinguish
If it's between a black and a white hand, and the lighting conditions don't change, maybe 😛
But think that it would be quite hard to classify hands
@fierce dawn
misty flint
very interesting
 iron basalt
misty flint
very interesting
iron basalt
misty flint
very interesting
ND-arrays are stored in contiguous memory and memory is 1D.

In computing, row-major order and column-major order are methods for storing multidimensional arrays in linear storage such as random access memory.
The difference between the orders lies in which elements of an array are contiguous in memory. In row-major order, the consecutive elements of a row reside next to each other, whereas the same hold...
In that image the row major is stored as [a_11, a_12, a_13, a_21, a_22, a_23, a_31, a_32, a_33].
Accessing any (row, col) is index = col + row * num_columns (num_columns may also be called row_length).
(So the "stride" is (3, 1))
((num_columns, 1))
misty flint
yeah its interesting
serene scaffold
what is a stride?
iron basalt
For N-dimensions see the bottom of the wikipedia page.
"Address calculation in general"
misty flint
we have to implement these functions for minitorch
 iron basalt
So you can either do something like two for loops for row, col, and compute the index in the inner most loop based on row and col (above eq). Or you can create a pointer (or index) pointing to the first element and in the outer loop you would do +3 to the pointer while in the inner +1. Hence the "strides" of (3, 1).
Well it's two pointers.
One points to the start of each row.
The inner one then gets set to that and goes +1 each iteration.
misty flint
iron basalt
So you can either do something like two for loops for row, col, and compute the ...
its funny bc our TA recommends doing the latter
iron basalt
They are equivalent.
misty flint
yeah
iron basalt
If you think that the first is more computation you need only realize that you can move the row * col_count to the other loop and it's the same then.
(Optimizer will probably do that)
misty flint
interesting
iron basalt
The difference between a pointer and index is that an index is relative to the start of the array while a pointer is relative to "0".
Both are "pointers".
However, depending on what you are doing the pointer method can be nicer.
But it's still the same.
In numpy and pytorch, etc it can be sometimes nice to hack the stride values to do some other computation (aka stride_tricks).
misty flint
it wants us to do tensor map, zip, and reduce functions
neat anvil
I’d be careful throwing the word pointer around when discussing low level data structures
You’re gonna hurt someone’s brain
misty flint
 neat anvil
If you’re not talking about actual pointers to locations in RAM
iron basalt
neat anvil
If you’re not talking about actual pointers to locations in RAM
I am. Although it's virtual memory (under some OS), not actual addresses.
misty flint
anyway i guess its interesting learning how these libraries kinda work
not that ill be really using that knowledge i guess
iron basalt
Numpy is implemented in this way. I have read its source code to confirm.
misty flint
iron basalt
Numpy is implemented in this way. I have read its source code to confirm.
i do like its documentation on broadcasting
i thought the visuals were super helpful
havent actually looked at its source code tho
so i will have to check
iron basalt
Yea, broadcasting made sense for me when I read the pair-wise distance calculation (I think it was that IDR).
misty flint
yeah def gonna read up on all this again before trying to implement
iron basalt
(Pro-tip fast k-trees are implemented with a contiguous array also, but the indexing is a bit more complicated)
(Using nodes that are made separately rather than all in one array is slow (but still the way it's often taught to beginners))
(So you could store a binary tree where each node contains an int in a numpy array (and make a fast search, etc with numba))
iron basalt
serene scaffold
what is a stride?
>>> a = np.arange(16).reshape((4, 4))
>>> a
array([[ 0,  1,  2,  3],
       [ 4,  5,  6,  7],
       [ 8,  9, 10, 11],
       [12, 13, 14, 15]])
>>> a.shape
(4, 4)
>>> a.strides
(32, 8)
>>> a.dtype
dtype('int64')
>>> b = a[:, ::2]
>>> b
array([[ 0,  2],
       [ 4,  6],
       [ 8, 10],
       [12, 14]])
>>> b.shape
(4, 2)
>>> b.strides
(32, 16)
>>> b.dtype
dtype('int64')
>>>
Note that the strides in numpy is the number of bytes it moves (8 // sizeof(int64) = 1).
So it's actually (4, 1) and (4, 2).
When I slice the first array with a step of 2 (aka stride of 2), the shape gets smaller but the stride gets bigger because the slice is still referencing the original, no copy was made. It's just stepping/striding across it differently (skipping some).
(When any numpy function operates on a numpy array, in its loops it uses the array's (broadcasted) strides)
(Written in a way where the algorithm does not need to worry / care about how to correctly iterate over the arrays, it's encapsulated in an iterator / generator which makes use of the shape and stride information)
>>> for v in np.nditer(a):
...     print(v)
...
0
1
2
3
4
5
6
7
8
9
10
11
12
13
14
15
The C code internally looks kind of like that for a lot of the operations (it does not need to know / need to deal with the shape/strides directly which lets a single function work for N dimensions / no duplicate code (one impl for 1D, 2D, 3D, slice with step>1, etc)).
 marble tulip
I am Titnaic DataSet and I want to see if they people with highest fare survived or not. How can I check that df.Fare.value_counts().max() 43
How can I check this with survived Column
tacit basin
fierce dawn
hi guys, do you know if it's possible to create something which is able to detec...
If you have enough of examples of images of your hand then it should be possible i think. At least worth a try.
tacit basin
marble tulip
I am Titnaic DataSet and I want to see if they people with highest fare survived...
You could do groupby on survived column and count with a filter on fare i think
 short heart
is it useless to look at correlation between categorical variables?
pastel valley
tacit basin
Depends if you set include top or not
```py
tf.keras.applications.ResNet50(
...
the include top true means the original models as is will be used right? and if its false i can provide my own input and the fc layer from resnet is gone so its like a feature extractor right?
the top of the models are the inputs and outputs?
tacit basin
short heart
is it useless to look at correlation between categorical variables?
you could use chi-square and Cramer's V: https://stats.stackexchange.com/a/112674

Cross Validated
I have a dataframe with many observations and many variables. Some of them are categorical (unordered) and the others are numerical.
I'm looking for associations between these variables. I've been...
tacit basin
pastel valley
the include top true means the original models as is will be used right? and if ...
what is model? architecture and weights (trained)? if that's the definition then by providing parameter other than None to weights argument will use these pretrained weights.
include top specifies if the dense layers should be included or not.
pastel valley
tacit basin
what is model? architecture and weights (trained)? if that's the definition then...
n architectures the top means the part of output ?
tacit basin
pastel valley
n architectures the top means the part of output ?
you still use resent architecture, the top can be excluded and you can provide your dense layer
 gloomy anvil
I have a question regarding single-step and multi-step predictions in the SARIMAX model. I posted my questions here to stackoverflow: https://stackoverflow.com/questions/71392886/legacy-code-is-this-one-step-ahead-prediction-can-i-turn-it-into-multistep-pre
My question is if this is in fact a single step prediction and how to interpret the model.predict() parameters
Stack Overflow
I have this legacy code and I am not familiar with the SARIMAX model. The comments help to understand what is happening, but I do not understand the last line where the prediction is done.
The data...
 lone drum
my current code python mydb = MySQLdb.connect( host="localhost", user="root", password="covid2020",database= f"{db_name}") query = 'INSERT INTO `2020_1_min_8_noida_data` (unique_id_for_symbol ,timestamp, open, high, low, close, volume, full_candle, value) VALUES (%s, %s, %s, %s, %s, %s, %s, %s, %s)' mycursor = mydb.cursor() for i, chunk in enumerate(pd.read_csv(f'{path}{file_name}{extension}' , engine='python', chunksize=5000000 , iterator=True)): print('i=', i) # all_value = [] for row in chunk.iterrows(): print('row\n', row) value=(row[1][0], row[1][1], row[1][2], row[1][3],row[1][4], row[1][5], row[1][6], row[1][7], row[1][8]) # all_value.append(value) mycursor.execute(query, value) mydb.commit() i am not getting data inserted in mysql table
i am getting empty rows in database table
my code https://paste.pythondiscord.com/zaqujotive here ping me when u reply
serene scaffold
 solar phoenix
Hi, I want to take a standard deviation from a pandas dataframe, and then perform an action if it is larger than another value. When i do this i get an error- "The truth value of a Series is ambiguous. Use a.empty, a.bool(), a.item(), a.any() or a.all()." I have a feeling that i need to define the standard deviation as a number of some kind, at the moment i do it like this: stand=lastinframe.std(axis=1)
serene scaffold
solar phoenix
Hi, I want to take a standard deviation from a pandas dataframe, and then perfor...
Please show the code and the whole error message
I'll probably need additional material to answer it, but those two are the bare minimum.
Please ping me if you decide to show that information.
!traceback
arctic wedgeBOT
Please provide the full traceback for your exception in order to help us identify your issue.
While the last line of the error message tells us what kind of error you got,
the full traceback will tell us which line, and other critical information to solve your problem.
Please avoid screenshots so we can copy and paste parts of the message.
A full traceback could look like:
Traceback (most recent call last):
  File "my_file.py", line 5, in <module>
    add_three("6")
  File "my_file.py", line 2, in add_three
    a = num + 3
TypeError: can only concatenate str (not "int") to str
If the traceback is long, use our pastebin.
serene scaffold
please don't ping people to draw attention to your question.
pastel valley
tacit basin
you still use resent architecture, the top can be excluded and you can provide y...
i think i understand it now
thank you sir
pastel valley
in this code if does model A and be B just an identical model? or if i train modelA then modelB will also learn?
or they will be identical models all from architecture weights and compile info ?

is this 2 snippet produce the same outcome?
resnet50_model = ResNet50(include_top=False,
                   input_shape=(144,144,3),
                   pooling='max',classes=6,
                   weights=None)

modelA = Sequential()

modelA.add(resnet50_model)

modelA.add(Flatten())
modelA.add(Dense(1024, activation='relu'))
modelA.add(Dropout(0.5))
modelA.add(Dense(512, activation='relu'))

modelA.add(Dense(6, activation='softmax'))

modelA.compile(optimizer='adam', loss='categorical_crossentropy', metrics=METRICS)


modelB = Sequential()

modelB.add(resnet50_model)

modelB.add(Flatten())
modelB.add(Dense(1024, activation='relu'))
modelB.add(Dropout(0.5))
modelB.add(Dense(512, activation='relu'))

modelB.add(Dense(6, activation='softmax'))

modelB.compile(optimizer='adam', loss='categorical_crossentropy', metrics=METRICS)


modelB.set_weights(modelA.get_weights())
 tidal bough
pastel valley
or they will be identical models all from architecture weights and compile info ...
tidal bough
pastel valley
or they will be identical models all from architecture weights and compile info ...
I think here you produce two separate models loaded from the same weigths - so identical, but not linked.
pastel valley
tidal bough
I think here you produce two separate models loaded from the same weigths - so i...
oh thats the term "linked"
so its like i cloned the model and what i do to the clone doesnt affect the other one?
its like i can just save the model and try to clone it and do something and if its better then i save it then create a clone again
its like i always keep a copy that i can retrieve whenever something bad happened
tidal bough
oh thats the term "linked"
not a technical term, I made it up
tidal bough
pastel valley
its like i can just save the model and try to clone it and do something and if i...
That seems like a fine use case for save indeed
pastel valley
tidal bough
> oh thats the term "linked"
not a technical term, I made it up
yes but thats what am trying to say and i cant find the right term hahahah
pastel valley
tidal bough
That seems like a fine use case for `save` indeed
nice nice thank you sir
stone marlin
No question, just excited because my new gig got me a jetbrains license so now I get to try out PyCharm, and use DataGrip. :'] Exciting.
tacit basin
pastel valley
its like i can just save the model and try to clone it and do something and if i...
The only thing that changes with training in this case is model weights. So you can save and load them as needed. Model architecture will not change as you train
Something to remember though is when you use any schedulers for training like learning rate for example. Make sure scheduler state is saved and loaded with checkpoint otherwise you will start with high lr is something like cosine anealing is used.
tacit basin
stone marlin
No question, just excited because my new gig got me a jetbrains license so now I...
Congrats.
What's Data grip? I think i tried it the other day and it wouldn't read jupyter notebooks. Unless i mixed tools here ☺️
stone marlin
I mainly use it as a "database IDE" --- it scans our DBs and allows for autocompletes, common (macro) query competions, and a bunch of other cool stuff.
I don't think it would read jupyter notebooks --- that might be PyCharm's thing, but I honestly have no idea, I've only used the Jupyer notebook as a standalone. :']
 brave sand
so I did this tutorial, are there any project ideas that use the same concepts?
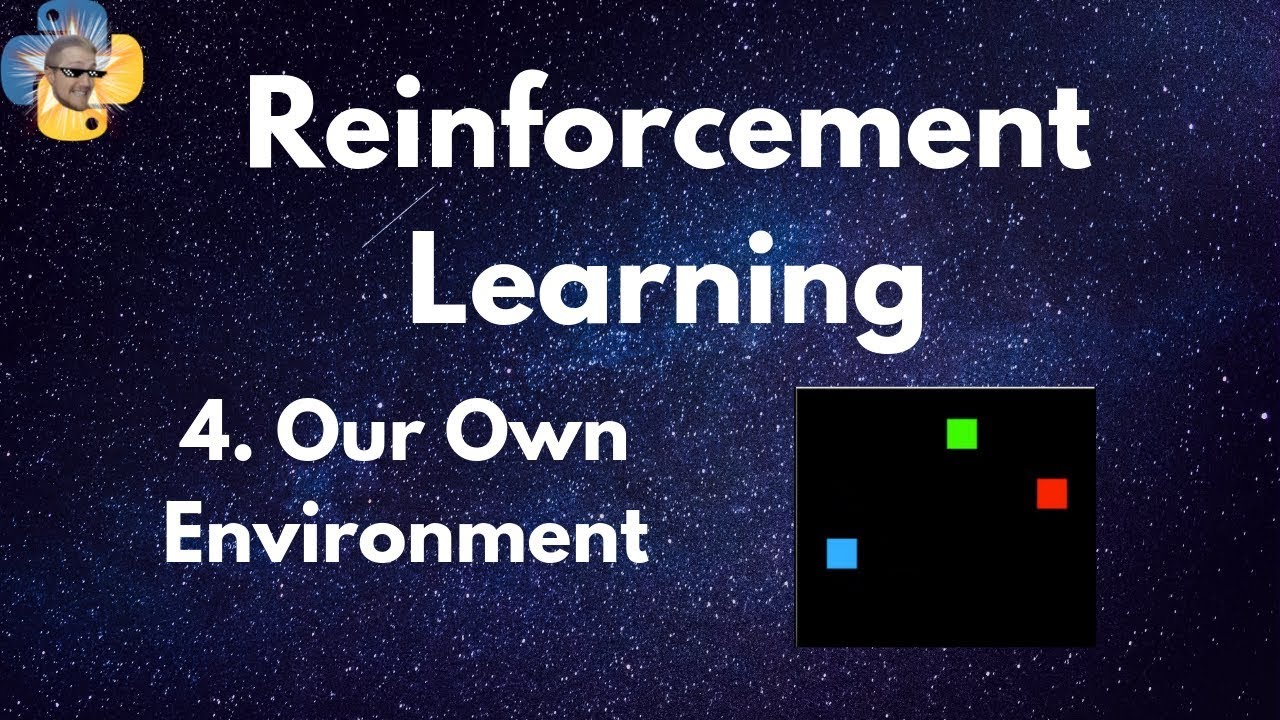
Welcome to part 4 of the Reinforcement Learning series as well our our Q-learning part of it. In this part, we're going to wrap up this basic Q-Learning by making our own environment to learn in. I hadn't initially intended to do this as a tutorial, it was just something I personally wanted to do, but, after many requests, it only makes sense to...
misty flint
stone marlin
I mainly use it as a "database IDE" --- it scans our DBs and allows for autocomp...
interesting interesting
it almost sounds like a data engineering tool
stone marlin
Haha, I'm in the data engineering dept, technically, so that tracks. I'd say it's exactly that.
lapis sequoia
Hello I have a conda environment that contains the following: https://www.toptal.com/developers/hastebin/ujarotijeg.md
I would like to install my existing project as a package in development mode within my conda environment by running python setup.py develop. The thing is that I'm new to packaging and I'm a bit lost on how to create setup.py containing all the information of my conda environment(dependencies, name, etc...).
Hastebin is a free web-based pastebin service for storing and sharing text and code snippets with anyone. Get started now.
Once I installed conda-build, conda comes in with a command called conda develop which is supposed to do the exact same thing I describe above, but according to what I read it has not seen any development lately. I'm trying to figure out the best way to have a properly setup package within my environemt that allows me to keep developing and reflect new changes.
stone marlin
This is not really ds and ai, you may want to post in the standard help rooms.
lapis sequoia
Thank you
 craggy tiger
Hey folks, looking for interesting projects. Anyone on something?
 vague kindle
How would one go about saving a model and using that model for other projects?
 merry ridge
Does taking 30 seconds to load in 27045 rows and 99 columns of an .xlsx into a dataframe by calling pd.read_excel sound reasonable? I mainly ask because this workstation has been having a lot of other computer issues and I have lost all sense for if this is within acceptable bounds or not.
urban prism
I wanna calculate my metrics after post processing my initial predictions
I have a validation data generator that reads the files from the disk and returns X,Y. Normally I use model.evaluate(validation_generator) in order to calculate my metrics though now I have a function post_process() that is supposed to take in X and return the processed, new X (And later on calculate metric(X_new, Y)). How can I go with this?
agile cobalt
merry ridge
Does taking 30 seconds to load in 27045 rows and 99 columns of an .xlsx into a d...
having an Excel file with 27045 rows and 99 columns sounds unreasonable imo
merry ridge
That's not really a hill I am willing to die on. I get what I get and have to deal with it
iron basalt
merry ridge
Does taking 30 seconds to load in 27045 rows and 99 columns of an .xlsx into a d...
What is the file size?
merry ridge
iron basalt
What is the file size?
9.03 MB
iron basalt
merry ridge
9.03 MB
Do you know your disk/SSD read speed (non-cached)?
merry ridge
I have no idea how I would even check that
iron basalt
merry ridge
I have no idea how I would even check that
Which OS are you using?
merry ridge
Windows 10
merry ridge
I can't run that command because of a lack of administrative privilege's. It takes about 4 seconds from excel closed to fully opening the file and being able to manipulate it for whatever that is worth
iron basalt
Remarks

    Membership in the local Administrators group, or equivalent, is the minimum required to use winsat. The command must be executed from an elevated command prompt window.

    To open an elevated command prompt window, click Start, click Accessories, right-click Command Prompt, and click Run as administrator.
I do not have access to any administrative credentials
iron basalt
Time to get an admin then.
iron basalt
merry ridge
I can't run that command because of a lack of administrative privilege's. It tak...
Ok well you can expect excel's time or less then.
Anything above is very slow.
merry ridge
Alright, that's helpful thank you
 hardy jetty
Is there a way to easily turn a 3d plot into a 2d plot with matplotlib / seaborn? (e.g. top down or side view)?
merry ridge
You could just set whatever coordinate you want to 0, but if you want to do a projection onto an arbitrary plane I would imagine there would be work involved.
hardy jetty
hmm
merry ridge
In a usual right hand coordinate system a top down view would just be setting the z coordinate to be 0 for all your data
iron basalt
merry ridge
I can't run that command because of a lack of administrative privilege's. It tak...
If you are reading the xlsx files multiple times I recommend converting them to something faster and then just reading that multiple times.
(convert to csv, pandas reads csv files much faster)
hardy jetty
merry ridge
In a usual right hand coordinate system a top down view would just be setting th...
would that still work if the projection is set to 3d? or should i change that to 2d then?
iron basalt
hardy jetty
Is there a way to easily turn a 3d plot into a 2d plot with matplotlib / seaborn...
Orthographic or perspective projection?
hardy jetty
iron basalt
Orthographic or perspective projection?
Currently just set to (projection='3d'), that might be perspective?
iron basalt
hardy jetty
Currently just set to (projection='3d'), that might be perspective?
When viewed from the side/top, does it have perspective? Are things further away smaller?
hardy jetty
im unable to view from the side or top, trying to figure that out, its just 1 function plotted it 3d space atm
iron basalt
hardy jetty
im unable to view from the side or top, trying to figure that out, its just 1 fu...
You should be able to interactively rotate it with your mouse.
iron basalt
hardy jetty
with matplotlib?
Yeah, matplotlib by default let's you scroll, zoom, save to file, etc. It has a GUI.
When you call show.
hardy jetty
im calling plt.show() but its just an png ;p
iron basalt
Show code.
misty flint
stone marlin
Haha, I'm in the data engineering dept, technically, so that tracks. I'd say it...
i knew it sounded a bit famililar. i think joe reis and matt housley talk about it on their data engineering podcast

stone marlin
Yeah, if you can try it out, do so. It's way better than pgadmin, and I'm a fan of pgadmin, haha.
misty flint
oh yeah? i def want to take a looksee
but you know how data engineering is, so many tools and toys
coming out all the time
stone marlin
Yeeeeeeep. It's honestly very difficult to keep track of. We've got some tooling that's only 3 years old and it's already deprecated.
misty flint
stone marlin
Yeeeeeeep. It's honestly very difficult to keep track of. We've got some tooli...
💀
oh no
sounds about right tho
stone marlin
But the gist of all the stuff is usually the same. Might not be using kafka, but it's always some kind'a streaming thing; might not be using k8s but some kind of container orchestration thing --- so it's not so bad, but, man, is it intimidating at first.
misty flint
yeah its def interesting from an outsiders perspective; im still mostly in DS world
but i like looking at adjacent fields
and exploring to see/gauge my interest
stone marlin
Yep! I'm still doing DS stuff, but I'm mostly in an adjacent field now that "enables" DS to do their work better ("Machine Learning Engineering") and it's pretty cool. Part DS, part DE.
stone marlin
The practice of MLOps, or is there a tool called MLOps?
stone marlin
Haha, yeah, that's essentially my job. So, we work in a similar way to the standard google whitepaper. I haven't actually see the community meetups, but I'll check them out now!
misty flint
interesting interesting
yeah he has a podcast that ive also been listening to
the podcasts are basically past meetup speakers
stone marlin
This looks very nice! There's not as many resources for MLOps as there are for Devops (even if many overlap) so it would be nice to join up and see.
misty flint
they do have a huge community tho
with tons of MLOps peeps
at least thats what he said on Ken Jee's podcast
they even have a section where they discuss various tools and comparing them
which honestly sounds super useful
lol
i imagine if i was in that world
def something i want to explore but i def need some cloud experience first
stone marlin
Huh, well, they have a slack, so I'll check that out and see. On one hand I was surprised they didn't have a discord, but --- on the other hand, maybe it makes sense, haha.
misty flint
haha yeah
stone marlin
Oh, def. My recommendation for that, and I feel like a popular rec, is the Cloud Guru series for AWS Practitioner. It took --- a fairly long time to go through, but it was 100% worth it.
It's fairly hands-on, but you learn a ton about AWS services (which are basically the same, modulo the names, as GCP and Azure ones --- you can pick those up on the job if you got AWS) and, maybe more important, the terms to communicate with devops people about what you might need, haha.
misty flint
stone marlin
Oh, def. My recommendation for that, and I feel like a popular rec, is the Clou...
oh nice. is there one specifically for the Serverless Lambda stuff? i think my company wants me to work with aws this summer for my internship
more on the dev side
stone marlin
There are serverless things, but I'd start on the general Cloud Practitioner one asap, then either at the same time or after, check out the serverless dealies. Your job might even let you expense the monthly fee for A Cloud Guru for a few months.
There might be free resources of the same quality, but I've not found them yet. :''[
misty flint
interesting interesting
yeah they actually seem amenable to that idea
well at least i think so
yeah ill def check it out
thanks bud
if i break into ML Engineering, ill let you know lol
come back in 5 years 💀
stone marlin
Haha, no problem, def check out the AWS stuff (there might be a free month? idk.) since that's stuff I wish that I had done earlier. :']
 glass minnow
🔴 what is similarity score(XgBoost) and why we use it can someone explain ?
stone marlin
Also, this MLOps slack channel is super professionally done. Thanks for pointing me in this direction, it's something I'm gonna chat around in and check out.
misty flint
stone marlin
Also, this MLOps slack channel is super professionally done. Thanks for pointin...
yeah no problem bud. i only just learned about it from ken jee's newest podcast haha
pastel valley
tacit basin
Something to remember though is when you use any schedulers for training like le...
how to decide learning rate? is it also trial and error ? is it ok to use the default learning rate like lets say adam
lone drum
serene scaffold
<@680099760836968475> https://pandas.pydata.org/docs/reference/api/pandas.DataFr...
hello i tried my code in different way https://paste.pythondiscord.com/wibotilusa i check for if data is getting stored in table or not. when i do select * from table_name i am getting empty rows. can u plese look into this. ping me when u reply
lone drum
lone drum
hello i tried my code in different way https://paste.pythondiscord.com/wibotilu...
please check this also
 serene scaffold
@lone drum I'm not interested to help if you're not going to use the method I referred you to.
lone drum
serene scaffold
<@680099760836968475> I'm not interested to help if you're not going to use the ...
i tried the code u shared ```python
Traceback (most recent call last):
File "C:\Users\Admin\AppData\Local\Temp/ipykernel_11872/466920832.py", line 9, in <module>
df.to_sql('2020_1_min_8_noida_data_new', con=engine)
File "C:\Users\Admin\anaconda3\lib\site-packages\pandas\core\generic.py", line 2963, in to_sql
return sql.to_sql(
File "C:\Users\Admin\anaconda3\lib\site-packages\pandas\io\sql.py", line 697, in to_sql
return pandas_sql.to_sql(
File "C:\Users\Admin\anaconda3\lib\site-packages\pandas\io\sql.py", line 1726, in to_sql
table = self.prep_table(
File "C:\Users\Admin\anaconda3\lib\site-packages\pandas\io\sql.py", line 1625, in prep_table
table.create()
File "C:\Users\Admin\anaconda3\lib\site-packages\pandas\io\sql.py", line 830, in create
raise ValueError(f"Table '{self.name}' already exists.")
ValueError: Table '2020_1_min_8_noida_data_new' already exists.```
my code ```python
from sqlalchemy import create_engine
import pandas as pd
engine = create_engine('sqlite://', echo=False)
for i, chunk in enumerate(pd.read_csv('E:/latest_data_noida/2020_1_min_8-Dec.csv' , engine='python', chunksize=5000000 , iterator=True)):
print('i=', i)
df = chunk
df.to_sql('2020_1_min_8_noida_data_new', con=engine)``` this way
pastel valley
is there a keras way to output total training time?
lone drum
lone drum
my code ```python
from sqlalchemy import create_engine
import pandas as pd
engi...
i am getting python OperationalError: (sqlite3.OperationalError) unrecognized token: "2020_1_min_8_noida_data_new" [SQL: SELECT * FROM 2020_1_min_8_noida_data_new] (Background on this error at: https://sqlalche.me/e/14/e3q8) this error
pastel valley
what is the difference here?

i know average and max pooling
but in order to use the output for dense layer is should be 1d right?
what is global pooling?
flatten makes it 1d but the global pooling?
stone marlin
For Maddy, I think it might be the case (?? maybe? I couldn't track down the error.) that if you're running in a jupyter notebook, you're accidentally trying to remake a table in memory that you already have by running the .to_sql command. You may be able to reset the jupyter notebook and try again.
Either way, here's some example code that shows how to make a table and query it. This is like one single chunk of a bigger df.
import numpy as np
from sqlalchemy import create_engine
import pandas as pd

# Sample dataframe.
a = np.random.rand(1000)
b = np.random.randint(-100, 100, size=1000)
c = np.random.choice(list("abcdefghij"), size=1000)

data_bundle = {"a": a, "b": b, "c": c}
df = pd.DataFrame(data_bundle)

# Create the engine in memory.
engine = create_engine('sqlite://', echo=False)

# Create the table using this context.
with engine.connect() as con:
    df.to_sql("cool_table", con=con)

# Sample query using this context.
with engine.connect() as con:
    df_results = pd.read_sql("select * from cool_table where c = 'j'", con=con)
hello thanks for your reply
lone drum
stone marlin
For Maddy, I think it might be the case (?? maybe? I couldn't track down the e...
can u please help me in my code of inserting dataframe in table ```python
from sqlalchemy import create_engine
import pandas as pd
engine = create_engine('sqlite://', echo=False)
for i, chunk in enumerate(pd.read_csv('E:/latest_data_noida/2020_1_min_8-Dec.csv' , engine='python', chunksize=5000000 , iterator=True)):
print('i=', i)
df = chunk
df.to_sql('2020_1_min_8_noida_data_new', con=engine, if_exists='append')```
stone marlin
What is the error you're getting now?
lone drum
stone marlin
What is the error you're getting now?
OperationalError: (sqlite3.OperationalError) unrecognized token: "2020_1_min_8_noida_data_new"
[SQL: SELECT * FROM 2020_1_min_8_noida_data_new]
(Background on this error at: https://sqlalche.me/e/14/e3q8)```The code above is all you have? So, this doesn't even get to print i=?
My gut here is telling me that if you change the name of the table to start with a letter instead of a number, this error will go away. For example, noida_data_new_2020_1_min_8.
lone drum
stone marlin
The code above is all you have? So, this doesn't even get to print `i=`?
above code worked but i want to cjheck wether data is getting inserte in table or not
so i terminated the code
and run the above code which gives error
stone marlin
What above code?
lone drum
stone marlin
What above code?
engine.execute("SELECT * FROM 2020_1_min_8_noida_data_new").fetchall()
thi gived error
stone marlin
Alright, so --- I know you said that you queried this above, but when asking a question, please try to tell the person what you're doing exactly and what the error is from. For example, I had no idea that 1) you terminated the script in the middle of it running, 2) what code you ran to execute your SQL, 3) any context for the error you ran into and what script it came from.
This is so we can answer your questions easier.
If you could, try engine.execute("SELECT * FROM '2020_1_min_8_noida_data_new'").fetchall()
lone drum
stone marlin
If you could, try `engine.execute("SELECT * FROM '2020_1_min_8_noida_data_new'")...
i am getting ```python
Traceback (most recent call last):
File "C:\Users\Admin\anaconda3\lib\site-packages\sqlalchemy\engine\base.py", line 1771, in _execute_context
self.dialect.do_execute(
File "C:\Users\Admin\anaconda3\lib\site-packages\sqlalchemy\engine\default.py", line 717, in do_execute
cursor.execute(statement, parameters)
OperationalError: no such table: 2020_1_min_8_noida_data_new```
stone marlin
When you create the table in the script, it only lasts in memory for the duration of the script. So, you might want to create a named db that isn't in memory so you can access that.
https://docs.sqlalchemy.org/en/14/core/engines.html#sqlite For example, the first example here will tell you how to do this.
This will save it as a file and you'll be able to access it, even if you interrupt the script.
Do not DM, please keep things in public chat.
@lone drum Please, do not DM, keep things in public chat.
 somber prism
guys will the pytorch pretrained object detection give a good accuracy if i use it to fine tune on pascal voc format cuz it says its trained on coco dataset ? coco format : xmin ymin H W pasvoc format : xmin ymin xmax ymax
lone drum
stone marlin
This will save it as a file and you'll be able to access it, even if you interru...
my code this way python db_name = 'backtest_data' table_name = '2020_1_min_8_noida_data' mydb = MySQLdb.connect( host="localhost", user="root", password="covid2020",database= f"{db_name}") query = 'INSERT INTO `2020_1_min_8_noida_data` (unique_id_for_symbol ,timestamp, open, high, low, close, volume, full_candle, value) VALUES (%s, %s, %s, %s, %s, %s, %s, %s, %s)' mycursor = mydb.cursor() for i, chunk in enumerate(pd.read_csv(f'{path}{file_name}{extension}' , engine='python', chunksize=5000000 , iterator=True)): print('i=', i) for row in chunk.iterrows(): value=(row[1][0], row[1][1], row[1][2], row[1][3],row[1][4], row[1][5], row[1][6], row[1][7], row[1][8]) mycursor.execute(query, value) mydb.commit()
i terminated code in middle to check data is inserted in database table or not but when i use select * from table i am not getting rows data
select query gives connection error
plz check this
 stone marlin
Okay, so now you're doing it a different way not using pandas to construct the db. I recommend using pandas for this --- for example, like this https://pythontic.com/pandas/serialization/mysql --- since it'll be a lot easier. I cannot read that error, and I've got to go to bed. Perhaps someone else here can help out.
lone drum
stone marlin
Okay, so now you're doing it a different way not using pandas to construct the d...
in above code i am reading data chunkwise and inserting in mysql database table
do u get my point here @stone marlin
tacit basin
pastel valley
how to decide learning rate? is it also trial and error ? is it ok to use the de...
you can use learning rate finder to get better idea which learning rate to use. Adam is optimizer, so like Gradient Descent but 'improved'. There are others like AdamW etc. Depends on data and problem, for image classification with resent i think adam or adamw are still good choices.
Regarding learning rate, you can choose to use constant learnign rate and then manually lower it. or you can use learning reate schedulers for example cosine annealing which will apply different learning rate (lower after warmup) which each epoch.
these optimizers are available in keras:
SGD
RMSprop
Adam
Adadelta
Adagrad
Adamax
Nadam
Ftrl
tacit basin
pastel valley
what is the difference here?
nice explanation: https://paperswithcode.com/method/global-average-pooling

Global Average Pooling is a pooling operation designed to replace fully connected layers in classical CNNs. The idea is to generate one feature map for each corresponding category of the classification task in the last mlpconv layer. Instead of adding fully connected layers on top of the feature maps, we take the average of each feature map, and...
tacit basin
somber prism
guys will the pytorch pretrained object detection give a good accuracy if i use ...
you would need to make sure the format is as expeced. so translate pascal to coco as needed.
 naive relic
Output:-
"'Led by Woody", " Andy's toys live happily in his room until Andy's birthday brings Buzz Lightyear onto the scene. Afraid of losing his place in Andy's heart", ' Woody plots against Buzz. But when circumstances separate Buzz and Woody from their owner'," the duo eventually learns to put aside their differences.'"
Help me
 river maple
I've made a counting object program using yolov4 but it counts in real time. I want to keep the counting number even after the object moves away from the camera.
 terse oracle
Hello, I have to build a machine learning classifier for this data, any tips on how to begin on what classifier should I use?
 tacit basin
naive relic
Output:-
"'Led by Woody", " Andy's toys live happily in his room until Andy's bi...
tacit basin
naive relic
Output:-
"'Led by Woody", " Andy's toys live happily in his room until Andy's bi...
This looks random? Or there's any rule to that?
tacit basin
river maple
I've made a counting object program using yolov4 but it counts in real time. I w...
Just add all objects to say global variable? Not sure if I understand what you mean.
tacit basin
terse oracle
Hello, I have to build a machine learning classifier for this data, any tips on ...
You can use neural network like this https://docs.fast.ai/tutorial.text.html
How to fine-tune a language model and train a classifier
terse oracle
tacit basin
You can use neural network like this https://docs.fast.ai/tutorial.text.html
the only restriction I have is to use a non neural classifier.
I am kinda confused in which steps do I need to start with, so it would be great if you could maybe recommend what steps should I do first.
tacit basin
terse oracle
I am kinda confused in which steps do I need to start with, so it would be great...
the link i mentioned has tutorial on exactly what you need then 🙂
let me know if you need help with it?
tacit basin
terse oracle
I am kinda confused in which steps do I need to start with, so it would be great...
oh you said non-neural network, sorry
terse oracle
tacit basin
oh you said non-neural network, sorry
ya xd
so anything on ur mind that could help me begin?
lapis sequoia
terse oracle
Hello, I have to build a machine learning classifier for this data, any tips on ...
good old naive bayesian?
multilabel naive bayesian
terse oracle
lapis sequoia
good old naive bayesian?
sure, any good tutorial that you know of? because I know how to use it only on binary lables.
lapis sequoia
terse oracle
sure, any good tutorial that you know of? because I know how to use it only on b...
if you know binary then i mean its literally same.
just see which one is most probable.
terse oracle
lapis sequoia
just see which one is most probable.
yea but with what parameters and probabilities, did you take a look at my data?
lapis sequoia
this place is not advertisement, kindly remove the post.
 zenith bison
sorry
lapis sequoia
terse oracle
yea but with what parameters and probabilities, did you take a look at my data?
yeah, you can create a tfidf table and assume words as features, then find conditional probablity for each (word, class) and then just apply bayesian formula.
probabilities those you can count.
like if
good word is in 10 records and 3 out of them are class 0, then p(good/class0) is 3/10
terse oracle
lapis sequoia
yeah, you can create a tfidf table and assume words as features, then find condi...
ok I will try this approach, thanks.
 modest shuttle
What is Pose Estimation?
 gray iron
Anyone interested in Google Summer of Code and that too in ML Based Open Source Organizations
You guys can take a look at Weaviate Vector Search : https://summerofcode.withgoogle.com/programs/2022/organizations/semi-technologies
Google Summer of Code is a global program focused on bringing more developers into open source software development.
Happy to have you there, and feel free to ask me anything.
 thorn venture
I need to concat/append csv data in a single xl file.
df = pd.concat(map(pd.read_csv, ['file1.csv','file1.csv','file1.csv'])) helped me in this; but I need to add another column in the XL which contains the file name from where the data is coming. Can anyone help me please?
serene scaffold
thorn venture
I need to concat/append csv data in a single xl file.
`df = pd.concat(map(pd.re...
pd.concat({name: pd.read_csv(name) for name in list_of_files})
and then the name will be an additional level of indexing in the concatted df.
tacit basin
modest shuttle
What is Pose Estimation?
I wouldn't be able to describe it better than mediapipe did here https://google.github.io/mediapipe/solutions/pose.html
tacit basin
gray iron
Happy to have you there, and feel free to ask me anything.
Do i need to know how to program in Go?
gray iron
tacit basin
Do i need to know how to program in Go?
If you want to apply for the Go project then yes else there are python based projects as well
tacit basin
gray iron
If you want to apply for the Go project then yes else there are python based pro...
Thanks! Do you happen to have the list of projects for python?
thorn venture
serene scaffold
and then the name will be an additional level of indexing in the concatted df.
I`m trying to add a new column in the newXL . df['name'] = name of the each files.
serene scaffold
@gray iron I had to delete your message, as it constitutes advertising
gray iron
serene scaffold
<@!696378979891806218> I had to delete your message, as it constitutes advertisi...
oh okay! How can I re-form the message so that it doesn't looks like advertisement?
It's a genuine message about Google Summer of Code and a Python + ML Based Project.
serene scaffold
thorn venture
I`m trying to add a new column in the newXL . df['name'] = name of the each file...
you can use reset_index to turn one of the multiindex levels into a column
serene scaffold
gray iron
It's a genuine message about Google Summer of Code and a Python + ML Based Proje...
if it's intended to advertise an event or program, then there's no way to restate it that isn't an advertisement. are you just trying to refer people to a certain list of project ideas?
gray iron
People can benefit from it and I'm just spreading awareness
gray iron
serene scaffold
if it's intended to advertise an event or program, then there's no way to restat...
Yes
serene scaffold
gray iron
People can benefit from it and I'm just spreading awareness
sure, but this isn't the platform for that.
gray iron
Oh okay! Sure! NP
 frosty flower
How do I shift all the data points to their right? i.e. making m[i][j] = m[i][j-1] for all data in the matrix
For j=0, pad the result with 0
serene scaffold
frosty flower
How do I shift all the data points to their right? i.e. making m[i][j] = m[i][j-...
in an array?
or are you using nested lists?
frosty flower
Figured.
serene scaffold
In [7]: arr
Out[7]:
array([[ 0,  1,  2],
       [ 3,  4,  5],
       [ 6,  7,  8],
       [ 9, 10, 11]])

In [8]: np.roll(arr, -1, axis=1)
Out[8]:
array([[ 1,  2,  0],
       [ 4,  5,  3],
       [ 7,  8,  6],
       [10, 11,  9]])
Stack Overflow
I'd like to roll a 2D numpy in python, except that I'd like pad the ends with zeros rather than roll the data as if its periodic.
Specifically, the following code
import numpy as np
x = np.array...
Thanks for the help tho
serene scaffold

somber prism
guys i am following this tutorial to build the pretrained faster rcnn in pytorch, but dont you think we need to call model.eval() for the validation data since we dont need to use batch norm , dropouts and other steps and only required for the training or i am just wrong ????
btw mean and std for every img will be different right ? so i have to change the default mean and std for this one right ? https://github.com/pytorch/vision/blob/922db3086e654871c35cd80c2c01eabb65d78475/torchvision/models/detection/generalized_rcnn.py#L15
arctic wedgeBOT
torchvision/models/detection/generalized_rcnn.py line 15
class GeneralizedRCNN(nn.Module):``` twin willow
Hey guys, anyone here have a solid knowledge in NLP and Text Mining ? i need help.
tacit basin
twin willow
Hey guys, anyone here have a solid knowledge in NLP and Text Mining ? i need hel...
You can always ask. If people will know the answer they will help
 twin willow
Okay i work on a project where i have to extract some measures informations like size and volume from a description field, example of the description: " a bottle of 1.5L of Water"
i need to extract the "1.5L" but in other example it is "2 Liter" or "250mL".
frosty flower
The image is represented as a 2d np array, with black dots represented as 1 and white dots 0
Given an arbitrary point on the curve I want to find its tangent
iron basalt
frosty flower
Given an arbitrary point on the curve I want to find its tangent
Get the contour using OpenCV (it wants white foreground so invert the image first). Then using the contour it should be straight forward, just finding the line between two points.
 terse hare
i am doing project where i have a huge list where i have to (Print a data frame with only two columns item_name and item_price ) can anyone help me with this?
 acoustic forge
Is it accurate to say that there are three primary categories of NLP? Sentence Classification
Token Classification
and Sequence to Sequence.
Tasks in NLP can be put under one of these categories?
frosty flower
iron basalt
Get the contour using OpenCV (it wants white foreground so invert the image firs...
What's the return value of findContours?
I have trouble understanding what it actually does
iron basalt
frosty flower
What's the return value of findContours?
"contours is a Python list of all the contours in the image. Each individual contour is a Numpy array of (x,y) coordinates of boundary points of the object."
frosty flower
Oooh i see.
So for my image, it's still the same points, drawing them out won't help
But in contours there's this sequential structure for the pixels on the curve
So I can use that
I see, thanks!
graceful glacier
i have the following table
{'Organic Coffee': {0: 'Americano', 1: 'Latte', 2: 'Cappuccino', 3: 'Espresso', 4: 'Filter Coffee', 5: 'Flat White', 6: 'Mocha', 7: 'Macchiato'}, 'Organic Coffee Price': {0: 2.3, 1: 2.65, 2: 2.65, 3: 1.75, 4: 0.99, 5: 2.65, 6: 2.65, 7: 1.75}, 'Iced Coffee': {0: 'Iced Americano', 1: 'Iced Latte', 2: nan, 3: nan, 4: nan, 5: nan, 6: nan, 7: nan}, 'Iced Coffee Price': {0: 2.2, 1: 2.65, 2: nan, 3: nan, 4: nan, 5: nan, 6: nan, 7: nan}, 'Organic Tea': {0: 'Earl Grey', 1: 'English Breakfast', 2: 'Peppermint', 3: 'Tropical Green Tea', 4: nan, 5: nan, 6: nan, 7: nan}, 'Organic Tea Price': {0: 1.99, 1: 1.99, 2: 1.99, 3: 1.99, 4: nan, 5: nan, 6: nan, 7: nan}, 'Fruit Infusions': {0: 'Lemon & Ginger', 1: 'Raspberry & Pomegranate', 2: nan, 3: nan, 4: nan, 5: nan, 6: nan, 7: nan}, 'Fruit Infusions Price': {0: 1.99, 1: 1.99, 2: nan, 3: nan, 4: nan, 5: nan, 6: nan, 7: nan}, 'Other Beverages': {0: 'Chai Latte', 1: 'Hot Chocolate', 2: 'Matcha Latte', 3: 'Miso Soup', 4: 'Tumeric Latte', 5: nan, 6: nan, 7: nan}, 'Other Beverages Price': {0: 2.65, 1: 2.65, 2: 2.65, 3: 1.6, 4: 2.65, 5: nan, 6: nan, 7: nan}, 'Frappés': {0: 'Chocolate Frappé', 1: 'Classic Frappé', 2: nan, 3: nan, 4: nan, 5: nan, 6: nan, 7: nan}, 'Frappés Price': {0: 3.35, 1: 3.35, 2: nan, 3: nan, 4: nan, 5: nan, 6: nan, 7: nan}, 'Fruit Smoothies': {0: 'Berry Blast', 1: 'Strawberry & Banana', 2: 'Mango & Raspberry', 3: nan, 4: nan, 5: nan, 6: nan, 7: nan}, 'Fruit Smoothies Price': {0: 3.35, 1: 3.35, 2: 3.35, 3: nan, 4: nan, 5: nan, 6: nan, 7: nan}, 'Extras': {0: 'Syrup', 1: 'Extra Shot', 2: nan, 3: nan, 4: nan, 5: nan, 6: nan, 7: nan}, 'Extras Price': {0: 0.45, 1: 0.45, 2: nan, 3: nan, 4: nan, 5: nan, 6: nan, 7: nan}}

and i want to transform it into this

{'Category': {0: 'Extras', 1: 'Frappés', 2: 'Fruit Infusions', 3: 'Fruit Smoothies', 4: 'Iced Coffee', 5: 'Organic Coffee', 6: 'Organic Tea', 7: 'Other Beverages', 8: 'Extras', 9: 'Frappés', 10: 'Fruit Infusions', 11: 'Fruit Smoothies', 12: 'Iced Coffee', 13: 'Organic Coffee', 14: 'Organic Tea', 15: 'Other Beverages', 16: 'Fruit Smoothies', 17: 'Organic Coffee', 18: 'Organic Tea', 19: 'Other Beverages', 20: 'Organic Coffee', 21: 'Organic Tea', 22: 'Other Beverages', 23: 'Organic Coffee', 24: 'Other Beverages', 25: 'Organic Coffee', 26: 'Organic Coffee', 27: 'Organic Coffee'}, 'Subcategory': {0: 'Syrup', 1: 'Chocolate Frappé', 2: 'Lemon & Ginger', 3: 'Berry Blast', 4: 'Iced Americano', 5: 'Americano', 6: 'Earl Grey', 7: 'Chai Latte', 8: 'Extra Shot', 9: 'Classic Frappé', 10: 'Raspberry & Pomegranate', 11: 'Strawberry & Banana', 12: 'Iced Latte', 13: 'Latte', 14: 'English Breakfast', 15: 'Hot Chocolate', 16: 'Mango & Raspberry', 17: 'Cappuccino', 18: 'Peppermint', 19: 'Matcha Latte', 20: 'Espresso', 21: 'Tropical Green Tea', 22: 'Miso Soup', 23: 'Filter Coffee', 24: 'Tumeric Latte', 25: 'Flat White', 26: 'Mocha', 27: 'Macchiato'}, 'price': {0: 0.45, 1: 3.35, 2: 1.99, 3: 3.35, 4: 2.2, 5: 2.3, 6: 1.99, 7: 2.65, 8: 0.45, 9: 3.35, 10: 1.99, 11: 3.35, 12: 2.65, 13: 2.65, 14: 1.99, 15: 2.65, 16: 3.35, 17: 2.65, 18: 1.99, 19: 2.65, 20: 1.75, 21: 1.99, 22: 1.6, 23: 0.99, 24: 2.65, 25: 2.65, 26: 2.65, 27: 1.75}}
what would be the best way to get this? i personally ziped every two columns and then unpivoted(melted)
serene scaffold
let me take a crack at it
serene scaffold
graceful glacier
{'Organic Coffee': {0: 'Americano', 1: 'Latte', 2: 'Cappuccino', 3: 'Espresso', ...
@graceful glacier I'm pretty sure I can figure it out, but is this the shape in which you receive the data? there's no prior shape that might be easier to work with?
graceful glacier
yes thats the original shape unfortunately
agile cobalt
you could try doing something like pd.concat([df.iloc[:, ::2].melt(), df.iloc[:, 1::2]].melt(), axis=1) but that data format looks sooooo weird
like, how do they even decide what goes into each row?
misty flint
acoustic forge
Is it accurate to say that there are three primary categories of NLP? Sentence C...
hmm i wouldnt say so, at least ive never heard of NLP described that way. mostly bc where would you place modern NLP models like transformer models? they are technically not Seq2Seq
graceful glacier
^i like that solution
misty flint
and nowadays modern models like transformers are state of the art
tacit basin
twin willow
Okay i work on a project where i have to extract some measures informations like...
I think named entity recognition should help https://paperswithcode.com/task/named-entity-recognition-ner

Named entity recognition (NER) is the task of tagging entities in text with their corresponding type.
Approaches typically use BIO notation, which differentiates the beginning (B) and the inside (I) of entities.
O is used for non-entity tokens.
Example:
| Mark | Watney | visited | Mars |
|---|---|---|---|
| B-PER | I-PER | O | B-LOC |
...
graceful glacier
agile cobalt
you could try doing something like `pd.concat([df.iloc[:, ::2].melt(), df.iloc[:...
i think its based on index
acoustic forge
misty flint
hmm i wouldnt say so, at least ive never heard of NLP described that way. mostly...
I am not talking about architecture but rather the tasks.
serene scaffold
acoustic forge
Is it accurate to say that there are three primary categories of NLP? Sentence C...
I work as a computational linguist and I don't agree with this division, no.
acoustic forge
misty flint
hmm i wouldnt say so, at least ive never heard of NLP described that way. mostly...
Transformers can do Seq2seq, Sentence classification and token classification as well
acoustic forge
serene scaffold
I work as a computational linguist and I don't agree with this division, no.
Which other primary category of tasks would you say is missing?
serene scaffold
@graceful glacier I haven't come up with a more elegant solution yet, but I'll keep it open and come back to it later
misty flint
i think this a naive estimate that underestimates the broad field of NLP tbh
acoustic forge
misty flint
i think this a naive estimate that underestimates the broad field of NLP tbh
Which other primary category of tasks would you say is missing?
misty flint
where do you place speech recognition
graceful glacier
serene scaffold
<@!403459261151182848> I haven't come up with a more elegant solution yet, but I...
looking forward to it! thanks
acoustic forge
Yeah - That is true. I wasn't including speech synthesis and audio etc
If we talk purely text based NLP
acoustic forge
misty flint
what about information retrieval topics?
Good point!
tacit basin
acoustic forge
Is it accurate to say that there are three primary categories of NLP? Sentence C...
Hmm. I think there's more NLP tasks. https://paperswithcode.com/area/natural-language-processing
But maybe we are talking different things?

Browse 451 tasks • 1284 datasets • 1287
serene scaffold
Rex has conveniently raised both of the points I was going to raise
acoustic forge
tacit basin
Hmm. I think there's more NLP tasks. https://paperswithcode.com/area/natural-lan...
There are a lot of tasks. I am trying to divide them into primary categories
serene scaffold
Also, what about information extraction?
misty flint
serene scaffold
Rex has conveniently raised both of the points I was going to raise
💀 great minds etc.
acoustic forge
serene scaffold
Also, what about information extraction?
Wasn't that one of his points? 😛
tacit basin
acoustic forge
There are a lot of tasks. I am trying to divide them into primary categories
What are the primary categories?
acoustic forge
tacit basin
What are the primary categories?
As an example:
Sequence to sequence would cover the following tasks:
- Text generation
- Summarization
- Translation
- Question and answer
acoustic forge
misty flint
what about information retrieval topics?
What would an example of information retrieval be, that couldn't be part of token and sentence classification
Not trying to be annoying, writing my thesis and trying to figure out what the best structure is
tacit basin
acoustic forge
As an example:
Sequence to sequence would cover the following tasks:
- Text gene...
I see. Hugging face divides that into decoder, encode and sequence to sequence https://huggingface.co/course/chapter1/9?fw=pt
 misty flint
where do you place the concept of TF-IDF? since that's extremely important in info retrieval and search engines
acoustic forge
misty flint
where do you place the concept of TF-IDF? since that's extremely important in in...
Very true - Forgot about tf-idf
Good point
misty flint
honestly, im taking my info retrieval and web search class next semester so i actually dont know as much about info retrieval rn
other than these adjacent concepts
maybe something to look into when writing your thesis
acoustic forge
tacit basin
I see. Hugging face divides that into decoder, encode and sequence to sequence h...
decoder, encoder and encoder-decoder is more the model architecture of the models though
misty flint
just to make sure you cover stuff
that you need to
other than that, i think maybe you got a decent argument for at least a significant amount of NLP tasks
i just would stay from the word "all" or you might get some pushback
from your committee
acoustic forge
misty flint
other than that, i think maybe you got a decent argument for at least a signific...
And actually, that was the goal. This is simply a subsection to introduce readers who doesn't have a lot of experience in NLP to the types of tasks. Then I dive straight into transformer based architecture 😛
misty flint
thats good you could probably group the stuff mentioned above in an other category or something and get away with it
i actually heard about an interesting NLP model the other day
acoustic forge
 misty flint
"zero-shot multilingual neural machine translation"
a mouthful but its actually pretty cool concept
acoustic forge
Interesting - Will check that out 😮
misty flint
yeah maybe you can include it in your recent developments if you find it interesting/relevant enough
how i understood it is you have a neural network that instead of translating from French -> English and then English -> German. It goes straight from French -> German with only training data of (FR->EN. And EN->GR).
"Zero-shot" since you try to do it all in one go
agile cobalt
graceful glacier
i think its based on index
that seems to work? pd.concat([data.iloc[:, ::2].melt(), data.iloc[:, 1::2].melt()], axis=1).set_axis(['Category', 'Subcategory', '_', 'Price'], axis='columns').dropna().drop(columns="_").sort_values(["Category", "Subcategory"]) (if so, have fun cleaning it up)
 misty flint
@acoustic forge https://open.spotify.com/episode/6V0opYi7rHY9kXERo9Yd2m?si=16ec349e94f344fa
[23:30] is the timestamp
Listen to this episode from Super Data Science on Spotify. In this episode, Glean software engineer and Stanford graduate Lauren Zhu joins us to discuss her role at a fast-growing startup, working on natural language processing projects, and how she remains inspired by pursuing her side passions.In this episode you will learn:• Lauren's experien...
acoustic forge
misty flint
<@!131537558453747712> https://open.spotify.com/episode/6V0opYi7rHY9kXERo9Yd2m?s...
Interesting! Will check that out, and will definitely bookmark that podcast. I've been looking for some good data science podcasts
misty flint
yeah def check out that episode and let me know your thoughts
bc it sounds like an awesome NLP model
acoustic forge
misty flint
yeah maybe you can include it in your recent developments if you find it interes...
It sounds very interesting, however I am not sure if it'll be super applicable to our thesis, as we are doing abstractive summarisation of websites. Trying to automatically generate metadescriptions of websites
acoustic forge
You working on any fun projects? 🙂
misty flint
me?
idk about fun
but our group is probably going to try to do something with recommender systems
for our DL class
that or GANs
lol
we havent come to a consensus yet
acoustic forge
Both sounds fun though! Do you know in what context you'd want to do something with rec. systems or GANs?
misty flint
not too sure about the rec systems yet
but for the GANs we would probs try to extend this paper
Given more time, we would’ve liked to explore a generative application [6] capable of producing a new Moonboard problem, given a user-specified difficulty.
so kinda the opposite of the problem they solved in their paper
graceful glacier
agile cobalt
that seems to work? `pd.concat([data.iloc[:, ::2].melt(), data.iloc[:, 1::2].mel...
yea this works, thanks
acoustic forge
misty flint
so kinda the opposite of the problem they solved in their paper
That's super interesting - I recently started bouldering (that's what we call it in DK, not sure if it's like that in other countries) - So if you manage, feel free to send some very easy routes to the gym that I go to 
neat anvil
It's called bouldering in the US as well
acoustic forge
Ah - Alright. Everytime I have talked to people from other countries about bouldering they have been like 
misty flint
yeah basically
misty flint
acoustic forge
Ah - Alright. Everytime I have talked to people from other countries about bould...
its bc they actually arent climbers
thats how you can tell
misty flint
acoustic forge
That's super interesting - I recently started bouldering (that's what we call it...
but yeah you might be interested in this paper too lol
acoustic forge
misty flint
but yeah you might be interested in this paper too lol
Definitely - Very cool project!
misty flint

ill let you know if we end up deciding that one
ill have to take a look at the current rec system models first tho
and test them out
 modern cypress
Hey guys, could anyone lead me in the right direction on how I can improve my accuracy? I am giving it 6000 pictures of 7 different classes


I've tried all kinds of filters and epochs, but I think I'm missing something
Maybe it a problem within my data?
red arrow is what the model predicts

motorcycle 
 iron basalt
misty flint
"zero-shot multilingual neural machine translation"
iron basalt
misty flint
"zero-shot multilingual neural machine translation"
"zero-shot" is such a bad term. But IDK what to replace it with.
Making use of knowledge that is not currently being learned / touched (and may never be if it's just some static rules)?
"Additional structure"?
 quiet vault
modern cypress
Hey guys, could anyone lead me in the right direction on how I can improve my ac...
quiet vault
modern cypress
Hey guys, could anyone lead me in the right direction on how I can improve my ac...
You are overfitting your data
You need to add dropout layers
Honestly, I would look into using architectures that have already proved to be very successful such as GoogleNet
modern cypress
quiet vault
Honestly, I would look into using architectures that have already proved to be v...
If this was a personal project I honestly would. I've already used some before for some Object Detection in some personal projects, but this is a Uni project 😦
modern cypress
quiet vault
You need to add dropout layers
Sorry, what do you mean by this?
quiet vault
modern cypress
If this was a personal project I honestly would. I've already used some before f...
oh F
modern cypress
 quiet vault
modern cypress
Sorry, what do you mean by this?
quiet vault
modern cypress
Sorry, what do you mean by this?
A dropout layer is a type of layer
modern cypress
This?
quiet vault
yes
It basically randomly changes weights to 0 which somehow reduces overfitting (iirc)
I also see that you only have 1 conv2d layer
you should use more
with the number of filters increasing and the filter/kernel size decreasing in odd numbers
(7, 5, 3) for size and amount of filters like this (64, 128, 256)
This is very expensive to train so im not sure if you can
But if you can, it improves results
and add some more dense layers
 quiet vault
add keras.layers.Dropout(0.3) before the final dense layer
and increase it if overfitting is still bad
typical ranges are from 0.3-0.8 iicr
one more thing
add a pooling layer
it decreases the amount of memory being used in the conv2d layers
quiet vault
yea there are a lot
modern cypress
i just tried running this with 2 epochs just to see how it goes

should be done in around 5 mins
quiet vault
alright
surprised you have enough memory ngl
oh
i forgot to mention
what is the shape of your y?
 grave frost
iron basalt
"zero-shot" is such a bad term. But IDK what to replace it with.
grave frost
iron basalt
"zero-shot" is such a bad term. But IDK what to replace it with.
what's so bad about it? 😦
personally, I find it a pretty intuitive label
modern cypress
I tried testing out the max images I could train on the old model I had I reached about 80k
modern cypress
quiet vault
alright

Nice nice a lot better than before
So I should add a pooling layer
quiet vault
modern cypress
I have 32gb ram
oh makes sense
quiet vault
modern cypress
y is just an int
for classification you cannot do that
modern cypress
Oh, what do you mean?
quiet vault
how many classes do you have?
quiet vault
for an output of the first class, the output has to be [1, 0, 0, 0, 0, 0, 0]
and for 2 it would be
[0, 1, 0, 0, 0, 0, 0]
if that makes sense
modern cypress
Oh hmmmm
quiet vault
to do this, you can easily use the to_categorical function on your y dataset
 quiet vault
print the prediction variable
modern cypress
 quiet vault
yep thats good
modern cypress
I understand you though
modern cypress
Right now each class has an index, so class 1 is 1 and so on, but you're saying it's better for class 1 to be [1, 0, 0, 0, 0, 0, 0]
quiet vault
always with multi class classification, use the softmax activation function on the final dense layer
this will make all the outputs add up to 1
quiet vault
modern cypress
Right now each class has an index, so class 1 is 1 and so on, but you're saying ...
yea
modern cypress
keras.layers.Dense(7, activation = 'softmax')
quiet vault
yes
misty flint
iron basalt
"zero-shot" is such a bad term. But IDK what to replace it with.
haha that's fair. and i think the use case for this type of model is for low-resource languages for which we dont have much training data on


 quiet vault
interesting
modern cypress
Hmm, this is a lot deeper into stuff like this than i've ever gone
quiet vault
modern cypress
this is a binary classification loss
you dont want that
for the loss just use 'categorical_crossentropy' and see what happens
with the softmax activation
misty flint
misty flint
haha that's fair. and i think the use case for this type of model is for low-res...
actually a multilingual model like this might be useful for real-time translation with multiple languages at once
metaverse?
jk
modern cypress
quiet vault
for the loss just use 'categorical_crossentropy' and see what happens
Hmm categorical cross entropy gave me error
ValueError: Shapes (None, 1) and (None, 7) are incompatible
Oh
Do I need to fix my y?
quiet vault
Did you change anything else or just the loss function?
modern cypress
Ahh fixed my y and I think it's working?
I still hadn't changed the 1 to [1,0,0,0,0,0,0]
quiet vault
ah
iron basalt
misty flint
haha that's fair. and i think the use case for this type of model is for low-res...
It's actually the correct way to do things in general (if you want to mimic the human brain), but the term is kind of meaningless, all learning is at least one-shot. What's next? Negative-one-shot for generative models that make unseen "samples"?
modern cypress
quiet vault
ah
hmmm
 quiet vault
share the full training

 quiet vault
increase epochs
also
you can watch the model test on the validation data after every epoch if you want
modern cypress
oh for real?
quiet vault
if you do use validation_data=(x_train, y_train) in the fit function
Do this and increase epochs to 10
see if the validation accuracy decreases at all
iron basalt
iron basalt
It's actually the correct way to do things in general (if you want to mimic the ...
It's often just generically referred to as "associative learning" which is also kind of meaningless / too generic.
The real life equivalent is making use of evolved knowledge / not learned during life. And so associating things with it gives "zero-shot" learning. It's the additional structure or biases provided to make learning much faster / accurate (from scratch is really hard). **These biases are not completely immutable though.
modern cypress
quiet vault
Do this and increase epochs to 10
yes sir, started training
I appreciate your help so much
quiet vault
no problem
wait
i wanted to say validation_data=(x_test y_test)
not x_train and y_train
If you used train just restart training
its useless
modern cypress
Alright tysm
brave sand
could basic machine learning be learned by doing countless projects?
iron basalt
brave sand
could basic machine learning be learned by doing countless projects?
Yes, that's how it also got invented in the first place.
brave sand
iron basalt
Yes, that's how it also got invented in the first place.
so I did a couple basic tutorials, do you think a survival simulation could be done with q learning?
iron basalt
brave sand
so I did a couple basic tutorials, do you think a survival simulation could be d...
Yes, it's common.
brave sand
iron basalt
Yes, it's common.
if I had a simulation starting with 100 agents, will one q table suffice?
iron basalt
brave sand
if I had a simulation starting with 100 agents, will one q table suffice?
No.
iron basalt
brave sand
would I need one for every agent?
Depends on what you are doing. IDK
brave sand
iron basalt
Depends on what you are doing. IDK
https://www.youtube.com/watch?v=N3tRFayqVtk&list=LL&index=5&t=2229s
like this with q learning tho
This is a report of a software project that created the conditions for evolution in an attempt to learn something about how evolution works in nature. This is for the programmer looking for ideas for interdisciplinary programming projects, or for anyone interested in how evolution and natural selection work.
Before commenting on the religious/t...
this is just like an example of an outcome I want to achieve
iron basalt
You can evolve reinforcement learners.
brave sand
Could you elaborate?
iron basalt
I recommend learning how genetic algorithms work, it should be pretty obvious then.
brave sand
A project like that would take too long with basic q learning correct?
https://pythonprogramming.net/own-environment-q-learning-reinforcement-learning-python-tutorial/?completed=/q-learning-analysis-reinforcement-learning-python-tutorial/
because I read a tutorial like this and wanted to use similar approaches for a survival simulation
Python Programming tutorials from beginner to advanced on a massive variety of topics. All video and text tutorials are free.
iron basalt
The project you gave me is about virtually evolved creatures, it does not require RL.
iron basalt
Adding RL into the mix would probably give better results, but also take much more compute.
brave sand
Yeah, because wouldn't a genetic algorithm be less superior to an RL algorithm?
iron basalt
No.
Genetic algorithms are incredibly good. Their downside is that they require multiple agents.
iron basalt
Also genetic algorithms only learn between generations, not during.
They can't adapt on the fly during the agent's life.
Combining genetic algorithms and RL gives you both, but you still need multiple agents and those just got much more expensive to compute.
brave sand
Expensive to compute as in time and speed?
iron basalt
Yes, you need to simulate each agent in its environment and that now includes an RL model.
If the RL model is efficient enough it can be worth it.
brave sand
So genetic algorithms are easier to start with so I'll start there
So the video above is just using a basic genetic algorithm?
iron basalt
Yeah genetics algorithms in their most basic form are stupidly simple.
brave sand
I thought they would be using a neural network
iron basalt
It does not require a neural network.
It does not require much of anything.
(Which is why it can easily show up in nature)
brave sand
Ohh, but in the video they used a neural network, why is that? Especially when a genetic algorithm is much easier to implement?
iron basalt
brave sand
Ohh, but in the video they used a neural network, why is that? Especially when a...
They did implement a genetic algorithm, but they are probably using the neural network's weights as the medium / substrate.
I recommend just learning about genetic algorithms and all will become clear.
brave sand
Alright thank you
 clear vale
hello guys... I am going to start studying ML.. just finished a pandas playlist in Youtube... any ideas of cool projects for beginners?
modern cypress
quiet vault
im gonna eat dinner now but ill get back to you once i get back
Hmm, looking at the accuracy after every epoch, I thought the model would be quite good but the test accuracy is 0.51. Does this mean I am overfitting with this many epochs?


 iron basalt
clear vale
hello guys... I am going to start studying ML.. just finished a pandas playlist ...
iron basalt
clear vale
hello guys... I am going to start studying ML.. just finished a pandas playlist ...

By the 1950s, science fiction was beginning to become reality: machines didn’t just calculate; they began to learn. Machine calculating was out. Machine learning was in. But we had to start small.
Donald Michie’s “Machine Educable Noughts And Crosses Engine” -- MENACE -- was composed of 304 separate matchboxes that each depicted a possible stat...
Fun physical interactive ML project (also analogous to genetic algorithms (losing genes removed from gene pool)) . You can implement it in Python later if you want maybe with a GUI. @brave sand
modern cypress
modern cypress
flicking through I can see some errors
I would have accepted human too


wait let me look at confusion matrix
because I'm seeing a lot of fire
maybe im overfitting on that specific class?
that class has 1.7k/6k images
clear vale
iron basalt
Fun physical interactive ML project (also analogous to genetic algorithms (losin...
thanks man I will definitly look out
modern cypress
quiet vault
honestly it might be an error in the code
like the coding of model.evaluate?
brave sand
iron basalt
Fun physical interactive ML project (also analogous to genetic algorithms (losin...
Losing gene pools?
modern cypress
quiet vault
whats the code u have for fit
model.fit(x_train, y_train, epochs=epochs, validation_data=(x_test, y_test))
iron basalt
brave sand
Losing gene pools?
If a agent dies it's no longer in the gene pool and thus a losing strategy was removed as an option (probabilistic).
quiet vault
modern cypress
`model.fit(x_train, y_train, epochs=epochs, validation_data=(x_test, y_test))`
yep idk sorry
brave sand
iron basalt
If a agent dies it's no longer in the gene pool and thus a losing strategy was r...
So it keeps on going till there’s none left?
quiet vault
ive never seen the val accuracy not line up with score when evaluating model
iron basalt
brave sand
So it keeps on going till there’s none left?
No, because the genetic algorithms produce more new agents and the population can even grow over time to have even more parallel strategy search (on a computer you need to limit it for performance reasons and IRL it's limited by resources available too, like food).
modern cypress
quiet vault
yep idk sorry
Dont worry, you've helped me out so much already, thank you bro
brave sand
iron basalt
No, because the genetic algorithms produce more new agents and the population ca...
I sort of understand? I’ll trying implementing a genetic algorithm for a survival simulation
iron basalt
brave sand
I sort of understand? I’ll trying implementing a genetic algorithm for a surviva...
Each agent takes actions in a survival simulation, and you want it to take "winning" actions. Genetic algorithms get you there, see video.
brave sand
iron basalt
Each agent takes actions in a survival simulation, and you want it to take "winn...
Video? I’ll watch a tutorial or explanation though
iron basalt
iron basalt
https://www.youtube.com/watch?v=sw7UAZNgGg8
Also maybe read the wiki page on genetic algorithms to start: https://en.wikipedia.org/wiki/Genetic_algorithm .

In computer science and operations research, a genetic algorithm (GA) is a metaheuristic inspired by the process of natural selection that belongs to the larger class of evolutionary algorithms (EA). Genetic algorithms are commonly used to generate high-quality solutions to optimization and search problems by relying on biologically inspired ope...
Genetic algorithms can be used to evolve arbitrary parameters (can be applied on top of an existing algorithm that has parameters in need of tweaking). There is a hello world program for genetic algorithms and that is to evolve a population of strings into "Hello, World!".
 spiral furnace
sup folks?
I'm trying to count unique values in a df column, I do len() but sometimes there is nan that I want to exclude. Do you know of any fast method on counting the number of values minus the nan or should I go barbarian?
spiral furnace
I do this-- if df.var.isnull().values.any(): len(df.var.unique())-1
but is there any method already in pandas for that?
agile cobalt
spiral furnace
I do this-- if df.var.isnull().values.any(): len(df.var.unique())-1
but is there...
seems like just df.nunique(dropna=True)?
https://pandas.pydata.org/docs/reference/api/pandas.DataFrame.nunique.html
spiral furnace
agile cobalt
seems like just `df.nunique(dropna=True)`?
https://pandas.pydata.org/docs/refer...
yes!!
really I need to learn better about how to search in the documentation
 fading gate
when doing a df.groupby("x").apply(lambda x: x["y"] - x.loc[0, "y"]) it seems the indices in my groupby aren't reset. Is this expected?
what I'd like to do is subtract the first row's y from each row's y
do I really need to do df.groupby("x").apply(lambda x: x.reset_index()["y"] - x.reset_index().loc[0, "y"]) ?
spiral furnace
fading gate
when doing a ```df.groupby("x").apply(lambda x: x["y"] - x.loc[0, "y"])``` it se...
why don't you just do df.reset_index() ?
fading gate
my df index is reset it appears, index goes from 0 - N
spiral furnace
are you on Kaggle?
fading gate
what is kaggle?
I think this might work: df.groupby("x").apply(lambda x: x["y"] - x.reset_index().loc[:0, "y"])
I guess there's no way to just say get me the first row irrespective of the index values except maybe with iloc but then iloc wants a numeric column offset
fading gate
yeah y is a column
df["marginal_y"] = df.groupby("x").apply(lambda x: x["y"] - x.reset_index().loc[:0, "y"]) is really what I'm trying to achieve
yup that works actually
frosty flower
Hey quick question
Is there a quick way to turn a binary image into points?
Like if I have:
[[ 0, 1, 1 ],
 [ 1, 0, 0 ],
 [ 0, 0, 0 ]]
And I want to turn it into:
[[0, 1], [0, 2], [1, 0]]
Of course I can do it with a double loop
But since it's #data-science-and-ml you know what I'm asking

 steep lotus
guys if i have question about social media mining is this the right place to go to
misty flint
iron basalt
It's actually the correct way to do things in general (if you want to mimic the ...
yes
misty flint
steep lotus
guys if i have question about social media mining is this the right place to go ...
probably. depends on what are you trying to do
steep lotus
well currently for now its just questions that i have while i run the code that im getting from the book.
like for example import requests
is there any practical applications to this while analyzing soccer games and its live game data?
and thank for answering @misty flint
misty flint
lets zoom out and think about the bigger picture first
say you have a soccer game
and people are live-tweeting about it using a certain hashtag
what type of questions do you want answered if you had access to that aggregated information?
how do people feel about the game as a whole? about a certain player? (sentiment analysis)
you could probably see more tweets that happen right after a goal is scored
stuff like that
iron basalt
frosty flower
Hey quick question
>>> a = np.array([[0, 1, 1], [1, 0, 0], [0, 0, 0]])
>>> a
array([[0, 1, 1],
       [1, 0, 0],
       [0, 0, 0]])
>>> np.argwhere(a > 0)
array([[0, 1],
       [0, 2],
       [1, 0]])
>>>
i think always starting big picture and asking questions is better than just diving into code and wondering what the heck youre even doing at times. and no problem.
scientific method and all that etc.
frosty flower
iron basalt
```py
>>> a = np.array([[0, 1, 1], [1, 0, 0], [0, 0, 0]])
>>> a
array([[0, 1, 1]...
Awesome, thanks.
 charred light
Why does pyspark's df.count() return a different # of rows compared to pyspark df.toPandas() and then using panda's .shape? I'm seeing a difference of ~30 rows.
For example:
df1 = df['col1', 'col2'].dropDuplicates(['col1', 'col2'])
df1.count() #Returns 81049
df2 = df['col1', 'col2'].dropDuplicates(['col1', 'col2']).toPandas()
df2.shape #Returns 81077 ???
A hunch but may be 2nd version still has duplicates?
I can see you did try to drop it but may be...
charred light
lapis sequoia
A hunch but may be 2nd version still has duplicates?
I checked this first.
df2.duplicated().any() returns false
Similarly, df2[df2.duplicated()] returns an empty dataframe
Edited to specify df2*
From what I understand, the code should execute the pyspark code first, then convert the pyspark dataframe to pandas dataframe?
lapis sequoia
I'm not sure. I have never personally used pyspark.
Lemme dig in a lil bit if i can find
Hold on
It may be NA rows
charred light
df2.isna().sum() each col* returns 0
I'm internally screaming...
I think I'm stuck working within pyspark's dataframe.
lapis sequoia
charred light
`df2.isna().sum()` each col* returns 0
I'm internally screaming...
I think I'm...
hm alright. run df2.count
lets see what values each col has
charred light
df2.col1.value_counts(dropna=False) returns 1 of each value (This is a column of unique ids, len same as shape)
df2.col2.value_counts(dropna=False) returns 81077 of val1
df.count() returns each col matching shape as well
df.count returns some individual rows, 81077 rows.
lapis sequoia
so shape gives more only
edit: oh nono sorry count also returns 81077
charred light
lol, pyspark is cancer. I tried df3 code and it returned entirely different count
df1 = df['col1', 'col2'].dropDuplicates(['col1', 'col2'])
df1.count() #Returns 81049
df3 = df1.toPandas()
df3.shape #Returns 81054
df2 = df['col1', 'col2'].dropDuplicates(['col1', 'col2']).toPandas()
df2.shape #Returns 81077 ???
Jesus lol
charred light
I found the problem.
I tested out a query with just 20 rows.
The df1 = df['col1', 'col2'].dropDuplicates(['col1', 'col2']) IDs are different from the original query, which is different from the IDs in df2 = df['col1', 'col2'].dropDuplicates(['col1', 'col2']).toPandas()
But I have no idea why
"Pyspark similar to pandas" yea, ok
 lyric tartan
can anybody help me with OpenCV And CSV file?
lapis sequoia
lyric tartan
can anybody help me with OpenCV And CSV file?
sure, people can, but you need to share que first.
lyric tartan
i am working face recoginition project i want to display details from csv file
import csv
import os
from pathlib import Path
faces_path = "C:\Users\kingm\Desktop\pythonProject\faces"
def search():
face_names = os.listdir(faces_path)
for i, name in enumerate(face_names):
filename = os.path.basename(name)
numm = Path(filename).stem
num = numm
read = csv.reader(open('C:\Users\kingm\Desktop\test.csv'))
for row in read:
if num == row[0]:
print(row)
search()
i used this for getting number as name of jpg and print same number details in csv file
lyric tartan
lapis sequoia
sure, people can, but you need to share que first.
can u help me with this