#data-science-and-ml
1 messages · Page 381 of 1
 ornate sky
 tacit basin
How do you launch python ?
tacit basin
How do you launch python ?
i use jupyter on vscode
ornate sky
tacit basin
You can try `python -m pip install pyPDF2`
i did try nothing seems to work unfortunatly
 misty flint
its always a pathing issue
like 9 times out of 10
you should try creating and activating a virtual environment
and installing it there
 misty cargo
need some help with numpy
if i have x1=linspace(...) and x2=linspace(...) is there a good way of obtaining the grid?
i would want this to be an input matrix
something like 2 rows by N (number of pairs) columns
what would be the proper way to do that?
 neat anvil
depends what output you want
how are you combining the two 1d obects into a 2d object? an outer product?
misty cargo
just one numpy array
neat anvil
like, what value fills cell (4,6)
misty cargo
neat anvil
how are you combining the two 1d obects into a 2d object? an outer product?
i would like to have each item of x1 to have associated entire x2
neat anvil
is it x1[4] * x2[6]
misty cargo
basically if x1 is 30 and x2 is 30 elements i want an array with 900
neat anvil
like [ x1[1]x2[1], x1[1]x2[1], ... , x1[2]x2[1], ... ]?
misty cargo
neat anvil
like, what value fills cell (4,6)
nope, it would be a [x1[4], x2[6]]
neat anvil
I'm sorry, I honestly don't understand what you mean. Could you provide a simple example with like 2 elements in x1 and 3 in x2 solved manually?
misty cargo
yep
yepppp
like i want my final array to be
# dataset
x = np.array([[0, 0, 1, 1, 1, 1, 1],
              [0, 1, 0, 1, 0, 1, 0],      # 3x7
              [1, 1, 1, 1, 1, 0, 0]])
but you want to still have the values from x1 in there somewhere? are they the first element in each "row" of x2 data?
neat anvil
this seems like what you're asking for? see the examples: https://numpy.org/doc/stable/reference/generated/numpy.meshgrid.html
misty cargo
i want to have x being x1
[-1.5 y    and then -1.5 -1.5 -1.5
[-1.5 x             -1.0 -0.5 0
i want to have the axes basically
misty cargo
neat anvil
this seems like what you're asking for? see the examples: https://numpy.org/doc/...
hmmm i mean it s weird because a meshgrid unpacks into two 2d arrays
my need for this is to feed it into a network
but i need the whole input space i think
oh oh
ok maybe you lll understand what i mean now
np.array =
[
[x1[0], x1[0], x1[0], x1[0] ... x1[0],   x1[1], x1[1], ... all the way x1[300] ... x1[300]],
[x2[0], x2[1], x2[2], x2[3] ...x2[300],  x2[0], x2[1], ... all the way x2[0] ... x2[300]]
]
i hope this is clear enough
 twin hound
hello may I ask a question about cross_val_score?
when I apply this to my model it reduces my score significantly than if I didn't apply it. This happens whether I shuffle or not. can someone explain how I can fix this? thanks
im just using a simple MLP and SVC model using sklearn on my training and testing data
 arctic crown
can someone please suggest me a pytorch tutorial please @ me if so
 urban prism
Can I get the RAM usage via nvidia-smi? I am trying to get inference gpu memory and ram usage
 plush jungle
I have this RNN that I used to predict words in a sentence
class MyRNN(nn.Module):
    def __init__(self, input_size, hidden_size, output_size):
        super(MyRNN, self).__init__()
        self.hidden_size = hidden_size
        self.in2hidden = nn.Linear(input_size + hidden_size, hidden_size)
self.in2output = nn.Linear(input_size + hidden_size, output_size)```and I want to retrofit it to predict sequences of images like this

so instead of passing it one hot vectors representing words, I would pass it lists of one hot vectors representing cars, bikes, etc
how do I change the code to do this? will input size still be an int?
 upper spindle
arctic crown
can someone please suggest me a pytorch tutorial please @ me if so
upper spindle
arctic crown
can someone please suggest me a pytorch tutorial please @ me if so
youtube is your best friend imo, for free tutorials on pytorch
arctic crown
PyTorch or tensorflow or keras
upper spindle
all three
arctic crown
What if you are a beginner
upper spindle
im a beginner, and ive been using youtube
i.e. i do an economics degree, so programming is a myth to me, and youtube has helped
specifically freecodecamp for basics
but out of them you listed, i would advise for tensorflow, instead of pytorch
arctic crown
Okay Ty
 desert oar
twin hound
when I apply this to my model it reduces my score significantly than if I didn't...
desert oar
twin hound
when I apply this to my model it reduces my score significantly than if I didn't...
what do you do when you don't apply it? how are you scoring the model otherwise?
you might be seeing the difference between "train score" and "test score", which can be very big -- which is why we do train/test splits and cross validation at all
desert oar
plush jungle
how do I change the code to do this? will input size still be an int?
if you really do have a sensible way to one-hot encode an image, then no your code can be identical
are you literally classifying a 1-dimensional sequence like "car bike bike unicycle car unicycle bike car car unicycle"?
if so, the fact that these are "images" is entirely irrelevant to the problem
plush jungle
desert oar
are you literally classifying a 1-dimensional sequence like "car bike bike unicy...
yeah I just called them images, but really they're just tensors that resemble images
but the problem is, in my RNN as written, it's looking for a one hot vector like [0,1,0]
plush jungle
plush jungle
but if I have a 2d data structure like this, one dimension is the locations, and another is the type of object
desert oar
ok, so you need to do something more sophisticated then
plush jungle
so it would be [[0,1,0], [0,0,1], [0,1,0]]
desert oar
2d rnn's are a thing but i'm not sure that they apply here
i believe when people say "2d rnn" they are talking about 2 sequences "side by side"
not a sequence where individual elements are > 1-dimensional
but i might be wrong about that... let me see if i can dig up any references
aha, it does seem to be a thing, it has apparently been used for visual tracking of objects/people
however it seems to be more complicated than "just slap in a 2d thing here" and i'd have to read this paper to see what they actually do
plush jungle
oof
desert oar
here, this is all the way back from 2007... no idea if anyone used/uses this technique https://www.cs.toronto.edu/~graves/icann_2007.pdf
another option would be to layer some kind of encoder before the rnn part
i think this is how transformer models work, for example. it operates on pre-encoded word vectors, not the "raw" one-hot-encoded words themselves
actually that's kind of what the rnn does already, no?
i think i am overthinking this
the "recurrent" part is recurrence between hidden states
plush jungle
desert oar
i think this is how transformer models work, for example. it operates on pre-enc...
it's funny you mention that because I would love to implement this with a transformer
but i just got my NLP RNN working, and I've never built a transformer before
desert oar
so yes you should be able to have some arbitrarily complicated "observed data"
plush jungle
so I figured it would be easier to retrofit my RNN
desert oar
yeah this is totally doable, not sure what i was thinking before
here's someone doing it for an lstm https://discuss.pytorch.org/t/images-as-lstm-input/61970

PyTorch Forums
Hi, I want to feed in 18 images of size (3,128,128) into an lstm of 17 layers. I’m a bit confused about what my input should be. Docs mention that the input should be of shape(seq_len, batch_size, input_size), When I draw my 1st batch using a data loader I get a tensor of size (18,3,128,128) Does this mean that my LSTM input is: seq_len =18, ba...
You can’t pass input image size of (3 , 128 , 128) to LSTM. You should reshape to (batch,seq,feature). For example input image size of (3128128) -> (1,128,3 * 128) or (1,3,128 * 128) . I think you need the CNN to extract feature before pass into LSTM.
hmm
enough with the handwaving. this is why you have to look at the actual math
plush jungle
on a fundamental level, transformers and rnns take the same data, right? rnns just take it one element at a time, and transformers take the whole sequence right?
desert oar
at a high level yes. i am not an expert in this area, but that is my understanding
plush jungle
ok
desert oar
transformers set up a pair-wise comparison of all elements of the sequence
so they make sense on fixed-size sequences like chunks of human text
one very simple solution is to just "flatten" the image into a 1d array, basically discarding all spatial knowledge and treating it like a "bag of pixels"
then your nn.Linear will work fine
maybe it also works with >1 dimensional inputs but it will still be a "bag of pixels" so to speak
otherwise i guess you'd have to layer something in front of the RNN part
i do feel like this probably has a simpler solution but this is not my area of expertise, so that's the best i got off the top of my head
plush jungle
desert oar
one very simple solution is to just "flatten" the image into a 1d array, basical...
i'm already flattening it from a 2d array into a 1d array, if I flattened it again, it would disregard object types, not positions
desert oar
ahh i see
i misunderstood your example before
https://pytorch.org/docs/stable/generated/torch.nn.Linear.html#torch.nn.Linear yeah you can probably just slap that into nn.Linear
err... maybe? i can't tell if it supports any size array or just 2d
give me a bit, i can fire up pytorch and try it
plush jungle
in my original RNN
I instantiated the model like
model = MyRNN(len(vocabulary), hidden_size, len(vocabulary))```class MyRNN(nn.Module):
def __init__(self, input_size, hidden_size, output_size):```but here, my input and output size aren't the length of the vocabulary
@desert oar stackoverflow actually says that pytorch.nn.linear can take n-d inputs
desert oar
i just found that

Stack Overflow
When building a simple perceptron neural network we usuall passes a 2D matrix of input of format (batch_size,features) to a 2D weight matrix, similar to this simple neural network in numpy. I always
so yeah you should be OK
desert oar
i think your input_size is now (number_of_pixels_in_each_image, number_of_object_types)
plush jungle
as a tuple?
desert oar
that'd be my guess
plush jungle
let me try that thanks
desert oar
i might be wrong
plush jungle
wait actually
because it's like this
class MyRNN(nn.Module):
    def __init__(self, input_size, hidden_size, output_size):
        super(MyRNN, self).__init__()
        self.hidden_size = hidden_size
        self.in2hidden = nn.Linear(input_size + hidden_size, hidden_size)
self.in2output = nn.Linear(input_size + hidden_size, output_size)```input_size gets added to hidden size
so I can't just make it a tuple without changing that somehow
desert oar
yeah try just specifying the number of object types, but pass in matrices instead of vectors
that seems to be what this one SO answer suggests
that you fix the number of "columns" in the input and it figures out the rest
sorry i don't have a console open in front of me, this should be easy to test interactively
plush jungle
like this?
class MyRNN(nn.Module):
    def __init__(self, input_size, hidden_size, output_size):
        super(MyRNN, self).__init__()
        self.hidden_size = hidden_size
        self.in2hidden = nn.Linear(
                    (input_size[0] + hidden_size, input_size[1]+hidden_size), hidden_size)
self.in2output = nn.Linear(input_size + hidden_size, output_size)```but won't that throw an error when it tries to add input_size (now a tuple) with hidden_size (still an int)?
desert oar
no, try passing in the number of object types as input_size
plush jungle
ok
desert oar
but for the data, pass each item as a matrix
heck, maybe you can go so far as to make it a 3-dimensional input
i.e. don't flatten the image, so it's (n_rows, n_cols, n_object_types)
seems like that should be fine with nn.Linear from what i just read online
plush jungle
I have 3 objects
plush jungle
and I did as you said and passed input_size the int 3
tensor([[1., 0., 0.],
        [1., 0., 0.],
        [1., 0., 0.],
        [1., 0., 0.],
        [1., 0., 0.],
        [1., 0., 0.],
        [1., 0., 0.],
        [1., 0., 0.],
        [1., 0., 0.],
        [0., 1., 0.],
        [1., 0., 0.],
        [1., 0., 0.],
        [1., 0., 0.],
        [1., 0., 0.],
        [1., 0., 0.]])
Traceback (most recent call last):
  File "D:\Python\self_driving_car_simulator\road_prediction_RNN.py", line 155, in <module>
    output, hidden_state = model(road, hidden_state)
  File "C:\Users\name\AppData\Local\Programs\Python\Python39\lib\site-packages\torch\nn\modules\module.py", line 1102, in _call_impl
    return forward_call(*input, **kwargs)
  File "D:\Python\self_driving_car_simulator\road_prediction_RNN.py", line 73, in forward
    combined = torch.cat((x, hidden_state), 1)
RuntimeError: Sizes of tensors must match except in dimension 1. Expected size 15 but got size 1 for tensor number 1 in the list.
>>> ```the tensor you see is the matrix I passed it
a 1-d list of one hot vectors representing objects
@desert oar please let me know if you'd rather I didn't ping you, but I was wondering if you had thoughts on how to change my forward() function so it doesn't throw this error on the torch.cat() line
    def forward(self, x, hidden_state):
        combined = torch.cat((x, hidden_state), 1)
        hidden = torch.sigmoid(self.in2hidden(combined))
        output = self.in2output(combined)
return output, hidden```now that x is a matrix and not a vector
 digital folio
Hello

This is scatterplot, that was done in 28mins
with same data I did heat map

hmmm
I dont want batman
plt.hist2d(df_tweet['Polarity'], df_tweet['Subjectivity'])
what did i do wrong
desert oar
plush jungle
```
tensor([[1., 0., 0.],
[1., 0., 0.],
[1., 0., 0.],
[1...
makes sense to me, the x is now the wrong shape and can't be concatenated with the hidden state
how to fix it... not sure
i would want to look at the math to see how it's supposed to be done
desert oar
digital folio
```py
plt.hist2d(df_tweet['Polarity'], df_tweet['Subjectivity'])
```
it looks like the bottom white region is very dense compared to the others. you will need to add some kind of transformation to the colormap https://matplotlib.org/stable/tutorials/colors/colormapnorms.html
i recommend at least adding the colormap so you can see what the color scale even is
and maybe use smaller histogram regions
personally i much prefer hexagonal histogram binning over square/rectangular
 desert oar
yeah, same problem
you have one very very dense region that throws off the color scale
digital folio
and i canot skip that point
desert oar
in that case, you should consider transforming the color scale, as per the link i sent above
digital folio
yeah i have never done that before
digital folio
feel like washing grandpa feet
desert oar
i have never heard that expression before 😆
 desert oar
at least consider 1) using smaller points, and 2) adding some transparency so you can see what areas are denser
@plush jungle hmmmm another option is to maybe have two separate nn.Linear components (i hesitate to say "layers") that you then sum afterwards? idk if that will have really bad performance or something
that way you don't have to worry about torch.cat-ing anything
digital folio
doing a log wont help
desert oar
why not?
digital folio
concentration is high ay zero
 minor elbow
yeah transparency with low alpha values (try 0.1 - 0.2) can help

I am delighted to announce that a draft of my latest book, “Probabilistic Machine Learning: Advanced Topics”, is now available online at https://t.co/dSlKkwYpLr. It covers #DeepGenerativeModels, #BayesianInference, #Causality, #ReinforcementLearning, #DistributionShift, etc. https://t.co/BbLFTNZSro
Likes
4519
Retweets
954

 Twitter
·
minor elbow
Twitter
·
minor elbow
its a draft, theres a pdf on the website if u follow the link
desert oar
minor elbow
https://twitter.com/sirbayes/status/1498402522511253510
i have been reading the draft version, it definitely needed some editing but it is shaping up to be a very good reference + course textbook
i liked his treatment of iterated expectation and iterated variance laws
i think a lot of books treat them as mathematical curiosities, rather than useful facts
minor elbow
yeah it looks good i have been looking for a new book to get stuck into as well
desert oar
minor elbow
yeah it looks good i have been looking for a new book to get stuck into as well
i have also been reading through Statistical Rethinking and i quite like it as well
PML would be hard to self-study from without a proper background or course to support you, so i think of it as more of an intermediate learning resource or a reference
but you can easily guide yourself through SR in my opinion
digital folio
df_norm_col=(df_tweet['Polarity'].mean())/df_tweet['Subjectivity'].std()
sns.heatmap(df_norm_col, cmap='viridis')
plt.show()
error : raise ValueError(f"Must pass 2-d input. shape={values.shape}")
ValueError: Must pass 2-d input. shape=()
desert oar
@digital folio df_norm_col is a scalar value
it's the mean of Polarity divided by the standard deviation of Subjectivity
a number divided by a number
digital folio
cool cool
desert oar
a number has shape (), i.e. it is an array of 0 dimension
which obviously isn't valid
digital folio
IndexError: Inconsistent shape between the condition and the input (got (100001, 1) and (100001,))
something new
 desert oar
the histogram around the edges is a good touch, but it shows that most of the data is in one tiny area and that the rest is very rare, effectively noise
you might need to make 2 plots
are all of those data points identical? or just concentrated in a small area?
twin hound
desert oar
what do you do when you _don't_ apply it? how are you scoring the model otherwis...
Just using the built in .score function from sklearn
How do I deal with overfitting of my SVM and MLP algorithms?
 serene scaffold
twin hound
How do I deal with overfitting of my SVM and MLP algorithms?
serene scaffold
twin hound
How do I deal with overfitting of my SVM and MLP algorithms?
do you know what the margin is in SVM?
twin hound
0.996 for training and validation
0.55 for test
serene scaffold
That is not what the margin is.
serene scaffold

each circle or star are data points. circles are one class, the stars are another
twin hound
My value of C?
serene scaffold
the margin is labeled here as the gap
twin hound
I dont know how to measure this my data has 8 input variables
And one output variable with 0,1,2,3,4
serene scaffold

here's the same basic diagram instead
see how there's an obvious boundary between the two clusters?
twin hound
Yea I understand that's the decision boundary
serene scaffold
right. the margin is the same idea, with emphasis on there being "width", I guess
twin hound
But in my case I have 8 X inputs. They would have to be compared to one another with a margin between them
My data doesn't really have a clear decision boundary like that unfortunately. I will send a screenshot
misty flint
youre just in a higher dimension
you could still technically have a decision boundary
will it be useful? 
definitely not for visualizing; rule of thumb is to reduce it down to 2/3D if youre going to visualize
serene scaffold

here's an absurd example, where the margin takes twists and turns to keep each side "pure"
when in reality, the two points in weird locations are probably those that are difficult to classify in real life, or which aren't well explained by the feature set.
do you see why that's an issue?
misty flint
yes 
your red and blue dots reminded me of something i did recently

this is a plug for streamlit + plotly if no ones ever tried it before
highly recommend
serene scaffold
what is that
misty flint
streamlit and plotly? libraries
serene scaffold
what does the figure represent
serene scaffold
what is minitorch? pytorch but smaller?
misty flint
minitorch = "do you want to build your own ML library from scratch and make it similar to a baby pytorch? if so, this is for you."

dont do it. its not worth it, unless you are genuinely interested in building something like that from scratch.
i will say this
their documentation over ML concepts are actually pretty good
especially understanding the math and cs concepts behind stuff
 pastel valley
resnet_model = Sequential()

pretrained_model= tf.keras.applications.ResNet50(include_top=False,
                   input_shape=(144,144,3),
                   pooling='max',classes=5,
                   weights=None)
for layer in pretrained_model.layers:
        layer.trainable=False

resnet_model.add(pretrained_model)

resnet_model.add(Flatten())

resnet_model.add(Dense(256, activation='relu'))
resnet_model.add(Dense(128, activation='relu'))

resnet_model.add(Dense(5, activation='softmax'))

resnet_model.summary()

resnet_model.compile(optimizer='adam', loss='categorical_crossentropy', metrics=METRICS)
this is how to use resenet50 model architecture right?
i just put it on center and provide my own input and output layers?
if i set weights=none then it will be randomly initialized so its like i just used the architecture and teaching it from scratch?
but if i set the weights=imagenet then all what i learned from imagenet will remain so as the features it learns and i can freeze it by setting trainable to false? do i understand it correct?
also what this mean?
do i need to do it on training image or only before prediction?

or same
tacit basin
ornate sky
i did try nothing seems to work unfortunatly
And where you install packages?
Do you have different python versions o your system? You use conda or virtual env? To debug this we need more info.
You can install package from within notebook
%pip install pyPDF2
This will run the pip within the current kernel
 river maple
i've exceeded the usage limit in colab. Is there a way to uplift the restriction?
tacit basin
river maple
i've exceeded the usage limit in colab. Is there a way to uplift the restriction...
Time usage limit?
There's colab pro paid option with 24hrs session i think. Colab pro plus has better machines on top of that if i remember correctly. They say longer runtimes for pro and even longer runtimes for pro +
river maple
dont got the the money for it unfortunately
tacit basin
river maple
dont got the the money for it unfortunately
You want to run notebook for more than 12 hours?
If you get checkpoint before that time you can save the checkpoint and in new session load the checkpoint and continue training
river maple
for 5-6 hours maybe
tacit basin
river maple
for 5-6 hours maybe
That should be within limits of free colab
river maple
i've been using it for few days now
and it had been working fine
everyday i used it for maybe hours
tacit basin
What does it say? I haven't used it for a while. It used to have limit on session time. Then you could start new session.
river maple
 tacit basin
I see. Looks like they want to sell more pro accounts
You can use Amazon sagemaker studio lab. It's free. Session is 4hrs with GPU
Or paperspace. They also have free GPU. Session limit is 6 hrs. Also sometimes they don't have gpus available. Depends.
river maple
thank you will look into that
the tpu one seems to be working in colab
is it any good?
tacit basin
Yeah it's good, but different than GPU. Need to make sure code you have runs on tpu
Another free option with GPU is kaggle code it's called now
Now
river maple
ahh okay. Thanks for the help
twin hound
hey guys whats the best way to help with overfitting of an SVM model?
what parameters are best to change?
 urban lance
What's more efficient
- Appending 10 lists and putting that in a dataframe once it went through all the data
or - Appending 10 lists in chuncks, making dataframes out of each chunk and concatting them later
(there would be thousands upon thoughsands of tiny dataframes)
 thorn venture
Can anyone tell while appending from multiple csv to excel mode='a' is getting error why?
df_csv.to_excel('mastr.xlsx',mode= 'a', index =False, header=False )
tacit basin
thorn venture
Can anyone tell while appending from multiple csv to excel mode='a' is getting e...
What error you get?
thorn venture
Traceback (most recent call last):
File "D:\Projects\Python to excell automator\Test\test.py", line 12, in <module>
df_csv.to_excel("mastr.xlsx", mode='a',index =False, header=False )
TypeError: NDFrame.to_excel() got an unexpected keyword argument 'mode'
I have 3 csv file , I wanna append the all data in a Excell file
 humble maple
hllo all
tacit basin
thorn venture
Traceback (most recent call last):
File "D:\Projects\Python to excell automato...
there is no argument mode for to_excell method
ExcelWriter can also be used to append to an existing Excel file:
with pd.ExcelWriter('output.xlsx',
                    mode='a') as writer:
    df.to_excel(writer, sheet_name='Sheet_name_3')
Hi 👋
tacit basin
humble maple
can i ask here
sure you can ask here
tacit basin
you can share notebook via google colab or github or something
 arctic wedgeBOT
Here's how to format Python code on Discord:
```py
print('Hello world!')
```
These are backticks, not quotes. Check this out if you can't find the backtick key.
humble maple
man come dm pls
ornate sky
tacit basin
And where you install packages?
Do you have different python versions o your sys...
i'am using python 3.8 , i don't have anaconda and was not using a venv (i was on a virtual machine)
i created a venv and that solved the issue
i kept looking at the problem and it reference issue
tacit basin
ornate sky
i'am using python 3.8 , i don't have anaconda and was not using a venv (i was on...
i think that VM had more than one python version and it was installing into the wrong one
ornate sky
exactly ! took me a while to realise it lol
 toxic hollow
Can anyone explain how matrix multiplications works? I can't really wrap my head around it
ornate sky
that's the simplest explanation i can think of

 iron basalt
toxic hollow
Can anyone explain how matrix multiplications works? I can't really wrap my head...
iron basalt
toxic hollow
Can anyone explain how matrix multiplications works? I can't really wrap my head...
What it's doing or how to do it?
ornate sky
so A and B are both matrixes (reminder : in the world of linear algebra A x B != B x A )
so you just multiply every element from the a1 vector to his match on the vertical vector representing a column of b
so a1(1) * b1(1) is the first element of C and so on
tacit basin
toxic hollow
Can anyone explain how matrix multiplications works? I can't really wrap my head...
http://matrixmultiplication.xyz/
this is nice visual explanation
An interactive matrix multiplication calculator for educational purposes
ornate sky
iron basalt
What it's doing or how to do it?
it's used in a LOT of areas ... most important ones i can think of are rotation , solving linear equations (including systems using Gauss's lemma) , graphs etc etc
toxic hollow
ornate sky
that's the simplest explanation i can think of
How about ones witrh unequal sides?
toxic hollow
iron basalt
What it's doing or how to do it?
alot of areas iirc
toxic hollow
tacit basin
http://matrixmultiplication.xyz/
this is nice visual explanation
hold on let me check for a bit
ornate sky
you mean inequel dimension ?
toxic hollow
ornate sky
you mean inequel dimension ?
mhm
iron basalt
ornate sky
it's used in a LOT of areas ... most important ones i can think of are rotation ...
Yes I know I was trying to answer the question.
ornate sky
iron basalt
Yes I know I was trying to answer the question.
sorry,my bad.
toxic hollow
ohhh
Yeah, how it works. Studied numpy and pandas some time ago and wanted to fix some knowledge gaps
iron basalt
toxic hollow
Yeah, how it works. Studied numpy and pandas some time ago and wanted to fix som...

AxB contains the dot product between each row and column.
toxic hollow
tacit basin
http://matrixmultiplication.xyz/
this is nice visual explanation
O hell yeah this is nice
toxic hollow
iron basalt
yeah I get it now, it pops :p
 lapis sequoia
i am bit fed up in tf.
i have created a function.
@tf.function
def get_energy(basis, vector):
  return tf.norm(tf.matmul(basis, tf.transpose(vector)))

basis = tf.convert_to_tensor(random.rand(4, 8))
vector = tf.convert_to_tensor(random.rand(1, 8))
get_energy(basis, vector)
Now this works, perfectly.
but i need to use it in my model. hence i need to make it supportive for batch size.
currently it gives me error

which is expected. so what i want to do is, it does this operation for each batch, somehow by vectorization.
i do know i need to mess up with axis here, but i am bit fucked.
lapis sequoia
oh i resolved it with einsum, JESUS, THINGS CAN BE SO SIMPLE!!
tf.print(tf.norm(tf.einsum('nm,bpm->bnp', basis, vector), axis=1))

 robust granite
Is there any valid certification I can do to make a switch in data science field?
I am working as a security analyst. I don't want to continue in this domain. So i am thinking of making a switch
arctic crown
please help in ml lets say i make a tensor with a bunch of number what do i do with those numbers and what are the numbers?
 shrewd saddle
If I know that my training dataset is not totally correct, what should I do while making a machine learning model? For context, I am working with labeled land cover data, but the labels are not 100% accurate. Around 15% of the pixels are misclassified.
I am trying both a random forest and neural networks
desert oar
twin hound
Just using the built in .score function from sklearn
as i suspected. this will train the model on the entire dataset and compute the score on the same dataset. this will generally (and sometimes severely) overestimate your model's performance
desert oar
robust granite
Is there any valid certification I can do to make a switch in data science field...
currently the industry doesn't value certifications very highly, because data scientists tend to operate in small teams and are expected to be very "independent" high-productivity contributors. we are 5-10 years away at the earliest from organizations generally being able to absorb "juniors" with only certification-level experience. while a certification is better than nothing, you should set your expectations accordingly that the certificate itself is worth less than your time spent studying and getting hands-on practice
there are also a lot of bad certification programs and boot camps out there, so i think people tend to view them with a certain amount of skepticism
i recommend choosing a program very carefully; feel free to solicit feedback here if you aren't sure about a program
also try to get funding from your employer if you can
data science is also a huge field, and how much you need to do in order to transition depends a lot on your background
 grave frost
please help in ml lets say i make a tensor with a bunch of number what do i do with those numbers and what are the numbers?
least confused DL researcher
robust granite
desert oar
also try to get funding from your employer if you can
my org does give me funding. They are ready to fund cloud exams.
desert oar
you might be more successful using machine learning engineering or data engineering as an intermediate step; in those roles, you won't have a high burden to design and carry out your own research work, but you will be exposed directly to that work and you will have lots of time to shore up your math and stats foundations while also making good money and establishing yourself in a data-adjacent field
also frankly there is more money in data/ml engineering right now than data science, more jobs, and more demand
robust granite
I am just confused about the things i shall do to get in the eyes of recruiters.
desert oar
arctic crown
please help in ml lets say i make a tensor with a bunch of number what do i do w...
are you asking about a "tensor" in the tensorflow/pytorch sense, or in the mathematical sense?
desert oar
robust granite
I am just confused about the things i shall do to get in the eyes of recruiters.
in my experience, in the data field recruiters will come to you on linkedin if you have a profile that hits good keywords
otherwise, the best thing you can do imo is be solid. choose one sub-field and get good at it, be confident in it. that way you are at least "good for something" when you are being evaluated. also the fact that you are already an engineer is a big plus, since it means they can trust your programming skills
hopefully whatever course/certification you choose has some kind of hiring connections
that's how i got my first real data job, it was advertised in a job board for my masters program
arctic crown
desert oar
are you asking about a "tensor" in the tensorflow/pytorch sense, or in the mathe...
tensorflow/pytorch
desert oar
arctic crown
tensorflow/pytorch
it's the same as a numpy array. the only difference is that the ml framework can track the operations that you apply to the array in order to compute gradients
arctic crown
also @desert oar what libary do you recomend if you are new to ml like tensorflow/pytorch/keras
desert oar
the framework can also transfer memory between memory and gpu, stuff like that
i'd go with pytorch
the tf/keras ecosystem seems kind of chaotic and fragmented
arctic crown
or we also have sklearn
desert oar
i'm only beginner-level with both, but i much prefer pytorch so far
scikit-learn is a totally different tool
scikit-learn wraps a large number of off-the-shelf algorithms in a consistent interface. tf/pytorch is a lower-level framework that lets you build and optimize differentiable computation graphs, with higher-level conveniences specifically for building neural networks
there isn't much overlap in terms of the types of models that they cover
neat anvil
So maybe this belongs in #pedagogy , but what motivates you to recommend deep-learning libraries like pytorch for beginners @desert oar ? I've been working in the field for a few years, and have a lot of relevant education, and I feel like I'm just barely understanding how to actually use these tools. Sure anyone can make a simple model run in those libraries with some hours of work, but actually understanding what to do with that? How to intrepret the results? Feels like throwing someone into the deep end. Even fully grokking linear regressions requires at least undergraduate level maths knowledge (at least in the US. advanced high-school level for much of the rest of the world...)
desert oar
neat anvil
So maybe this belongs in <#934931964509691966> , but what motivates you to recom...
because they asked me which one to use 🙂 i don't think beginners should start with any of them
arctic crown
desert oar
i'd go with pytorch
do you have a tutorial i can look at?
desert oar
arctic crown
do you have a tutorial i can look at?
the pytorch documentation has a decent tutorial. but i warn that you probably will want to learn the underlying math a bit first
or take a full course like fast.ai
i haven't taken the fast.ai course, but i've gone through the material and it looks good
serene scaffold
arctic crown
please help in ml lets say i make a tensor with a bunch of number what do i do w...
if you make a tensor with a bunch of arbitrary numbers, then it's meaningless. when you're doing actual ML, the values in the tensors that you create are not random. usually each row represents a training instance and each column represents a piece of information you have about that instance.
but you should probably start with ML techniques that don't involve tensors in any way.
thorn venture
tacit basin
there is no argument `mode` for to_excell method
ExcelWriter can also be used to...
Thanks man 🙂
arctic crown
serene scaffold
but you should probably start with ML techniques that don't involve tensors in a...
yes but arent tensors the base of ml?
serene scaffold
arctic crown
yes but arent tensors the base of ml?
they are for deep learning, not for all machine learning.
arctic crown
but every ml tutorial i look at it tells me that i have to learn tensors
serene scaffold
what is your google search when you look for ml tutorials?
because if it has "pytorch" or "tensorflow" in the query, then yes
but there's plenty of algorithms that don't have tensors
arctic crown
serene scaffold
because if it has "pytorch" or "tensorflow" in the query, then yes
yes
serene scaffold
arctic crown
yes
those are the two libraries for deep learning, so you're not seeing all the ML content that isn't deep learning.
serene scaffold
try reading about k nearest neighbors
arctic crown
serene scaffold
try reading about k nearest neighbors
could you suggest all the algorithms i should learn in order please
desert oar
arctic crown
i need a ml tutorial
i think you need a book or a course, not a tutorial 🙂
most machine learning "tutorials" for beginners are just teaching you how to copy and paste things that you don't understand
not a good way to learn imo
desert oar
not really, tbh
learning out of a book without support is hard though
since you are clearly interested in deep learning, maybe fast.ai is a good course for you
arctic crown
i learn more from videos
desert oar
videos are probably the worst way to learn imo
arctic crown
yea i mean everyone learns in their own ways
desert oar
videos (much like in-person lectures) are great in conjunction with a book and homework assignments / exercises
again, fast.ai is great because they have free video lectures
but there are also exercises and assignments
 velvet heron
Not all videos are bad, but just watching someone code isn't gonna learn you how to code. You could watch a small project video and follow allong tho.
desert oar
just watching the lectures alone is a good start, but you have to get your hands on doing assignments
arctic crown
desert oar
just watching the lectures alone is a good start, but you _have_ to get your han...
yea i understand that
how about this i go watch a tutorial on k nearest neighbors and then you guys give me a assignment and i code it and send it back 🤷♂️
 unborn geode
Hi, I made a OpenCV project that's detect your full body and I want to make it know the move (dance) I'm trying to make can anyone help me?
arctic crown
@serene scaffold can i dm you please
serene scaffold
arctic crown
<@!253696366952316929> can i dm you please
No
arctic crown
serene scaffold
No
👍
 haughty ibex
any experienced panda users in here just need some quick help
serene scaffold
haughty ibex
any experienced panda users in here just need some quick help
try asking your actual question, not if someone knows about a topic.
you've set a threshold that someone has to be "experienced" with pandas, but the best way to know what experience is required to answer the question is to see the question.
haughty ibex
`list1 = ["value1", "value2", "value3"]
list2 = ["value1", "value2", "value3"]
list3 = ["value1", "value2", "value3"]
df = pd.read_csv('/Users/user/Desktop/random_file_name.csv')
df['column with label names'] = df['data'].apply(lambda x: "Name of Label i want to use"
if x in list1 else "Name of next label i want to use"
if x in list2 else "")`
Ok so i have several list with values in them and my dataframe from a csv file. Im searching through one of the columns for values that match any values in my list and assigning it a label name depending on which list it is in. Ive managed to get what i needed done using the .apply() and lambda function. i was thinking that maybe there is a better way.
serene scaffold
haughty ibex
`list1 = ["value1", "value2", "value3"]
list2 = ["value1", "value2", "value3"]
l...
looks like you're doing the same thing as replace
!docs pandas.Series.replace
arctic wedgeBOT
Series.replace(to_replace=None, value=NoDefault.no_default, inplace=False, limit=None, regex=False, method=NoDefault.no_default)```
Replace values given in to\_replace with value.
Values of the Series are replaced with other values dynamically.
This differs from updating with `.loc` or `.iloc`, which require you to specify a location to update with some value. agile cobalt
boolean masks + pandas.Series.isin() might also work, if your lists are large and do not fit in a regex pattern
desert oar
haughty ibex
Ok so i have several list with values in them and my dataframe from a csv file. ...
personally i would write a separate def function for this. but otherwise there's nothing wrong with doing it this ay
also if you have a really big dataset, using set instead of list will make the lookups faster
set1 = {"value1", "value2", "value3"}
set2 = {"value1", "value2", "value3"}
set3 = {"value1", "value2", "value3"}

df = pd.read_csv('/Users/user/Desktop/random_file_name.csv')

def process_label(value):
    if value in set1:
        return "Label 1"
    if value in set2:
        return "Label 2"
    if value in set3:
        return "Label 3"
    return None

df['labels'] = df['raw_values'].apply(process_label)
nothing wrong with using apply?!
desert oar
of course not
although personally i use .map for the na_action='ignore' option
set1 = {"value1", "value2", "value3"}
set2 = {"value1", "value2", "value3"}
set3 = {"value1", "value2", "value3"}

df = pd.read_csv('/Users/user/Desktop/random_file_name.csv')

def process_label(value):
    if value in set1:
        return "Label 1"
    if value in set2:
        return "Label 2"
    if value in set3:
        return "Label 3"
    return "Unknown"

df['labels'] = df['raw_values'].map(process_label, na_action='ignore')
and you could of course turn this into a Categorical too, which can be convenient for some cases
the non-apply version would be what you said, with some kind of subsetting or even possibly chaining masks calls... but why bother
agile cobalt
I might be exaggerating it, but compare apply() with this and let me know the speed difference```py
set1 = {"value1", "value2", "value3"}
set1_val = "Label 1"
set2 = {"value1", "value2", "value3"}
set2_val = "Label 2"
set3 = {"value1", "value2", "value3"}
set3_val = "Label 3"
df = pd.read_csv('/Users/user/Desktop/random_file_name.csv')
df['labels'] = "Unknown"
df.loc[df["raw_values"].isin(set_1), "labels"] = set1_val
df.loc[df["raw_values"].isin(set_2), "labels"] = set2_val
df.loc[df["raw_values"].isin(set_3), "labels"] = set3_val
yep i was about to post something like that
my instinct is that your version will be slower on really big datasets because it makes more passes over the data
but you'd have to benchmark it
both techniques are valid
agile cobalt
the other option might be something like py values = { set_item: set_value for _set, set_value in zip([set1, set2, set3], [set1_val, set2_val, set3_val]) for set_item in _set } df["labels"] = df["raw_values"].map(values) which should hopefully still be faster than an actual function, but idk how well optimised pandas.Series.map is for dictionaries
desert oar
label_data = [
  ("Label 1", {"value11", "value12", "value13"}),
  ("Label 2", {"value21", "value22", "value23"}),
  ("Label 3", {"value31", "value32", "valuee3"}),
]

df = pd.read_csv('/Users/user/Desktop/random_file_name.csv')

df["label"] = "Unknown"
for label, value_set in label_data:
    df.loc[df["raw_value"].isin(value_set), "label"] = label
i wouldn't be surprised if this was actually the fastest option
agile cobalt
yeah
desert oar
label_data = [
    ("Label 1", {"value11", "value12", "value13"}),
    ("Label 2", {"value21", "value22", "value23"}),
    ("Label 3", {"value31", "value32", "valuee3"}),
]

df["label"] = df["raw_value"].map({
    value: label
    for label, value_set in label_data
    for value in value_set
})
looks pretty tidy
great idea @agile cobalt
misty flint

agile cobalt
hmm, I trying peeking a bit on the source code to see how pandas handles dictionaries in map()
it looks like they return it into a series, use the (not so esoteric) index.get_indexer(), then use some take_nd() to take it in a bit more efficient way
haughty ibex
@agile cobalt ok i tried your method it seems faster and its doing what i want and looks cleaner than my long lambda function that had a lot of if/else in it lol
agile cobalt
desert oar
```python
label_data = [
("Label 1", {"value11", "value12", "value13"}),
...
you probably should use that one btw
 sterile rivet
Trying to remove this outlier but I forgot the code and im getting errors, could anyone assist me with this?

 heavy crow
You could look at the standard deviation and remove anything greater than maybe 3x the std
Numpy has functions for this. I think it's just np.std
 wooden forge
I there, I'm currently trying to use a slider on a polar plot in Matplotlib, but whenever the value increases, the plot is truncated, so is there a way to from the begining change the "zoom" of the plot so I can see all the values even if the slider moves?
 tidal bough
What is the slider controlling?
wooden forge
just a simple parameter
I'm ploting the Henyey-Greenstein Phase Function, and g is a parameter I want to control
tidal bough
oh, I see, so it changes the points, and you want the range to autoadjust when that happens?
wooden forge
pretty much
initial value

slightly changing the value and already out of the plot
 tidal bough
wooden forge
initial value
tidal bough
wooden forge
initial value
I think you need to call Axes.autoscale() after each update:
https://matplotlib.org/stable/api/_as_gen/matplotlib.axes.Axes.autoscale.html#matplotlib.axes.Axes.autoscale
which can be done in an update function (binding it like freq_slider.on_changed(update), as the slider tutorial does)
wooden forge
def update(val):
    current = s.val
    p.set_ydata(hg(current,r))
    fig.canvas.draw_idle()

s.on_changed(update)```yup that one ?
I use that hihi
tidal bough
yeah, try adding an autoscale call after set_ydata
tidal bough
It's the Axes object, which you can get by calling .gca() on your Figure
 wooden forge
tidal bough
yeah, try adding an `autoscale` call after `set_ydata`
wooden forge
tidal bough
yeah, try adding an `autoscale` call after `set_ydata`
Yes so it resized the slider and not the plot lmao
and if I use ax the name of the ax with the plot, it makes something really weird
tidal bough
wooden forge
Yes so it resized the slider and not the plot lmao
try plt.gcf().gca() then
or, I guess, save the axis of the plot itself in a variable (plot returns it), and autoscale it specifically
wooden forge
tidal bough
try `plt.gcf().gca()` then
same issue
 daring yacht
Hey all, I'm trying to figure out how to get started on a regression type problem and was wondering: anyone here familiar with disc golf?
wooden forge
p, = ax.plot(theta, hg(g0,r))```
I basically have this line so I could use `p` but even that doesn't workax should be the one, if you're plotting on it
it's really strange that weird things happen then, huh
wooden forge
Yeah

that's with ax
okay so
using ax.set_rmax it actually resize the plot
now it just doesn't do it nicely as it then freezes the rmax
desert oar
serene scaffold
chained comprehensions confuse me
the intuition is that they are meant to be read like nested for loops
for label, value_set in label_data for value in value_set is meant to read as:
for label, value_set in label_data:
    for value in value_set:
        ...
 scarlet light
Can someone help me with this ? https://stackoverflow.com/q/71285886/17115121
Stack Overflow
So i have many csv files each one of them has three columns.
latitude
longitude
distance
for example:
car1.csv
lat long total_dist
23.33 73.32. 0
23.45. 73.34. 10
23.64. ...
twin hound
desert oar
as i suspected. this will train the model on the entire dataset and compute the ...
Ok thanks for responding I appreciate it. So what criteria should I be using to measure the performance if score tends to overfit?
tidal bough
wooden forge
now it just doesn't do it nicely as it then freezes the rmax
trying it myself and nothing works for me either 🥴
Got it!
@wooden forge
    ax.relim()
    ax.autoscale_view()
These two. Neither of them does anything alone, but together they work.
as always in matplotlib: you can do anything, but oh boy do you need to suffer for it 😔
wooden forge
lmao
true
so true
OMG
IT WORKS SO WELL

Thank you !!!
Now let's suffer even more and try to animate the slider
and I have no-idea how to do that
tidal bough
hmm, what do you mean? like, change it automatically?
tidal bough
you can probably just do freq_slider.set_val(f) and the like, but it needs to be done from the event loop
so, uhh, I guess you need an Artist? matplotlib animations are a pain
tidal bough
https://stackoverflow.com/questions/46325447/animated-interactive-plot-using-matplotlib
looks like it can be done with a FuncAnimation
tidal bough
oh hey I did it I think
def tick(frame):
    freq_slider.set_val(frame)

ani = anim.FuncAnimation(fig,tick)

plt.show()
This is all I had to add. It repeatedly calls tick, and tick changes the slider.
haughty ibex
@desert oar apply and map are giving me almost the same runtime in case you were curious
tidal bough
Though it never stops. That can be fixed by the right arguments to FuncAnimation probably.
tidal bough
tidal bough
Though it never stops. That can be fixed by the right arguments to `FuncAnimatio...
yeah, passing frames=20 makes it do a cycle of 20 frames
that actually looks quite well for me
 mossy linden
Im basically making a flask webapp using a saved custom keras model. I have 5 outputs for my model but to use decode_predictions I need 1000. I looked online and it says I have to create a custom dictionary which is what i need help with
Here is the error: decode_predictions` expects a batch of predictions (i.e. a 2D array of shape (samples, 1000)). Found array with shape: (1, 5)
wooden forge
the only issue is that now the animation overtake the slider boundaries
and continue beyond, it doesn't go back
tidal bough
did you set the frame limit? it loops for me when I do
wooden forge
I don't really understand where do I put the frame argument
tidal bough
ani = anim.FuncAnimation(fig,tick, frames=20)
tidal bough
you can change .set_val(frame) to something that carefully steps from start to end of the slider
wooden forge
p, = ax.plot(theta, hg(g0,r))

ax_slide = plt.axes([0.2,0.15,0.65,0.03])
s = Slider(ax_slide, 'Value of g', valmin=-0.5, valmax=0.5, valinit=g0, valstep=0.0001)

def tick(frame):
    s.set_val(frame)

def update(val):
    current = s.val
    p.set_ydata(hg(current,r))
    ax.relim()
    ax.autoscale_view()
    fig.canvas.draw_idle()

s.on_changed(update)

ani = anim.FuncAnimation(fig,tick, frames=20, interval=100)
plt.show()```frames_total = 20
def tick(frame):
freq_slider.set_val(np.interp(frame, [0,frames_total-1],[freq_slider.valmin, freq_slider.valmax]))
ani = anim.FuncAnimation(fig,tick, frames=frames_total)
This works for me, say
wooden forge
I don't think I have negative frames that's why it doesn't start from the beginning
I could do something like
def tick(frame):
    frame = frame - 0.5
s.set_val(frame) ```if you want to linearly move it from start to finish, use linear interpolation like in my last snippet
wooden forge
tidal bough
```py
frames_total = 20
def tick(frame):
freq_slider.set_val(np.interp(frame...
Ho I didn't see the code
My bad
I only saw the video
tidal bough
np.interp(frame, [0,frames_total-1],[freq_slider.valmin, freq_slider.valmax]) is basically making a linear function that passes through points (0,freq_slider.valmin) and (frames_total-1,freq_slider.valmax). So it is at the slider's start on 0th frame, at the end at last frame
urban prism
Any ideas why my segmentation masks have grids? This happened after resizing them
resized_samples=[]
resized_pred=[]
resized_orig=[]
for indx, (pred,sampl,orig) in enumerate(zip(predictions,samples,original_mask)):
    pred=tf.image.resize(
        images=pred,
        size=[size[indx][:2][0],size[indx][:2][1]],
        method=tf.image.ResizeMethod.BICUBIC)
    sampl=tf.image.resize(
        images=sampl,
        size=[size[indx][:2][0],size[indx][:2][1]],
        method=tf.image.ResizeMethod.BICUBIC)
    real_mask=tf.image.resize(
        images=orig,
        size=[size[indx][:2][0],size[indx][:2][1]],
        method=tf.image.ResizeMethod.BICUBIC)
    print(pred.shape,sampl.shape,real_mask.shape)
    resized_samples.append(sampl.numpy().astype("uint8"))
    resized_pred.append(pred.numpy().astype("uint8"))
    resized_orig.append(real_mask.numpy().astype("uint8"))

Non-resized ones don't have those grids
 urban prism
@wooden forge Sorry for interrupting 😅
wooden forge
thanks for your time reptile
wooden forge
urban prism
<@!392016884473659393> Sorry for interrupting 😅
no worries
 thin palm
What's up Python gang: I used a feature scaling AFTER I do a hold out method and apply the scaling to our X_train and y_train, then after we will apply same feature scaling to our X_test. SO my question is:
1.) one of our dataframe columns "date" is an int64 ex: 2021,2020,etc. If I'm doing a pipeline, is it the same thing if I scale BEFORE? I'm just afraid of the dates being scaled incorrectly.
scarlet light
@tidal bough Can u pls help me https://stackoverflow.com/q/71285886/17115121
Stack Overflow
So i have many csv files each one of them has three columns.
latitude
longitude
distance
for example:
car1.csv
lat long total_dist
23.33 73.32. 0
23.45. 73.34. 10
23.64. ...
thin palm
from sklearn.preprocessing import OneHotEncoder
encoder = OneHotEncoder()
final_ohe = encoder.fit_transform(df.symbol.values.reshape(-1,1)).toarray()
final_dfOneHot = pd.DataFrame(final_ohe, columns=['Stock_'+str(encoder.categories_[0][i]) for i in range(len(encoder.categories_[0]))])
# concat the dataframe of our stock holders (lenders)
final_df = pd.concat([df, final_dfOneHot], axis=1)
# lets drop symbol from our DF
final_df = final_df.drop(columns='symbol')
How would I put this into a pipeline?
desert oar
@thin palm you'd want to refactor it to use ColumnTransformer and/or FunctionTransformer
also .values is deprecated, you should use .to_numpy() instead
i assume you are going to use final_df as the input to some model?
thin palm
desert oar
also `.values` is deprecated, you should use `.to_numpy()` instead
so here's what I'm thinking,
categorical_transformer = OneHotEncoder()

preprocessor = ColumnTransformer(
    transformers=[
        ("cat", categorical_transformer, categorical_features)
    ]
)```

does that earlier code go in this line ```("cat", categorical_transformer, categorical_features) ```?your code snippet looks correct. i'm not sure what you are asking about "that earlier code"
thin palm
final_dfOneHot = pd.DataFrame(final_ohe, columns=['Stock_'+str(encoder.categories_[0][i]) for i in range(len(encoder.categories_[0]))])
# concat the dataframe of our stock holders (lenders)
final_df = pd.concat([df, final_dfOneHot], axis=1)
# lets drop symbol from our DF
final_df = final_df.drop(columns='symbol')```this is earlier code
because I need that OHE to be specifally 1 or 0 for each symbol
but not sure how to add this under the columnTransformer
desert oar
fortunately that's what OneHotEncoder does already
thin palm
hmm let me explain it a bit more
without the ```final_ohe = encoder.fit_transform(df.symbol.values.reshape(-1,1)).toarray()
final_dfOneHot = pd.DataFrame(final_ohe, columns=['Stock_'+str(encoder.categories_[0][i]) for i in range(len(encoder.categories_[0]))])
concat the dataframe of our stock holders (lenders)
final_df = pd.concat([df, final_dfOneHot], axis=1)
lets drop symbol from our DF
final_df = final_df.drop(columns='symbol')```
thin palm
desert oar
fortunately that's what OneHotEncoder does already
then we only produce ONE column with just 1 or 0, even though there's 33 different 'symbols'
so I want 33 extra columns
only works that way if I do the above
Does that make senese?
desert oar
no sorry, i don't understand
thin palm
may I send you a screen shot ?
desert oar
you have df['symbols'] which contains 33 different values
thin palm
yes
desert oar
so what is the rule for converting this to a single column of 1 and 0?
thin palm
for example:
AAPL
INTL
BTC
desert oar
or do you want 33 separate columns? if so, that is literally what OneHotEncoder does
thin palm
when I print out a OHE it doesnt make me extra columns showing
AAPLE INTL BTC
1 0 0
thin palm
desert oar
or do you _want_ 33 separate columns? if so, that is literally what OneHotEncode...
when I was doing this I only got one column, weird
So that's why I added all that extra code in the above to get 33 columns
desert oar
the "extra code" just turns the numpy array emitted by OneHotEncoder back into a DataFrame
which is fine, that gives you nice column names
but it shouldn't change the shape of the array
thin palm
desert oar
but it shouldn't change the shape of the array
why when I do OHE it doesn't give me 33 column names?
desert oar
it should still give you 33 columns
thin palm
thats what I thought but watch I'll show you real quick
arctic wedgeBOT
@desert oar :x: Your eval job has completed with return code 1.
001 | Traceback (most recent call last):
002 |   File "<string>", line 1, in <module>
003 | ModuleNotFoundError: No module named 'sklearn'
yeah too bad
thin palm
desert oar
yeah too bad
from sklearn.preprocessing import OneHotEncoder
testing_OHE = OneHotEncoder()
testing_OHE.fit(X[['symbol']])
symbols_encoded = testing_OHE.transform(X[['symbol']])```ok, that looks fine to me. and what's the problem?
symbols_encoded should be an array of shape (X.shape[0], 33)
thin palm
okay so now I need to replace my regular 'symbols' with the newly OHE
X['symbols'] = symbols_encoded
but error is produced ```TypeError: sparse matrix length is ambiguous; use getnnz() or shape[0]
how? you are asking how to replace one column with 33 columns
that just doesn't make sense
thin palm
desert oar
how? you are asking how to replace one column with 33 columns
yesssss
but why?
if there's 33 unique values
why would we put it in 1 column?
desert oar
i'm asking you that question!
X['symbols'] = symbols_encoded what could this possibly achieve?
thin palm
desert oar
`X['symbols'] = symbols_encoded` what could this possibly achieve?
ahh I see
You're right
desert oar
symbols_encoded is a 2d array of 33 columns, why would you expect that to work?
thin palm
desert oar
`symbols_encoded` is a 2d array of 33 columns, why would you expect that to work...
you're correct on this.
I meant how do I take this OHE and add it to my dataframe, does that question make sense?
desert oar
yeah, but you already had code for that
thin palm
desert oar
yeah, but you already had code for that
omg
thin palm
desert oar
yeah, but you already had code for that
man how do I add that to a columntransformer
that's my orignal question lol
but you clarafied a lot of things, thank you for that.
I hope I didn't confuse you too much mate
desert oar
hm... you simply wouldn't use a pipeline to modify the original dataframe
i guess you could, but normally you wouldn't
thin palm
desert oar
hm... you simply wouldn't use a pipeline to modify the original dataframe
I'm confusing myself so much now hahah
desert oar
you wrote this code too, which looks fine:
categorical_features = ["symbol"]
categorical_transformer = OneHotEncoder()

preprocessor = ColumnTransformer(
    transformers=[
        ("cat", categorical_transformer, categorical_features)
    ]
)
this preprocessor will take your dataframe as input, and return the array of one-hot-encoded symbols
you can then put that preprocessor into a Pipeline as normal
thin palm
Hmmmm
so this will return the one hot encoded symbols gotcha, then I need to append this back into our dataframe
desert oar
that's what i'm saying is a weird thing to do
thin palm
then we're in a pickle here
thin palm
Because I'm working on creating a class that will use a pipeline
desert oar
if your model for some reason needs to use both the original and one-hot-encoded values, you can do that with ColumnTransformer
thin palm
since I was advised a pipeline would be easier
desert oar
pipelines are good for building pipelines that need to be "fitted" in train/test fashion. but using them for general-purpose data processing is unnecessary complexity & layers of indirection
if you just want to get dummy variables, don't bother with the pipeline
or heck don't even bother with scikit-learn, just use pandas.get_dummies
!d pandas.get_dummies
thin palm
I have an issue with dummy variables
arctic wedgeBOT
pandas.get_dummies(data, prefix=None, prefix_sep='_', dummy_na=False, columns=None, sparse=False, drop_first=False, dtype=None)```
Convert categorical variable into dummy/indicator variables."dummy variable encoding" is just what statisticians call "one-hot encoding"
desert oar
thin palm
I have an issue with dummy variables
what is the issue?
thin palm
desert oar
what is the issue?
I'm confusing my self even more now.. thanks for the help though mate going to try by doing real quick
lapis sequoia
Dataframe
minor elbow
lisa needs braces
serene scaffold
minor elbow
lisa needs braces
lists need braces? we usually call [] square brackets
ornate sky
Hey quick question
so i have a pdf file that includes images
these images contain php code , my goal is to extract that code
does anyone know how to extract the code from images all in one
(extracted the images using pyPDF now am kinda stuck extracting the actual code )
neat anvil
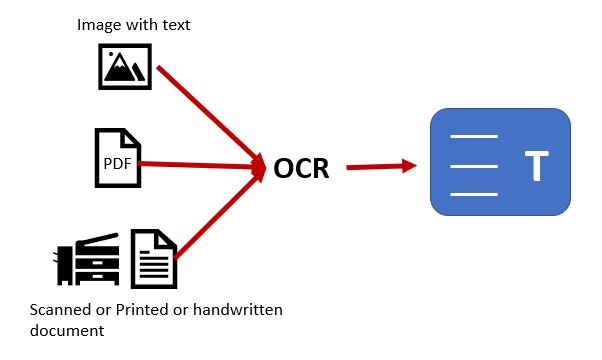
@ornate sky what you're looking for to solve your problem is a free Optical Character Recognition tool. There are quite a few options in python - I've never used any of them myself so cannot comment on which one I'd recommend, but here's a good blog reviewing some of the well-known options. https://basilchackomathew.medium.com/best-ocr-tools-in-python-4f16a9b6b116
Medium
In this article, you will learn about Optical Character Recognition(OCR).
ornate sky
thank you raymon , reddington (if you watched the blacklist lol)
 maiden quiver
Hopefully this is the right channel. If not, I'll gladly remove it and post it somewhere else...
I wanted to share my new open source project RasgoQL which me and my team built to make data transformations easier and less of a headache. Introducing RasgoQL - 100% open and fully customizable data/feature transformations in Python that executes directly in data warehouse as SQL. The best part? In one line of code, you can export your new pandas dataframe/dataset to a DBT or native SQL. Take a look and ⭐️ it on Github if you like it: https://github.com/rasgointelligence/RasgoQL

GitHub
Write python locally, execute SQL in your database - GitHub - rasgointelligence/RasgoQL: Write python locally, execute SQL in your database
digital folio
Hi All,
import pandas as pd
import numpy as np
import glob
import os

path = '/content/files/'
extension = 'csv'
os.chdir(path)
df = []
all_filenames = [i for i in glob.glob('*.{}'.format(extension))]

all_filenames
['18122013.csv',
 '13012014.csv',
 '10012014.csv',
 '04012014.csv',
 '28122013.csv',
 '15122013.csv',
 '16122013.csv',
 '08012014.csv',
 '02012014.csv',
 '31122013.csv',
 '09012014.csv',
 '03012014.csv',
 '21122013.csv',
 '05012014.csv',
 '26122013.csv',
 '27122013.csv',
 '23122013.csv',
 '20122013.csv',
 '06012014.csv',
 '22122013.csv',
 '17122013.csv',
 '11012014.csv',
 '13122013.csv',
 '01012014.csv',
 '19122013.csv',
 '24122013.csv',
 '25122013.csv',
 '14122013.csv',
 '07012014.csv',
 '12012014.csv',
 '30122013.csv',
 '29122013.csv']
Problem = I want to Union all the data however, first 4 rows have random dirty data
This is the type of data my all files have

How should I clean it, iloc[3:] is not working
anyone?
serene scaffold
digital folio
This is the type of data my all files have
if you open them as a dataframe, you might need to specify that the delimiter is ;
 stone sorrel
is anyone familiar with the model statsmodels.formula.api and the probit model?
neat anvil
digital folio
Hi All,
```py
import pandas as pd
import numpy as np
import glob
import os
...
!d pandas.read_csv
arctic wedgeBOT
pandas.read_csv(filepath_or_buffer, sep=NoDefault.no_default, delimiter=None, header='infer', names=NoDefault.no_default, index_col=None, usecols=None, squeeze=None, ...)```
Read a comma-separated values (csv) file into DataFrame.

Also supports optionally iterating or breaking of the file into chunks.

Additional help can be found in the online docs for [IO Tools](https://pandas.pydata.org/pandas-docs/stable/user_guide/io.html).See all the arguments, particularly skiprows
 strange zealot
i am working on kaggle titanic dataset i feel like people with same last names should have higher probability of surviving my question is how do i check this hypothesis out.
how would i make the graphs and if i do find a correlation how to incorporate it into my model
twin hound
can someone please help me with my overfitting problem, I can send the code when someone responds.
upper spindle
when i run this whole code in my lab, its all fine until when i get to the LSTM models where i visualize the prediction from the model and the actual data: https://github.com/chibui191/bitcoin_volatility_forecasting/blob/main/Notebooks/Reports/report_notebook.ipynb

GitHub
GARCH and Multivariate LSTM forecasting models for Bitcoin realized volatility with potential applications in crypto options trading, hedging, portfolio management, and risk management - bitcoin_vo...
could anyone be of any help please, unless i am being stupid
the function in that doc which is causing me issues is called viz_model(y_true, y_pred, model_name)
twin hound
can someone please help me with my overfitting problem, I can send the code when someone responds.
serene scaffold
twin hound
can someone please help me with my overfitting problem, I can send the code when...
you should post a minimal code example when you ask, so that people know what they'd be getting into by trying to answer.
twin hound
scaler = StandardScaler()
scaler.fit(X_train)
X_train = scaler.transform(X_train)
X_test = scaler.transform(X_test)

# SVM model with parameters adjusted for maximum optimization

svm_model = SVC(max_iter = 5000,kernel='rbf',C=50,gamma = 1, )
svm_model.fit(X_train, y_train)
prediction = svm_model.predict(X_test)

# Use the score metric for evaluation of the model accuracy

score_train = svm_model.score(X_train,y_train)
score_test = svm_model.score(X_test,y_test)

print(score_train)
print(score_test)

# Perform k-fold cross validation to optimize the model and reduce bias/variance
# Number of folds

k = 10
kf = StratifiedKFold(n_splits=k, shuffle = True, random_state = None)

# K-fold cross validation on the training/validation set
k_score_train = cross_val_score(svm_model,X_train,y_train,cv = k)

# K-fold cross validation on the testing set
k_score_test = cross_val_score(svm_model,X_test,y_test,cv = k)

mean_accuracy_train = np.average(k_score_train)
mean_accuracy_test = np.average(k_score_test)

print(mean_accuracy_train)
print(mean_accuracy_test)
my training data is size [756,8] with 8 x inputs. my output data has 1 output with 5 categories [0,1,2,3,4]
my test set is already premade from test data so I don't need to use train_test_split
essentially im getting bad overfitting. the training set has a high score but the testing set is very bad and when I use cross_val_score both the training set and testing set become very low scores
I'm essentially asking on how to deal with this overfitting problem
lapis sequoia
Are there any real examples where a random forest beats out some form of gradient boosting?
 safe elk
Lol I have seen Youtube clips and thats about it...
agile cobalt
misty flint
anyone ever used/seen a neural network trained on an analog computer?
let me guess, Veritassium's latest video?
safe elk
agile cobalt
let me guess, Veritassium's latest video?
Yes lol
misty flint
agile cobalt
let me guess, Veritassium's latest video?
my friend thats into hardware baited me into watching the video since he "promised it was about ML"
agile cobalt
it should be more or less the same for the programmer though (specially when using high level languages such as Python), most if not all of the code that deals with the hardware, whenever digital or analog, will be hidden under the carpet
agile cobalt
misty flint
my friend thats into hardware baited me into watching the video since he "promis...
it kinda is though - he even explains how neural networks work (superficially)
misty flint
yeah honestly it was like hardware + ton of ML + end with hardware
but that was cool tho how what were the numbers
25 trillion math operations per sec
wild
and 3 watts of energy..?
would save a LOT of energy
and possibly reduce training times
agile cobalt
yeah
if the number of operations per second is the same, the training time should be more or less the same, though it could be cheaper/easier to expand horizontally - it might depend on whenever the analog noise will hurt the model's performance a lot, or somehow help it a little, as well
I'm nowhere near qualified enough to be making assumptions about any of that though 
neat anvil
another big component of training time that they mention in that clip is shuffling the weights around b/w CPU RAM and GPU RAM
I think they're saying this chip solves that problem somehow?
neat anvil
but in terms of training time by computer power, flops are flops. Same flops, same training time. Less energy usage is just brilliant
misty flint
then we might be able to indirectly try
yeah in the end, less energy is still good even if training time is similar
neat anvil
and the noise may require some issues to overcome - but nvidia has an IEEE proposal out there for tinyfloats with only 6 bits and in the rationale they'd demonstrated training neural networks to near the same accuracy as 64 bit floats
so I'm sure some random error due to the analog processor is no problem at all
misty flint
interesting interesting
agile cobalt
misty flint
part of me is curious if any of the cloud providers might try it
I would be surprised if Google did not try it... well, sooner or later (hopefully soon though)
neat anvil
I can't find the exact proposal I'm remembering, but here's an article about the benefits of using half data types in cuda code, aka 16-bit-floats https://developer.nvidia.com/blog/mixed-precision-programming-cuda-8/

Update, March 25, 2019: The latest Volta and Turing GPUs now incoporate Tensor Cores, which accelerate certain types of FP16 matrix math. This enables faster and easier mixed-precision computation…
agile cobalt
huh, it seems like Google's TPU is / was at some point also 8bit?
neat anvil
misty flint
part of me is curious if any of the cloud providers might try it
oh 100%. A huge portion of datacenter expense is dealing with the waste heat. A chip that uses less watts generates less heat, so its double the savings.
desert oar
it's a shame you can't pipe that heat around somehow to do useful work
im sure they use it for local hvac and stuff at least, but youd think so much heat in one place could be actually put to some good use
passive ice melting in the winter by running heat exchangers under the sidewalk and parking lot?
neat anvil
mm so there's a concept in chemical engineering thermodynamics called Exergy
edit- this statement is only true in a somewhat hand-wavey thermal sense don't @ me thermodynamics bros- it's a unification of "how much heat is there" and "how big of a temperature difference b/w the heat source and the ambient is there"
in terms of using heat to do a thing, More Exergy = More Better
so a datacenter generates a TON of heat, but it's only barely above ambient temperature. So there's not much Exergy. So it's not very useful.
misty flint
thats a bit disappointing
neat anvil
indeed.
desert oar
yeah thats what i figured
youd need to concentrate it all in one place somehow to get enough of a temperature gradient to do anything
neat anvil
which you could do, but it'd cost you energy, and probably more than you get back. Not sure exactly, I'd have to do the math to figure it out, and I don't want to.
desert oar
right, figures
twin hound
hey guys I love the discussion about ML and analog comps but can I please have help : (
I'm a noob and need help
neat anvil
here's a user guide example of different hyperparameter optimization techniques: https://scikit-learn.org/0.21/auto_examples/model_selection/plot_randomized_search.html#sphx-glr-auto-examples-model-selection-plot-randomized-search-py
the sklearn hyperparameter optimization functions automate fitting your model to achieve optimal performance averaged across all the cross-validation K-Folds. The resulting optimal model is much more likely to do well on the test set than the approach you've used.
iron basalt
misty flint
anyone ever used/seen a neural network trained on an analog computer?
Yes.
twin hound
ive tried all of these for the past 2 days. I appreciate the help but I need someone to literally go in a call with me so I can walk through it with an expert and they can just simply tell me what to do
if u have time. I'm literally helpless
ive tried randomized search and grid search but stil nothing
misty flint
iron basalt
Yes.

guys
i knew squiggle would come through
tbh when i asked that question i was like 90% sure of squiggles answer
neat anvil
twin hound
ive tried all of these for the past 2 days. I appreciate the help but I need som...
could you post your code using the RandomizedSearchCV?
twin hound
sure
misty flint
what was your experience squiggle? is noise really a factor?
twin hound
need to implement it again
iron basalt
The real goal for ML hardware design is two things though, memristors (real ones) and reservoir computing using little or no energy at all (the energy comes from the input itself).
The problem is that real neural networks (spiking and all that) do not run well on von Neumann systems.
(matrix multiplication is not the issue)
neat anvil
makes sense in a very satisfying metaphorical way - neural networks were inspired by how the human brain works, and the human brain is not a Von Neumann architecture
 iron basalt
Von Neumann stuff is good for classical style programs, where you want things to basically be guaranteed, things are exact and stable in digital. But to make the kind of massive parallel and fuzzy stuff like neural networks that does not fit well.
Memristors are the holy grail of straight forward implementation of spiking networks that are fast. But currently the ideal memristors has yet to be demonstrated and relatively few people are looking into it (although those that are are making progress).
And "hardware" reservoir computing is still completely open ended. Hardware in quotes because a puddle with some paddles making waves in it can be even be a powerful reservoir computer.
misty flint
iron basalt
Von Neumann stuff is good for classical style programs, where you want things to...
thats funny bc biological systems are essentially innately fuzzy; genes mutate, proteins misfold, signals misfire, etc.; i do like what raymond was saying
iron basalt
(Basically harvesting the free computation happening in physical systems)
misty flint
interesting
iron basalt
(And yes brains are reservoir computers, very big ones that are really good at it, some parts are not, but lots of parts of it are)
misty flint
dang so fascinating. i hope im alive when they make some breakthroughs
iron basalt
(And quantum computers too, but those are interesting for other reasons too)
neat anvil
misty flint
dang so fascinating. i hope im alive when they make some breakthroughs
you're alive right now, people making breakthroughs right now
live the dream
iron basalt
Bringing back analog is a step in the right direction of getting more people into alternative computation models. And it will definitely help ANNs get deployed. I also suspect that it might show up in GPU design in the future since more and more graphics programming (and physics simulation) is making use of ANNs for approximations (not just upscaling, but other stuff).
 prime hearth
hello, im self learning machine learning but would like to please ask for internships or coop , do employers expect that you know lots of machine learning algorithm or is just knowing linear regression, neural networks and one machine learning project good enough?
Like i have an idea of what other ML algorithm do, but i never like implement them from scratch or use them with librarise before only know the theory behind it a bit, but for linear regression and neural network and reccurent + long short term memory i know these very in depth
serene scaffold
prime hearth
hello, im self learning machine learning but would like to please ask for intern...
in my first interview for an ML position, I was asked to explain the difference between precision and recall, and to give an example of an unsupervised learning algorithm.
 zenith bison
https://youtu.be/Wd5bbTs4Zco
Machine Learning Project Fashion Classifier using TensorFlow | Classifier using Neural Network
serene scaffold
@zenith bison is there a particular reason that you've shared this?
@prime hearth AI/ML is a large space, and you'll never learn it all, not even over a career. it will probably depend also on what sorts of projects a given company does.
prime hearth
oh okay thanks, in that case do you think i should learn at least one unsupervised learning algorithm?
serene scaffold
prime hearth
oh okay thanks, in that case do you think i should learn at least one unsupervis...
the interviewer basically just wanted to see if I knew what k-means clustering was
 stone marlin
Your positions are research positions, yeah, Stel? Like, it would'a been a research ML deal?
serene scaffold
stone marlin
Your positions are research positions, yeah, Stel? Like, it would'a been a rese...
I work in the human language AI department for a non-profit that's just about doing research (there are no products other than technical reports); I never had an internship, but I worked for my university as an undergrad, if that's what you're asking.
stone marlin
Oh, I meant for the above interview thing you were talkin' about, I was just skimming through chat.
serene scaffold
stone marlin
Oh, I meant for the above interview thing you were talkin' about, I was just ski...
that was for a company that did business-to-business services that involved language AI. I was rejected.
stone marlin
Bummer, but you dig your thing now so it's all okay. :''] It's wacky how different companies screen for DS/ML people.
I mostly asked because I've never seen "ML" as a job title apart from research-level stuff, but it sounded neat.
serene scaffold
they never told me what they would have paid, but it's incredibly unlikely that it would have been better than my current position.
stone marlin
Haha, I think you perhaps got a better deal doing this than working in B2B. Doing DS in B2B, in my experience, is incredibly boring after the initial model(s) are made. :''']
serene scaffold
why's that?
stone marlin
[My biases: my friends + I work in a large US city, mainly in small-to-mid startups but also larger-scale companies that have "incubator" parts.]
The experience is usually something like: the company gets DS to get the initial models set, those work about 80%, no one touches those and they run pretty much everything in the company.
The rest of the time is spent maintaining those, making reports, or making incremental improvements --- but, because "the model" is usually what is making the money, Business and Marketing is very, very hesitant to do A/B testing on any reasonable scale for iterations on the model.
[Edit: broke up into paragraphs.]
serene scaffold
[Edit: broke up into paragraphs.]
I want the whole commit history 😠
so these companies create models, and once the model is made, the company is just "model as a service"...?
stone marlin
Haha, pls! Haha, moreover, there is rarely anything more than a random forest [or, more likely, xgboost] for models because interpretability is king. This prob wouldn't be the case for NLP things maybe, but the number of times Business has asked, "Okay, but what made the model say this?" is higher than... well, it's really big. haha.
serene scaffold
"Okay, but what made the model say this?"
that's not how you're supposed to play the game
stone marlin
Yes. It's very depressing. Even fairly new startups that are actively dev-ing models will usually have that one "big" model that controls a big part of their stuff.
serene scaffold
this is like me explaining AI to my dad all over again. he thought it was like the "interaction graph" for phone robots, but bigger
stone marlin
For example, in my previous gig (at a travel company which predicted plane-hotel stuff), there was one model made by these two people a few years ago --- and it was just a random forest model, I think --- that was what was sent to all the customers. The other things we did were either trying to make that model more efficient, or slight modifications to tangential things.
Yeah, it's a bummer. But that's applied DS stuff, I feel. For research stuff, the job is completely different, but I've only done that once and I know very few people in that, so I can't speak to it.
serene scaffold
it's an interesting point you bring up. my second year of undergrad, I was offered an """""internship""""" with ripplematch (a company that allegedly uses AI to match job seekers to positions, as if one needs AI for that), and during the interview I asked what their algorithm was, and she said it was a random forest. and then she started talking about it was a marketing internship
and I was like "lulwut?"
so, some algorithm they have if they can't even find people interested in their own positions.
stone marlin
That sounds very similar to my experience. I think it's been the case, at least, for me and my DS-pals here. It's one of those things that scared me a bit away from pure DS, where I was like, "When are they gonna realize they can just hire analysts for like, half the salary...?"
For others reading in the chat, I didn't mean to be so dismal: for all my DS jobs except one, I did a significant amount of modeling --- smaller things, but still modeling --- and I feel that I learned a lot and got to look at a lot of cool tech and techniques.
serene scaffold
none of my immediate coworkers have the title "data scientist", but I know there are other people in the company who do. do you agree that there's a lot of variation in what a "data scientist" does company-to-company?
stone marlin
Yes. There's a ridic amount. From what I've seen, it tends to span from "data analyst" to "data scientist" (proper) to "data engineer", with the middle one being the least utilized.
serene scaffold
what is a data engineer, anyway?
stone marlin
Haha, or a Machine Learning Engineer (which is my new title!), what the heck is that.
serene scaffold
assuming that software {developer, engineer} are synonyms, is "data engineer" basically "AI developer"?
 daring frost
serene scaffold
none of my immediate coworkers have the title "data scientist", but I know there...
daring frost
serene scaffold
none of my immediate coworkers have the title "data scientist", but I know there...
Yes! You ask 5 people to define Data Scientist and you get 6+ responses 😅
stone marlin
I typically see less variability with DE roles: typically, those are roles which facilitate operations for DS/Analysts. So, pret much, setting up stuff in AWS, doing ETL, making data warehouse stuff, etc.
daring frost
My data engineers are more on the "engineering" side of data. ELT Processes, privacy, security, schemas, data modeling, operations, etc
daring frost
stone marlin
I typically see less variability with DE roles: typically, those are roles which...
omg... samesies!
stone marlin
The big difference I see here is between DEs who need to know AWS/GCP/Azure very well (the devops side) and those that don't need to know it.
serene scaffold
AWS makes me sad 
stone marlin
Haha, yes, I think data engineer is a fairly well-defined role for most things.
serene scaffold
I can never figure out what's happening, and I've owed them 16 cents for several years 
they email me about it every few days
stone marlin
Oh no, AWS is great. I mean, they're all pretty good, but learning AWS / GCP / Azure concepts was one of the best career moves I've ever done.
It's the reason I got into what I'm in now. But I'm also big into the devops stuff, so that's prob why.
daring frost
Yeah, having the "operations" skills is huge right now. Making models are cool, but productionalizing them is way cooler
stone marlin
If y'all get a chance, definitely consider taking something like Cloud Guru's Cloud Practitioner course for AWS. All the cloud services are "pret much" the same deals modulo names and offerings, but that'll give a great bird's-eye view of the landscape and what is do-able.
serene scaffold
hmm, why did you say productionalizing and not productionizing?
daring frost
cuz English is hard? idk, I was just typing 🤷🏾♂️
serene scaffold
okay 😄
stone marlin
Haha, I'm finding this is very much the case, snoman. I'm even seeing a bunch of DS jobs with devops or light devops requirements.
"Knowledge of AWS. Knowledge of Redshift Best Practices. Knowledge of Docker / K8s." A few years ago, I'd think that was wild that they expected any DS to know that, but it seems maybe to be becoming the norm.
daring frost
imagine this: a full stack Data Scientist 😁
stone marlin
Haha, I think that's what they're going for! Unfortunately!
stone marlin
The jobs I was applying to before I got my current gig were pret much "full-stack ds" nonsense things. But I liked that, so I went for them. Eventually, I got "Machine Learning Engineer", but it was noted that I would also be helping out DS doing modeling. Haha, so like, pls be calm, jobs.
misty flint
i think for me i might be interested in the Product side of things after giving DS a shot
daring frost
When I started at my current place, I had to build the engineering org from the ground up. I'll admit that I was one of those hiring managers... I thought that I could find data scientists with some operations/cloud experience
misty flint
my current DS internship is pretty cool tho, doing NLP
stone marlin
The product and marketing side of things is very interesting, and I wish it got more love from people learning DS. It's easy to build a model for something (most of the time), but thinking of how to sell it, market it, or have anyone use it is a very, very different skill.
misty flint
for sure
stone marlin
I don't think it's unreasonable to look for senior people who have the "full-stack" experience, Sno. I'm more worried about if it starts getting passed down to junior levels and we need to start teaching people in here kubectl.
serene scaffold
I need to sign off. have a good night, intelligentlemen 
 daring frost
100%! Unfortunately I had some constraints from the CEO - pay being the biggest one

 stone marlin
G'night, thanks for the chat, Stel!
daring frost
I was able to work it all out, but all my DS/AI friends/connections wouldn't join me with the pay we were offering. It was one of those "want seniors, but pay junior salaries" type deals.
stone marlin
Yeah, there were a non-trivial amount of those companies that I applied to recently. :''']
"Senior Data Scientist" who was in charge of modeling, productionizing the model, monitoring, etc. --- for $USD 80k.
In this area, that's starting salary for an entry-level DS.
misty flint
yikes
stone marlin
That was a real one, and prob the worst one, but the other ones were somewhat similar. Haha, that was just the most extreme one. :']
Luckily, I think that sort of lets someone filter out jobs that would be terrible before getting hired on. But unluckily, it wastes a ton of time that could be spent interviewing elsewhere.
misty flint
yeah the term DS might differentiate into dif specialties in the future
and become actual job titles
stone marlin
I agree, Rex, and I think, to an extent, this has started! But it has a long way to go.
misty flint
yeah for sure
stone marlin
This is still true for software, even --- after, you know, what, 40 years?
stone marlin
I don't care what I'm called as long as I'm learning, doin' interesting work, and getting paid fairly. :''']
misty flint
anyway, i think most companies DONT need advanced ML models to solve their problems; theyre not ready yet
its like google's rules of ML, if you can solve it without ML, then you should https://developers.google.com/machine-learning/guides/rules-of-ml

Google Developers
improve X by 0-60% without ML first
for the 60-85% improvement portion, you can usually get away with "simple" models
and higher than that, is when you can pull out the advanced stuff
but you need to lay a foundation for it. its like that data science hierarchy of needs.
misty flint
misty flint
and higher than that, is when you can pull out the advanced stuff
also sometimes the ROI is not worth it. whos going to maintain these models? retrain them when they drift? etc.
misty flint
stone marlin
"Senior Data Scientist" who was in charge of modeling, productionizing the model...
i bet you anything this company is def not data-mature enough for this type of work
safe elk
misty flint
anyway, i think most companies DONT need advanced ML models to solve their probl...
This is true
misty flint
yep yep
unless youre somewhere like stitchfix where you use algorithms from start to finish https://algorithms-tour.stitchfix.com/

How data science is woven into the fabric of Stitch Fix.
they have 100+ DS
and their data engineers apparently build custom tools for their DS
usually just a wrapper around an open source tool just to make it easier to use
safe elk
misty flint
~~usually just a wrapper around an open source tool just to make it easier to us...
Yeah lol
stone marlin
Yeah, I have a friend at stitch --- most of their models are already built, and much is done on iteration or improvement of those. He works on the recommender-engine side so I've only heard about that, but it's a standard deal. I know they do a lot more wild stuff to try to improve recommendations --- genetics, etc.
I think it's also not uncommon to have "custom tools" haha from the DEs. You're right tho, it's almost always a thin wrapper. :'''']
IIRC, they have a really interesting, like --- ETL kind of system, where the data is nicely warehoused for the DS team.
But from what I remember him saying, it's mostly recommender system + genetic algorithm for recommendations, and then supply-demand models for that. I will admit, though, that page is awesome looking.
Yes, you're right tho --- without ML, StitchFix would not have a business model.
misty flint
yeah i only know about some of the stitchfix stuff bc the host of a podcast i listen to worked there for a while
it was more building stuff when she was there but it makes sense that things are mostly built already
scarlet light
Can someone help me with this : https://stackoverflow.com/q/71285886/17115121
Stack Overflow
So i have many csv files each one of them has three columns.
latitude
longitude
distance
for example:
car1.csv
lat long total_dist
23.33 73.32. 0
23.45. 73.34. 10
23.64. ...
 harsh grail
I'm new to Python and was wondering what resources you guys used and would recommend to others like me to learn to code for data science, anything helps!
tacit basin
harsh grail
I'm new to Python and was wondering what resources you guys used and would recom...
I recommend Alen Downey's book https://allendowney.github.io/ElementsOfDataScience/README.html
Elements of Data Science is an introduction to data science for people with no programming experience. My goal is to present a small, powerful subset of Python that allows you to do real work in data science as quickly as possible.
sterile rivet
The maximum accuracy I am getting is 62.5%, but what piece of code am I supposed to run in order to get the value of K where im getting the max accuracy?
How do I plot a line for max accuracy from x axis?
 tacit basin
sterile rivet
https://prnt.sc/X9nUfqykZRs9
The maximum accuracy I am getting is 62.5%, but wh...
tacit basin
sterile rivet
https://prnt.sc/X9nUfqykZRs9
The maximum accuracy I am getting is 62.5%, but wh...
How you make this graph?
If you use interactive mode you should be able to hover and see the value i think.
tacit basin
sterile rivet
https://prnt.sc/X9nUfqykZRs9
The maximum accuracy I am getting is 62.5%, but wh...
If your scores and kvals are lists then you can get index of max score and then use that index on kvals list
idx = scores.index(max(scores))
kvals[idx]
Using Matplotlib on Jupyter notebook.
sterile rivet
tacit basin
If your scores and kvals are lists then you can get index of max score and then ...
Thank you!
tacit basin
sterile rivet
Using Matplotlib on Jupyter notebook.
You can set your plots to be interactive with
%matplotlib notebook
In jupyter Notebook
sterile rivet
tacit basin
You can set your plots to be interactive with
```
%matplotlib notebook
```
In ju...
Oh okay!
urban lance
Hey guys, I need help.
I'm grouping rows of a dataframe within a certain time interval. I want to count all non-nan values within that interval but I'm not sure how to do so.
Any ideas?
df.groupby(["user",pd.Grouper(key="timestamp", freq="W")]).agg({
    "col1": (lambda x: max(x) - min(x)),
    "col2": ["min", "max"],
    "col3": "sum"
    "col4": "" #count non-nan values
})
this is roughly what I got
tacit basin
urban lance
Hey guys, I need help.
I'm grouping rows of a dataframe within a certain time in...
agg accepts 'count' string for count of non missing values.
urban lance
hmm I swear I tried that yesterday 🤔
I'll take a look
do you know how to count unique values excluding nan?
is that what "nunique" does @tacit basin
tacit basin
urban lance
is that what "nunique" does <@!490342783572246538>
Yes
urban lance
okay one more thing then
I want to add a table where I count the rows since another table had nan value
col1  |  col2
val   |   0
NaN   |   1
NaN   |   2
val   |   0
val   |   0
NaN   |   1
I guess I'll need to tackle this with a lamda function
pastel valley
resnet50 is this one right?

i am trying to implement it on tensor but without the pre trained weights its like i just want to use the architecture
input_t = Input(shape=(144, 144, 3))
res_model = ResNet50(include_top=False, weights=None, input_tensor=input_t)

for layer in res_model.layers:
    layer.trainable = False

for i, layer in enumerate(res_model.layers):
    print(i, layer.name, "-", layer.trainable)

resnet_model = Sequential()


resnet_model.add(res_model)
resnet_model.add(Flatten())

resnet_model.add(Dense(256, activation='relu'))
resnet_model.add(Dense(128, activation='relu'))

resnet_model.add(Dense(5, activation='softmax'))

resnet_model.summary()
resnet_model.compile(optimizer='adam', loss='categorical_crossentropy', metrics=METRICS)
that is the code i tried running it but maybe there are some semantic error?
like the input for resnet is 224,224 and what i used is 144,144 what will happen to my image if it goes to resnet layer?
 iron basalt
stone marlin
Haha, pls! Haha, moreover, there is rarely anything more than a random forest [...
iron basalt
stone marlin
Haha, pls! Haha, moreover, there is rarely anything more than a random forest [...
Mhm yes, using statistics to claim causal relationships which these days passes as "science". Hard to explain why you will answer with (at best, ignoring the fact that it's really complex and that is why you used a big model in the first place) "it seems like it might be these reasons".
 somber prism
guys i have a questions, what module do you all use for object detection ??
all i see is ppl using tfod 2 for object detection or use open cv dnn detection module ? is this the only way ?
 dull fern
@somber prism Yolo is pretty good, available in opencv
somber prism
dull fern
<@!393393798350372876> Yolo is pretty good, available in opencv
is it possible to do transfer learning for custom data ?
sterile rivet
I did my project on jupyter notebook, why is it lookin like this on Git?
 dull fern
somber prism
is it possible to do transfer learning for custom data ?
dull fern
somber prism
is it possible to do transfer learning for custom data ?
Maybe not in opencv but I have seen my colleagues do that, don't know what they used though
somber prism
i see , thats why i dont plan on using open cv
 odd meteor
Do people still use Scikit-Image for CV projects? What I usually hear people mention is OpenCV & Yolo. I'm planning to start learning Computer Vision soon.
tacit basin
odd meteor
Do people still use Scikit-Image for CV projects? What I usually hear people men...
I never used it. It's PIL, OpenCV for me.
odd meteor
tacit basin
I never used it. It's PIL, OpenCV for me.
Seems like not a lot of people fancy Skimage 😀. I'm gon start from there and then also compare that to OpenCV
neat anvil
stone marlin
Yes. It's very depressing. Even fairly new startups that are actively dev-ing ...
This comment is interesting to me because it’s completely different from my experience. Maybe the difference is companies centered around a highly specific single problem, and companies with a broader vision? Cus I’ve done DS work at 4 very different companies ranging in size from like 20 employees to 200,000. And in all of them, there was a seemingly endless amount of opportunities for new models that would be a good investment. I think the biggest hurdle was hiring, honestly. IMO There are relatively few interesting problems that can be solved with DS alone - you need individuals talented in both DS and whatever specific problem space the company is trying to innovate in to make progress in most industries. And the growing focus on operations as y’all have mentioned as well is huge in hiring. Because it’s now feasible for just about anyone to learn some operations skill using cloud providers, it’s an easy shortcut for companies to hire one person instead of two. Maybe not always the right decision, but a tempting one to make.
desert oar
I've had both experiences, where there are lots of lots of opportunities, but in practice there are only one or two problems that have been solved and have models running in production
I've spent many many hours under the "data scientist" job title just generating reports or doing ad hoc research
A business might not have had the data necessary or didn't have a complete enough understanding of its own problems to effectively tackle them with machine learning
Ostensibly that's part of the job of a data scientist, to figure out how to do that. But if you spend all your time building ad hoc reports, there's no time to do open-ended basic research
And there's often very little interest in such things from upper management
Obviously building all that reporting and data infrastructure does help make the research easier, but then you're looking at a multi year process potentially
So yeah what ends up happening is that there is "one big model" not because there is one big problem to solve, but because it's the only one that made it all the way to production and it's the only one that had obvious business impact before it was implemented
I don't know if that aligns with anybody elses experience though
somber prism
misty flint
anyway, i think most companies DONT need advanced ML models to solve their probl...
omg istg no one is following this . i went for 3 months internship and they wanted ml solutions for everything . like once they asked me make a ml model for finding the score of a given ad. and i was legitimately clueless on how to convince the guy to not always go for ml models
btw does anyone what is iscrowd means ? https://pytorch.org/tutorials/intermediate/torchvision_tutorial.html#putting-everything-together
desert oar
somber prism
omg istg no one is following this . i went for 3 months internship and they want...
these are the companies that will fold in 3 years. they have no respect for the process, they just want the cool shit right now because they saw it in some industry publication
the companies that will success in the "data driven future" are the ones who are investing in basic data engineering and infrastructure
ramping up to hire a data scientist next year
somber prism
yessss
somber prism
somber prism
btw does anyone what is `iscrowd` means ? https://pytorch.org/tutorials/intermed...
also can someone explain me about this
desert oar
iscrowd (UInt8Tensor[N]): instances with iscrowd=True will be ignored during evaluation.
maybe this has something to do with targets that are "faces in the crowd" and are not objects of interest?
somber prism
desert oar
> iscrowd (UInt8Tensor[N]): instances with iscrowd=True will be ignored during e...
meaning it wont detect those people in the crowd ?
desert oar
i'm not sure, it's just my guess based on the name + what the docs say
i have no idea how torchvision works
somber prism
oh i see thanks
neat anvil
desert oar
Ostensibly that's part of the job of a data scientist, to figure out how to do t...
this is true. I'd say companies that are paying data science salaries for people to generate ad-hoc reports are dramatically underutilizing their employee's skillsets and should consider hiring analysts or interns to do that... Or just invest in some basic infrastructure so the report consumers can just hook up excel to a database and do it themselves
neat anvil
desert oar
I've had both experiences, where there are lots of lots of opportunities, but in...
Also I think some context that's missing from the conversation here is that a full-fledged ML/AI model running in production is a very substantial investment. Adding together all the costs of acquiring data, salaries for everyone involved, and operations could easily be in the millions of dollars before the model ever sees real-world use. Continual operations and data maintenance cost can be substantial. So, most small companies literally cannot afford to have more than one or two large-scale ML models in production
And taking bets is scary. It takes a lot of trust and good communication built into the company culture to let your data scientists "off the leash" trying out uncertain new projects, since each time they try that is a huge bet - tens to hundreds of thousands of dollars invested in something that may not pan out. So the data scientists need to have a good sense of what is a good bet and why, and the people around the need to trust the data scientists understanding the context and ability to deliver
misty flint
somber prism
omg istg no one is following this . i went for 3 months internship and they want...
thats a huge red flag. you should run far, far away.
somber prism
misty flint
thats a huge red flag. you should run far, far away.
here's a funny thing, he also asked the other intern to figure out the height of the model ( actual model not ml model ) based on the given photo
you may think he was joking but no he was serious about this one
misty flint

somber prism
there are lot and the list goes on but ill end it here lol
misty flint
neat anvil
And taking bets is scary. It takes a lot of trust and good communication built i...
yeah at that point DS need their own product people and i would def have a Subject Matter Expert double check to verify just in case
although it helps sometimes if the SME and DS are the same person
like usually a lot
 tawdry nova
How to write in delta parquet using spark
 acoustic crow
Hello guys, I am rather new to Python and I currently am doing an internship within a company on the position of a Data Analyst. I have a project which I must complete in the time frame of 6 months which is related to data validation. I did my research online and found out that Python is widely used for data validation and has a lot libraries and packages which can assist me with that task. So here comes my question now.
**Is there a way in which I can customize and generate an HTML report within Python which contains the information from the data validation which was performed? **
I performed an online research which introduced me to several libraries such as plotly & streamlit, but can they be modified to such an extension so that the end product, which is the HTML report, to look like this:
That is a wireframe which I created of how I would like to visualize the end results of the performed data validations in an HTML report
 serene scaffold
acoustic crow
Hello guys, I am rather new to Python and I currently am doing an internship wit...
serene scaffold
acoustic crow
Hello guys, I am rather new to Python and I currently am doing an internship wit...
it's definitely possible, but probably amounts more to a #web-development question. if you're using pandas, there's a to_html method for dataframes
 sinful pewter
what does this learning curve indicate? Is it overfitting / underfitin or just perfect ?

I am refering this article and based on it I concluded it has to be a perfect fit

Medium
This article discusses overfitting and underfitting in machine learning along with the use of learning curves to effectively identify…
somber prism
sinful pewter
what does this learning curve indicate? Is it overfitting / underfitin or just p...
definitely not underfitting
tacit basin
acoustic crow
Hello guys, I am rather new to Python and I currently am doing an internship wit...
Streamlit seems capable of this. Check their gallery https://streamlit.io/gallery

Streamlit is an open-source app framework for Machine Learning and Data Science teams. Create beautiful web apps in minutes.
tacit basin
sinful pewter
what does this learning curve indicate? Is it overfitting / underfitin or just p...
What's Data Points?
sinful pewter
tacit basin
What's Data Points?
data points to train a model
somber prism
btw have you guys ever encountered a model that actually performs well in the train, validation and test data but when you finally think you made a good model and tried to test it with real life data it performs poorly ? or only me 😐 ?
serene scaffold
somber prism
btw have you guys ever encountered a model that actually performs well in the tr...
yes, this is a well-known thing called overfitting
somber prism
yep but it does performed better in validation and test set
serene scaffold
though it could also mean that the dataset as a whole doesn't actually reflect how things are
somber prism
so basically it overfitted to that particual dataset
acoustic crow
serene scaffold
it's definitely possible, but probably amounts more to a <#366673702533988363> q...
How come is it more related to web?
sinful pewter
serene scaffold
though it could also mean that the dataset as a whole doesn't actually reflect h...
that might be because of the use of wrong algo
serene scaffold
acoustic crow
How come is it more related to web?
because data scientists don't necessarily know how to make web pages
stone marlin
acoustic crow
How come is it more related to web?
I'd say go for streamlit, it integrates well with Pandas which will prob be what you'll be using for analysis anyhow.
It's real easy to pick up and you don't need a whole lot of extra stuff sitting around to run it.
acoustic crow
Are there Python libraries which allow extensive customisation to HTML reports? Because I found streamlit which kind of does those things, but is it customisable?
somber prism
serene scaffold
though it could also mean that the dataset as a whole doesn't actually reflect h...
i actually had around 278k asl hand signs image dataset and trained it for only 5 epoch , but for the testing i took completely different dataset ( even preprocessed that different test dataset similar to trained dataset ) , and in the end i got 96% accuracy for training 97% accuracy for validation 19% accuracy for testing ( different dataset but same asl hand signs )
stone marlin
I'd take a look at the docs in Streamlit and see if that's for you. The other option, which is more of a #web-development , would be to use Flask and create jinja templates (HTML with some code in it) and then maybe use some js libraries which accomplish your task.
odd meteor
serene scaffold
I can never figure out what's happening, and I've owed them 16 cents for several...
This made me 😂 😂 😂 in transit.
serene scaffold
odd meteor
This made me 😂 😂 😂 in transit.
in transit? 
like, on a bus? does everyone think you're weird now?
stone marlin
For example, Tsar, in your image above you have a custom table. That's not super easy to do in either Python or JS. But it's easy to do a basic table.
desert oar
somber prism
i actually had around 278k asl hand signs image dataset and trained it for only ...
makes sense... the model learned to recognize images only in the one dataset and has no idea how to handle the other dataset, clearly the training set didn't have enough variation to allow the model to generalize well
that sucks but that's how machine learning goes sometimes
acoustic crow
stone marlin
I'd take a look at the docs in Streamlit and see if that's for you. The other o...
Yeah, I will ask my inquiry on web as well. See what I can get as ideas
agile cobalt
acoustic crow
How come is it more related to web?
I've been using Dash recently and it is somewhat nice - and Plotly is much better to work with than matplotlib imo
that said, the web part might still be more into the web part than data science. Plotting itself can fit here, but idk
stone marlin
So, check out the docs for Streamlit and the widgets they have and the examples. If they have what you want, go for it. Because the alternative is pret much "learn webdev and do it yourself." Haha.
Yes, Dash is also really nice. Plotly is great if you have more plot-based stuff to work on, but I prefer either Dash or Streamlit.
agile cobalt
dash uses plotly 😛
stone marlin
Oh, really? D^ng.
somber prism
desert oar
makes sense... the model learned to recognize images only in the one dataset and...
so in order to overcome that i am planning to try object detection which will not focus on the bg and focus on the actual object ( hand ) . this will boost the accuracy right ?
acoustic crow
What I got as an idea was to perform the data validation part in Python, save the results of it, create a template in HTML and somehow feed that data to the HTML template to populate it