#data-science-and-ml
1 messages · Page 379 of 1
 tidal bough
 arctic wedgeBOT
tidal bough
arctic wedgeBOT
tidal bough
 wooden forge
I found a way lol
wooden forge
tidal bough
more specifically https://numpy.org/doc/stable/reference/random/generated/numpy....
but this looks way better omg
rng = np.random.default_rng()
rng.integers(2, size=10)
That's exactly what I want to do
but is there a way to make it a 2D array?
tidal bough
just pass a tuple as the size

 serene scaffold
Please do not ping specific people to draw attention to your question; always ask your question to the channel as a whole. I was asleep at the time, and even if I was online, I might not have known and can't answer any question on-demand.
 misty flint
interesting i tend to use either list comprehension or map()
 crisp flax
Not really? It's not at the bottom of the list.
If speed matters you go to the very bottom. If readability matters I think list compre ranks quite highly.
wooden forge
Okay so I have my harmonic functions, I have the frame containing scattered dots represented by a 2D numpy array. I know that I can use certain functions to just check if there is any intersection points, but I can't put my finger on how to check within a certain radius. Because let's say I check for every point of my plot if one dot is in the surounding, that would take a very long time and I feel like it is very inefficient. Or I could do this opposite by checking within a certain radius around a point of the graph if there is any dot. Moreover, my function is a 1D array while my dots array is 2D, is that problematic?
or maybe I could directly get the position of the dot, and then make a fictive circle around it, to then loop again on the point of the curve?
wooden forge
I could also find the distance bewteen each point of the graph and the dots of the array and check if it is more or less than a certain radius
but yeah my function is a 1d array while the dots array is a 2d array
tidal bough
you could use the naive way but using numpy
e.g.
!docs scipy.spatial.distance.cdist
arctic wedgeBOT
scipy.spatial.distance.cdist(XA, XB, metric='euclidean', *, out=None, **kwargs)```
Compute distance between each pair of the two collections of inputs.

See Notes for common calling conventions.and that works to compare distance between points of a 1d array and 2d array?
wooden forge
tidal bough
!docs scipy.spatial.distance.cdist
I feel like I first need to convert my 1d array to 2d to use that, otherwise it won't work
using a double for loops also would works but without a y coordinate for the 1d it's pointless
wooden forge
okay so
I have an array of points, which is 2d
and I have an harmonic function
which is stored inside a 1d array
Inside my 2d array, I randomly placed dots, coded by 1 (empty spaces are 0's)
I would like to check if a point of my function is close enough, within a certain radius, from a dot of my 2d array
See how you would represent the harmonic function on a plot, that looks 2d but could I do that ?
ho wait
x coordinate would be the x-axis, in that case time
and y simply the value
wait no because the value isn't an integer
nevermind
@tidal bough this is basically what I would like to recreate in python, and Salt rock lamp suggested to start simple by just making a basic counter
tidal bough
well, make the function points an array of actual points
wooden forge
how so?
wooden forge
I don't really visualize it
I don't see how I could take the values of my function, and make an array of 2 dimensions, that would basically look like a matplotlib figure
tidal bough
wooden forge
I don't see how I could take the values of my function, and make an array of 2 d...
Well, the values of your function are the y-values for some x-values, right? Stack the x and y points (each a 1d array) on top of each other, for a (N,2)-shape array, each row of which is a single (x,y) point.
wooden forge
w1 = 400 #nm

def signal(t,w):
    return np.cos(t/w)

t = np.linspace(start=0, stop=1000, num=n)
signal1 = signal(t, w1)
basically
n is just an integer, used to create the 2d array of point (shape is n,n)
so are you suggesting stacking the y and x like :
|__
or like : =
wooden forge
I think I can just convert a matplotlib plot into a numpy array
tidal bough
wooden forge
n is just an integer, used to create the 2d array of point (shape is n,n)
uhh, no? linspace gives you a 1d array of shape (n,) here
wooden forge
tidal bough
uhh, no? linspace gives you a 1d array of shape `(n,)` here
n = 200 #rows/columns length
frame = np.random.default_rng()
arr = frame.integers(2, size=(n,n))``` bold timber
Why if I execute 'print(account),' the result is what that exist in the magic method of 'str'? Why the code of 'print(account)' can recognize the magic method of '__ str__'?
 wooden forge
tidal bough
uhh, no? linspace gives you a 1d array of shape `(n,)` here
wooden forge
tidal bough
uhh, no? linspace gives you a 1d array of shape `(n,)` here
No yes I know that, I was just telling you where that n was coming from that's all ^^
 upbeat prism
hello
tidal bough
bold timber
Why if I execute 'print(account),' the result is what that exist in the magic me...
Well, that's why it's a magic method. Builtins use them.
upbeat prism
do you think adding zeros at the start and end of a noisy time series will lead to issues when whitening it? The reason I wanna add zeros is because whitening leads to corrupted edges. e.g. in my case 1.25s will become 1s of good data after whitening.
bold timber
tidal bough
Well, that's why it's a magic method. Builtins use them.
But, why when I remove 'Bambang' --> account = Account(10000000), print(account) still can execute the result that exists in str method? shouldn't str only execute of string value?
wooden forge
ConfusedReptile on all fronts, we can see the sweat flowing on its temple
tidal bough
bold timber
But, why when I remove 'Bambang' --> account = Account(10000000), print(account)...

as for why you can create an account with only one argument - looking at your init, balance is optional.
so when doing Account(10000000), you actually create an account with an owner of 10000000 and zero balance.
bold timber
tidal bough
so when doing `Account(10000000)`, you actually create an account with an owner ...
Oh yeah, thank you so much. I forget that the value of 'balance' is set by default as 0
 untold belfry
Just got my Python skills on a level that I am able to do my first working project with it. 
misty flint
untold belfry
Just got my Python skills on a level that I am able to do my first working proje...
congrats

thats always a good feeling
 tired oar
why do we use numpy?
just to make arrays easier to mutate?
like easier to create data
& mutate the data structure, etc?
 neat anvil
numpy allows you to both more performantly (runs faster and with less RAM) and more ergonomically (easier to write the code) work with matrix mathematics than stdlib python.
tidal bough
it's more convenient and less memory-hungry than nested lists, and also enormously faster when doing vectorized operations
 stark kiln
Hey Eevee
tired oar
anyone know a actual good course on machine learning with python?
most are sooo freaking dry I want to scrape my eyes out
lol
 tacit basin
How do I enable vim mode in Databricks notebooks?
 pure blaze
Anyone here experienced with keras or other models?
 lapis sequoia
Hey guys, need some advice on how do i Compare words from these lines? i want to compare line1 and line 2, get the list of common words. compare line2 and line 3 and get the common words, compare line 3 and line 4 and get the common words..... I have my data in a .txt file in this format:
 tacit basin
tired oar
anyone know a actual good course on machine learning with python?
tacit basin
tired oar
anyone know a actual good course on machine learning with python?
Deep learning is something that interests you? Then i would recommend fastai courses. course.fast.ai
Or machine learning with python by core devs of scilit learn. https://www.fun-mooc.fr/en/courses/machine-learning-python-scikit-learn/

FUN MOOC
Build predictive models with scikit-learn and gain a practical understanding of the strengths and limitations of machine learning!
tacit basin
lapis sequoia
Hey guys, need some advice on how do i Compare words from these lines? i want to...
What do you want to get from the comparison?
tacit basin
pure blaze
Anyone here experienced with keras or other models?
Depends whats your question? :)
lapis sequoia
 tacit basin
lapis sequoia
the common words
tacit basin
lapis sequoia
the common words
You want to get common words between lines?
lapis sequoia
yesss
pure blaze
Can you fit a model, then generate predictions without having to refit the model? Meaning I want to generate predictions for a timeseries, one row at a time
This way I don't have to generate a new model every time
lapis sequoia
lapis sequoia
This is what i have written so far, but i am not able to compare line1 and line2--- get common words, compare line 2 and line 3
serene scaffold
lapis sequoia
Hey guys, need some advice on how do i Compare words from these lines? i want to...
I would first remove the leading stuff with re.sub(r'(^|\n)[\d_]+:{2}', r'\1', text), and then convert each line into a set of strings. from there you can do set operations.
lapis sequoia
getting stuck in the second loop to compare line2 and line 3
lapis sequoia
serene scaffold
I would first remove the leading stuff with `re.sub(r'(^|\n)[\d_]+:{2}', r'\1', ...
you mean do this for every line right???
serene scaffold
pure blaze
Can you fit a model, then generate predictions without having to refit the model...
yes. don't use fit_predict more than once.
serene scaffold
lapis sequoia
you mean do this for every line right???
you can just apply it once to the whole txt file, though I haven't tested it.
lapis sequoia
serene scaffold
you can just apply it once to the whole txt file, though I haven't tested it.
with open('myfile1.txt') as fm:
file = re.sub(r'(^|\n)[\d_]+:{2}', r'\1', fm)
like this???
serene scaffold
lapis sequoia
with open('myfile1.txt') as fm:
file = re.sub(r'(^|\n)[\d_]+:{2}', r'\1', fm...
you would have to do fm.read()
lapis sequoia
this does not work
serene scaffold
fm is a file handle, not a string.
serene scaffold
lapis sequoia
this does not work
remember to never say that something "doesn't work". always show what happens instead, or the error message.
serene scaffold
anyway, the open function gives you a file handle, not the actual string of the content.
serene scaffold
can you copy/paste the string as text, so I can verify that it is correct?
lapis sequoia
file
'analog,ieee,technology,resistive,designed,message,line,hardware,include,provided,resistance,matching\nanalog,characteristic,gain,optimization,ieee,measured,analog,hardware,differential,provided,circuit,city,resistance\nanalog,characteristic,amplifier,hardware,tied,vlsi,conventional,channel,mead,technology,waveform,electronic\nanalog,circuit,background,mead,characteristic,noise,voltage,electronic,hardware,adaptation,design,chip\nanalog,voltage,background,chip,hardware,noise,vlsi,mead,amplifier,line,implementation,implement\nanalog,voltage,background,chip,hardware,noise,vlsi,line,mead,implementation,amplifier,pulse\nanalog,voltage,background,chip,hardware,noise,vlsi,line,implementation,mead,pulse,transistor\nanalog,voltage,background,chip,hardware,noise,vlsi,implementation,mead,line,pulse,amplifier\nanalog,background,voltage,chip,hardware,vlsi,noise,implementation,pulse,low,mead,fabricated\nbackground,voltage,analog,chip,hardware,noise,implementation,vlsi,fabricated,transistor,pulse,circuit\nbackground,voltage,analog,chip,noise,hardware,implementation,fabricated,vlsi,pulse,transistor,circuit\nvoltage,background,analog,chip,noise,hardware,implementation,circuit,fabricated,pulse,low,vlsi\nvoltage,background,noise,analog,chip,low,circuit,signal,hardware,transistor,implementation,ieee\nbackground,voltage,noise,analog,chip,low,circuit,signal,ieee,channel,intensity,transistor\nbackground,voltage,noise,analog,chip,low,circuit,ieee,source,hardware,signal,implementation\nbackground,voltage,noise,chip,analog,low,circuit,ieee,hardware,source,signal,transistor\nnoise,background,voltage,low,chip,analog,ieee,source,circuit,implementation,hardware,transistor\n'
type(file)
<class 'str'>
lapis sequoia
now how do i compare line1 and line 2--- get common words.... then compare line2 and line 3--- get common words?
serene scaffold
I would first convert this whole string into a list of sets of strings, notated as list[set[str]]
and then you can pick whichever two list elements (which are both set[str]) you want and do the comparisons.
or set arithmetic, etc.
you can go from one big string to list[set[str]] in one statement with a list comprehension.
lapis sequoia
list[set[file]]
Traceback (most recent call last):
File "<string>", line 1, in <module>
TypeError: 'type' object is not subscriptable
serene scaffold
you must be using an older version of python. but you don't actually need to include list[set[str]] in your code
that's just the notation for expressing composite types.
serene scaffold
in the two most recent versions of python, you can write code like var: list[set[str]] = [{'a', 'b'}, {'c', 'd'}] if you want.
(there are ways to do the same thing in older versions of python), but we can talk about that Another Time)
lapis sequoia
ok, let me try this.... first convert this big sting into smaller sets, then have these sets in a set. Right?
serene scaffold
nope, you can't actually have sets inside a set.
but you're going to have a list with sets in them.
(in true set theory, you can have sets in a set, but not in python.)
lapis sequoia
yes yes list[{},{},{}]
serene scaffold
yesssss
and each one of those sets will have strings in them
so each set represents one line of the file
lapis sequoia
ok, let me do that....
serene scaffold
so, think of these two questions:
- how can I divide the one big string into lines?
- how can I divide one line into a set?
lapis sequoia
and how do i loop to compare 1&2, 2&3, 3&4?
serene scaffold
is the goal to get a matrix of overlap counts?
lapis sequoia
serene scaffold
so, think of these two questions:
1. how can I divide the one big string into li...
okay... i just googles these questions just 2 sec ago!! thanks 😄
serene scaffold
lapis sequoia
okay... i just googles these questions just 2 sec ago!! thanks 😄
these can't be googled exactly
but if you want to split a string into lines, you use str.split('\n')
lapis sequoia
serene scaffold
is the goal to get a matrix of overlap counts?
yes... the counts of common words to be precise
 urban prism
May I ask a question?
serene scaffold
lapis sequoia
yes... the counts of common words to be precise
well, if we wanted to be really precise, we'd say the cardinality of the intersection.
serene scaffold
urban prism
May I ask a question?
yes
lapis sequoia
serene scaffold
well, if we wanted to be really precise, we'd say the cardinality of the interse...
yup!!
serene scaffold
always just ask your whole question, assuming it's on topic for the channel. put enough info out there for someone to read it and answer it.
@lapis sequoia so you are wanting to put these in a matrix-like structure? namely list[list[int]]?
I have to go do something but I'll see if I can check again Soon.
lapis sequoia
serene scaffold
I have to go do something but I'll see if I can check again Soon.
yes please....
lapis sequoia
serene scaffold
well, if we wanted to be really precise, we'd say the cardinality of the interse...
can you please tell me the loop structure to compare.
after we get the list of sets
serene scaffold
@lapis sequoia you want something like this, right?
      [[0, 0, 0, 0, 0],
       [0, 0, 0, 0, 0],
       [0, 0, 0, 0, 0],
       [0, 0, 0, 0, 0],
       [0, 0, 0, 0, 0]])
and then you'll change arr[i][j] to be the "overlap count"?
for the ith and jth sets
 iron basalt
tired oar
anyone know a actual good course on machine learning with python?
iron basalt
tired oar
anyone know a actual good course on machine learning with python?
What made you want to get into ML in the first place?
tired oar
iron basalt
What made you want to get into ML in the first place?
just for fun
iron basalt
tired oar
just for fun
Did you have a specific project / goal in mind?
tired oar
no
iron basalt
tired oar
no
Do you prefer programming over math?
 fiery dust
def downloadData(min):
  header = ['Timestamp', 'Open', 'High', 'Low', 'Close', 'Volume']
  df = pd.DataFrame(columns=header).set_index('Timestamp')
  filename = '{}.csv'.format(min)
  exchange = getattr(ccxt, "bybit") ()
  exchange.load_markets()
  for coin in exchange.symbols:
    if "USDT" in coin:
      data = exchange.fetch_ohlcv(coin, min, limit=200)
      data_df = pd.DataFrame(data, columns=header).set_index('Timestamp')
      data_df['symbol'] = coin
      df = df.append(data_df)
  df.index = df.index/1000
  df['Date'] = pd.to_datetime(df.index,unit='s')
  return df
How would you guys convert all values in the dataframe into floats?
serene scaffold
fiery dust
```py
def downloadData(min):
header = ['Timestamp', 'Open', 'High', 'Low', 'Cl...
df = df.astype(float)
fiery dust
thanks hehe
serene scaffold
or just return df.astype(float)
tacit basin
lapis sequoia
can you please tell me the loop structure to compare.
something like that, depends on your input:
In [33]: l = """
    ...: 1999::analog,iee,technology
    ...: 1998::analog,characteristic,gain
    ...: """

In [34]: def a(l, idx=0):
    ...:     for i in l.split()[idx:]:
    ...:         yield set(i.split("::")[1].split(","))

In [35]: for x, y in zip(a(l), a(l, 1)):
    ...:     print(x & y)
{'analog'}
if that causes an error, we need to see the error message and the dataframe to know why
iron basalt
tired oar
yes
What does "machine learning" mean to you? Are you actually trying to get into AI or pure ML?
tired oar
would be fun to learn. Also its great for automating stuff
fiery dust
and to change to a float a specific column I should do something like df["column"].astype(float) ?
 hazy sierra
fiery dust
and to change to a float a specific column I should do something like `df["colum...
hazy sierra
fiery dust
and to change to a float a specific column I should do something like `df["colum...

Kite is a free autocomplete for Python developers. Code faster with the Kite plugin for your code editor, featuring Line-of-Code Completions and cloudless processing.
df = df.astype({"Column 1": float, "Column 2": int})
fiery dust
right
hazy sierra
You could always get the series data, change the type, then assign it to the column Lol
fiery dust
I mean the first thing 👍
hazy sierra
Np ❤️
iron basalt
tired oar
would be fun to learn. Also its great for automating stuff
If you just want to hack together some stuff using ML then I would not really recommend any course, but rather some blogs that have some tutorials on specific projects. A course will almost always try to cover some theory.
Without any specific project in mind there is only really theory, which seems like not what you want.
What are you trying to automate?
 remote vessel
Hi everyone
Hello I am a newbie to programming and general machine learning. I have collected some data regarding horse racing and I want to throw it in to the sequential model. In the data, each horse has three variables, average speed, carried weight and its age. Each games there are maximum of fourteen horses racing at the same time. Therefore, there should be a total of 42 variables. How can I reshape the X samples into a suitable numpy array for Kares? What shape should it be? Thank you for reading.
I don’t really how the reshape in keras works.
serene scaffold
remote vessel
Hello I am a newbie to programming and general machine learning. I have collecte...
the array should have 14 rows and 3 columns. but that isn't enough data to train a neural model.
remote vessel
serene scaffold
the array should have 14 rows and 3 columns. but that isn't enough data to train...
I mean for each game, it should input all 42 variables into the model
serene scaffold
remote vessel
I mean for each game, it should input all 42 variables into the model
I wouldn't refer to the array elements as "variables". how many games are there?
remote vessel
I am still web scraping, when it is done there should be about 1500-2000 games
fiery dust
Why cant I do dataframe.to_numeric() ? If I'm not wrong I've seen .py modules using that -_-
serene scaffold
fiery dust
Why cant I do `dataframe.to_numeric()` ? If I'm not wrong I've seen .py modules ...
!docs pd.to_numeric
arctic wedgeBOT
Not likely.
No documentation found for the requested symbol.
arctic wedgeBOT
pandas.to_numeric(arg, errors='raise', downcast=None)```
Convert argument to a numeric type.

The default return dtype is float64 or int64 depending on the data supplied. Use the downcast parameter to obtain other dtypes.

Please note that precision loss may occur if really large numbers are passed in. Due to the internal limitations of ndarray, if numbers smaller than -9223372036854775808 (np.iinfo(np.int64).min) or larger than 18446744073709551615 (np.iinfo(np.uint64).max) are passed in, it is very likely they will be converted to float so that they can stored in an ndarray. These warnings apply similarly to Series since it internally leverages ndarray.@remote vessel and you're trying to predict which horse won based on those three features?
remote vessel
remote vessel
I am still web scraping, when it is done there should be about 1500-2000 games
I am trying to predict the first three horse, so there should be 14x13x12 outputs and y labels. Also, for the output activation function would preferably soft max so it gives me a sense of which horse has the highest probability of winning
For the sequential model in Keras, it only accepts the input to be size in(-1, something, something,…) form
serene scaffold
didn't you say there are 14 horses? where did 12 and 13 come from?
lapis sequoia
serene scaffold
<@456226577798135808> you want something like this, right?
```py
[[0, 0, 0...
no no!! i want a list of len(common words) eg: list1 = [5,4,7,2,1,0] where 5 = len of common words of line1 and line 2, 4 = len of common words of line 2 and line 3
remote vessel
Yes, if I want to predict the first three ranks, there should be 14X13X12 ways to arrange the first three ranks of horses
serene scaffold
okay, so you can do zip(word_sets[:-1], word_sets[1:]) to compare each adjacent set
remote vessel
Therefore, there should be 14X13X12 outputs
lapis sequoia
tacit basin
something like that, depends on your input:
```py
In [33]: l = """
...: 1999...
i need a list[{word1,word2,word3},{word1,word2,word3},{word1,word2,word3}...]
tired oar
iron basalt
If you just want to hack together some stuff *using* ML then I would not really ...
what programming blogs would u recommend for programming in general & machine learning?
medium is sometimes fine, but alot on there is crap too
iron basalt
tired oar
what programming blogs would u recommend for programming in general & machine le...
I was thinking for specific projects, in general IDK. ML in general is just waaaaay too big.
remote vessel
remote vessel
Yes, if I want to predict the first three ranks, there should be 14X13X12 ways t...
14 possible horses for the first rank, 13 the second and 12 the third. So 14X13X12
iron basalt
Having a specific project in mind matters, because otherwise it's like asking me for resources about math in general.
lapis sequoia
serene scaffold
okay, so you can do `zip(word_sets[:-1], word_sets[1:])` to compare each adjacen...
ok, i will try once i put the strings into list[sets].... but i am still having trouble putting each sentence/line into a set
iron basalt
Instead asking for something even slightly more specific will help a lot, like linear algebra (in the math comparison).
fiery dust
Does someone understand this error?
<class 'NoneType'>
Traceback (most recent call last):
  File "D:\Programming\3CTG ToolKit\Beady Eye\datadownloader.py", line 41, in <module>
    candlestick_data = pytrendline.CandlestickData(
  File "C:\Users\schus\AppData\Local\Programs\Python\Python310\lib\site-packages\pytrendline\structs.py", line 25, in __init__
    raise Exception("CandlestickData constructor param df should have at least three entries, received :\n{}".format(
Exception: CandlestickData constructor param df should have at least three entries, received :
None ``` Code ```py
results = pytrendline.detect(
  candlestick_data=candlestick_data,

  # Choose between BOTH, SUPPORT or RESISTANCE
  trend_type=pytrendline.TrendlineTypes.BOTH,
  # Specify if you require the first point of a trendline to be a pivot
  first_pt_must_be_pivot=True,
  # Specify if you require the last point of the trendline to be a pivot
  last_pt_must_be_pivot=True,
  # Specify if you require all trendline points to be pivots
  all_pts_must_be_pivots=True,
  # Specify if you require one of the trendline points to be global max or min price
  trendline_must_include_global_maxmin_pt=False,
  # Specify minimum amount of points required for trendline detection (NOTE: must be at least two)
  min_points_required=3,
  # Specify if you want to ignore prices before some date
  scan_from_date=None,
  # Specify if you want to ignore 'breakout' lines. That is, lines that interesect a candle
  ignore_breakouts=True,
  # Specify and override to default config (See docs on how)
  config={}
)
``` What I'm trying to do is scrape data from an API, put it in a dataframe, then write that data into a .csv and then read that .csv to identify trendlines in candlestick charts so that its plotted. I hope this makes sense 😄The best that can be done then is just to do one of the "boring" courses or books. Without any specific project in mind.
General knowledge will bore you if you are a hands-on hacking stuff together type without a strong interest in math / stats / etc.
 surreal badge
Matlab quetstion. Why dont i get the colors to match the graph-color and the legend-colors? https://i.imgur.com/ePqTRc1.jpeg and some code
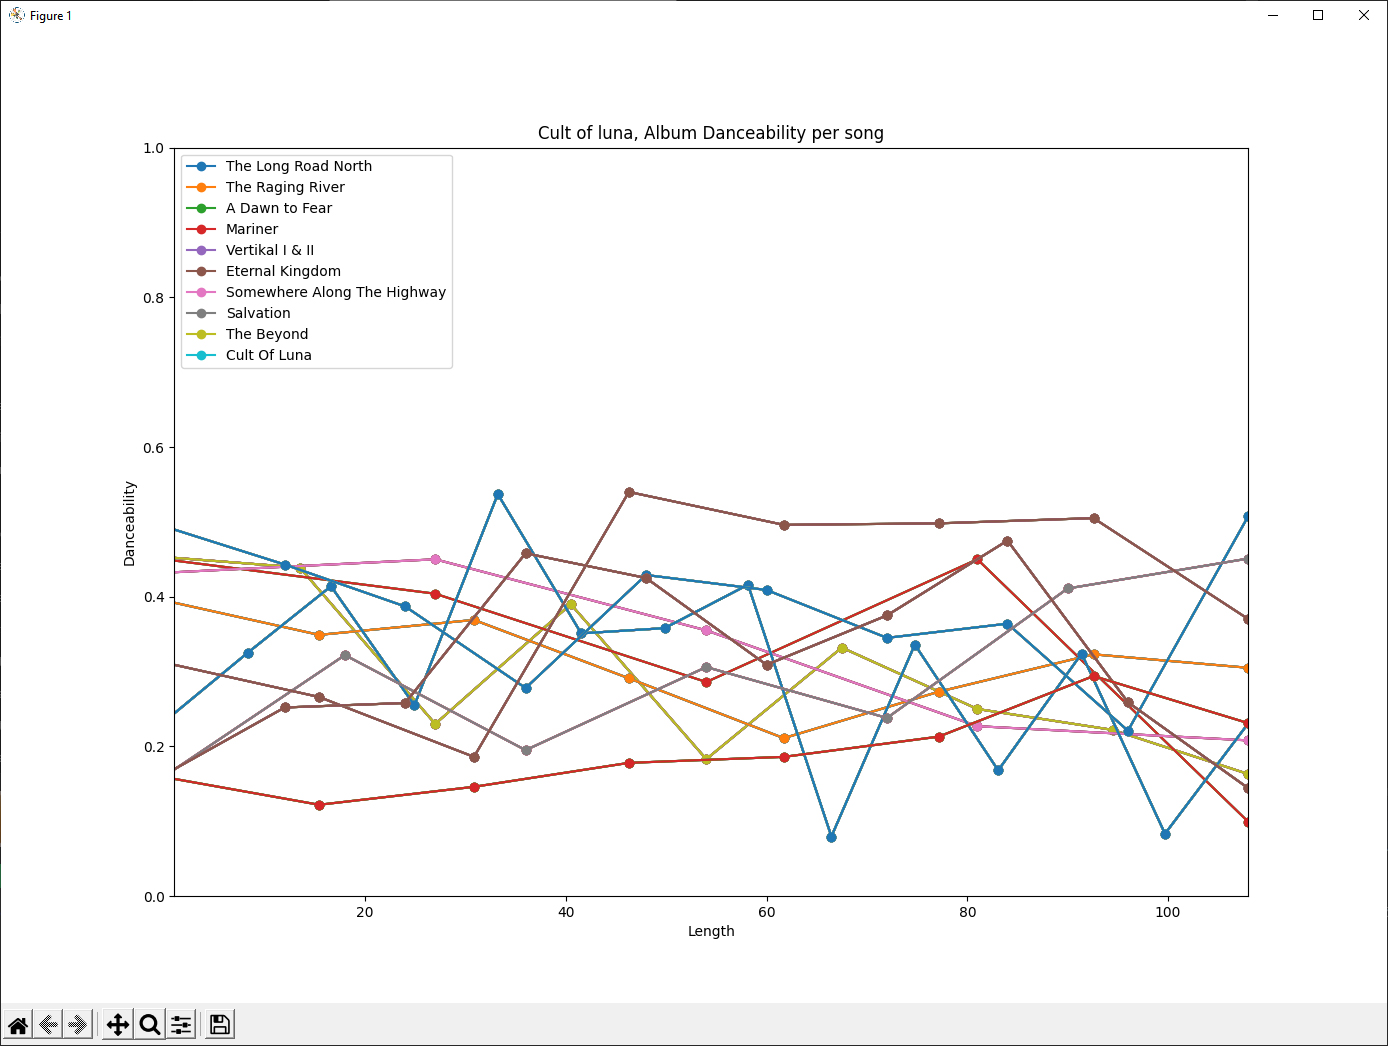
How to paste cool like @fiery dust above? :]
code*
surreal badge
    for album in range(len(all_albums)):
        print(all_albums[album])
        for song in range(all_albums[album][3]):
            x = np.linspace(0, longest_album, all_albums[album][3])
            plt.plot(x, albums_danceability[album], marker='o')

    plt.xlim(1, longest_album)
    plt.ylim(0, 1)
    plt.legend([all_albums[i][1] for i in range(len(all_albums))], loc='upper left')
    plt.show()
Thanks
fiery dust
👍
surreal badge
For example there are no cyan nor green on the graph but there is in the legend
tacit basin
lapis sequoia
i need a list[{word1,word2,word3},{word1,word2,word3},{word1,word2,word3}...]
In [33]: l = """
    ...: 1999::analog,iee,technology
    ...: 1998::analog,characteristic,gain
    ...: """

In [34]: def a(l, idx=0):
    ...:     for i in l.split()[idx:]:
    ...:         yield set(i.split("::")[1].split(","))

mylist = []
In [35]: for x, y in zip(a(l), a(l, 1)):
    ...:     mylist.append(x & y)
 exotic yoke
hi everyone.. I am learning pandas and was looking for a way to use the rolling function "as a generator"... What I mean is that I will be adding values to the dataframe on the fly, and I'd like to keep the last "window" of values in memory and, perhaps, just send the new value to thsi generator and get the rolling calculation... Am I approaching this the wrong way? It's just that re-running the rolling on the window everytime I get a new row it's quite slow...
serene scaffold
exotic yoke
hi everyone.. I am learning pandas and was looking for a way to use the rolling ...
that's not the kind of thing that pandas is intended to support, so you'll have to implement it yourself.
exotic yoke
oh I see.. thanks for you answer anyway.. it shouldn't be much of a hassle to be honest,.. I am just sure pandas/cython would be faster than my skills
serene scaffold
also, dataframes have a fixed size. so every time you append/concat, all the rows from both are copied into a new df every time
so repeatedly appending/concatting is O(n^2)
so you will probably want to consider an approach that minimizes the number of concats.
exotic yoke
hm.. that's quite interesting.. it might not be the best format for me to work then... a dict or something more mutable will be better
serene scaffold
is there any reason you can't get all the data you'll be using in one place before you do any calculations? in other words, why do you need to do stuff "on the fly"?
exotic yoke
it's a stock market stuff.. so prices come with time
serene scaffold
ah, so this is stuff that happens in response to events? in that case, using native python data structures shouldn't be that bad, since the computation time probably won't exceed the time delta between events.
exotic yoke
yes.. you are right.. It will spend most of the time just sitting idle.. I will use pandas for the presentation, as it makes it easier to read.. but leave the processing aside
neat anvil
If you really want to both record and process data on-the-fly, a time-series database will make that much easier. They are purpose built for this exact type of use case
exotic yoke
sounds cool.. I will take a look.. opentsdb recommended?
I have no experience with tsdb, either
neat anvil
honestly I've never used one, I'm just aware of their existence and intended use cases.
exotic yoke
yeah.. they sound perfect for the job, just not sure if my job is good enough to deserve it... I am just playing around
neat anvil
If you already know docker and have some familiarity with using databases, it'd probably take you less time to spin up a docker container running an open-source database than to figure out how to shove pandas into working for an inappropriate use-case
if you don't have those prerequisites, this is a perfect opportunity to learn them
exotic yoke
yes.. I am familiar with docker... might give it a try with opentsdb
pandas is not a good idea, apparently
neat anvil
but ya like stelercus said, you can probably get away with just doing the analysis in batches instead of a continuously running time window
lapis sequoia
tacit basin
```py
In [33]: l = """
...: 1999::analog,iee,technology
...: 1998::analo...
ah... thank you so much. I was finally able to do...
with open('myfile1.txt') as fm:
CommonWords_count =[]
commonWords_year =[]
for index,line1 in enumerate(fm):
print(line1)
if index ==0:
base_year =line1.replace('::', ' ,').replace('\n', '').split(",")
else:
compare_year = line1.replace('::', ' ,').replace('\n', '').split(",")
commonWords = list(set(base_year) & set(compare_year))
commonWordslen = len(list(set(base_year) & set(compare_year)))
base_year = compare_year
commonWords_year.append(commonWords)
CommonWords_count.append(commonWordslen)
print(CommonWords_count,commonWords_year)
@tacit basin @serene scaffold thank you 🙂
 stone marlin
Adding on to this: yes, do not use pandas or numpy for on-the-fly additions to things. Batch them if you really want to work with numpy or pandas, but make pretty big batches. I've worked with influxdb before, which we found to be good for our usecase. https://hub.docker.com/_/influxdb is the docker image, but there's also a python library you can mess around with.
InfluxDB is an open source time series database for recording metrics, events, and analytics.
Here's a somewhat arbitrary resource I googled just now on timeseries databases in general, but note that they're often used for capturing metadata of things which are more "insert"-based (real-time, or time-sensitive items, like IoT, Logs, Financials, etc.) than "update" or "batch"-based solutions. https://aiven.io/blog/an-introduction-to-time-series-databases
exotic yoke
thanks mate... I will take a look!
fiery dust
fiery dust
Does someone understand this error?
```
<class 'NoneType'>
Traceback (most recen...
Does someone know? 🙂
lapis sequoia
Can someone suggest effective to achieve this? I am reading one file(f), saving into a different files(ff1,ff2...) based on different conditions.
 neat anvil
fiery dust
Does someone understand this error?
```
<class 'NoneType'>
Traceback (most recen...
neat anvil
fiery dust
Does someone understand this error?
```
<class 'NoneType'>
Traceback (most recen...
it's pretty much all in the exception - it was expecting at least three entries, but you gave it None instead. So it complained
lapis sequoia
lapis sequoia
Can someone suggest effective to achieve this? I am reading one file(f), saving ...
can someone help me please
stone marlin
You'll probably have an easier time if you load the file once with, say, Pandas, and then use conditionals on the dataframe to get what you want, then save THAT to the various files.
Give me a second and I'll give you a small toy example.
lapis sequoia
ya, sure!! @stone marlin
stone marlin
(Haha, I'm on a new laptop, and installing numpy / pandas on a starbucks wifi takes a bit...!)
fiery dust
does anyone know if there is a server that focuses on pandas-ta/ta-lib? It's related with data science but well having a more focused server could be better 🙂
stone marlin
I don't know of any public servers that do that, but I'd def look at the financial servers (ugh) because, obv, they'd be the ones caring about ta. There's usually a DS room in those, but I haven't been active in any in particular. :'[ sorry.
fiery dust
Thats fine
Thanks for your answer
yeah there are lots of amazing packages out there related with TA, but not discord servers sadly
stone marlin
Yeah --- I've found a lot of TA servers are... very... uh... full of people who just want to "Get Rich Quick" or who are "CEOs" for some suspicious businesses. I didn't get much out of them, but I also don't do finance for a living, haha.
misty flint

stone marlin
lapis sequoia
ya, sure!! <@!199950202252165120>
Something like this. The first part makes the file itself, so that's just a thing for me to show you the technique with.
import pandas as pd
import numpy as np

# Make a toy file.  You don't need to do this part.

# Makes a column with a random numnber in 0, 1, 2.
col_1 = np.random.randint(0, 3, size=100)
col_2 = np.random.rand(100)
df = pd.DataFrame({"col_1": col_1, "col_2": col_2})

print(df.head())

# Save to a file.  Use the "::" separator.
df.to_csv("data.txt", index=False)

# The print output...
   col_1     col_2
0      1  0.024162
1      0  0.479074
2      2  0.102073
3      2  0.793748
4      2  0.494751

# -----------------------

# Pull the data into a dataframe.  Separator is a comma by default.
df_data = pd.read_csv("data.txt", sep=",")

# Get all the values from my "split things by this" column.
col_1_values = df_data["col_1"].unique()

# Cycle through these values and make a file for each.
for val in col_1_values:
    mask = df_data["col_1"] == val
    df_data[mask].to_csv(f"data_{val}.txt", index=False)
You may need to do something slightly more complicated in the second-to-last step, since you're reading a subset of a string. You can use a string method from the str accessor in pandas for this: https://pandas.pydata.org/pandas-docs/stable/user_guide/text.html#string-methods for examples.
tacit basin
lapis sequoia
If you open the files in append mode "a", instead of "w". It should work
stone marlin
It should be okay with "w" as well, since we're not truncating, and they're using newlines You're right, I forgot "w" doesn't go right to the end, and they probably want this instead of appending the start, but either way --- this is a brittle and not-scalable way to solve the problem, unfortunately. Imagine we have to add 100 more if statements. Or 1000. :'[
lapis sequoia
yaaaa
tacit basin
Yeah ifs not scalable. Probably better to use filename to write based on read line content
filetowrite = f"myfile{int(cond[1:])+1}.txt"
Then with open the file and append line to it
stone marlin
Well, also, you're going to have to handle a ton of open files --- it's the number of if-statements under it that's really the concern. But we have a standard way of looking at those, so using dataframe subsetting will handle both all of these: automatic subsetting and automatic naming, as above.
We don't want to build up and accidentally work our way into making something like https://github.com/AceLewis/my_first_calculator.py/blob/master/my_first_calculator.py if we can get around using a ton of if-statements by condensing them down and subsetting that way. :''']
tacit basin
Just two files open at any point in time. One for read and one for append
fiery dust
stone marlin
Yeah --- I've found a lot of TA servers are... very... uh... full of people who ...
me neither but well, I'm working on something I hope that works lmao
stone marlin
Then you're opening and closing an append file every single iter of the for-loop.
tacit basin
Correct
Or keep lines in say lists then save to files
I mean pandas is a great solution
Just listing some options here
stone marlin
While this may work, I strongly discourage the use of this structure for the following reasons:
- One would needlessly need to open and close files each iteration OR one would need to hold a number of potentially large lists in memory while waiting to write. The former requires a ton of file-management, the latter requires us to make a batch-filler OR have a good restart method if our inserts fail.
- A solution using this many conditionals listed explicitly (when they're all fairly standard and based on an index) is a brittle structure which is both annoying to read through and prone to error when writing / updating. It is explicitly not scalable.
For these reasons, and because the pandas solution is short and extremely readable, I'd discourage this. But, it is a potential solution.
tacit basin
If file is large pandas DF will fill up memory too ;)
stone marlin
Ha, in that case, we can expand to Dask using, essentially the same API.
And if the data is bigger still, we can expand to Spark using, modulo the mask, pret much the same API.
tacit basin
Yeah or koalas / spark
stone marlin
But good point.
lapis sequoia
tacit basin
If file is large pandas DF will fill up memory too ;)
my file isnt too big!! hehe..
lapis sequoia
stone marlin
While this may work, I _strongly_ discourage the use of this structure for the f...
thank you, will give this a try for sure... thanks a ton 🙂
tacit basin
lapis sequoia
my file isnt too big!! hehe..
Hopefully not 'bigger' than memory in your machine ;) always can rent AWS VM with ton of ram lol
 plush glacier
i want to train a model but my images are all different sizes and i dont want to convert them to the same size is that possible and if it is how? (i'm using tensorflow and the model should work fine with it)
also pls ping me if you reply to me
with that i mean that i want a tensor with shape 32, None, None, 3 (batch_size, height, width, color_channels)
lapis sequoia
plush glacier
i want to train a model but my images are all different sizes and i dont want to...
You'll need to convert them to the same size
Otherwise the input will be inconsistent
plush glacier
lapis sequoia
Otherwise the input will be inconsistent
for the model it shouldn't be an issue
lapis sequoia
The size of the image literally allocates the dimension size of the input, so if you have different sized images the input sizes will be all different
plush glacier
so it isn't possible to have a tensor with multiple images that have different dimensions?
tired oar
How much data & computer resources do u really need to train a model... it seems like INSANE.
lapis sequoia
plush glacier
so it isn't possible to have a tensor with multiple images that have different d...
No, because you're trying to put together two different dimension matrices
The best you could do is find the biggest one and pad the rest
tired oar
like look at Tesla´s computer cluster.. its insane. Also look at facebook´s computer cluster. Their new computer can do 5 billion billion operations per second
lapis sequoia
The biggest dimension image in your collection is going to have a larger dimension than any other
lapis sequoia
tired oar
How much data & computer resources do u really need to train a model... it seems...
Usually you use virtual computers
If it's a production model
plush glacier
lapis sequoia
The best you could do is find the biggest one and pad the rest
what about ragged tensors
iron basalt
tired oar
How much data & computer resources do u really need to train a model... it seems...
Depends on the model and problem.
lapis sequoia
If you're just using a small dataset for playing around it's fine to do it locally
If you're thinking like self driving cars and whatnot, they're allocated huge VMs on cloud platforms usually
Hence why a lot of data science companies now want AWS/GCP/Azure experience
lapis sequoia
plush glacier
what about ragged tensors
I've never really tried with them
lapis sequoia
plush glacier
what about ragged tensors
My experience of this has either been resizing or padding, but the end result has always been a consistent dimensional tensor
plush glacier
lapis sequoia
My experience of this has either been resizing or padding, but the end result ha...
was it able to take images from different sizes at the end
lapis sequoia
The problem is if you have a (1,1,3) tensor and a (2,2,3) tensor, it's impossible to make it into some variation of (2,x,y,3) tensor without resizing or padding
lapis sequoia
plush glacier
was it able to take images from different sizes at the end
I mean the model had a preprocessing stage with resized/padded
So it could take any size image
But it would invariably modify it to fit properly
tired oar
lol have u seen the new mega computer?
5 billion billion operations per second
yes billion billion
5 Exaflops
plush glacier
i dont want that i would like it to be able to take images that are way large
lapis sequoia
plush glacier
i dont want that i would like it to be able to take images that are way large
How large
plush glacier
the largest image in this dataset is 512,512 so i would have to pad all images to that but if i want to use the model on a 1024x1024 image will it still work without resizing?
it is fully convolutional
lapis sequoia
plush glacier
the largest image in this dataset is 512,512 so i would have to pad all images t...
If you wanted to use 1024x1024 you would have to pad all the other smaller images to become 1024x1024
But resizing is generally recommended over padding
You only tend to use padding if the variation in image sizes is small
Btw 1024x1024 is huge for a CNN if you're running it locally
You'll be training for ages
What is this for? A classification problem?
plush glacier
no it is image segmentation
lapis sequoia
Ah okay
plush glacier
this model https://arxiv.org/pdf/2101.04704.pdf
plush glacier
it seems to have around 122mil trainable prams
plush glacier
lapis sequoia
Why are you so against resizing?
the masks are very accurate and i dont want to blur things or get blurry edges
lapis sequoia
plush glacier
the masks are very accurate and i dont want to blur things or get blurry edges
How many images and what's the general variation?
plush glacier
around 8k images in the train set and 2k in test
lapis sequoia
If the size variation isn't too big you could just pick a subset that have very similar sizes and pad them
plush glacier
some images are 250px² other 512px²
lapis sequoia
Otherwise you might just have to create multiple models for each size
lapis sequoia
plush glacier
some images are 250px² other 512px²
Are they all this variation?
plush glacier
the model should be fine with any input size so i dont want to define it
plush glacier
lapis sequoia
Are they all this variation?
no everywhere in between
lapis sequoia
I mean without looking it I'd just split the actual training into size ranges
It's what I've done with other types of models with this sort of issue
stone marlin
Is it possible to object-detect beforehand, center on the object, and crop to the same size? We're all circling around this idea of making all the image the same size because that's sort of how this stuff usually works.
lapis sequoia
Any size parameters can be defined as a ratio of the input size so it's all consistent
plush glacier
so do like steps of 50 pixels with training
lapis sequoia
plush glacier
so do like steps of 50 pixels with training
Yes, it would take a bit of messing around
tired oar
any cool ML projects u guys have done?
lapis sequoia
So take a range of 100x100-150x150 then pad the smaller ones and train it, then see if the accuracy is decent
plush glacier
so start at 250px then do the ones that are close to 300 (+-25) maybe just mines 50 so it is doable with padding
lapis sequoia
Something like that
tired oar
would be nice to get some motivation and see whats possible
lapis sequoia
plush glacier
so start at 250px then do the ones that are close to 300 (+-25) maybe just mines...
Yes, then set the parameters as a function of the input size, so the window size and whatnot scale accurately
lapis sequoia
tired oar
any cool ML projects u guys have done?
How new are you?
plush glacier
lapis sequoia
Yes, then set the parameters as a function of the input size, so the window size...
the input size of the model is (None,None,None,3)
tired oar
lapis sequoia
How new are you?
i have played around with some machine learning on applications both serverside & client side
lapis sequoia
stone marlin
Is it possible to object-detect beforehand, center on the object, and crop to th...
Yes potentially, but that would be a separate model
tired oar
but never used python for example
 stone marlin
Right, I was thinking that ensemble stuff here might be good, but I honestly have no idea.
lapis sequoia
plush glacier
the input size of the model is (None,None,None,3)
I mean sure, but smashing 100x100px and 1000x1000px inputs together is going to get some weird results
lapis sequoia
tired oar
but never used python for example
I mean I'd suggest Andrew Ngs introduction to ML, that's the go to for beginners usually
It's Matlab orientated rather than Python though
stone marlin
That one is super-mathy, but very good. I think there's a Python version now? I forget.
plush glacier
i will step it for training maybe fully random i dont know i will see (@plush glacier just so i can find this all back tomorrow morning)
lapis sequoia
stone marlin
Right, I was thinking that ensemble stuff here might be good, but I honestly hav...
I'm sure there will be pre-trained models for this though. I'm fairly certain that the GCP auto-ml service has a service similar to that.
 upper spindle
what is wrong with this
 stone marlin
!code
arctic wedgeBOT
Here's how to format Python code on Discord:
```py
print('Hello world!')
```
These are backticks, not quotes. Check this out if you can't find the backtick key.
lapis sequoia
plush glacier
i will step it for training maybe fully random i dont know i will see (<@!427433...
Good luck
stone marlin
Philip, please copy-paste in this format.
plush glacier
lapis sequoia
Good luck
i will need it just like i need some sleep now it is like 1:13
lapis sequoia
upper spindle
what is wrong with this
what's your error
stone marlin
lapis sequoia
I'm sure there will be pre-trained models for this though. I'm fairly certain th...
That's probably true. It seems like a weird thing to not exist --- but trimming / padding images for this specific use-case might be strange. Who knows.
upper spindle
lapis sequoia
what's your error
gives me TypeError: '<' not supported between instances of 'str' and 'datetime.datetime'
lapis sequoia
I mean I generally get anxiety whenever I have to look at the datetime module
upper spindle
tbh it gives me a lot of errors aha
lapis sequoia
upper spindle
gives me `TypeError: '<' not supported between instances of 'str' and 'datetime....
One of your dates is coming through as a string variable rather than a datetime
tired oar
lapis sequoia
I mean I'd suggest Andrew Ngs introduction to ML, that's the go to for beginners...
i hate theory courses. so boring / dry
upper spindle
getting errors gives me anxiety when coding aha
upper spindle
tired oar
i hate theory courses. so boring / dry
agreed
lapis sequoia
tired oar
i hate theory courses. so boring / dry
They are but the courses have projects tied to them where you do various types of model
upper spindle
andrew ng, explaining the maths is so confusing
lapis sequoia
upper spindle
getting errors gives me anxiety when coding aha
Tbh I avoid datetime like the plague
stone marlin
It's easier to debug your things if you copy-paste your code up here in.
lapis sequoia
The datetime object has all sorts of errors
stone marlin
!code
arctic wedgeBOT
Here's how to format Python code on Discord:
```py
print('Hello world!')
```
These are backticks, not quotes. Check this out if you can't find the backtick key.
upper spindle
lapis sequoia
One of your dates is coming through as a string variable rather than a datetime
okay, sure, ill check it out
stone marlin
And also, if you have an error, your full traceback. It could be a million things.
lapis sequoia
I think pandas has a datetime option which is more workable
lapis sequoia
upper spindle
okay, sure, ill check it out
It will probably be the "timedelta" bit
But have a play
upper spindle
lapis sequoia
I think pandas has a datetime option which is more workable
i tried pd.datetime but didnt work
stone marlin
The reason I like to make question askers copy-paste their code in, is so I can paste it into my IDE real quick and debug. I don't want to have to type in the whole thing.
serene scaffold
upper spindle
i tried `pd.datetime` but didnt work
never say that something doesn't work. say what happens instead.
stone marlin
I am now taking the Stel approach of refusing to answer questions with images of code. I get it now. I understand.
upper spindle
sorry everyone, im still getting to grip with public discord gc's
serene scaffold
stone marlin
I am now taking the Stel approach of refusing to answer questions with images of...
for the record, I used to be more accommodating, though I suppose two years of answering questions online wore me down.
upper spindle
when i tried pd.dateime it came out with '<' not supported between instances of 'str' and 'datetime.datetime' and the error said to use the datetime module instead
stone marlin
Haha, no, I am 100% serious --- even spending a little time here trying to answer things, I was spending way too much time re-typing people's images. It's not worth it to me anymore.
I love answering questions, but pls help me out askers.
upper spindle
serene scaffold
for the record, I used to be more accommodating, though I suppose two years of a...
stelercus, whats your background in coding etc, im currently an economics student moving into data science/ML/DL
serene scaffold
upper spindle
stelercus, whats your background in coding etc, im currently an economics studen...
I work as a computational linguist for a large-ish company in Washington DC.
lapis sequoia
serene scaffold
I work as a computational linguist for a large-ish company in Washington DC.
Any advice on choice of layers for a text classification NLP model?
serene scaffold
my programming experience was negligible before 2018. most of what I know, I probably learned since Covid.
serene scaffold
lapis sequoia
Any advice on choice of layers for a text classification NLP model?
what is your current architecture?
I've mostly worked on NER.
lapis sequoia
serene scaffold
what is your current architecture?
One embedding layer and a couple of dense layers
Not really sure where to start for architecture
serene scaffold
you already have an architecture, based on what you just said.
lapis sequoia
It's my first real NLP that isn't being handheld by a course
Is there any standard for text classifiers though?
serene scaffold
what are the classes?
lapis sequoia
I get 70% accuracy either this so far but its hardly good
serene scaffold
what what is the domain?
lapis sequoia
Binary
It's recommending posts for therapy
Flag 1 if they are recommended
Flag 0 if not
serene scaffold
posts in what context?
lapis sequoia
Therapy chatbot basically
serene scaffold
so first of all
this is one of the hardest things to do in NLP
so when you look at the performance of the model, ask yourself, are there even definitive answers here? because if you take two people, they might have different opinions about which posts should be flagged as needing therapy.
and by "might" I mean "they will".
lapis sequoia
This is just based off a predefined kaggle dataset
And they texts seem pretty obvious just looking at them
serene scaffold
sure, but that kaggle dataset just reflects the opinions of the author.
lapis sequoia
serene scaffold
sure, but that kaggle dataset just reflects the opinions of the author.
so I imagine the dataset is king in the actual decision making
since there is always gunna be a decision to be made on middle ground responses
"im not feeling great but il probably be fine" for example
lapis sequoia
serene scaffold
you already have an architecture, based on what you just said.
I do have an architecture but it's very much "made up", I just followed a tutorial. I have no real intuition as to what it "should" be.
urban prism
Hi, do I need to create a separate model for data augmentation?
tired oar
is it possible to make a script that write code in vs code?
neat anvil
yes. That'd be an extension. https://code.visualstudio.com/api/get-started/your-first-extension

Create your first Visual Studio Code extension (plug-in) with a simple Hello World example.
 prime hearth
Hello for MAP method linear regression
Does this only apply to weights
And not bias?
Bias remains same as MLE method for bias and weights?
 desert oar
lapis sequoia
so I imagine the dataset is king in the actual decision making
desert oar
lapis sequoia
so I imagine the dataset is king in the actual decision making
pretty much yes
literally all of statistics and data science is meaningless without a "good" dataset
desert oar
prime hearth
Does this only apply to weights
does what only apply to the weights? if you are talking about "maximum a posteriori" as in bayesian inference, the bias term is also a parameter to be estimated and it has its own marginal posterior

 serene scaffold
@graceful glacier I won't look at the first screenshot (please copy and paste actual text), but the second one would just be return 90 if dfx['started_as'] == 'starter' else 12. not sure why you're adding to an int when there's nothing to accumulate.
 graceful glacier
yea no problem i can copy it. but im sorry i may have been misleading with my original question...
i suppose i have two questions; how can i write the user defined function and can it be called using .assign()
serene scaffold
you can pass a user-defined function to assign. the function needs to take one dataframe and return one series.
graceful glacier
my table look like this...
its on a per player, per game basis
because i am tasked with finding the total minutes for each player

the function i want to right thusly would be like this
def get_minutes(dfx):
    minutes = 0

    # if player is a starter check if he subbed out
    if dfx['started_as'] == 'starter':
        if dfx['player_name'] in df['first player subbing out']:
            minutes = 90 - dfx['first sub time']
        elif dfx['player_name'] in df['second player subbing out']:
            minutes = 90 - dfx['second sub time']
        elif dfx['player_name'] in df['third player subbing out']:
            minutes = 90 - dfx['third sub time']
        else:
            minutes = 90

    # if he was a sub check if he subbed in
    else:
        continue
    return minutes
so instead of a minutes variable i need to make it into a series and return that
or rater make an array and return it as a series
lapis sequoia
hey is anyone here familiar with linear regression
 silent kindle
Привет всем
lapis sequoia
desert oar
does what only apply to the weights? if you are talking about "maximum a posteri...
hey can u help me with smth if youre free rn
im getting very high root mean squared error in my regression question
idk what im doing wrong 🤔
 violet bough
anyone familiar with reading parquet files? running into an error where i'm reading a 282gb parquet file using pyarrow on a 780gb ram machine, getting sigkilled at around 175gb according to dmesg
 vast yacht
seriously, i know the general steps in creating a DS project, but what is a detailed thought process involved in each step in order to get as much insights and depth as possible? i've been struggling for long now 😦
 river maple
i'm trying to download datasets from the OIDv4 toolkit but its giving me this error

are there any other toolkit for downloading huge datasets
tacit basin
lapis sequoia
idk what im doing wrong 🤔
How do you know you should be getting smaller error?
lapis sequoia
tacit basin
How do you know you should be getting smaller error?
rmse should me small right ?
i am getting in thousands
but idk wht im doing wrong
i used linear regression
scaled the train and test data
and my r2 value is 0.9
which is good ig
but idk why my rmse ,mse ,etc are so high
am i supposed to use another algorithm ? it looks like a linear regression problem tho
its for predicting profits
tacit basin
vast yacht
seriously, i know the general steps in creating a DS project, but what is a deta...
Check this checklist https://github.com/ageron/handson-ml/blob/master/ml-project-checklist.md
GitHub
A series of Jupyter notebooks that walk you through the fundamentals of Machine Learning and Deep Learning in python using Scikit-Learn and TensorFlow. - handson-ml/ml-project-checklist.md at maste...
lapis sequoia
can i send you my code ? @tacit basin
tacit basin
lapis sequoia
rmse should me small right ?
That's the goal. Yes
 tacit basin
lapis sequoia
i am getting in thousands
tacit basin
lapis sequoia
i am getting in thousands
What's your dependant variable units and what's the range, mean or median
lapis sequoia
tacit basin
What's your dependant variable units and what's the range, mean or median
mean of the X_train ?
 fervent vale
Hello guys, I have a question about clustering using kmeans in python is it the right place to ask ?
tacit basin
lapis sequoia
can i send you my code ? <@!490342783572246538>
Yes please
fervent vale
I am learning machine learning. Here is the problem : I have a dataset with 9 groups and in each group 120 scores
I want to perform some clustering using kmeans to spot clusters
however
I never tried with 9 different groups so I don't know how to visualize the clusters
Do you advise merging some groups to visualize it ? Or do you have other options ?
tacit basin
lapis sequoia
mean of the X_train ?
Predicted variable
fervent vale
fervent vale
I am learning machine learning. Here is the problem : I have a dataset with 9 gr...
By the way the 120 scores are affected to 120 different IDs. The clustering would help me to spot IDs clusters
tacit basin
fervent vale
By the way the 120 scores are affected to 120 different IDs. The clustering woul...
What are your features?
fervent vale
tacit basin
What are your features?
IDs have scores from 0 to 150
the higher the score the better
and within each group we can see that some IDs have much higher scores than the mass
tacit basin
You can lookup this example for plotting kmeans clusters https://scikit-learn.org/stable/auto_examples/cluster/plot_kmeans_assumptions.html#sphx-glr-auto-examples-cluster-plot-kmeans-assumptions-py

scikit-learn
This example is meant to illustrate situations where k-means will produce unintuitive and possibly unexpected clusters. In the first three plots, the input data does not conform to some implicit as...
fervent vale
ok thanks
but given that I have 9 groups here I will have to plot 9 different plots to visualize it right ?
If I had 3 groups I would have plotted it in 3d
tacit basin
Just one plot with nine groups, each group different color
tacit basin
fervent vale
If I had 3 groups I would have plotted it in 3d
You mean 3 features?
fervent vale
I don't see what would be the axes then
fervent vale
tacit basin
You mean 3 features?
for example I have one group for IDs in the US, another for IDs in India etc
different groups of data
the feature of each ID is only its score
fervent vale
tacit basin
Just one plot with nine groups, each group different color
I want to do this in 3d, the z-axis would be the score but what would be x and y here ?
tacit basin
Could you paste couple of rows of your data?
tacit basin
fervent vale
I want to do this in 3d, the z-axis would be the score but what would be x and y...
If you only have one feature then you only need 1 axis really
fervent vale
Here is an example of the data I have

I wanted to spot clusters between 9 groups like these
tacit basin
fervent vale
And what you want to use to predict clustering?
fervent vale
because their scores are comparable
IDs with high scores belong to cluster X and with low score cluster Y
IDs near the group Average belong to cluster Z
etc
do you see what I mean ?
for example
ID1235 has a high score in group USA
compared to others
same for ID6846 in China
clearly outperfoorming the others
these would belong to a certain cluster I guess
tacit basin
Do you want to use scores for clustering?
fervent vale
exactly
fervent vale
score, the IDs are all different
tacit basin
Or countries too?
tacit basin
If scores only then for example kmeans , and you can easily plot on 1 axis, as you have one feature only.
If countries too then need to find an algo that can work with categorical data
tacit basin
Score is a number
Country is category like Brazil, USA, etc
Gower distance for example for clustering based on numerical and categorical data for example
fervent vale
interesting so you think its possible to run the kmeans considering both categorical + numbers
?
and find clusters considering both features
tacit basin
Not possible with kmeans
fervent vale
ah
do you know another common approach to perform such a task ?
I am looking for algorithms as you suggested but I only find for cat data
not both
tacit basin
I never did it. But seems ppl use Gower Distance for that
fervent vale
Mixed data types they call it I think
I think I have to transform the cat data into Numerical features
tacit basin
If you transform countries to numbers say USA 1 Brazil 2, then there's an implication that Brazil > USA. Then probably this encoding would not work
tacit basin
You can use one hot encoding for countries but then you will have as many features as countries, this will be difficult to plot on 2,3 d if more than two countries
Or you can plot just the most important ones maybe. Once you get importance score for example using PCA
fervent vale
sounds good
wdym by hot encoding please
do you mean like USA = 1, Brazil = 2, China = 3 etc.
tacit basin
scikit-learn
Examples using sklearn.preprocessing.OneHotEncoder: Release Highlights for scikit-learn 1.0 Release Highlights for scikit-learn 1.0, Release Highlights for scikit-learn 0.23 Release Highlights for ...
USA, Brazil, China,Score
0,0,1,67
For example for three countries and score
fervent vale
I just thought about computing the average of scores for each group, so each country could refer to a number which is its average
So I have 2 quantitative features
But I don't know if the encoding would work
because the averages for each country would enable to spot clusters among countries no ?
tacit basin
I mean sure that's also an option. For that you don't need one hot encoding. Depends whats you goal ;)
fervent vale
OK
tacit basin
fervent vale
because the averages for each country would enable to spot clusters among countr...
Sure. Theres also median, mode to consider, and range or standard deviation
tacit basin
There could be outliers. Mean is influenced by outliers
fervent vale
Average, median, range, SD
fervent vale
tacit basin
There could be outliers. Mean is influenced by outliers
yess
fervent vale
fervent vale
Average, median, range, SD
I would have something like 5 features
right ?
is it still possible to plot the clusters in 3d with 5 features
tacit basin
I mean if you want to test statistically if there are diffeences in score for different countries you could use 2 sample t test or whatever it it dor 2+ samples
tacit basin
ANOVA i tjink
tacit basin
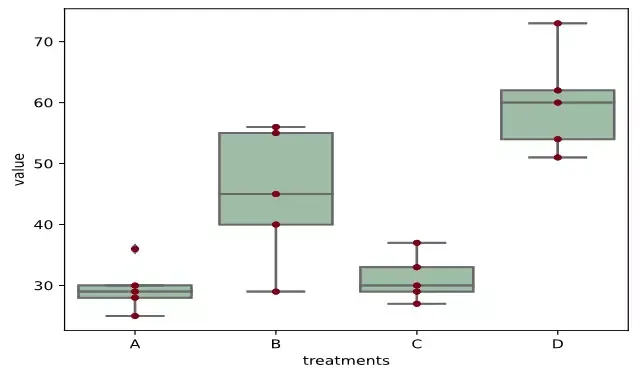
Data science blog
One and two-way ANOVA in Python. This article explains ANOVA model, tables, formula, calculation, multiple pairwise comparisons, and results interpretation
 somber prism
guys i need help, so if the target label contains the target class and its localizations , what type of loss function is a good one ? the thing is MSE will be good for those keypoints and categorical crossentropy will be good for classification. i am bit confused on which one to pick
tacit basin
fervent vale
ah
Box plot for visual analysis
fervent vale
tacit basin
https://www.reneshbedre.com/blog/anova.html
Very interesting I am going to test this, I let you know
thank you very much
for your help
helped me a lot
to understand
 cerulean lynx
Hello! I started learning today a numpy for data science. But when I created a two dimensional array, it output a lists, can someone help me?
prime hearth
@cerulean lynx can post code?
cerulean lynx
prime hearth
<@!715707937619836939> can post code?
"""
a = np.array([[1,2,3,4,5,6,7,8,9], [10, 11,12,13,14]])
"""
This is only my line of code
prime hearth
try np.asarray
cerulean lynx
What is the meaning of asarray?
prime hearth
You can check the documents to learn more about it
However np array should work though
One way to check is just try a.shape
Or a.T
cerulean lynx
The shape only says (2,)

Oh I already got it
The size of each array should be the same hehe
prime hearth
@desert oar yes i mean maximum a posterior as in bayesian infrence
because when i tri to find partial derivative with respect to bias
i get same formulas for when trying to find partial derivative of maximum likelihood estimator for bias
desert oar
prime hearth
i get same formulas for when trying to find partial derivative of maximum likeli...
yeah this is what you get when you use a gaussian prior

 desert oar
oh i see what you're saying
that should be true if you're talking about gaussian regression, yes
intuitively it's because the bias is the mean of the response variable when all the x values are 0
so that shouldn't really change when you apply a different prior
prime hearth
oh okay thanks and yes i using gaussian regression
would it be okay to please ask, how did you get so experience in machine learning
desert oar
masters degree + years of work experience and lots and lots of self study along the way
desert oar
and im pretty inexperienced compared to many
how did you end up self teaching bayesian stuff?
its unusual to see that
prime hearth
i look for open courses from university and also lots of youtube and medium articles
desert oar
hm... how did you set up the equation for d/dω?
prime hearth
but i want to land a ml internship to get experience since many ask for masters or phd.
for map method
desert oar
yeah i honestly dont know how people get entry level jobs in the field nowadays
i got a masters degree and then got hired as a "data scientist" way above my actual level of expertise and got my ass kicked for 2 years
prime hearth
appreciate help, just needed to confirm that the bias remains same to make sure what im showing is accurate
but i really appreciate our help, i want to work as data scientist too or machine learning engineer, i was thinking of trying sharpest minds program since they do mentoring for data science
 unique crystal
Hello I've been struggling for a while now today for something pretty stupid, this is my first week of ML at school
 unique crystal
Just convert the daynumbers to daynames in column day yes
desert oar
unique crystal
Just convert the daynumbers to daynames in column day yes
strftime is definitely the right solution
look in the python docs to see the correct % code to use
!d datetime.datetime.strftime
arctic wedgeBOT
datetime.strftime(format)```
Return a string representing the date and time, controlled by an explicit format string. For a complete list of formatting directives, see [strftime() and strptime() Behavior](https://docs.python.org/3/library/datetime.html#strftime-strptime-behavior).so i ended up making a list and then converting it to a series

but i keep getting this error: ValueError: The truth value of a Series is ambiguous. Use a.empty, a.bool(), a.item(), a.any() or a.all().
is the call correct
 desert oar
graceful glacier
but i keep getting this error: ValueError: The truth value of a Series is ambigu...
desert oar
graceful glacier
but i keep getting this error: ValueError: The truth value of a Series is ambigu...
what is dfx['player_name'] in df['first player subbing out'] supposed to do?
what are you trying to accomplish with that?
also can you please show the full error output? including the "traceback" part
!paste
arctic wedgeBOT
Pasting large amounts of code
If your code is too long to fit in a codeblock in discord, you can paste your code here:
https://paste.pythondiscord.com/
After pasting your code, save it by clicking the floppy disk icon in the top right, or by typing ctrl + S. After doing that, the URL should change. Copy the URL and post it here so others can see it.
desert oar
@prime hearth sorry i didnt get a chance to look at the full paper you sent, but what i will say is this: if you use a uniform prior, the posterior is literally just the likelihood times 1
so i wanted to know what prior you were using
because if its uniform, you should get the exact same result as maximum likelihood
serene scaffold
lapis sequoia
hey is anyone here familiar with linear regression
always ask your actual question, not if someone knows about a topic.
serene scaffold
silent kindle
Привет всем
please use English in this server to the best of your ability.
serene scaffold
graceful glacier
Series operations act on the whole series at once, but you've written this as though you're acting on individual values.
 brazen spire
Would having an internship unrelated to my field be a problem in my CV?
i have an internship in Neural rendering (CNN etc..)
but i want to work in Deep learning applied to physics :/
neat anvil
solid no, not a problem
that seems pretty related, anyway
experience with deep learning in one field is gonna be highly applicable to working in deep learning in another field
 tawdry nova
How to read text files, with different delimiter, say like you are passing multiple files, each has different delimiter and convert into data frame
desert oar
tawdry nova
How to read text files, with different delimiter, say like you are passing multi...
are you asking about pandas? you can set the sep parameter in pandas.read_csv
!d pandas.read_csv
tacit basin
tawdry nova
How to read text files, with different delimiter, say like you are passing multi...
pd.read_csv(file, sęp=",")
arctic wedgeBOT
pandas.read_csv(filepath_or_buffer, sep=NoDefault.no_default, delimiter=None, header='infer', names=NoDefault.no_default, index_col=None, usecols=None, squeeze=None, ...)```
Read a comma-separated values (csv) file into DataFrame.

Also supports optionally iterating or breaking of the file into chunks.

Additional help can be found in the online docs for [IO Tools](https://pandas.pydata.org/pandas-docs/stable/user_guide/io.html).Say like you are passing 20 csv files each files has different delimiter, without changing manually delimiter 20 times, how can I run it
desert oar
tawdry nova
Say like you are passing 20 csv files each files has different delimiter, withou...
do you know the delimiter of each file?
you can have a list of filenames and delimiters
files = [
    ('file1.csv', ','),
    ('file2.tsv', '\t'),
    ('file3.txt', '|'),
]

data = {}
for filename, delimiter in files:
    data[filename] = pd.read_csv(filename, sep=delimiter)
this gives you a dict data mapping filenames to data frames
as you can see this is just "plain python" - no pandas tricks or advanced functionality
tacit basin
tawdry nova
Say like you are passing 20 csv files each files has different delimiter, withou...
Doesn't it infer the delimeter automatically if you don't specify it?
sepstr, default ‘,’
Delimiter to use. If sep is None, the C engine cannot automatically detect the separator, but the Python parsing engine can, meaning the latter will be used and automatically detect the separator by Python’s builtin sniffer tool, csv.Sniffer. In addition, separators longer than 1 character and different from '\s+' will be interpreted as regular expressions and will also force the use of the Python parsing engine. Note that regex delimiters are prone to ignoring quoted data. Regex example: '\r\t'.
 maiden shore
Would it not also be possible to write a function that opens a file and returns the delimiter character?
tawdry nova
desert oar
```python
files = [
('file1.csv', ','),
('file2.tsv', '\t'),
('file3...
This one, you can do when you know what is the delimiter, but say each time new file comes in, without manually checking the files, how to run it
fiery dust
candles_df = pd.read_csv('./fixtures/example.csv')
candles_df['Date'] = pd.to_datetime(candles_df['Date'])

candlestick_data = pytrendline.CandlestickData(
  df=candles_df, # <== Here
  time_interval="1m",
  open_col="Open",
  high_col="High",
  low_col="Low",
  close_col="Close",
  datetime_col="Date"
)
Can someone please tell me if candles_df is a dataframe or a CSV? I tried using both .csv and df and I had to different tracebacks.
 dim palm
fiery dust
```py
candles_df = pd.read_csv('./fixtures/example.csv')
candles_df['Date'] = pd...
dim palm
fiery dust
```py
candles_df = pd.read_csv('./fixtures/example.csv')
candles_df['Date'] = pd...
it's a panda dataframe
 dim palm
np putin aways help his friends 🇷🇺
fiery dust
🤣
arctic wedgeBOT
1. Follow the Python Discord Code of Conduct.
neat anvil
the political joke, not the question
dim palm
neat anvil
the political joke, not the question
excuse me i didn't want to offense you
neat anvil
it doesn't offend me personally, you misunderstand
but this server has a code of conduct
dim palm
ok
serene scaffold
It's probably a bad time to be making jokes about the Russia/Ukraine situation, but let's just move on.
plush glacier
i'm doing image segmentation so i have a dataset for color images and masks but when i import them with tf.keras.utils.image_dataset_from_directory i can't train the model with them so any ideas on how i can get the images to x for the img and y for the masks
urban prism
I'm saving two numpy arrays with the shapes of (22000,256,256,3) and (22000,256,256,1) but cannot use np.load(file) since my kaggle notebook dies with the error message of Your notebook tried to allocate more memory than is available. It has restarted. Any recommendations? Can I load it in chunks somehow to avoid this?
serene scaffold
urban prism
I'm saving two numpy arrays with the shapes of (22000,256,256,3) and (22000,256,...
what file type?
urban prism
.npy
I don't have to save it but it seems like memory can't handle processing/loading them
serene scaffold
@urban prism https://numpy.org/doc/stable/reference/generated/numpy.load.html
do mmap='r'
that will return a memory-mapped array, which will only load the slices that you're using into memory
though if what you're doing requires the whole array to be in memory anyway, that's just kicking the can down the path.
urban prism
The arrays are my images and their masks
height and width=256
22k is the amount of them
So I think it's gonna cause the same issue while trying to split them into train/test/dev
serene scaffold
try it and see, I guess. even if you divide the array into train/test/dev, it might not actually load the values into memory until you try to do math with them.
 junior lintel
Do you guys think a 14 year old gifted kid would be able to learn ML (sorry for the brief question)
urban prism
Sure
junior lintel
Ok thanks
plush glacier
junior lintel
Do you guys think a 14 year old gifted kid would be able to learn ML (sorry for ...
it doesn't matter if the kid is gifted or not
junior lintel
Cool that makes it even easier then
plush glacier
although motivation does matter
junior lintel
Yeah ik thanks guys
junior lintel
junior lintel
Do you guys think a 14 year old gifted kid would be able to learn ML (sorry for ...
I was just asking for a friend btw
plush glacier
plush glacier
i'm doing image segmentation so i have a dataset for color images and masks but ...
with this i mean i have 10k images that are a normal color image and 10k that are a mask to those color images how can i make a single array or all those images (all images have the same size so 256,256,3 for color and 256,256,1 for the masks) i want the color images in a array named x and the masks in a array named y but i dont want a array of arrays if that makes sense
 strange zealot
can anyone help me with NEAT algorithm?
urban prism
serene scaffold
<@!710999172597284884> https://numpy.org/doc/stable/reference/generated/numpy.lo...
Failed while trying to generate train and validation data
X_train, X_test, Y_train, Y_test = train_test_split(X, Y,
                                                    shuffle=True,
                                                    random_state=265,
                                                    test_size=0.1)
del X, Y
X_train, X_val, Y_train, Y_val = train_test_split(X_train, Y_train,
                                                  shuffle=True,
                                                  random_state=265,
                                                  test_size=0.1)
Here
urban prism
What may be the downside if I do shuffle=False?
(Other than it being possibly biased)
tacit basin
fiery dust
```py
candles_df = pd.read_csv('./fixtures/example.csv')
candles_df['Date'] = pd...
you can always type
type(candles_df)
in repl or notebook, it will tell you 🙂
desert oar
urban prism
*(Other than it being possibly biased)*
it's not just a matter of "bias", it's a matter of the sample being non-random and therefore not valid for any of the theoretical properties of a train/test split
tacit basin
plush glacier
i'm doing image segmentation so i have a dataset for color images and masks but ...
just use fastai 🙂 just joking, but as i can't tell much about keras, you can find tutorial on image segmentaiton here with fastai: https://docs.fast.ai/tutorial.vision.html#Segmentation
Using the fastai library in computer vision.
graceful glacier
serene scaffold
Series operations act on the whole series at once, but you've written this as th...
ok thanks for the feedback. i have pseudo coded a plan where i use a nested np.where() instead of the if statments
still trying to wrap my head around how custom functions work in relation to pandas
upper spindle
if anyone has used the VADER package before, is this the right VADER sentiment file i am importing from nltk.sentiment.vader import SentimentIntensityAnalyzer, as my daily average sentiments is positive and always a low positive ~ 0.2-0.3
graceful glacier
serene scaffold
you can pass a user-defined function to assign. the function needs to take one d...
i suppose i still have one question however. the only acceptance criteria for the series i return back from the UDF is that its the same length as the original df right?
serene scaffold
I'm not sure what you mean by "the UDF"
tacit basin
urban prism
```py
X_train, X_test, Y_train, Y_test = train_test_split(X, Y,
...
any possibility of getting aws or so vm with crazy amount of ram 🙂
graceful glacier
user defined function. so in this case the custom function, get_minutes(), that i made
tacit basin
urban prism
```py
X_train, X_test, Y_train, Y_test = train_test_split(X, Y,
...
or use dask for np arrays
from dask_ml.model_selection import train_test_split
Nope, not for now at least
urban prism
tacit basin
or use dask for np arrays
```py
from dask_ml.model_selection import train_test_s...
Will check it out, thank you
 frozen hedge
does anyone know how to use kronecker delta or levi civita symbols with autograd / jax?
graceful glacier
thanks alot @serene scaffold the execution went exactly as planned
i just have to double check to see if the data is correct now
urban prism
When I try to use dask_ml in a kaggle notebook, it gives me an import error saying
ImportError: cannot import name '_is_pairwise' from 'sklearn.base' (/opt/conda/lib/python3.7/site-packages/sklearn/base.py) any ideas?
 frank quiver
I am having data of numpy arrays with shape (400, 46, 55, 46) here 400 are the samples and 46,55,46 is the image.350 samples for training and remaining 50 for validation
np.max(data[1]), np.min(data[1]), len(data[1])
Output: (2941.0, -43.0, 46)
Now i want to load the data into pytorch model for that i need to write a custom data loader as i am new to pytorch i am finding hard to write can someone help
lapis sequoia
Greetings, need to read data from csv using panda. issue is when our manufacturer sends csv with headers and 1 more row of just commas => which really means no data sent. how can I handle that so I can ignore rows with just commas. I used useColumns trick to see what is in a row of just commas and it returns NaN. Just wondering what is my next step to ignore this in such things as count of valid rows or files that we need to ignore? Thanks
serialnumber,shipdate
,,
sample data ^
serene scaffold
@lapis sequoia the read_csv function should interpret those empty values as NaN, and you can then use the dropna method of DataFrames to drop rows that contain a NaN
lapis sequoia
thanks @serene scaffold ! will check that out.
df.dropna(subset=['serialnumber'])
beautiful!
serene scaffold
You can also chain the call to dropna right on the read csv call, if you know that you never want those rows.
lapis sequoia
let me soak in dropna first 🙂 give me 5min till my synapses stop jittering from dropna
serene scaffold
Accept dropna into your heart 
lapis sequoia
yes Father
serene scaffold
!otn s pope
arctic wedgeBOT
Query results
• pope-mod-man-btw-enters-the-chat
• prolem-runing-compoper
• 𝖯ope-𝖲telercus-𝖵𝖨𝖨𝖨
 prime hearth
hello, sorry not sure if this is right channel
but would appreciate if someone can take quick look even , would appreciate any feedback on my article for machine learning:
lapis sequoia
looks nice to me @prime hearth
maybe provide the data set not as an inline array but maybe an actual file and also the the real deal notebook with eraser is cute but maybe port that into something else?
like you did with the bayesian attachment
prime hearth
oh thanks so much! Yeah i agree it would be a lot nicer.
lapis sequoia
just my humble input.
prime hearth
yeah that math part
its a lot of pain to write it on nice format
so i used paper, but il look for another way to do this hopefully
lapis sequoia
🙂 I love it on paper but just to give it next level pro
this also ^

if you are able to find something like this
https://www.symbolab.com/
Symbolab: equation search and math solver - solves algebra, trigonometry and calculus problems step by step
 frosty flower
I was just thinking
When you create training data, you should represent your data as compactly as possible, right?
Say I want to use some data to represent a direction in a 2d space, it's better to use pi/4 instead of a vector (1, 1) to represent the north-east direction, is that right?
Because if I use the vector (1, 1), I'm not only packing the info of the direction, but also including a vector norm, which I don't (and the model shouldn't) care about
Similarly, if I want to collect training data that includes rotations in 3d space, it should better be in quaternion (4 numbers) instead of two vector3's (6 numbers), right?
Because if the representation is not compact, it almost definitely means there's some garbage in the data
serene scaffold
what do you mean by "garbage"?
frosty flower
serene scaffold
what do you mean by "garbage"?
Like the norm info in the 2d vector example
serene scaffold
we usually talk about "dense" and "sparse" representations. there are times when sparse representations can't be avoided for what you're trying to represent for a given model algorithm.
frosty flower
Ahh yea I was looking for terms that formalizes this idea
So I guess "dense" and "sparse" are the keywords I'm looking for
serene scaffold
well, I'm not sure that that terminology really applies to representing something as one float vs two ints
 safe elk
Yeah usually i hear that in arrays
serene scaffold
"sparse representations" usually means that there's a lot of 0s.
keep in mind: if you represent a direction in terms of radians, the algorithm will see 0 and 6.2 as far apart, even though they're almost the same direction.
I'm not really sure how directions are usually represented as features.
frosty flower
serene scaffold
keep in mind: if you represent a direction in terms of radians, the algorithm wi...
Ah. Good point. Some modular arithmetic should help tho, doesn't sound like too big an issue
safe elk
frosty flower
Say I want to use some data to represent a direction in a 2d space, it's better ...
Compact representation may mean improved performance...less numbers to process
serene scaffold
safe elk
Compact representation may mean improved performance...less numbers to process
well, if your algorithm continues until the cost is below a certain threshold, and the features are represented so poorly that this never happens, that would be pretty bad performance as well 
safe elk
frosty flower
I was just thinking
I think it is ok if your model doesnt require the extra info why add it in ...use the representation that is suitable
frosty flower
safe elk
I think it is ok if your model doesnt require the extra info why add it in ...us...
Because the representation with useless info is sometimes easier to work with
It's not so obvious when it's a 2d vector versus a real number for radiant
But a quaternion is quite a lot harder to work with than two 3d directional vectors, when the task is to represent a rotation in space
safe elk
frosty flower
But a quaternion is quite a lot harder to work with than two 3d directional vect...
Well at least there are libraries but yeah imaginary numbers https://quaternion.readthedocs.io/en/latest/
None
safe elk
frosty flower
Because the representation with useless info is sometimes easier to work with
True lol
frosty flower
safe elk
Well at least there are libraries but yeah imaginary numbers https://quaternion...
Oh good to know
safe elk
A fully featured python module for quaternion representation, manipulation, 3D rotation and animation.
Looks like fun but havent tried

 safe elk
Lol at least there are several but choose wisely
Built into Matlab
A quaternion is a four-part hyper-complex number used in three-dimensional rotations and orientations.
The material there explains the advantages of a quaternion
safe elk
frosty flower
The existence of libraries for it proves that it's not easy to work with
Lol i made my own linear algebra lib for fun I think there is complexity everywhere but libraries saves us from that ..good to have them as long as you comprehend what they do
fiery dust
Guys, I'm interested in learning Pandas and more things to work with finance and technical analysis for financial markets. Any docs or video series you've seen that could educate me about this? Thanks in advance 🙂
serene scaffold
fiery dust
Guys, I'm interested in learning Pandas and more things to work with finance and...
I recommend the kaggle pandas tutorial. More generally, you can learn-by-doing. always avoid the temptation to use a for loop or the apply method, and if you do that, you'll probably become familiar with what functionality pandas affords you.
fiery dust
serene scaffold
I recommend the kaggle pandas tutorial. More generally, you can learn-by-doing. ...
Do you recommend a specific video for that?
serene scaffold
fiery dust
Do you recommend a specific video for that?
I have never watched a video about pandas.
serene scaffold
mostly learn-by-doing when I was trying to crunch numbers for a project.
fiery dust
right
neat anvil
I’d highly recommend giving at least a quick read through the entire pandas user guide https://pandas.pydata.org/pandas-docs/stable/user_guide/index.html
fiery dust
note
neat anvil
It’s fantastic at explaining the right way to do some of the more complicated things you can do with pandas.
serene scaffold
fiery dust
right
I made this and all the other tables with dozens of pandas operations ending in .to_latex() https://www.sciencedirect.com/science/article/pii/S1532046421002999?dgcid=coauthor#t0015
fiery dust
neat anvil
It’s fantastic at explaining the right way to do some of the more complicated th...
thanks I got it in a new tab I'll go through it tomorrow now I'll sleep 😄
fiery dust
serene scaffold
I made this and all the other tables with dozens of pandas operations ending in ...
Okay also opened this, I'll go through this for sure, anxious to learn more about pandas 😛
also this? https://www.kaggle.com/learn/pandas
Solve short hands-on challenges to perfect your data manipulation skills.
serene scaffold
yes, I think so
fiery dust
👌
 glacial thunder
hello any good free online class with cert about data structrues and algo?
serene scaffold
glacial thunder
hello any good free online class with cert about data structrues and algo?
That's a question for #algos-and-data-structs, not this channel.
 wispy trout
serene scaffold
wispy trout
Artbreeder.com
wispy trout
serene scaffold
wispy trout
Artbreeder.com
what?
wispy trout
It's a site that makes art using ai
 exotic thicket
Hello guys would someone mind helping me to take a course on computer vision and image processing fundamentals. Has anyone studied this course plz share resources
graceful glacier
is there anyway i can extract the three parts of the following string with one line of code?
1Alisson (G)
its a part of this column
 serene scaffold
@graceful glacier what are the three parts
graceful glacier
jersey number, player name, position
serene scaffold
You can use a regular expression with match groups
 lunar ember
does anyone know any way of stitching frames that i capture from my evaluations after my agent is done training?
tawdry nova

Stack Overflow
For the above I am unable to import it in databricks,
From maven repo, groupId: com.databricks
,artifactId: spark-xml_2.12,version: 0.14.0 were installed, however still I'm getting XML error
Java i...
tawdry nova
tawdry nova
https://stackoverflow.com/q/71223843/15684150
I had similar question anyone knows how to make it work
 plush orchid
Data Science Question
Hi everyone. I have a binary classification model that has properties min_loss and max_loss. Example: min_loss=0.02 and max_loss=0.5. Part of the algorithm of the model is that it automatically creates a threshold value in between those ranges. Example: threshold=0.08. Given an unknown input, the model produces a loss value loss. The way the the model predicts is that if loss > threshold then prediction = -1 else if loss <= threshold then prediction=1. Since the threshold is automatically computed, how might a function look like if I want it to produce probabilities similar to predict_proba of sklearn? Ideally, I want the predict_proba function to produce something like [0.4, 0.6].
somber prism
guys i have a questions, ik sparse or categorical cross entropy is used for multiclass targets but what if i have lots of landmarks/keypoints and a class label , for those landmarks mse would be preferable but it also has class label ranging from [0-n_classes]. so my question is whether mse would be preferable when the target contains [landmarks and n_classes one hot encoded] or [landmarks and just n_classes]
somber prism
plush orchid
Data Science Question
Hi everyone. I have a binary classification model that ha...
after training/fitting the model with the trained data just call model.predict_proba(x_test) and it will output the way you asked for and finally if you like to manually change the threshold for eg to 0.6 then you can simple do this ```
prob = model.predict_proba(x_test)
-> outputs : [.4, .6] for class [0, 1]
thresh = 0.6
pred = prob[:, 1] > thresh```
tacit basin
lunar ember
does anyone know any way of stitching frames that i capture from my evaluations...
Stitching images? Opencv or pil or numpy should do the trick
plush orchid
somber prism
after training/fitting the model with the trained data just call model.predict_p...
But this is a custom algorithm. It doesn't have a predict_proba method right now. I was able to implement a predict but it will just be 1 or 0. Since the model is based on a threshold and a range min_loss and max_loss, I was wondering if there's a way to frame it as a probability.
somber prism
plush orchid
But this is a custom algorithm. It doesn't have a `predict_proba` method right n...
its easy, so if its a binary class classification then just get the linear output and apply softmax function on it , that will output the single probability
plush orchid
somber prism
its easy, so if its a binary class classification then just get the linear outpu...
But the output itself is already either 1 or -1 depending on its position above or below the threshold within min_loss and max_loss
I was actually thinking something like t = threshold - min_loss / max_loss - min_loss then if above threshold then [t + (pred - t) / (max_loss - t), 1- ( t + (pred - t) / (max_loss - t) )]. If below threshold then just the reverse of it.
I dunno if makes sense.
river maple
i downloaded training datasets using oid toolkit but there isn't enough for validation dataset. Can i take some images from the training dataset and paste it to the validation dataset?
 hasty grail
somber prism
guys i have a questions, ik sparse or categorical cross entropy is used for mult...
hasty grail
somber prism
guys i have a questions, ik sparse or categorical cross entropy is used for mult...
This case is a bit similar to object detection. In general, the loss is expressed by two terms: the classification loss (cross entropy in your case) and the localization loss (mse). You can assign weights to one of the terms (you can have a weight for both but the second one would be redundant) and combine them together (e.g. adding the two terms together, or taking the maximum)
Keep in mind how backprop would behave with respect to your loss function
 vivid agate
Hello everyone I am very new to discord and also I have just started exploring the machine learning segment of python and I am very excited to learn data science and machine learning and all these good stuffs.
I hope I would be able to make good friends here...! ❤️
urban prism
I cannot input my data to the model since ìt's dask array in chunks so: AttributeError: 'tuple' object has no attribute 'rank' which means it's a generator and type(data) outputs generator as well.Though I cannot use tf.data.Dataset.from_generator(my_data(x_train, y_train, batch_size=50)). It returns TypeError: generator must be callable. What should I do?
 mighty finch
which is the best resource to learn ML?
lapis sequoia
YouTube
 minor elbow
the coursera courses are good
river maple
I have a question regarding google colab. Do I have to run all the code everytime i exit out of the browser?
tacit basin
mighty finch
which is the best resource to learn ML?
Personal preference. I like Practical Deep learning for coders with pytorch, fastai. Course.fast.ai
Ml with Sci-kit learn is very good too. https://www.fun-mooc.fr/en/courses/machine-learning-python-scikit-learn/
FUN MOOC
Build predictive models with scikit-learn and gain a practical understanding of the strengths and limitations of machine learning!
mighty finch
tacit basin
Personal preference. I like Practical Deep learning for coders with pytorch, fas...
ya but that’s only using scikit.. what if i want to learn more than that.. for example K- means clustering , hierarchical clustering, PCA and all sorts of different libraries like numpy,pandas,matplotlib etc
tacit basin
mighty finch
ya but that’s only using scikit.. what if i want to learn more than that.. for e...
There a good book on pandas. Effective Pandas by Matt Harrison
tacit basin
mighty finch
ya but that’s only using scikit.. what if i want to learn more than that.. for e...
A lot of ppl like Andrew Ng machine learning course. But it wasn't for me for example.
mighty finch
Is there a book in which it covers all the topics of machine learning? or any course?
tacit basin
mighty finch
ya but that’s only using scikit.. what if i want to learn more than that.. for e...
Depends how deeply you want to learn each ot the topics you mentioned.
tacit basin
mighty finch
Is there a book in which it covers all the topics of machine learning? or any co...
I don't know a course that covers all. You have many different domains, ml, deep learning, computer vision, NLP, tabular, recommender systemz, time series forecasting, Bayes methods, visualisations, different libraries etc etc
Distributed like dask, modin, ray. GPU accelerated stuff like Numba etc. Jax which is quite new lib for autografd, functional style.
In computer vision alone you will have image classification, multi classification , segmentation, object detection, image generation, a lot
Plus python software engineering skills
This is a good book to start with Alan Downey's Data Science https://allendowney.github.io/ElementsOfDataScience/README.html
mighty finch
Okay thanks a lot
 mint palm
difference in heuristic, Greedy??
somber prism
hasty grail
This case is a bit similar to object detection. In general, the loss is expresse...
so what if one hot encode all those classes alone so now ill have only localization keypoints and ohe classes, now will it be ok to only use mse as my loss func ?
neat anvil
somber prism
so what if one hot encode all those classes alone so now ill have only localizat...
It sounds like you may want to write a custom loss function that allows you to custom balance getting the location right and getting the class right at the same time. That, or consider trying to use two separate models in a pipeline.
 foggy anchor
hi people, how are you today. I hope you are doing well 🙂
somber prism
neat anvil
It sounds like you may want to write a custom loss function that allows you to c...
https://www.kaggle.com/allexmendes/asl-alphabet-synthetic, this is the dataset i am planning to work on
somber prism
somber prism
https://www.kaggle.com/allexmendes/asl-alphabet-synthetic, this is the dataset i...
it has only localizations but i am adding extra classes to an output in order to classify the signs
foggy anchor
I'm looking for a course that gives me the mathematical and programming skills I will need for deep learning. I want to apply machine and deep learning techniques for natural language processing as a career path
neat anvil
somber prism
it has only localizations but i am adding extra classes to an output in order to...
Cool. Sounds like a ton of work, have fun! I’m not an expert in deep learning for image processing so I can’t help much more than my one somewhat naïve comment
foggy anchor
raymond, what are you specialized in?
somber prism
neat anvil
Cool. Sounds like a ton of work, have fun! I’m not an expert in deep learning fo...
np
neat anvil
foggy anchor
I'm looking for a course that gives me the mathematical and programming skills I...
This is IMO the best starting course for getting into machine learning. Really walks you through the basics but knowing those makes a lot of the complex stuff make more sense. https://www.coursera.org/learn/machine-learning

Coursera
Learn Machine Learning from Stanford University. Machine learning is the science of getting computers to act without being explicitly programmed. In the past decade, machine learning has given us self-driving cars, practical speech recognition, ...
 pastel valley
yo can i split this generator when i fit the model?
like 80% train 20% validate?
also how do i test the model?
somber prism
pastel valley
like 80% train 20% validate?
depends on the dataset
foggy anchor
Cool raymond, thanks for the recommendation^^
pastel valley
 somber prism
pastel valley
like 80% train 20% validate?
somber prism
pastel valley
like 80% train 20% validate?
if you got around 100k samples then 98% train, 1% valid, 1% test would be preferable
pastel valley
somber prism
if you got around 100k samples then 98% train, 1% valid, 1% test would be prefer...
how to split it?
neat anvil
foggy anchor
raymond, what are you specialized in?
Im kind of a jack-of-all-trades in data science and software engineering at this point in my career. I’ve done a few years of data science work in three different industries (pharma, fintech, and chemistry), and a few years of full-stack developer work running basically everything (that involves running custom code) at a startup.
pastel valley
i already have separate data for testing
i prefer to split this training samples for validation and training?
is it on model.fit()?
hasty grail
somber prism
so what if one hot encode all those classes alone so now ill have only localizat...
mse can't really be used for classification loss
it won't perform well
foggy anchor
cool raymond, that's awesome. you are kid of a master for me
somber prism
pastel valley
how to split it?
there are lib but usually if its an image data, ill only get the image path and along with the output class to pd dataframe and split it using sklearn.model_selection train_test_split and then send it to keras image generator to get it seperately for training and validation ( this one is pretty easy to do )
somber prism
hasty grail
mse can't really be used for classification loss
but for the yolo model mse is used for the classification
isnt it ?
foggy anchor
I was working in a web dev start-up with a friend, but then I decided I didn't want to be full-stack dev, it isn't simply my thing
hasty grail
somber prism
isnt it ?
I believe there is some weighting between the classification and localization loss
neat anvil
somber prism
if you got around 100k samples then 98% train, 1% valid, 1% test would be prefer...
I really don’t think you can offer this specific of advice without knowing more context on the dataset @pastel valley is working with.
somber prism
hasty grail
I believe there is some weighting between the classification and localization lo...
the weightings you are referring to isnt the wx+c one isnt it ?
somber prism
neat anvil
I really don’t think you can offer this specific of advice without knowing more ...
hmm i see, but the general case is you dont need to split lot of samples from training data to validation if it have more than 100k data , but yeh it depends on the data
hasty grail
somber prism
the weightings you are referring to isnt the wx+c one isnt it ?
no, I mean assigning weighting terms to the losses
e.g. classification_loss * alpha + localization_loss
if that is what you mean by wx + c then I guess...?
pastel valley
somber prism
hmm i see, but the general case is you dont need to split lot of samples from tr...
i mean can i automatically split my training samples to be train,valid samples during training?
oh i think its here
 somber prism
pastel valley
oh i think its here
somber prism
pastel valley
oh i think its here
yeh you just have to specify validation data split in the range 0.0 - 1.0
pastel valley
oh so instead of specifying validation_data i just put validation split then it will automatically get the validation data on the training samples? do i understand it right?
somber prism
hasty grail
e.g. `classification_loss * alpha + localization_loss`
so how can i choose the right alpha (weight ) ??, have to let the model decide that too ?
somber prism
pastel valley
oh so instead of specifying validation_data i just put validation split then it ...
yehs
pastel valley
oh nice nice
neat anvil
somber prism
so how can i choose the right alpha (weight ) ??, have to let the model decide t...
You’d need to run Hyper parameter optimization , including alpha. Edit; And by run in this specific case I mean you’d probably have to do it manually and inspect the results yourself, since you’re changing your loss function and can’t rely on it to tell you which setting is better
pastel valley
btw now how can i evaluate the model using my separated testing data also genereted with flow_from_directory
hasty grail
somber prism
so how can i choose the right alpha (weight ) ??, have to let the model decide t...
you probably need to do some hyperparameter tuning
somber prism
i see
so is there anyway i can use 2 loss funcs just like you said in order to add them in tensorflow/keras or i have to use pytorch for this one
?
neat anvil
In both PyTorch and tensorflow you can define your own loss function. I haven’t done it in a few years but I remember it being pretty easy
neat anvil
somber prism
so how can i choose the right alpha (weight ) ??, have to let the model decide t...
Additional note- because you are combining classification and image segmentation tasks, you will also need to define your own normalized accuracy metric. It’d probably be best to do this first.
Once you do that, then you can automate the hyper parameter optimization including your custom loss function parameters
pastel valley
yo i did split and data for train and validate now after i trained it i can see the performance of the model on validation set right?
now how can i see the performance of the model on a completely new samples? the test set
test set is the real deal right?
serene scaffold
pastel valley
test set is the real deal right?
all the partitions of the dataset (train/test/validation) are real (assuming that the dataset itself is real).
pastel valley
serene scaffold
all the partitions of the dataset (train/test/validation) are real (assuming tha...
i mean the train validation set are just being inputed to the model repeatedly ? or am wrong? so the evaluation is for them is not so good becuase the model is seeing the same images so if i try the model to images which is not yet known by the model maybe i can get the absolute evaluation of the model? or am wrong? it confuse me hahaha
here i am training using the train and validation split and i get good outcome i guess but if i try it to images that is new maybe the performance will change right?
 serene scaffold
pastel valley
i mean the train validation set are just being inputed to the model repeatedly ?...
serene scaffold
pastel valley
i mean the train validation set are just being inputed to the model repeatedly ?...
The validation data is for adjusting the settings of the model; you can ignore that for now.
just focus on the train and test data. the training data is used to train the model, and the test data is used to see if the model is correct.
pastel valley
oh if i dont plan on optimizing the model then i just dont use validation? its like i just train the model then i already just want to see how good it is by using test set? is it how ?
neat anvil
You could do that, yes
pastel valley
how can is check the performance of the model on test data? is it here?
 neat anvil
w/o optimization you'd have to be exceptionally lucky to get a well-performing model, tho
pastel valley
instead of validation i just use the test set on fit()?
serene scaffold
you never fit with the test data; that's basically giving away the answers.
neat anvil
no. One you've fit the model, you use it to predict on the test set, then compare it's predictions to what you know are the real answers
pastel valley
neat anvil
w/o optimization you'd have to be exceptionally lucky to get a well-performing m...
i want to compare 2 identical model performances based on the data they are trained with so its like comparing which ones learn better best on the book they read
pastel valley
serene scaffold
you never `fit` with the test data; that's basically giving away the answers.
so i train without validation data? l
pastel valley
neat anvil
no. One you've fit the model, you use it to predict on the test set, then compar...
will it be implemented manually?
neat anvil
You can find in all the big ML libraries scoring functions to make evaluation on the test set easier.
or you can do it manually.
pastel valley
i use keras do you have word in mind that i can search?
so this values are the performance of the model on the splitted validation data from training data?
 neat anvil
here's a blog with some resources. https://neptune.ai/blog/keras-metrics

Keras metrics are functions that are used to evaluate the performance of your deep learning model. Choosing a good metric for your problem is usually a difficult task. you need to understand which metrics are already available in Keras and tf.keras and how to use them, in many situations you need to define your own custom metric because the […]
pastel valley
also the validation data are just inputed into the model every after epochs right?
neat anvil
"metrics" is usually the keyword used to describe functions to calculate things like accuracy, precision, etc. So if you search around for "keras metrics test set" i'm sure you'll find something relevant to what you're looking for
 vast lily
hey is there anyone work with me on the project of NLP(natural language processing) if yes please pin me out
pastel valley
neat anvil
"metrics" is usually the keyword used to describe functions to calculate things ...
if i do it manually is it like looping true may test set and comparing the output of the model to my listed output then recording the tn, fn, tp, fp and from there i can compute the other metrics?
btw how the heck should i know which class is this?

is it left to right on my directory top to bottom?
i used flow_from _directory
 neat anvil
pastel valley
if i do it manually is it like looping true may test set and comparing the outpu...
neat anvil
pastel valley
if i do it manually is it like looping true may test set and comparing the outpu...
pretty much, yeah
neat anvil
pastel valley
btw how the heck should i know which class is this?
read the documentation for the predict function carefully
 floral valley
anyone experienced or understands arima and autocorrelations?
serene scaffold
floral valley
anyone experienced or understands arima and autocorrelations?
idk what that is, but it's best to just ask your actual question, not if someone knows about a topic.
somber prism
pastel valley
test set is the real deal right?
wym by real lol ?
floral valley
well i have a autocorrelation diagram and cant figure out how many lags i need for partial autocorrelation. the videos say when it crosses the critical value but it does it numerous times

im attempting to do arima modelling
pastel valley
somber prism
wym by real lol ?
something like realistic performance maybe? hahaha base on my understanding the evaluations on validation set is not that accurate because its predicting images thats its being trained
btw what is this model? did i get lucky ?
 neat anvil
pastel valley
something like realistic performance maybe? hahaha base on my understanding the ...
neat anvil
pastel valley
something like realistic performance maybe? hahaha base on my understanding the ...
your model should not be being directly trained on images in the validation set. Read the documentation on that train function carefully to ensure that it's not.
validation sets are data unseen by the model used for the purpose of determining good hyperparameters for training.
somber prism
neat anvil
your model should not be being directly trained on images in the validation set....

Data Science Stack Exchange
Validation-split in Keras Sequential model fit function is documented as following on https://keras.io/models/sequential/ :
validation_split: Float between 0 and 1. Fraction of the training dat...
@pastel valley
your model is overfitting
pastel valley
neat anvil
your model should not be being directly trained on images in the validation set....
i get the validation set by spliting 20% from the training samples

this means that the validation set is hidden on the model?
but each epoch the models is evaluated right?
is it the same validation used?
pastel valley
somber prism
https://datascience.stackexchange.com/questions/38955/how-does-the-validation-sp...
oh if i understand it correct then my validation set is separated from the train set before training and is the same for every epoch
pastel valley
i split it using
 somber prism
and then all you have to do is specify validation_data = (valid_x, valid_y)
neat anvil
somber prism
your model is overfitting
not to continuously be a downer here, but you also cannot claim this to be so without quite detailed knowledge on the dataset @pastel valley is working with
somber prism
pastel valley
i split it using
there's another reason why i would use sklearn train_test_split, cuz it contains a param called stratify which will split the classes evenly
pastel valley
this means that a fraction for train set is being split and it is what it is every epochs right?
 somber prism
neat anvil
not to continuously be a downer here, but you also cannot claim this to be so wi...
somber prism
neat anvil
not to continuously be a downer here, but you also cannot claim this to be so wi...
its ok i am an amateur too