#data-science-and-ml
1 messages · Page 377 of 1
 shut trail
its just an old favorite number for a lota nerds 😄
 odd meteor
Your train data is further splitted into two parts. Train set and validation set where 20% of your original train data is used as validation set, and 80% as the train set.
Random state argument is just another way to set seed which aids in code reproduction.
 iron basalt
from random import randint
from datetime import datetime, timedelta
import matplotlib.pyplot as plt
from matplotlib.animation import FuncAnimation

start_time = datetime.now()
x = [start_time - timedelta(seconds=(10 - i)) for i in range(10)]
random_numbers = [randint(0, 100) for i in range(10)]

fig, ax = plt.subplots()
line, = ax.plot(x, random_numbers, label="random_numbers", color="#1f78ff")
plt.legend(loc="upper left")
plt.xlabel("Time")
plt.ylabel("Random Number")
plt.title("Random Number Graph")


def update(_frame):
    now = datetime.now()

    if now > x[-1]:
        x.pop(0)
        x.append(now)
        random_numbers.pop(0)
        random_numbers.append(randint(0, 100))

        line.set_data(x, random_numbers)
        ax.set_xlim(x[0], x[-1])
    return line,


def main():
    _animation = FuncAnimation(fig, update, interval=1000)
    plt.show()


if __name__ == "__main__":
    main()
A couple of things, you had the wrong direction for the start x (10 - i, not i), the animation function needs to check if the now time is actually newer, otherwise you will get duplicate x values, and you need to set the x lim so that the view tracks the moving curve (through time) on the x-axis.
iron basalt
In addition, in the start x, if it lags while making the list for some reason the datetime.now() could change per iteration (code takes time to execute), thus I moved it out.
 fringe igloo
iron basalt
A couple of things, you had the wrong direction for the start x (10 - i, not i),...
fringe igloo
iron basalt
A couple of things, you had the wrong direction for the start x (10 - i, not i),...
Oh good points
I'll apply it to my actual chart based on the above, thank you!
I'll apply it to my actual chart based on the above, thank you!
Discord down again?
Nvm good now
fringe igloo
iron basalt
A couple of things, you had the wrong direction for the start x (10 - i, not i),...
Thank you for this again, works like a charm and fixed all the issues
 arctic wedgeBOT
:incoming_envelope: :ok_hand: applied mute to @south ore until <t:1644960980:f> (9 minutes and 59 seconds) (reason: duplicates rule: sent 4 duplicated messages in 10s).
shut trail
Emyrs answer was so much better written. The function returns 4 values :)
 misty flint
yeah the function returns 4 outputs
train_test_split
is more like:
a1, a2, b1, b2
or do you mean youre curious about the source code of it?
theres actually an example in the source code too https://github.com/scikit-learn/scikit-learn/blob/7e1e6d09b/sklearn/model_selection/_split.py#L2321
arctic wedgeBOT
sklearn/model_selection/_split.py line 2321
def train_test_split(```no its one of 4 variables that is assigned to 1 of 4 outputs from the train_test_split() function
odd meteor
Remember you passed x and y to train_test_split() function. And the actual reason for doing so is to get:
- train set
- validation set
And for each set in #1 and #2 we need to also get their respective X and Y. Hence, the reason the variables passed are 4.
misty flint
i think you should read it from right to left. the assignment happens in that direction
ill let emyrs explain since i know it can be more confusing with two people
and he explains it better
odd meteor
As you can see from the code above. It takes the input variables first (X_train for train set, X_test for validation set) and then the output variables (y_train, y_test)
The trick is, you can either use any of these arguments test_size =0.2 or train_size = 0.8
Although the popular argument used is test_size. The best way to understand it is to experiment with the code.
To avoid confusion yes 😀. If you'd wanna have it the other way round then right inside the function, pass the y first just like this
y_train, y_val, X_train, X_val = train_test_split(y, X, test_size=0.2, random_state = 2022)
Yes. The way you set the 4 variables will determine the order you should follow to pass the X and Y into train_test_split()
You're welcome 😂
 frosty flower
Can someone help me remove the two for loops in this piece of code?
I mean vectorization
Each X[:, i, j] is a vector of training data, and each Y[:, i, j] is a vector of target values
What's being done here is for each [:, i, j] I'm creating a linear model
and saving the parameters to i by j matrices at their corresponding positions
The issue now is, for loop through all (i, j) pairs may not be so efficient. But I'm not sure how to vectorize this process.
iron basalt
Print curr_X, curr_Y, and x.

 iron basalt
You can probably get rid of one of the two loops since lstsq's b can be {M, K} in shape and it computes a separate solution for each column in b.
frosty flower
iron basalt
You can probably get rid of one of the two loops since lstsq's b can be {M, K} i...
Good point!
iron basalt
The problem is that for what you are using lstsq for, you have to construct a different A matrix each time via the vstack method.
It does not take multiple a's.
frosty flower
I'm open to other implementations
I can't think of many (any) other ways to append a "1" to each data point, I'm just not very familiar with numpy in general
iron basalt
lstsq only takes one coefficient matrix as input. It takes multiple b's, but not a's. So at best this will take 1 python loop.
frosty flower

Stack Overflow
I am working on some image analysis algorithm and am trying to use numpy for doing a least square fitting. To illustrate what I am trying to do, I have generated a very simple test case:
A = np.ze...
This looks like a solution

iron basalt
Ok, I was confused by why yours has something like x[:, i, j] rather than x[i, j, :].
But also as you can see it's still at best 1 loop. It's the same solution.
inv can take multiple matrices
so you can do it yourself the lstsq
Then there would be no python loops.
 serene scaffold
A book I'm reading says
This imposes a serious limitation on the neuron because it cannot classify linearly inseparable problems—even simple ones such as XOR.
In other words, there are problems for which you can't create a continuous decision boundary?

 minor elbow
serene scaffold
A book I'm reading says
> This imposes a serious limitation on the neuron becaus...
minor elbow
serene scaffold
A book I'm reading says
> This imposes a serious limitation on the neuron becaus...
you cant draw a single straight line that perfectly seperates the two classes (green/red)
fringe igloo
But the graph looks like

Or if anyone else can help with the above, I can't figure out what is the issue
What's up with that date order on the x axis?
23:02 -> 23:06 -> 23:03
minor elbow
minor elbow
you cant draw a single straight line that perfectly seperates the two classes (g...
if you have like a radial svm you could make an elliptical decision boundary (of sorts) which would not be a straight line (ie a linear decision boundary)
serene scaffold
minor elbow
you cant draw a single straight line that perfectly seperates the two classes (g...
right, I suppose I answered my own question. I've just never thought of this kind of thing 
minor elbow
are u reading elements of stat learning
it sounds like an example from a book i ve read
maybe a comp sci one
serene scaffold
Please do not ping recent answerers asking them to answer your question. Always direct your question to the channel in general.
fringe igloo
That wasn't recent
minor elbow
or bishop
anywho great books
elements of stat learning is free and a very nice overview, though can be a bit mathy i guess
serene scaffold
fringe igloo
That wasn't recent
Please do not ping anyone who has not already signaled interest in your specific question asking them to help.
fringe igloo
He did
iron basalt
serene scaffold
right, I suppose I answered my own question. I've just never thought of this kin...
It was the reason why neural networks did not take off until the 80s. They were around for a long time but all the professors in AI wanted to invalidate them and push forward their symbolic AI. So they kept bringing up this problem. Then sigmoid and MLPs came along but everybody already considered NNs a failure and did not pay attention.
Then backprop happened and they were around again, but really exploded in popularity with CNNs beating all SOTA image classification.
The question came about because back then people were showing that you could make logic gates with neurons. But they could not make an XOR gate.
 desert oar
but a NN can learn XOR
why was it considered bad that a single neuron couldn't? just on principle?
desert oar
iron basalt
Then backprop happened and they were around again, but really exploded in popula...
wasn't gpu computing / cuda also a factor?
iron basalt
desert oar
why was it considered bad that a single neuron couldn't? just on principle?
Because they felt like it. It was not a bad thing, but if you scream that something is bad and you have authority, people will not look into it.
iron basalt
desert oar
wasn't gpu computing / cuda also a factor?
Yes, GPUs becomming much faster helped a lot (later on, even better, bigger models), but really it was that it outperformed the classical approaches at all.
And by a very large margin.
misty flint
serene scaffold
A book I'm reading says
> This imposes a serious limitation on the neuron becaus...
hey this is like our lecture in my deep learning class. similar visual
iron basalt
iron basalt
Because they felt like it. It was not a bad thing, but if you scream that someth...
University / academic politics basically.
(still happens for many things, which is why a lot of real progress is still made by people that go solo and do their own thing)
(if it does not require a ton of funding and stuff like building a particle accelerator (CS is optimal for this, you just need a PC))
minor elbow
yeah the explosion in compute and dataset size has been a core driver of advancement particularly for NN/deep learning
 sour spindle
is this ok to use on unseen data?
Epoch 00043:
257/257 [==============================] - 4s 14ms/step - loss: 0.4187 - val_loss: 0.4264
@desert oar @iron basalt thanks for the discussion. I'm learning to much
desert oar
sour spindle
is this ok to use on unseen data?
```
Epoch 00043:
257/257 [====================...
impossible to say. what is the loss metric? what is the machine learning task?
sour spindle
desert oar
impossible to say. what is the loss metric? what is the machine learning task?
trading strategy generation for stock market
it is using categorial crossentropy
 novel acorn
 silver nacelle
serene scaffold
A book I'm reading says
> This imposes a serious limitation on the neuron becaus...
silver nacelle
serene scaffold
A book I'm reading says
> This imposes a serious limitation on the neuron becaus...
I know this mathematical logic
serene scaffold
silver nacelle
I know this mathematical logic
 silver nacelle
😅
 modest shuttle
Thank you, but numbers....
 modest shuttle
Thank you, but numbers....
modest shuttle
modest shuttle
Thank you, but numbers....
how to change color of numbers? 😦
iron basalt
modest shuttle
Thank you, but numbers....
Looks like it wants RGB and you gave it a BGR image.
(or other way around)
modest shuttle
iron basalt
Looks like it wants RGB and you gave it a BGR image.
Yes, but my problem is numbers are around image is black and not readable.
desert oar
modest shuttle
Yes, but my problem is numbers are around image is black and not readable.
you can change the tick label color https://stackoverflow.com/q/14165344
or you can set the plot background color (it is transparent by default, which is causing the problem) with Figure.set_facecolor (i think)
Stack Overflow
How would one color y-axis label and tick labels in red?
So for example the "y-label" and values 0 through 40, to be colored in red.
import matplotlib.pyplot as plt
import numpy as np
x = np.ara...
modest shuttle
desert oar
you can change the tick label color https://stackoverflow.com/q/14165344
or you...
Thank you,
 desert oar
modest shuttle
Thank you,
desert oar
modest shuttle
Thank you,
even better
serene scaffold
@umbral anvil I deleted your off-topic messages, since you are also already seeking help for the same question in another channel.
 umbral anvil
@serene scaffold I understand, but it's a matter that needs to be resolved in a hurry. I'm sorry.
serene scaffold
umbral anvil
<@!253696366952316929> I understand, but it's a matter that needs to be resolved...
I understand that this is a priority for you. Our policies about channel topics always apply.
umbral anvil
serene scaffold
I understand that this is a priority for you. Our policies about channel topics ...
Thank you for your understanding.😭
 inland zephyr
is it available to use AveragePooling2D for 5-dim tensor? I got this error while Average my model ValueError: Input 0 of layer "average_pooling2d" is incompatible with the layer: expected ndim=4, found ndim=5. Full shape received: (None, 1, 103, 103, 128)
or should i using the 3D one?
 mighty summit
Does anyone if there is any dataset that is pretrained to do something like https://www.instagram.com/reel/CY_tv8kIkhx/?utm_medium=copy_link ?
 lofty turret
guys i need to ask some question about pandas, who is free to help?
Rush2618 help please
 heavy bay
Hello, I have an numpy array like this py [[29 15 28 30 14 28 15 29] [ 7 7 7 7 7 7 7 7] [ 0 0 0 0 0 0 0 0] [ 0 0 0 0 0 0 0 0] [ 0 0 0 0 0 0 0 0] [ 0 0 0 0 0 0 0 0] [ 5 5 5 5 5 5 5 5] [21 11 20 22 10 20 11 21]] what can I do to get an output like this py [[29 15 28 30 14 28 15 29] [ 7 7 7 7 7 7 7 7] [ 0 0 0 0 0 0 0 0] [ 0 0 0 0 0 0 0 0] [ 0 0 0 5 0 0 0 0] [ 0 0 0 0 0 0 0 0] [ 5 5 5 0 5 5 5 5] [21 11 20 22 10 20 11 21]]
lofty turret
they r identical
heavy bay
heavy bay
Hello, I have an numpy array like this ```py
[[29 15 28 30 14 28 15 29]
[ 7 7 ...
I want to shift the 5 to arrays above and replace its original spot with a zero
mighty summit
lofty turret
they r identical
no they r not.
mighty summit
heavy bay
I want to shift the `5` to arrays above and replace its original spot with a zer...
Index and reassign?
heavy bay
lofty turret
Rush2618 help please
Sorry I don't have much experience with pandas, feel free to send your question here, someone else will be able to answer it
lofty turret
mighty summit
Index and reassign?
i have question about pandas resample
mighty summit
heavy bay
Hello, I have an numpy array like this ```py
[[29 15 28 30 14 28 15 29]
[ 7 7 ...
Would something like:
arr[6][4], arr[4][4] = arr[4][4], arr[6][4]
work?
heavy bay
mighty summit
Would something like:
```py
arr[6][4], arr[4][4] = arr[4][4], arr[6][4]
```
work...
Thanks I'll try that
mighty summit
lofty turret
i have question about pandas resample
Why don't you go ahead and ask, and someone will help you out for sure
heavy bay
mighty summit
Would something like:
```py
arr[6][4], arr[4][4] = arr[4][4], arr[6][4]
```
work...
Thanks it works, but that may not always be the case, I have the value which I want to shift, and I need to get the index of that value in my array and shift the value (and replace it by zero). Any idea how I can do that?
mighty summit
heavy bay
Thanks it works, but that may not always be the case, I have the value which I w...
There are lots of 5, how do you recognize which one you want, same case with 0 too
silver nacelle
Can anyone program a robot?
lofty turret
how to post formatted code here?
heavy bay
mighty summit
There are lots of 5, how do you recognize which one you want, same case with 0 t...
There are lots of 5
The user will be inputting the index of the5in the nested array
same case with 0 too
I want to replace it with the zero 2 arrays above it
 hasty grail
heavy bay
> There are lots of 5
The user will be inputting the index of the `5` in the nes...
hasty grail
heavy bay
> There are lots of 5
The user will be inputting the index of the `5` in the nes...
you can use variables instead of fixed indices
lofty turret
hasty grail
you can use variables instead of fixed indices
r u good in pandas?
hasty grail
I'm reasonable at it, but I wouldn't call myself an expert
Btw don't ask to ask, just ask it here - there are plenty of people who may help you
lofty turret
i have a date and i used for example resample('W').first(), it returns the dates with column of numbers
what does the numbers represent?
hasty grail
!code
arctic wedgeBOT
Here's how to format Python code on Discord:
```py
print('Hello world!')
```
These are backticks, not quotes. Check this out if you can't find the backtick key.
hasty grail
Perhaps you could elaborate a bit further
lofty turret
import numpy as np
import pandas as pd

dates = pd.date_range('10/10/2018', periods=11, freq='D')
close_prices = np.arange(len(dates))

close = pd.Series(close_prices, dates)
close
it returns
2018-10-10     0
2018-10-11     1
2018-10-12     2
2018-10-13     3
2018-10-14     4
2018-10-15     5
2018-10-16     6
2018-10-17     7
2018-10-18     8
2018-10-19     9
2018-10-20    10
Freq: D, dtype: int64
when i run this code
pd.DataFrame({
    'days': close,
    'weeks': close.resample('W').first()})
i get this
days    weeks
2018-10-10    0.0    NaN
2018-10-11    1.0    NaN
2018-10-12    2.0    NaN
2018-10-13    3.0    NaN
2018-10-14    4.0    0.0
2018-10-15    5.0    NaN
2018-10-16    6.0    NaN
2018-10-17    7.0    NaN
2018-10-18    8.0    NaN
2018-10-19    9.0    NaN
2018-10-20    10.0    NaN
2018-10-21    NaN    5.0
what i dont understand the value 5 from where it comes?
mighty summit
heavy bay
> There are lots of 5
The user will be inputting the index of the `5` in the nes...
Something like this could help:
row = 6 # Take user input here for rows and columns
col = 4
num = arr[row][col]

new_row = row - 2 # Go two rows back

arr[new_row][col] = num # re-Assign the values
arr[row][col] = 0
thanks, I'll try that
hasty grail
lofty turret
what i dont understand the value 5 from where it comes?
You'll have to wait for someone else, I have not done resampling in Pandas
You could try breaking down the steps/results to get a better idea of what's going on
 lapis sequoia
What do you think about tuning different hyperparameters consecutively instead of using something like gridsearchcv? For example setting all hyperparameters to the default values and tuning one hyperparameter and then the next hyperparameter with the optimal value I found for the first hyperparameter. I know it could maybe miss the optimal configuration but it would save a lot of time because the amount of combinations that have to be checked is much less
minor elbow
lofty turret
what i dont understand the value 5 from where it comes?
ur telling it to resample daily to weekly values, and to use the first value in the daily series as the weekly value
5 is the first value in that calendar week
 fallow frost
lofty turret
i get this
```
days weeks
2018-10-10 0.0 NaN
2018-10-11 1.0 NaN
...
fallow frost
lofty turret
i get this
```
days weeks
2018-10-10 0.0 NaN
2018-10-11 1.0 NaN
...
Whats the name of the 3rd column
lofty turret
fallow frost
Whats the name of the 3rd column
the. first column does not have name
second is days
third is weeks
lofty turret
nothing, just a normal date
 keen shore
Hello everyone - I am writing on behalf of an early stage startup venture looking to talk to data science,data architecture, data wrangling, data preparing and/or data engineering and analysis experts purely for research purposes. Would you have 30 mins to talk to us?
odd meteor
lapis sequoia
What do you think about tuning different hyperparameters consecutively instead o...
It's nice to try that, but declaring a search space and using GridSearchCV, RandomizedSearchCV, or Informed Search can save you a lot of time.
Of course, there's nothing boring about experimenting hyperparameter tunning with your approach if you could care less about how much time you'll spend in trying to find the optimal value for each hyperparameter. It's just not for the faint hearted 😅 but it's a good approach to learn
 rough turtle
something is wrong with this code but it looks all right?
import torch.nn as nn
class NeuralNet(nn.Model):
def __init__(self,imput_size,hidden_size,num_classes):
super(NeuralNet,self).__init__()
self.l1 = nn.Linear(imput_size,hidden_size)
self.l2 = nn.Linear(hidden_size,hidden_size)
self.l3 = nn.Linear(hidden_size,num_classes)
self.relu = nn.ReLU()
def forward(self,x):
out = self.l1(x)
out = self.relu(out)
out = self.l2(out)
out = self.l3(out)
return out``` plush glacier
do you get an error if you do what is the error
rough turtle
plush glacier
do you get an error if you do what is the error
Traceback (most recent call last):
  File "e:/coope/Desktop/Gideon/Train.py", line 7, in <module>
    from Brain import NeuralNet
  File "e:\coope\Desktop\Gideon\Brain.py", line 3, in <module>
    class NeuralNet(nn.Model):
AttributeError: module 'torch.nn' has no attribute 'Model'
PS E:\coope\Desktop\Gideon>```it says that torch.nn doesn't have Model
i think you want Module there based on this https://pytorch.org/docs/stable/generated/torch.nn.Module.html
rough turtle
is torch.nn unnecessary?
plush glacier
rough turtle
is torch.nn unnecessary?
no but where you have Model try putting Module
rough turtle
class Module(nn.NeuralNet): like that
plush glacier
rough turtle
```class Module(nn.NeuralNet):``` like that
no like class NeuralNet(nn.Module):
 prisma mist
i have a 3.2 GB csv file . when i read it into a df using pandas i get the following error: No such file or directory: datafile.csv... is this due to code or due to large data size?
import pandas as pd
df_for_large_csv = pd.read_csv("datafile.csv")
print(df_for_large_csv.head())
that's it. that's all my code. i cant' even view head()
what am i doing wrong?
😭 😫 😠
 tidal bough
most likely, you're mistaken about what your current working directory is, and so when writing the path as just "datafile.csv", you aren't searching for it in the directory you think you are.
check os.getcwd().
 true condor
Can someone pls help me with this problem?
https://stackoverflow.com/q/71139091/16252280
Stack Overflow
The accuracy on my code doesn't work(accu), it stays at 0, even though it should get higher.
The loss function works perfectly fine but the accu doesn't and i dont know why it doesnt go up.
It does...
 dapper jackal
hi guys I have a large 3d scene with roughly 2000 stars/orbiting planets and am looking to use an octree spatial query structure to improve performance. I am using django with three js on the front end; from my understanding I cannot import modules/libraries and can only import within html tags linking to a hosted text doc. The following library looks great, however I do not see a relevant html tag https://github.com/vanruesc/sparse-octree. Am I correct in my understanding, that I need an html tag? Is there a way to create one? Alternatively, is there another appropriate library that does have an appropriate html tag? Thanks in advance.
 fossil bobcat
Hi everyone, I am working on a problem where i am imputing data for multiple columns in batches everyday. I am currently using two ml algorithms together to find the right value for it. K-Means and running SOM within K-means. While i just realised there seems to be no way to validate the data drift in this situation if i run the program for months. any website i look, there needs to be an actual and a predicted value, while in my situation i am the one imputing of values at nan locations. Has anyone worked on such a problem?
 novel elbow
dapper jackal
hi guys I have a large 3d scene with roughly 2000 stars/orbiting planets and am ...
novel elbow
dapper jackal
hi guys I have a large 3d scene with roughly 2000 stars/orbiting planets and am ...
Not sure I understood but maybe this hel;ps: https://unpkg.com/sparse-octree@7.1.4/dist/sparse-octree.js
 urban mist
Hi everyone - I know this isn't exactly a help channel, but maybe someone had similar problems before.
- I have a model that I train, then pickle, then wanna use in another project for predictions.
- During training and later execution the model uses a preprocessor, the preprocessor uses some simple helper functions.
- When the initial training happens - helperfunctions.py, preprocessor.py, train_production.py are all in the same "src" directory.
The preprocessing for example is a step in a sklearn pipeline that gets executed during every prediction too.
I get a problem with the dependencies thou, as the unpickled model, can't use the referenced functions/class from the other files.
I thought dill pickling, was supposed to help with that.
Anyone got experience on that? I've been stuck for quite a while and a long discussion in the help channels sadly didn't help either
    preprocess_class = Preprocessor
    preprocess_params = {'language': 'german',
                         "compound_threshold": 1,
                         "split_compounds": False,
                         "remove_digits": False}

    vectorizer_class = CountVectorizer
    vectorizer_params = {"analyzer": "char", "ngram_range": (2, 6)}

    model_class = CalibratedClassifierCV
    model_params = {"base_estimator": SGDClassifier(alpha=0.001, random_state=random_state), "cv": 2}

    pipeline = Pipeline([('preprocess', preprocess_class(**preprocess_params)),
                         ('vectorizer', vectorizer_class(**vectorizer_params)),
                         ('model', model_class(**model_params))])
    print(pipeline.named_steps)

    if use_mlflow == False:
        print("Training production model... [LOCAL]")
        pipeline.fit(train[X_cols], train[y_col])
        local_model_file_name = local_model_path + local_model_name
        dill.dump(pipeline, open(local_model_file_name, 'wb'))
maybe I'm doing the pickling wrong?
 neat anvil
lapis sequoia
What do you think about tuning different hyperparameters consecutively instead o...
neat anvil
lapis sequoia
What do you think about tuning different hyperparameters consecutively instead o...
This interpretation is only correct if the hyperparameters are not coupled- but this is most likely not true. The space you're searching for hyperparameters is not a bunch of separate dimensions each with an optimum you can find one at a time, but the space of all of them together which has many local optima, and at least one global optima. There are many algorithms for finding the optima (lowest loss model) in the hyperparameter space - a GridSearchCV or RandomSearchCV are sort of two variants of a https://en.wikipedia.org/wiki/Particle_swarm_optimization, but there's many more. Just see the dense side panel on that wiki page. The https://hyperopt.github.io/hyperopt/ package has some good algorithms for implementing hyperparameter searches already implemented that can be made to work for any machine learning (or any function that takes in parameters and generates a loss value, actually) application
Documentation for Hyperopt, Distributed Asynchronous Hyper-parameter Optimization
urban mist
urban mist
Hi everyone - I know this isn't exactly a help channel, but maybe someone had si...
Project structure where the training and pickling happens

When I wanna do predictions with the model thou, I get an error because the functions from helperfunctions.py/preprocessor.py don't get recognized.
 brazen spire
I have a technical question regarding the learning rate
can we use wolfe-franck method in order to determine it?
Or people just do several numerical simulation to determine?
neat anvil
urban mist
When I wanna do predictions with the model thou, I get an error because the func...
If your pipeline contains references to functions in another python module, you're going to need to need to encapsulate all of that code very carefully in order to successfully pickle/unpickle it. If you can just import those functions directly at the predict stage, perhaps they do not need to be pickled with the pipeline?
urban mist
neat anvil
If your pipeline contains references to functions in another python module, you'...
Sadly my pipeline does include references to functions in another python module, that aren't readily available in the project that performs the predictions .... 😩
So far I failed at properly encapsulating those references, any pointers to maybe a good resource that could help?
I'm not working on the project alone, and I don't think moving the preprocessor (the culprit in the pipeline) to the other project is a solution that'll be wanted
lapis sequoia
neat anvil
This interpretation is only correct if the hyperparameters are not coupled- but ...
Thanks for the response
neat anvil
If you need to leverage code from another project in your pipeline, there's plenty of options, but none of them particularly easy
you can build a little server that has an API to run the function
could link the project you need to import from as a submodule in your current repository
could just copy the code
so you can import it easily
all the options have trade-offs in terms of up-front effort, maintainability, performance, etc. that you need to decide on
what the "right" answer is depends on your team and your ops stack
urban mist
At least I feel validated for not finding a "magical simple solution", just like that.
Thank you for your input - I'll check back with my team what would be best in our case.
serene scaffold
frosty flower
How do I combine them into one picture
combine them, in one way?
 shadow halo
Hello people, does someone has a way do translate a distance matrix into a coordinate one? I need it for a tsp assignment. I'm new here so idk if it is the right channel for this
serene scaffold
shadow halo
Hello people, does someone has a way do translate a distance matrix into a coord...
questions involving matrices are for this channel, yes. (unless you're using "matrix" loosely to refer to a nested list.)
let me think.
What is the shape of the distance matrix?
serene scaffold
In [8]: from sklearn.decomposition import PCA

In [15]: pca = PCA(n_components=2)

In [17]: pca.fit_transform(np.random.random((17, 17)))
Out[17]:
array([[ 0.13149034,  0.77721922],
       [ 0.28476017, -0.38747606],
       [ 0.67334071, -0.27330446],
       [-0.57247648,  0.12384381],
       [ 0.00153509, -0.11468065],
       [-0.38852845, -0.41176974],
       [-0.99683288, -0.47091274],
       [-0.03098744,  0.24016908],
       [-0.12738749, -0.45247429],
       [-0.12035764,  0.59052017],
       [-0.89914074,  0.14063455],
       [ 0.26100839, -0.72914214],
       [ 0.27719529,  0.42171512],
       [ 1.06428383, -0.24861682],
       [ 0.01091946,  0.49287453],
       [ 0.27933916,  0.53356732],
       [ 0.15183866, -0.2321669 ]])
see if that works, I guess?
serene scaffold
if you're familiar with sklearn but not fit_transform, remember that fit_transform can mess up your code if you don't understand what fit and transform do, respectively.
 mint palm
How difficult will to make a better model if existing model has 95 percent accuracy....also i am very noob when it comes to improving accuracy , so it will be great if you can tell me what architecture will be better
Current model includes use of CNN and LSTM for detection of fraud(malicious ) request from user .....
Data is in csv form, tabular.......
I have 65k entries
shadow halo
serene scaffold
if you're familiar with sklearn but not fit_transform, remember that fit_transfo...
I'm not familiar with sklearn, I'm still a noob in this, thanks for your help, been precious, I'll give you feedback for what you sent
iron basalt
urban mist
I'm not working on the project alone, and I don't think moving the preprocessor ...
If you somehow pickled the entire object and the functions involving the preprocessing then you moved the preprocessor to the other project. Just move over the code with the pickled parameters.
If it needs the preprocessing to run, then it needs it to run.
shadow halo
serene scaffold
see if that works, I guess?
It worked, I want now to export it with this output:
   2     630.0  1660.0
   3      40.0  2090.0
   4     750.0  1100.0
5 750.0 2030.0```Nvm this I put as a pandas dataframe and it got indexed as intended
Been really helpful man
Thanks a lot
Good day to you
 hasty hawk
hey guy's can you give where i should take courses in data science?
 tranquil helm
hasty hawk
hey guy's can you give where i should take courses in data science?
tranquil helm
hasty hawk
hey guy's can you give where i should take courses in data science?
@hasty hawk hey
tranquil helm
hasty hawk
hey guy's can you give where i should take courses in data science?
imo, the machine learing courses on datacamp are quite unique and very beginner friendly
hasty hawk
thanks !
 orchid kayak
If at the final layer of my model I use a sigmoid activation function, then all of my values should be either 0 or 1, yes?
neat anvil
hasty hawk
hey guy's can you give where i should take courses in data science?
Andrew Ng’s courses on coursera are very good
serene scaffold
neat anvil
Andrew Ng’s courses on coursera are very good
is that course in Python?
neat anvil
Don’t think so - the intro one doesn’t require any code at all he does most of the math on a little whiteboard
serene scaffold
link for the intro one?
I might put the intro one on our website.

Coursera
Learn Machine Learning from Stanford University. Machine learning is the science of getting computers to act without being explicitly programmed. In the past decade, machine learning has given us self-driving cars, practical speech recognition, ...
neat anvil
yep!
so there is a section on coding in MATLAB or Octave but you can really just ignore it completely
the bulk of the course is on understanding the maths fundamentals of ML
serene scaffold
Alright, thanks for the information 😄
also why does it say "get started for free"? do you get charged after x lessons?
or is that just for the certificate?
neat anvil
not sure, I took it like five years ago
it was free then
i did not pay for the certificate
 wicked grove
hello
this is my output from model.evaluate
i cant understand why the loss is so high
score = model2.evaluate(X_new_img_test,onehot_t,batch_size=32)
print('Test loss:', score[0])
print('Test accuracy:', score[1])```Test loss: 0.6480174660682678
Test accuracy: 0.7633333206176758```Hey all, for an exercise I have to perform a principal component analysis on a dataset I got. If someone is willing to help me with some questions I'm having, please send me a private message. The questions I'm having are probably quite basic but I'm a little confused of the problem statement I'm given so I need a second opinion...
 deft nexus
hey, i'm just getting started with tensor flow
can someone link good tutorials/explanations?
 pearl summit
can anyone explain the difference between the dop853 and dopri5 integrators in scipy to me?
i can't find anything regarding those numbers online outside of scipy, just general dormand-prince stuff, but i kinda need to implement dorpri myself and don't wanna look at the wrong code
i know how dorpri works generally, just wondering about the specifics
lapis sequoia
Anyone with familiar with Plaid APIs?
My friend and I are working on this app, and we need some help with AI/data science aspect of it
deft nexus
lapis sequoia
My friend and I are working on this app, and we need some help with AI/data scie...
never used Plaid but what exactly are you trying to do?
 soft anvil
@wicked grove That doesn't look too bad. The loss is dependent on your loss function and your model performance.
Depending on the dataset, a test accuracy of 0.76 can be good.
deft nexus
soft anvil
<@!696373334119546890> That doesn't look too bad. The loss is dependent on your ...
hey, are you talking about tensor flow? had some trouble starting with it and would like some help
misty flint
lapis sequoia
My friend and I are working on this app, and we need some help with AI/data scie...
if youre talking about accessing their APIs, then its probably more of a data engineering problem than science one
minor elbow
serene scaffold
also why does it say "get started for free"? do you get charged after x lessons?
been a while since ive used coursera but in the past you could "audit" the course, which gives u access to all the lectures/materials but you dont get graded exercises or a certificate of completion
 thick kelp
hey, i new to python. i need help for this question?
1)requests a ZIP code from the user (no input validation or testing, just run with what they give you)
- uses the ZIP to request JSON weather data
3)returns to the user the hourly temperature for the next 4 hours. It does not have to be pretty.
serene scaffold
@thick kelp this does not sound like a data science question. please use a regular help channel (see #❓|how-to-get-help)
 valid flicker
How can I convert the DataFrame from shape 1 to shape 2?

 arctic wedgeBOT
:incoming_envelope: :ok_hand: applied mute to @lapis sequoia until <t:1645050531:f> (9 minutes and 59 seconds) (reason: duplicates rule: sent 4 duplicated messages in 10s).
serene scaffold
@valid flicker please do print(df.head().to_dict('list')) and copy and paste the text into this chat as text (no screenshots). This will let me come up with an exact solution and walk you through it.
the solution will involve pivoting in some way.
valid flicker
serene scaffold
<@!437865632873054231> please do `print(df.head().to_dict('list'))` and copy and...
{'LanguageWorkedWith': ['C#', 'HTML/CSS', 'JavaScript', 'JavaScript', 'Swift'], 'DatabaseWorkedWith': ['Elasticsearch', 'Microsoft SQL Server', 'Oracle', nan, nan], 'WebframeWorkedWith': ['ASP.NET', 'ASP.NET Core', nan, nan, nan], 'MiscTechWorkedWith': ['.NET', '.NET Core', 'React Native', nan, nan], 'LanguageDesireNextYear': ['C#', 'HTML/CSS', 'JavaScript', 'Python', 'Swift'], 'DatabaseDesireNextYear': ['Microsoft SQL Server', nan, nan, nan, 'MySQL'], 'WebframeDesireNextYear': ['ASP.NET Core', nan, nan, nan, 'Django'], 'MiscTechDesireNextYear': ['.NET Core', 'Xamarin', 'React Native', 'TensorFlow', 'Unity 3D']}
valid flicker
The instructor I watch did that:
skills_freq = df.drop('DevType', axis=1).sum().reset_index()
skills_freq.columns = ['group', 'skill', 'freq']
but I really don't know how the sum function worked with him
serene scaffold
I've almost got it.
take a look at what happens if you do df.apply(pd.Series.value_counts).fillna(0)
let me know when you've done that
valid flicker
I run it, it makes the index as the skill and values of columns are the return of value_counts()
serene scaffold
so, this is basically a wide version of what you wanted
the next step is to unstack
also come to think of it, we don't want the fillna
In [64]: df.apply(pd.Series.value_counts).unstack().dropna()
Out[64]:
LanguageWorkedWith      C#                      1.0
                        HTML/CSS                1.0
                        JavaScript              2.0
                        Swift                   1.0
DatabaseWorkedWith      Elasticsearch           1.0
                        Microsoft SQL Server    1.0
                        Oracle                  1.0
WebframeWorkedWith      ASP.NET                 1.0
                        ASP.NET Core            1.0
MiscTechWorkedWith      .NET                    1.0
                        .NET Core               1.0
                        React Native            1.0
LanguageDesireNextYear  C#                      1.0
                        HTML/CSS                1.0
                        JavaScript              1.0
                        Python                  1.0
                        Swift                   1.0
DatabaseDesireNextYear  Microsoft SQL Server    1.0
                        MySQL                   1.0
WebframeDesireNextYear  ASP.NET Core            1.0
                        Django                  1.0
MiscTechDesireNextYear  .NET Core               1.0
                        React Native            1.0
                        TensorFlow              1.0
                        Unity 3D                1.0
                        Xamarin                 1.0
dtype: float64
my numbers are lower because I was dealing with fewer rows in the original df
an important distinction, though, is that the first two "columns" are actually part of the index now. you can keep it that way, or reset the index.
valid flicker
It works now, thank you sir
 stone marlin
For a similar little trick to the above, I melted the dataset to make it long form, then I applied the sweet but underutilized pivot_table method:
df.melt().pivot_table(index=["variable", "value"], aggfunc=len)

variable                value
DatabaseDesireNextYear  Microsoft SQL Server    1
                        MySQL                   1
DatabaseWorkedWith      Elasticsearch           1
                        Microsoft SQL Server    1
                        Oracle                  1
LanguageDesireNextYear  C#                      1
                        HTML/CSS                1
                        JavaScript              1
                        Python                  1
                        Swift                   1
LanguageWorkedWith      C#                      1
                        HTML/CSS                1
...
...
I'm a big fan of pivot_table and I love to evangelize it. :']
 hollow sentinel

A complete overview of Chapter 4 of the book Hands-on Machine Learning with Scikit-Learn Keras & Tensorflow
You can get the book here: https://amzn.to/2SmaLBH
If you'd like to get the code along with much more soon to come please consider supporting me on my Patreon: https://www.patreon.com/shashankkalanithi
FREE Python Tutorial: https://yout...
i find this book a bit intimidating at some points
this guy breaks it down nicely
lapis sequoia
deft nexus
never used Plaid but what exactly are you trying to do?
Is it ok if I talk to you in DMs?
serene scaffold
lapis sequoia
Is it ok if I talk to you in DMs?
why do you want to move it to DMs? it's easier for everyone if you ask your questions in the server.
lapis sequoia
The project is sorta private
The thing that my friend and I need to do is just to analyze data
Find out patterns in it
Like the most common occurrence, etc. using plaid
mighty summit
Hey guys, does anyone know how to use cuda core with yolo while running with open cv from jupyter-lab?
 thin palm
is this a good channel to ask about deploying machine learning products?
neat anvil
Im relatively new here but it seems the channel for it
thin palm
neat anvil
Im relatively new here but it seems the channel for it
are you aware of deployment methods? May I ask for some guidance?
thin palm
So I have code on my Jupyter Notebooks that in the end gets a model named "model.joblib"
now I need to transfer my Notebooks code into an app.py and separate each code into it's respective files.
But is there boilerplate code I need to put things together? Because I know I'll need a requirments.txt and a few other things. So I can't just make one file and expect to launch this on Heroku
what's the process you'd take?
neat anvil
I’ve never used heroku, so can’t speak to that
But yeah some app.py that loads the model artifact, then does ETL from whatever the input source is into the model inputs and ETL of the models predictions to whatever format the consumer expects
Would be a standard format
To bundle requirements.txt, other environment needs, you can use conda or docker
thin palm
neat anvil
To bundle requirements.txt, other environment needs, you can use conda or docker
But why do we need Docker if we're deploying our model on a website anybody can access to?
Isn't Docker meant to allow all machines to use applications? I've used Docker before in my bootcamp studies but it's been months since I've picked it up
neat anvil
The value docker provides is to allow you to write code which captures all the environment around your app- the OS, environment variables, requirements.txt, whatever.
thin palm
I'd like to use FastAPI (backend) and Streamlit (frontend) and then deploy this on Heroku (server). But do I need to create packages or anything?
thin palm
neat anvil
The value docker provides is to allow you to write code which captures all the e...
ahh yes yes I do remember that, but why bother if we're hosting it on a site that is accessible to everyone? Regardless of OS or Windows?
neat anvil
Well so you built the model with your local OS and Python environment. if the OS and Python environment aren’t an exact match, things may not work
Docker is one of the ways to ensure there is an exact match
thin palm
neat anvil
Docker is one of the ways to ensure there is an exact match
Okay I see this now.
So here's my step by step process and please correct me or advise me on something different:
neat anvil
You could also use conda, or just scripts for setting up the heroku worker properly
thin palm
1.) Relocate Noteboooks into an app.py
2.) create front end (streamlit)
3.) connect with backend (FastAPI)
4.) connect model.joblib. to GCP (google cloud platform)
5.) create Docker container
6.) launch to Heroku
do these steps make sense and sound achievable ?
but I thought we needed scripts, requirments.txt, and more files. Is there boilerplate I can use for this to get the basic body of the files correct ?
neat anvil
Yeah broadly makes sense I think
 swift basin
I did something very similar, but using Flask and no GCP, just a pre-trained model inside the container
neat anvil
One second, I can share a link
swift basin
the requirements file would basically be the dockerfile
here's what I did https://github.com/gerrazuriz/Docker-Flask

GitHub
Machine learning web app con Docker y Flask. Contribute to gerrazuriz/Docker-Flask development by creating an account on GitHub.
it's also on heroku
neat anvil
https://fastapi.tiangolo.com/deployment/docker/ is probably a good place to start
FastAPI framework, high performance, easy to learn, fast to code, ready for production
neat anvil
thin palm
1.) Relocate Noteboooks into an app.py
2.) create front end (streamlit)
3.) conn...
So I’m not sure why you mean by step 4. Normally to deploy a model, you build it into an artifact. A pickle file, or a tarball of model checkpoints. You then save that somewhere- could be on an object store like S3, could be in the deployed docker image itself. Then the deployed app just reads that
neat anvil
swift basin
the requirements file would basically be the dockerfile
Kinda just commenting here b/c you made me think about it- feel free to disagree. For an app that simple, that’s fine. But for anything even moderately complex you should really use the ‘requirement.txt’ and then one layer ‘pip install requirements.txt’ in the Dockerfile. A couple reasons for this- Using a requirements file is the industry standard, and not doing so will confuse people. Putting all the pip installs directly in the dockerfile will also confuse the commit history, it will be hard to tell in the future which commits changed Python requirements or not. Also if you can do a task in one layer in a dockerfile instead of multiple, the resulting image will be smaller.
swift basin
I 100% agree
neat anvil
Cool cool
swift basin
I made that before even working in DS, for interviews lol
 strong tapir
I'm attempting to use the NEAT algorithm to play Snake with an AI but I haven't been able to get any behavior with what I believe to be suitable input data and lots of training time
I will break down the important functions in my code since its somewhat long and junky
Currently my input data is food in N, NE, NW, S, SE, SW, W, E (8 inputs), distance to the 4 walls, the direction the snake is going, and the overall distance to the food
I still have other types of data but they are currently not in use and didn't seem to make an impact
my outputs are [UP, DOWN, LEFT, RIGHT]
So the order of operations is
Read the board > Make decision of board data > Score the decision and repeat
https://www.toptal.com/developers/hastebin/cutarumowu.py
^ Full Code above
return self.topwall_d, self.bottomwall_d, self.leftwall_d, self.rightwall_d, \
               north_food_d, south_food_d, left_food_d, right_food_d, \
               self.food_d_nw, self.food_d_ne, self.food_d_se, self.food_d_sw, \
               self.nearest_up_body, self.nearest_down_body, self.nearest_left_body, self.nearest_right_body, \
               int(self.direction[0]), int(self.direction[1]), int(self.direction[2]), int(self.direction[3]), \
               self.x/self.game.square_width, self.y/self.game.square_height, \
               self.game.food_x/self.game.square_width, self.game.food_y/self.game.square_height
               # desired_direction[0], desired_direction[1], desired_direction[2], desired_direction[3]
               #self.nw_wall_d, self.ne_wall_d, self.sw_wall_d, self.se_wall_d, \
               #self.north_food, self.south_food, self.left_food, self.right_food,\ conditional vision
 (Current Input data and attempted input data)```
```py
def eval_genomes(genomes, config):
    nets = []
    ges = []
    game_instances = []

    for genome_id, genome in genomes:
        pygame.display.set_caption(str(genome_id))
        genome.fitness = 0.0
        net = neat.nn.FeedForwardNetwork.create(genome, config)
        genome.fitness, net = main_game(genome, net, True)
        nets.append(net)
        ges.append(genome)
This is my eval_genomes function, my game function returns the genome.fitness while taking it in as a parameter as well, same for the network
I don't know if that makes it so it doesn't train or not though but it didn't seem like it would
and lastly my neat config https://www.toptal.com/developers/hastebin/amesasotax.ini
Now I've fiddled with my neat config file quite a bit to see what effects everything has but nothing seemed to help
I can't figure out what is stopping it from learning any behavior, whether it is my neat config, my game code itself, my input data, or just a combination of all or some of these factors
I hope I've presented my problem in a readable way and I would seriously appreciate the assistance
Also I can provide more info (that is readable) and can understand explanations if needed
Hastebin is a free web-based pastebin service for storing and sharing text and code snippets with anyone. Get started now.
Hastebin is a free web-based pastebin service for storing and sharing text and code snippets with anyone. Get started now.
wicked grove
soft anvil
<@!696373334119546890> That doesn't look too bad. The loss is dependent on your ...
Yeah my accuracy is supposed to be decent for this problem and im using categorical cross entropy
Will the loss be so high for that?
serene scaffold
@strong tapir I appreciate that you're being transparent about what you're asking about. However, it's unlikely that anyone will want to read all of this. You are more likely to get help if you make your question more pointed.
 mild dirge
strong tapir
I'm attempting to use the NEAT algorithm to play Snake with an AI but I haven't ...
mild dirge
strong tapir
I'm attempting to use the NEAT algorithm to play Snake with an AI but I haven't ...
I'm about to hit the sack so don't have time to read the whole question, but you could start with only having options [go left, go forward, go right]
strong tapir
tl;dr the neat algorithm isn't learning and idk why
mild dirge
instead of up, down, left right
strong tapir
mild dirge
I'm about to hit the sack so don't have time to read the whole question, but you...
tried this as well
mild dirge
already elminates one option that always kills the snake so would keep that in 😛
strong tapir
it would have looping problems
well when i did it it had looping problems
not because of my scoring or anything though i dont really know why
but it was the same behavior as 4 choices
mild dirge
I did snake with SARSA and Qlearning once (reinforcement learning), and it worked pretty okay-ish
maybe I'm able to help tomorow sometime if you haven't found any help, but I'm not really familiair with evolutional model searches
strong tapir
okay, if I dont find a solution i'm going to make an attempt with pytorch (or both)
 gilded bobcat
Hi all I have a question on how to use train_test_split in sklearn?
(with the addition of a pipeline + scaling)
So I specified a pipeline where I scale, then reg a linear regression:
#Methods to put in pipeline
scaler = StandardScaler()
reg = LinearRegression()

#Pipeline
pipe = make_pipeline(scaler, reg)
Then I do this:
            X_train, X_test, y_train, y_test = train_test_split(df, y,
                                                                test_size=ts, random_state=2)
            p = pipe.fit(X_train, y_train)
so I guess scaled my training data, but how do I go about scaling my testing data next?
Do I just do this?:
            X_test = scaler.fit_transform(X_test)
            y_predict = p.predict(X_test)
You fit the scaler on the training data. Just use it to transform the testing data - don’t fit it again, that’s data leakage
gilded bobcat
I follow. How is it data leakage? Wouldn't this be like standardizing the same subset in different ways?
neat anvil
Part of the model you trained is how it standardizes inputs. If that changes it’s not the same model anymore
gilded bobcat
Got it!
Cool, to make sure:
fit = calculate necessary parts for standardization (like SD, and Mean)
transform = apply the values from fit to actually standardize my features
neat anvil
Indeed
gilded bobcat
Is it any issue that I scale my training data within a pipe, but I scale my testing data outside of the pipe?
misty flint
neat anvil
https://fastapi.tiangolo.com/deployment/docker/ is probably a good place to star...
hey nice link. might use this for our term project
thanks
 fervent kayak
Hello everybody, 👨💻
Here I leave a project I was working on: "Symptoms-Disease Network". I hope it will be useful for those of you who want to get more into the topic of Graph Networks. 🦾💻
Link: https://github.com/dennishnf/project-symptoms-disease-network
GitHub
Analysis of the Symptoms-Disease Network database using communities. - GitHub - dennishnf/project-symptoms-disease-network: Analysis of the Symptoms-Disease Network database using communities.
 river maple
im using tensorflow and yolo to count the number of ducks but as you can see it not very accurate

how do i make it count every singe one of them
 split latch
larger dataset possibly
lapis sequoia
Is there an algorithm similar or better than the DQN algorithm?
 rugged hawk
river maple
im using tensorflow and yolo to count the number of ducks but as you can see it ...
rugged hawk
river maple
im using tensorflow and yolo to count the number of ducks but as you can see it ...
as @split latch said, You need more data to train your model, so that model can learn each and every angle of your object, In addition to that use Data Augmentation technique to overcome lack of data.
river maple
are there any good tutorials you can suggest
 upper spindle
hi guys, im building an lstm model, using average daily sentiment analysis to try and forecast crypto volatility
could anyone help by any chance?
or assist me
Ive got the data, but Im unsure on how to pre process my data
 dusk tide
rugged hawk
as <@!611418694245154847> said, You need more data to train your model, so that ...
dusk tide
rugged hawk
as <@!611418694245154847> said, You need more data to train your model, so that ...
With more data , do you mean more features ? To learn new things
There's an advice that to avoid overfitting (which occurs with addition of many many features ) you should increase your data
To avoid underfitting(which occurs from shortage of features) you need more features to learn new things
dusk tide
upper spindle
could anyone help by any chance?
Have you tried looking on yt?
upper spindle
dusk tide
Have you tried looking on yt?
i have tried yt, medium, towardsdatascience but there arent any
that are related to my specific one
because my input is the sentiment values (i know its not the best indicator, but my research is based off this, and it was an interesting topic given what happened with gme in 2021)
desert oar
dusk tide
Have you tried looking on yt?
i don't recommend youtube as a general learning resource for machine learning
lots of intro-level garbage that should be a blog post
desert oar
upper spindle
Ive got the data, but Im unsure on how to pre process my data
like most things in data science, some creativity is required
what kind of data does the model require? do i actually need any preprocessing? are there missing values? what is the distribution of the data; is it skewed, does it contain lots of extreme values? is it on a suitable numerical scale? are there any measurement problems i need to consider? what do i know about how the data was collected? etc.
upper spindle
desert oar
what kind of data does the model require? do i actually need _any_ preprocessing...
hmm, yeah, guess this is a bit step for me into programming once i get this done, thanks for your reply
 somber prism
guys i am curious to know that whether keras / pytorch model ( sequential / functional ) splits the whole dataset into number of batches when we specify them on its own or do have to explicitly use dataset class from tf.utils / torch.utils to split the dataset into number of batches we need ?
somber prism
river maple
im using tensorflow and yolo to count the number of ducks but as you can see it ...
i think this will help you https://www.youtube.com/watch?v=O3b8lVF93jU&list=WL&index=2&t=94s&ab_channel=Pysource

Source code: https://pysource.com/2021/01/28/object-tracking-with-opencv-and-python/
You will learn in this video how to Track objects using Opencv with Python.
In this specific lesson we will focus on two main steps: on the first one we will do Object detection and on the second one Object tracking.
➤ Full Videocourses:
Object Detection: http...
neat anvil
somber prism
guys i am curious to know that whether keras / pytorch model ( sequential / func...
In my experience one always has to define a dataset/dataloader
that contains the logic for how to create the minibatches
somber prism
so if i load the csv using pandas and i use train dataset for training it will not even split the training dataset into number of batches at every epoch and cache it ?
by default keras model use 16 as its batch size
neat anvil
ah I'm not entirely sure. I've not tried to just throw a dataframe at pytorch or tensorflow in a few years
I know in pytorch it's fairly trivial to pass a pile of data into a DataLoader: https://pytorch.org/tutorials/beginner/basics/data_tutorial.html#preparing-your-data-for-training-with-dataloaders
 pastel valley
is this how to load dataset from directory or there any other way?

TensorFlow
Generic image classification dataset created from manual directory.
shut trail
pastel valley
is this how to load dataset from directory or there any other way?
i dont think this is enough information to help you. Are you using tensorflow? what are you trying to load ?
pastel valley
shut trail
i dont think this is enough information to help you. Are you using tensorflow? w...
yes i am using tensforflow and following this tutorial https://www.tensorflow.org/tutorials/images/classification
but in that tutorial the dataset are downloaded online but mine is on my pc
TensorFlow
somber prism
pastel valley
is this how to load dataset from directory or there any other way?
assuming you want to prepare and load image data then if thats the case then there are 3 ways you can load 1 - you can follow this tutorial 2 - you can use tf Dataset class to read from files and read the image explicitly 3 - you can use image data generator from keras
someone correct me if i am wrong
pastel valley
is this the number 1? https://www.tensorflow.org/tutorials/images/classification
TensorFlow
image data generator is the data augmentation right?
 warm raven
Hello I have a quick question, it’s just about processing speed and efficiency
So I have a jupyter notebook with some dataframes and I’m using some .apply(pandas) to count the volume of instances based on some conditions
Yesterday i was running the script and it was executing the lambda functions in about a minute, today it took 42 minutes, yet nothing in the datasets have changed
any idea on this?
neat anvil
if you're using a notebook make sure you restart the kernel frequently. There could be some state saved you are not immediately aware of that is consuming a lot of resources to process. You could have ran out of free memory and into swap memory.
IDK check your task manager/activity monitor/htop view
see what's goin on
warm raven
Yeah i have restarted the kernel a couple times at this point, I checked my task manager but honestly all I have open at this point is chrome, notepad and my notebook instance
Yeah it’s actually a new work computer so valid question, I’m still learning it’s settings myself
I just noticed it reduces performance based on battery life so i’m testing that, for some reason it wasn’t set to max
orchid kayak
If I needed help understanding a specific method from a small library, is there a channel here for support? or do I have to resort to stack overflow?
warm raven
Tried restarting it’s still running longer than it should
pastel valley
yo what is the difference of dev set to test set?
lapis sequoia
pastel valley
yo what is the difference of dev set to test set?
dev set is usually larger and more intensive on the computer, test set is the one to test changes to code with that’s less intensive
tldr dev sets are usually bigger and more complete than test sets
somber prism
pastel valley
image data generator is the data augmentation right?
yes
hollow sentinel
is there a way i can split a large dataset into smaller ones besides chunksize in python
neat anvil
yes.
 karmic moth
yo i got a question, should we clean our text data before applying VADER to get sentiment, i meant by cleaning is removing links, emojis, stop words and such
neat anvil
hollow sentinel
i just can't figure out the optimal chunksize
what do you mean by optimal
hollow sentinel
well
if i have a 5 mil row dataset
should the chunksize be 5?
should it be 400?
the chunksize specifies how many dataframe you are breaking the dataframe into
 viral oak
Could you train an ai to emulate a cpu?
neat anvil
hollow sentinel
should it be 400?
The answer is "it depends". What are you doing to the data? how big is each row? how much RAM does the computer you're running this on have?
warm raven
warm raven
Tried restarting it’s still running longer than it should
Okay i’ve uninstalled and reinstalled python, tried installing 3.9.10 instead of 3.10
I’ve googled for like an hour now but this literally doesn’t make any sense
I changed nothing, and the run time has increased by 40 minutes I can’t get it to revert
neat anvil
so like the simple answer is the world is complicated and you probably did miss something
maybe there was a typo or some inconsistent state in your code previously and it wasn't actually doing anything
pastel valley
i used this to load dataset from myfiles but i dont know how to use that dataset as its different on the tutorial i mfollowing
TensorFlow
Generic image classification dataset created from manual directory.
neat anvil
or there is some security feature on your work laptop that kicked in
 cinder schooner
hello
so i'm new to deep learning and i'm coming from a software background
and i'm not understanding how to debug a model
if it aint working what do i need to do
i tried to do a classifier with cnn's on keras
but it give me 0 precision and 0 recall
and i'm not understanding why
neat anvil
if you're brand new to data sci, you'll need some courses to really understand what's going on. I recommend this one to start: https://www.coursera.org/learn/machine-learning
Coursera
Learn Machine Learning from Stanford University. Machine learning is the science of getting computers to act without being explicitly programmed. In the past decade, machine learning has given us self-driving cars, practical speech recognition, ...
starting with tensorflow is really jumping into the deep end, sklearn will be a lot easier to use and understand as a beginner
pastel valley
somber prism
yes
but i can use my custom dataset using imagedatagenerator.flow_from_directory on training right?
TensorFlow
Generate batches of tensor image data with real-time data augmentation.
i tried this one to get my dataset from my disk but i dont know how to interpret it on model fit https://www.tensorflow.org/datasets/api_docs/python/tfds/folder_dataset/ImageFolder
TensorFlow
Generic image classification dataset created from manual directory.
 trail ibex
If anyone is free at the moment, I think I need a little help with filtering a pandas dataset in a specific way. I think I need a lambda to do it, but I am really uncertain. Any help is appreciated
Specifically, I have a set which has columns containing "year" and columns containing "GPD". I want to filter the entire set to the top 10 GDP for year = 2016, and I can't seem to figure it out (I am a complete newbie)
neat anvil
top10_2016 = dataframe.loc[dataframe["year"] == 2016].sort_values(by="GDP", ignore_index=True)[0:10,:]
happy to explain those operations.
if it isn't clear.
trail ibex
Thanks Raymond, I'll try that. I tend to get ridiculously mixed up with slices upon slices, and I don't want to end up wrecking the dataset. I think I understand it, but I haven't seen that "[0:10,:]" notation before
neat anvil
if you then want to restrict the entire dataset to only be of, say, countries that are in the top 10 from 2016, you would use a merge/join
just never use inplace operations and you cannot mess up your dataset
trail ibex
That's exactly what I want to do. I want to reduce it to that before I clean
neat anvil
it will always return a new copy
neat anvil
you may need to use a .loc[0:10,:] instead of just directly indexing
or something like that
it depends on what is the index of the original dataframe
trail ibex
Yeah, I can work that out I think. So once I filter to say top10_2016, I'm going to then use a join to only grab the part of the dataset I want, right? So a join between DataFrame and top10_2016
Prob an inner join?
An outer would give me everything else, is that right?
neat anvil
yes
trail ibex
fantastic. that really helped, thank you very much! I need to do a little re-reading of my course notes on joins, but now I have a direction 🙂
neat anvil
pandas recently (in the last two years or so) really revamped their documentation. Their user guide is fantastic now https://pandas.pydata.org/pandas-docs/stable/user_guide/merging.html
trail ibex
Thank you, I'll definitely check it out, I just wasn't sure where to start, if you get me 🙂
Hmmm.....Raymond, are you still around?
Actually, it's OK, I might have worked it out, sorry 🙂
heh, I didn't, but it's an issue for tomorrow. After 14 hours work, this is a bit much for me this evening. Thank you again for the pointers though, that really did help
neat anvil
best way to solve a bug is to take a walk, it is known
pastel valley
i used the flow_from_directory to use my dataset then i try to use predict on the model
does this mean its the 2nd folder on my dataset path?

2nd class?
how do i get my class order?
which column is which?
 prime hearth
hello, i would like to please ask when i use linear regression to train my model with 1 feature , my weights come out to be:
[[9.93913395e+01]
[4.91854753e-02]] with total cost:12574506.390053065
but when i add a column of ones with no significant meanign just added constant as another feature, so now x has 2 features, i get this result for weight:
[[45.37046397]
[61.61637914]] total cost 8528045938.546642
i was wondering, are smaller weights always prefered or the best?
because me weights are very small and large 99 and 0.04
minor elbow
the nominal values of weights/cost dont really matter
linear regression needs its input features to be on similar scales
so if u have a feature that ranges from 100,000+ and a feature thats like 0.00001 ish
linear regression will not do very well
the usual best practise is to scale them by subtracting the mean and dividing by the std deviation so they are all in the same numeric ballpark
if u think of the equation of a line y = a + bx
linear regression is just trying to find a straight line of that form
when you add the columns of 1s, you're giving it the a term
it just lets linear regression cross the y axis at some other value from 0
minor elbow
pastel valley
i used the flow_from_directory to use my dataset then i try to use predict on th...
yes usually its lowest to highest class order from left to right, you could run predict() on your training set to see what class labels are assigned to which training input to check
minor elbow
minor elbow
the nominal values of weights/cost dont really matter
this is assuming you are building a predictive model not an interpretative model
lapis sequoia
hi guys can anyone help me installing dlib i cant get it working i also installed the vs compiler stuff and cmake too
serene scaffold
lapis sequoia
hi guys can anyone help me installing dlib i cant get it working i also installe...
is this a data science question? in either case, please be specific about what your problem is. if there's an error message involved, put the whole thing in the pastebin and show it
!paste
arctic wedgeBOT
Pasting large amounts of code
If your code is too long to fit in a codeblock in discord, you can paste your code here:
https://paste.pythondiscord.com/
After pasting your code, save it by clicking the floppy disk icon in the top right, or by typing ctrl + S. After doing that, the URL should change. Copy the URL and post it here so others can see it.
lapis sequoia
https://paste.pythondiscord.com/pizufosoca.lua this is my output when i try to install it
stone marlin
Python config failure: Python is 32-bit, chosen compiler is 64-bit
serene scaffold
first I would pip install -U pip setuptools wheel and then try again. and if that doesn't work, install the C++ build tools
!build
arctic wedgeBOT
Microsoft Visual C++ Build Tools
When you install a library through pip on Windows, sometimes you may encounter this error:
error: Microsoft Visual C++ 14.0 or greater is required. Get it with "Microsoft C++ Build Tools": https://visualstudio.microsoft.com/visual-cpp-build-tools/
This means the library you're installing has code written in other languages and needs additional tools to install. To install these tools, follow the following steps: (Requires 6GB+ disk space)
1. Open https://visualstudio.microsoft.com/visual-cpp-build-tools/.
2. Click Download Build Tools >. A file named vs_BuildTools or vs_BuildTools.exe should start downloading. If no downloads start after a few seconds, click click here to retry.
3. Run the downloaded file. Click Continue to proceed.
4. Choose C++ build tools and press Install. You may need a reboot after the installation.
5. Try installing the library via pip again.
lapis sequoia
serene scaffold
first I would `pip install -U pip setuptools wheel` and then try again. and if t...
already did that
lapis sequoia
stone marlin
`Python config failure: Python is 32-bit, chosen compiler is 64-bit`
how would i install the 32 bit one
okay im installing 64-bit python now
serene scaffold
what about 69-bit? that's the funny number.
lapis sequoia
yeah true lol
serene scaffold
we need more funny numbers
lapis sequoia
25-bit?!
serene scaffold
idk
serene scaffold
🔥
prime hearth
Hello, if you have time I would really appreciate if you can review my first data science blog post on linear regression, and can let me know if feel that it is beginner friendly or things you liked and dont like.
hollow sentinel
so let me get this straight
you can use df.drop_duplicates() to drop rows that are identical copies of each other
you can also pass in a kwarg with df.drop_duplicates(subset = [col_name]) to drop a repeated row value
 hollow sentinel
hi rex
hollow sentinel
so what are some good visualizations you can use for a regression?
lmplot is always good
a heatmap that can show missing values is good
a correlation map across variables
boxplots?
neat anvil
Depends more on the data and the argument you’re trying to make with it, I think
 tidal thorn
Hey people. How do you know what caused what to increase/decrease in value?
neat anvil
Yes, sort of. Sensitivity analysis. Deep Attention analysis
tidal thorn
I'm struggling to figure out how to structure my question erm..
neat anvil
For simple models you can derive the relationship between inputs and outputs analytically and it’s “easy”
For more complex models like random forests there are surrogates to that, like summing up the leaf weights, which work pretty well
tidal thorn
mild dirge
what do you mean?
I'm basically analyzing this data regarding fuel sales and the loyalty program they have with. I noticed a huge spike in loyalty points gained for one of these months, then suddenly wondered whats the proper way of knowing what caused what to increase/decrease.
neat anvil
For deep learning it’s incredibly complex and still an active area of research, tho much progress has been made
mild dirge
Seems like you want to check for correlation
but that will not tell you which one is the cause and which the effect
tidal thorn
mild dirge
Seems like you want to check for correlation
I was thinking about that which came to me wondering, if i didnt have domain knowledge, how'd I know whether A affected B or B affected A?
tidal thorn
mild dirge
but that will not tell you which one is the cause and which the effect
yeahh exactly
neat anvil
Ohhhh boy
tidal thorn
how do people go about it?
neat anvil
So You basically just asked “how do I science with data”
Great question!
Hard answers
tidal thorn
me? haha
neat anvil
Yes you
I can lead you to water, but I cannot make you drink: https://youtube.com/playlist?list=PLDcUM9US4XdMROZ57-OIRtIK0aOynbgZN

YouTube
Course outline and materials https://github.com/rmcelreath/stat_rethinking_2022
neat anvil
In short- it’s statistics, there is a lot of math involved, and you need domain knowledge to make sense of data
tidal thorn
currently rushing this study
neat anvil
You cannot invent causality out of data
tidal thorn
i see. thank you very much!
tidal thorn
mild dirge
but that will not tell you which one is the cause and which the effect
thank you as well. now i know how to better structure my question haha!
minor elbow
tidal thorn
I was thinking about that which came to me wondering, if i didnt have domain kno...
this is attribution and causality, the short answer is ppl do A/B tests
in addition to what the others said
misty flint
neat anvil
I can lead you to water, but I cannot make you drink: https://youtube.com/playli...
starts with bayesian inference, thats pretty cool

strong tapir
mild dirge
I'm about to hit the sack so don't have time to read the whole question, but you...
Have you had a chance to look at the problem?
 tidal osprey
Hello! I need to do a project using multiple data mining algorithms using real world data. Ideally the data shouldn’t have been worked on like in Kaggle, any recommendations for sources?
serene scaffold
tidal osprey
Hello! I need to do a project using multiple data mining algorithms using real w...
wikipedia?
tidal osprey
serene scaffold
wikipedia?
For csv files with large number of records?
serene scaffold
tidal osprey
For csv files with large number of records?
I mostly do information extraction from natural language documents, so my idea of what "data mining" involves might be different from what you had in mind. though I think it's unlikely that you'll find a prepared CSV that hasn't been "worked on".
karmic moth
When using VADER sentiment on text, should we clean the data, cleaning in the sense is like removing irrelevant links, stop words, emojis and symbols?
misty flint
tidal osprey
Hello! I need to do a project using multiple data mining algorithms using real w...
lol "worked on" meaning cleaned up and put into a csv? many csv files out there have gone through some sort of data preprocessing
you can collect your data through web scraping instead
or use google datasets. some of those havent been "worked on" (still not sure what you mean by this)
for our data mining project, we will probs do some sort of clustering with this one dataset
river maple
I want to count large number of ducks from a webcam or photo. What would be the best approach for it?
arctic wedgeBOT
:incoming_envelope: :ok_hand: applied mute to @glossy meteor until <t:1645179155:f> (9 minutes and 59 seconds) (reason: duplicates rule: sent 4 duplicated messages in 10s).
 grave frost
neat anvil
You cannot invent causality out of data
grave frost
neat anvil
You cannot invent causality out of data
you can?
the correlation of data points is a strong proxy for causation - and it works in practice decently well. yea "correlation does not imply causation" but it is no doubt a more useful technique to actually triangulate the cause for almost any event...
odd meteor
tidal thorn
Hey people. How do you know what caused what to increase/decrease in value?
In the context of regression, it's the collective of interactions between your model parameters and explanatory variables.
Getting your predicted regression line equation will give you the information you seek (For regression problem).
For a deeper dive, you'd have to explore Causality in ML
-
If you're interested in comparing 2 versions of a variable = A/B Testing (randomized control test)
-
If you're interested in comparing more than two versions of a variable (treatment effect) = Confounding
You might wanna explore these 3 stats fields:
i) A/B Testing
ii) Experimental Design
iii) Inference & Causality in ML
 lime crow
Hi , I need a dataset for clean audio for various anime / cartoon characters . can somebody help me with it .
arctic wedgeBOT
:incoming_envelope: :ok_hand: applied mute to @cloud parcel until <t:1645184493:f> (9 minutes and 59 seconds) (reason: duplicates rule: sent 4 duplicated messages in 10s).
 final field
anyone got successful on using object detection with m1 mac?
upper spindle
do i need to minmaxscaler my data, which is represented in percentage
for an lstm model
desert oar
upper spindle
do i need to minmaxscaler my data, which is represented in percentage
a percentage is already scaled by definition; however you always want to look at the distribution of the data
upper spindle
desert oar
a percentage is already scaled by definition; however you always want to look at...
hmm yeah, thats what i thinking, percentage is already scaled, thank you
 silk axle
@karmic moth we don't allow sharing of surveys in this community. That's why your message got deleted by our bot
upper spindle
does anyone have recommendations or any idea to setup my input of sentiment values
 analog bison
prime hearth
Hello, if you have time I would really appreciate if you can review my first dat...
analog bison
prime hearth
Hello, if you have time I would really appreciate if you can review my first dat...
checking it out
prime hearth
Thanks! Someone gave me feedback to include:
Examples with math concepts shown
Introduce math with example iteratively
Check our how textbook do it and try their approach.
My goal is to make a data science blog posr about linear regression that is very simple not big paragraph just 1-2 setence descussing the main points something that can attract beginners from highschool or or new developers transitioning into data science but helps to understand the deep math and its practical application while making it simple and fun to read
arctic wedgeBOT
:incoming_envelope: :ok_hand: applied mute to @lapis sequoia until <t:1645195290:f> (9 minutes and 59 seconds) (reason: duplicates rule: sent 4 duplicated messages in 10s).
lapis sequoia
how do i make ai?
 sacred shuttle
hello guys I am implementing stochastic gradient descent from scratch on fashion_mnist dataset with just numpy and when I take only 100 datapoints from the data the the algo works fine with 100% accuracy in just 90 epochs but if take 1000 datapoints it shows this warning and my score doesn't increase beyond 10% did anyone faced this problem? or can help me fix this

with 100 datapoints

 pearl fern
how can I use CountVectorizer from sklearn so that it counts all of my characters?
cv = CountVectorizer(analyzer='char')
i am doing something like this
wicked grove
hello im training my model using k fold cross validation
this is my code
i use tf.keras.backend.clear() and get an acc of 90 but when i dont use it i get and acc of 82
can someone pls tell me why
from sklearn.model_selection import KFold
kf = KFold(5,shuffle=True,random_state=42)
histories=[]
cvscores=[]
fold=0
for train,test in kf.split(X_new_img):
  fold+=1
  print('fold',fold)
  X_train1 = X_new_img[train]
  X_val = X_new_img[test]
  Y_train1=onehot[train]
  Y_val=onehot[test]
  history = model3.fit(X_train1,Y_train1,epochs=50,validation_data=(X_val, Y_val),callbacks=[early_stopping])
  histories.append(history)
tf.keras.backend.clear_session()```if i wanted to use a certain data visualization that i liked from someone else's code on kaggle, how do i credit them?
bc i don't want to plagiarize their work
hollow sentinel
#understanding the distribution with seaborn
with sns.plotting_context("notebook",font_scale=2.5):
    g = sns.pairplot(dataset[['sqft_lot','sqft_above','price','sqft_living','bedrooms']],
                 hue='bedrooms', palette='tab20',size=6)
g.set(xticklabels=[]);
Explore and run machine learning code with Kaggle Notebooks | Using data from House Sales in King County, USA
i liked how he used a pairplot
/***************************************************************************************
*    Title: <title of program/source code>
*    Author: <author(s) names>
*    Date: <date>
*    Code version: <code version>
*    Availability: <where it's located>
*
***************************************************************************************/

e.g.

***************************************************************************************/
*    Title: GraphicsDrawer source code
*    Author: Smith, J
*    Date: 2011
*    Code version: 2.0
*    Availability: http://www.graphicsdrawer.com
*
***************************************************************************************/
would that work?
mild dirge
If you exactly copy it then yeah
but using a pairplot is pretty common to visualise correlation
stone marlin
Yeah, you can almost certainly just use the pairplot, you do not need to copy the whole thing. If you do, it's under https://www.apache.org/licenses/LICENSE-2.0 and you'd have to follow that.
[The license they use is at the bottom of that notebook page.]
But pairplot is extremely common, so I wouldn't worry about it.
hollow sentinel
oh ok cool, i just didn't wanna be in hot water over it
i like kaggle a lot
it's nice to see how people think about this stuff
and what they do w datasets
sns.pairplot(head_of_house_sales,
             x_vars = ["sqft_lot","sqft_above","sqft_living","bedrooms"],
             y_vars = ["price"],
)
sns.pairplot(
    penguins,
    x_vars=["bill_length_mm", "bill_depth_mm", "flipper_length_mm"],
    y_vars=["bill_length_mm", "bill_depth_mm"],
)
``` the doc where i took it fromExplore and run machine learning code with Kaggle Notebooks | Using data from House Sales in King County, USA
dataset
it just won't load at all
misty flint
hollow sentinel
if i wanted to use a certain data visualization that i liked from someone else's...
sometimes i see people posting a link to the kaggle in the comments
or just in a separate section at the top or bottom
 turbid knot
hello
hollow sentinel
misty flint
sometimes i see people posting a link to the kaggle in the comments
i see
turbid knot
i have a question how can i make that i scrape every hour and it adds data to excel also every hour keeping the previous data
misty flint
sounds like a data engineering problem. it depends on your tooling. lots of options out there.
turbid knot
i know but i don't have any ideas how to complete it
serene scaffold
turbid knot
i have a question how can i make that i scrape every hour and it adds data to ex...
can you put it in a database instead? if you put it in excel, you have to rewrite the entire excel file each time.
(which is just a matter of loading the whole file into memory, adding the new row, and then writing the entire file back to memory. not difficult per se, but doesn't scale well.)
turbid knot
serene scaffold
(which is just a matter of loading the whole file into memory, adding the new ro...
i haven't learned databases yet
serene scaffold
turbid knot
i haven't learned databases yet
might be a good time to try it. the alternative is to use a library that interfaces with excel, like pandas or openpyxl.
(I think the excel stuff that pandas does just delegates to openpyxl though.)
turbid knot
oh i am using pandas to import data to excel
serene scaffold
you're just adding new rows, yes?
turbid knot
i thing i can just send the code
serene scaffold
!code
arctic wedgeBOT
Here's how to format Python code on Discord:
```py
print('Hello world!')
```
These are backticks, not quotes. Check this out if you can't find the backtick key.
turbid knot
from bs4 import BeautifulSoup

import requests

import webbrowser

import pandas as pd

import re

WEBSITE = 'https://www.meteolapa.lv/laika-apstakli'

source = requests.get(WEBSITE).text

soup = BeautifulSoup(source, 'lxml')

# izraku tabulas rindas

tabula = soup.find_all('tr', class_='station-row')

x=[]


for tab in tabula:
    #tabulas datus pārvērš tekstā un aizvieto newlines ar nepieciesamajiem simboliem

    t = tab.text.replace('\n', '', 4 ).replace('\n',',',4).replace('\n', '', 1 ).replace('\n', ',', 5 ).replace('\n', '', 1 ).replace('°', '')
    #sadala vārdus pa string
    chunk = t.split(',')
    #ja tabulas tekstā ir LV Ceļi, Rindas ar LV Ceļi tiks ielikti listā
    if 'LV Ceļi' in t:
        x.append(chunk)
#print(x)


#lists tiek sakārtots tabulā
df = pd.DataFrame(x, columns =['Vieta','LV Ceļi','Laiks','Temperatūra','Nokrišņi','Vējš','Mintl','Maxtl','Mint','Maxt'])

bistami = df[['Temperatūra']]

lol = bistami.apply(pd.to_numeric, errors='coerce')

df['Temperatūra'] = lol

#tabla tiek aizvesta uz excel

df.to_excel (r'C:\Users\Administrator\Downloads\dasmais.xlsx', sheet_name = '20.00')

ainazi = df.iloc[1]

df2 = pd.DataFrame(ainazi)
for lols in range (23):
    df_t = df2.T
#df_k = df_t

   # df_t = df_t.append(df_k,ignore_index=True)


df_t.to_excel (r'C:\Users\Administrator\Downloads\lol.xlsx', sheet_name = 'lol2')

df_t
my plan was make the data frame with 24 the same data and then i will make the part that replaces the data in next column after hour if it is possible
serene scaffold
turbid knot
```py
from bs4 import BeautifulSoup
import requests
import webbrowser
import ...
this code has a lot of unnecessary blank lines, making it harder to read.
once you have the scraped data, can you put all the scraped data in one dataframe, ignoring the existing dataframe entirely?
turbid knot
did you mean can i make dataframe form scraped data right?
if yes then yes i can make
serene scaffold
so once you have the dataframe for the scraped data, you can just concatenate that with the existing data and save it again
turbid knot
and how can i do that?
upper spindle
do i need to split my data that i am putting into my lstm model
 serene scaffold
turbid knot
and how can i do that?
serene scaffold
turbid knot
and how can i do that?
!docs pd.concat
arctic wedgeBOT
No way, José.
No documentation found for the requested symbol.
arctic wedgeBOT
pandas.concat(objs, axis=0, join='outer', ignore_index=False, keys=None, levels=None, names=None, verify_integrity=False, sort=False, copy=True)```
Concatenate pandas objects along a particular axis with optional set logic along the other axes.

Can also add a layer of hierarchical indexing on the concatenation axis, which may be useful if the labels are the same (or overlapping) on the passed axis number.<@&944289106182172672>
what
I was trying to ping Joe to get him to add pd to the docs thing
 echo vigil
If I have some SQL query which is able to query all my training data what's the standard way to pull the data into your ML workflow? All my ML experience has been on local csv's D:
desert oar
echo vigil
If I have some SQL query which is able to query all my training data what's the ...
i use parquet files, and i track the files using dvc
the general workflow is probably not very different from yours: write a script or sql query, run it, save the data to your local workspace
however, i use dvc to run it and track the generated file, and i commit the dvc metadata to my project's git repo (this is the "standard" dvc setup)
if i am going to share the project or work on multiple machines, i also like to use a dvc remote, so other people can pull down my intermediate data files and artifacts without re-running everything

Data Version Control · DVC
Open-source version control system for Data Science and Machine Learning projects. Git-like experience to organize your data, models, and experiments.
there are other workflows for bigger datasets and more sophisticated teams, but this has served me well up into the "medium data" range (where "medium" means "too big for memory, fits on disk") on small teams
obviously parquet is one possible file format, mostly as a better alternative to csv
iron basalt
You can also run your own local database management system and store it in there if you want. However you want, DVC is pretty nice too.
desert oar
sqlite databases are another option, as are hdf5 arrays
or sometimes numpy text files
iron basalt
(I recommend one with a nice GUI)
desert oar
and yeah, i have also done it by running a local postgres database (for times when i needed more features than sqlite had to offer)
i think i ended up using luigi for that, wayyyy back when data engineering and etl workflow tools were new and i didn't know what i was doing
the main limitation of dvc is that it only recognizes files as inputs and outputs, so it doesn't work well if you are using a local database
i think there is an airflow plugin that lets you run dvc targets from airflow, or something like that? idk
echo vigil
super helpful ty! Does dvc have strict file limit sizes or can you indiscriminately put large data on it?
desert oar
arbitrary, because dvc doesn't store the files as such. it just tracks the file hash and stores it in a metadata yaml file
iron basalt
If you are on Linux you can ofc setup a bunch of stuff with some bash scripts, etc. Databases, DVC, whatever combination.
And pipe them into each other, etc.
desert oar
(note: you can configure dvc to use a centralized cache such that files are symlinked to prevent them from being duplicated in multiple places; this is very very useful if you are sharing a workstation with other researchers or if you are using the same data files in several projects)
yeah i use dvc basically as a replacement for make
so typically my dvc tasks are either python or shell scripts
i was recently introduced to something called DBT
which seems more like an airflow alternative
but it does seem like it could be useful for "small scale" projects and i am curious if/how it integrates with something like dvc
i always struggled with the process of getting things from research to production; i have done it, but only because i am a solid programmer and i had the ability to rewrite everything from the bottom up to suit whatever production constraints we had
"ml lifecycle" tools are still pretty new and i never had a chance to try them out, they all seemed kind of intrusive w/ respect to individual researchers' workflows
echo vigil
Thank you both!
 rain temple
Can someone who is familiar with TimeDistributed Layers pls help me. I am using an object detection model for Aerial Images and I am getting this error message.
 iron basalt
desert oar
"ml lifecycle" tools are still pretty new and i never had a chance to try them o...
iron basalt
desert oar
"ml lifecycle" tools are still pretty new and i never had a chance to try them o...
I imagine most (me projecting here), still just do their own thing, probably a Linux machine scripted to oblivion with a database or makeshift-database at the center of it all.
desert oar
fair enough. it's easy to read too many blog posts and get "tech stack fomo"
iron basalt
desert oar
fair enough. it's easy to read too many blog posts and get "tech stack fomo"
Well, it's either me doing that Linux machine, or them but with a nice fancy website.
And I already have the machine so I just stick with it.
(it's kind of like learning a new framework only to end up with the same thing, except I don't control it / can't fix it)
hollow sentinel
why do i keep seeing rehape (-1,1) when it comes to X_train?
along with X_test?
the -1 will only cause it to have one colum?
tidal bough
hollow sentinel
why do i keep seeing rehape (-1,1) when it comes to X_train?
-1, -1 should be invalid I believe
a single -1 size is allowed, which means "infer from the other ones and the array size".
hollow sentinel
sorry, typo
tidal bough
e.g. you can reshape (20,) into (5,-1), which will come out as (5,4)
so (-1,1) is basically flattening to an (X,1) array
hollow sentinel
i see
misty flint
desert oar
fair enough. it's easy to read too many blog posts and get "tech stack fomo"
honestly same
i see a lot of stuff about data engineering and every other content is about new tooling
desert oar
misty flint
i see a lot of stuff about data engineering and every other content is about new...
yep. beware submarine marketing!
and content marketing in general
misty flint
and then i hear podcasts about stuff at big companies
and theyre just like "oh yeah we just make a wrapper for X, Y, Z based on A, B, C open source project"
and im just like "oh."
and many of them just create tooling for their data scientists/ML peeps
ofc theres also the ETL side too
anyway, why did i come here? oh yeah i had a question. its more of a data analysis / approach tbh
so this is from the public CMS dataset

does it make sense for me to create some type of calculation / measure (with the above highlighted) in order to compare various hospitals across the country?
i guess in this instance i want to create a sort of "mortality score"
what would be your approach to this especially when the data is collected in this way?
desert oar
misty flint
does it make sense for me to create some type of calculation / measure (with the...
sure, this is often what social scientists try to use factor analysis for
misty flint
ah very interesting
desert oar
specifically factor analysis will attempt to find one or more "latent factors" that "explain" this data
this specific data is funky, i wonder if there are some considerations about independence (or lack thereof) here
these are almost like order statistics
"number of features that are better than the national overall value"
i wouldn't just slap that all into factor analysis
in some sense this is already a highly aggregated score
plus the number of measures used at each facility is some kind of normalization factor that you need to think about how to use
misty flint
desert oar
plus the number of measures used at each facility is some kind of normalization ...
ah that is true. that last bit didnt even cross my mind until you pointed it out
honestly its such a weird way they collected/measured this
especially in the very end of it all, they assign each hospital an overall star rating (1-5)
which makes sense i guess, for the average lay person
but still
pastel valley
minor elbow
yes usually its lowest to highest class order from left to right, you could run ...
so if my folder is arranged like this
then this prediction means
rabbit?


 lucid mulch
im seeing theres a lot of packages for visualizing data these days, not just matplotlib
is there one definitive 'best' among them, or is it all down to personal preference?
bokeh and plotly can be interactive too, im not sure where you experience the interactive-ness though. is it interactive in a jupyter notebook?
 waxen girder
I have two series objects A,B in pandas and I want to check if A is contained in a B. How can I do that?
desert oar
misty flint
especially in the very end of it all, they assign each hospital an overall star ...
do you know how the star rating is constructed?
desert oar
waxen girder
I have two series objects A,B in pandas and I want to check if A is contained in...
!d pandas.Series.isin
arctic wedgeBOT
Series.isin(values)```
Whether elements in Series are contained in values.

Return a boolean Series showing whether each element in the Series matches an element in the passed sequence of values exactly.it depends on what you mean by "contained in"
waxen girder
Does that method repect the index?
desert oar
no, it treats the values as a plain collection of values. can you be more specific about what you mean by "contained in"?
waxen girder
So imagine if A is a series of first names and B is a series of first and last names separated by spaces. I want to check if the first name is in B but only for the same row.
Does that make sense? I want to create a boolean series representing if that condition is true or false.
A         B                     C
Smith Smith Dude True
Kelly  Ann Doe        False
Bob    Bob Dill          True
I'm on mobile and my formatting sucks sorry.
misty flint
desert oar
do you know how the star rating is constructed?
yes, im on mobile but from what i remember, each category is weighted (mortality, safety, etc.) and then knn clustering was used to separate every hospital into 5 categories aka 5 star ratings. i can double check when i get to a computer
desert oar
waxen girder
So imagine if A is a series of first names and B is a series of first and last n...
Just use ==
waxen girder
I'll give it a shot.
iron basalt
desert oar
Just use `==`
I think they mean B has multiple words / names in it?
In which case use split.
and in
waxen girder
But that checks for exact match. I'm asking if A is substring of B.
iron basalt
waxen girder
But that checks for exact match. I'm asking if A is substring of B.
>>> "bob" in "bob dan"
True
when I try to use in I get unstable type 'Series'
iron basalt
But you don't want substring search.
waxen girder
A in B doesn't work.
iron basalt
A and B are series, you need to apply the check to a row like you asked for.
waxen girder
A.iloc[0] in B.iloc[0] works, how can I vectorize that?
iron basalt
Before you vectorize, let me tell you why that is not what you want.
What if the names are like this: "bob" in "bobaly oboba"
Clearly the name is neither of those two, but it's a substring of it.
waxen girder
I'm fine with that for now actually.
I think my example wasn't the best to illustrate my point. I do want to search for substrings and not exact matches.
iron basalt
waxen girder
I think my example wasn't the best to illustrate my point. I do want to search f...
Try using apply first, there may be something better, but whatever.
 dapper totem
if im working with a table like so as a Spark dataframe: ```sql
| received | userId | column... | column...| ...
2022-01-07 06:23:02 se23289 ..... .....
2022-01-03 22:21:33 se23289 ..... ......
2022-01-16 18:01:45 se12355
2022-01-11 02:35:23 se23289
2022-01-13 05:24:21 se12355
apply worked, now I just need to do some debugging.
 serene crystal
anyone have any tips on making matplotlib graph faster? I'm trying to make a sorting algorithm visualizer with bar graphs, and the issue I'm running into now is that it updates too slowly
serene crystal
I'll check it out 👍
misty flint
dapper totem
if im working with a table like so as a Spark dataframe: ```sql
| received...
pretty sure theres a drop_duplicates() function too just like in pandas
at least in pyspark
i vaguely remember that from my big data class
unless im wrong, in which case im sorry
i would take a look at the documentation
dapper totem
no that same function is in spark too, it just drops the row upon first occurrence. Which isnt the same as dropping it based on the first 'time' its seen based on timestamp (the other column) @misty flint so thats where im confused more or less. thanks for the response tho, no one checks this channel lol
misty flint
dapper totem
no that same function is in spark too, it just drops the row upon first occurren...
i guess im not understanding the entire question but you might have to end up writing your own function. maybe someone else understands.
prime hearth
Hello sorry, not sure if this is right channel but would appreciate any feedback on this blog how it is for beginner for linear regression, thanks!
https://medium.com/@alexm5492/linear-regression-from-scratch-3-methods-2e803d82137c
 rare saddle
accuracy = accuracy_score(pred, labels_test)
or
accuracy = accuracy_score(labels_test, pred)
I just started machine learning and I just want to ask what is the correct way to find accuracy
desert oar
rare saddle
accuracy = accuracy_score(pred, labels_test)
or
accuracy = accuracy_score(labels...
the documentation tells you which one is correct
scikit-learn
Examples using sklearn.metrics.accuracy_score: Plot classification probability Plot classification probability, Multi-class AdaBoosted Decision Trees Multi-class AdaBoosted Decision Trees, Probabil...
rare saddle
desert oar
the documentation tells you which one is correct
In the documentation it is ```py
accuracy_score(test, prediction)
but I am watching udacity tutorials and they did opposite
so I am kinda confuse because Udacity ppl are pretty experts
rare saddle
rare saddle
accuracy = accuracy_score(pred, labels_test)
or
accuracy = accuracy_score(labels...
is it both same or not?
iron basalt
rare saddle
is it both same or not?
No, the documentation is the official source for what is correct.
rare saddle
so whom should i follow? udacity or documentation
stone marlin
Why would you follow a tutorial over the official documentation?
https://github.com/scikit-learn/scikit-learn/blob/7e1e6d09b/sklearn/metrics/_classification.py#L144 Either way, here's the specific line in the code saying explicitly what's happening. It also doesn't seem like this was swapped any time in the recent past, according to the commits, but perhaps their video is older. Or, perhaps, they just made a mistake.
arctic wedgeBOT
sklearn/metrics/_classification.py line 144
def accuracy_score(y_true, y_pred, *, normalize=True, sample_weight=None):```Note that this was probably a simple mistake on their part, especially because accuracy is symmetric for the basic cases, so if you're just doing regular stuff you can flip them and still get the same answer.
y_pred = np.array([0, 0, 0, 0, 0, 1, 1, 1, 1, 1])
y_true = np.array([0, 1, 1, 1, 0, 1, 1, 1, 1, 1])

print(accuracy_score(y_pred, y_true))  # 0.7
print(accuracy_score(y_true, y_pred))  # 0.7

y_pred = np.random.randint(0, 2, size=1000)
y_true = np.random.randint(0, 2, size=1000)

print(accuracy_score(y_pred, y_true) == accuracy_score(y_true, y_pred))  # True
Having said that, you should always follow the documentation for this sort of thing.
lapis sequoia
stone marlin
For example, the recall score is not symmetric.
y_pred = np.array([0, 0, 0, 0, 0, 1, 1, 1, 1, 1])
y_true = np.array([0, 1, 1, 1, 0, 1, 1, 1, 1, 1])

print(recall_score(y_pred, y_true))  # 1.0
print(recall_score(y_true, y_pred))  # 0.625
Yep, same link, but the line below. :']
lapis sequoia
Bro i need help in data science, I have a dataset but its a txt file, so i want convert that txt dataset so that i can feed the X and Y into the Model (ML Model)
stone marlin
There's a lot of unknowns here, but you can probably do something like this [https://pythonbasics.org/read-csv-with-pandas/] to get it into a pandas df and use that.
mint palm
There are various techniques to improve accuracy but the research paper only mentions use of CNN, LSTM, Softmax and no. Of layers....should i assume they already incorporated those small techniques
And they also mentioned the dataset and its distribution
 untold belfry
Can anyone tell me here which numpy function I have to use if I want to compare regarding a function?
I have one custom function I'd like to use to compare two strings and that for a whole nx1 array with an other nx1 array.
mint palm
numpy. array_equiv() for arrays
lapis sequoia
== would give a boolean array too iirc.
wait by compare, you mean some different comparison?
untold belfry
Basically something like:
Compare Array A with itself, if the entries are close enough, enter their row number in Array B.
In numpy logic this should look like:
B = A1xA2 (nxn = nx1*1xn), then enter the index of A2 if similar enough
And in the end sum each row of B (turn nxn into nx1) to a string of values divided by ,;| or something like that.
stone marlin
You might want to use https://numpy.org/doc/stable/reference/generated/numpy.isclose.html and then make that a mask for whatever you're doing with B.
untold belfry
But I need to use this: fuzz.partial_ratio(A[:, 1], A[:,1])
Not sure I can do this with numpy only, though.
But I would prefer it cause of running time.
Similar, as if I did do it with max(A[:, 1], A[:,1]) > 20, enter Index for example.
lapis sequoia
you talked about string here tho. numpy is more of numpy.
stone marlin
I'm not quite getting what you're doing here. Is A1 the same as A2 above, just transposed?
untold belfry
It's the same, basically, just transposed.
I'm comparing column A with itself to find similar values.
The similarity is defined by the Levensthein algorithm.
But I want to prevent using a for loop or lambda cause of running time.
untold belfry
lapis sequoia
you talked about string here tho. numpy is more of `num`py.
I know, but the way it does vectorization is even for strings quite useful as it's a parallelly running loop instead of running one by one.
I'm mostly using it to save running time.
stone marlin
Have you tried np.vectorize for this yet?
I'm not sure it would work, I'm still kind of piecing together the thing.
untold belfry
Normal Python programming I already could do and indeed it does work already.
No, I'm quite new to numpy.
Let me check and I'll post the not numpy version here.
lapis sequoia
an example would help. yes.
also i think these 2 steps may be done in one, since there's just one vector.


adding reshape after this
stone marlin
Right, I got this so far.
A = np.array([[1, 2, 3]])
M = A.T @ A

# out:
array([[1, 2, 3],
       [2, 4, 6],
       [3, 6, 9]])
This is the working loop version:
import pandas as pd
from fuzzywuzzy import fuzz
print('Benvenuto al primo progetto di Ale')
# read in data
df = pd.read_csv(r'C:\Users\me\PycharmProjects\Test_Data.csv')
strName = 'Job Title Product'
df[strName] = df['Job Title'] + ' ' + df['Product']
simRows = 'Similar Rows'
df[simRows] = ''
cVal = ''
val = ''
#comparison loop
for i in range(len(df)):
    #read in value i
    cVal = df.at[i, strName]
    for j in range(len(df)):
        #compare similarity
        if fuzz.partial_token_sort_ratio(cVal, df.at[j, strName]) > 90:
            # if similar enough, add index
            val = val + '|' + str(j+1)
     #remove first |
    df.at[i, simRows] = val[1:]
    #remove numeric values, so only strings which refer to more rows than itself will be shown
    if df.at[i, simRows].isnumeric():
        df.at[i, simRows] = ""
    val = ''
df.to_csv(r'C:\Users\me\PycharmProjects\Test_DataResults.csv', index=False)

print('Il progetto è finito.')
then summing on row.
untold belfry
But now I tried to transform it to numpy while using the fuzz.function.
lapis sequoia
we should not loop over df
untold belfry
I know, I know.
I want to transfer it into numpy matrices either way, this is what I got already, even though I think I will only need one of these rows:
v[:, 1] = np.core.char.lstrip(v[:, 1], '|')
v[:, 1] = np.where(np.char.isnumeric(v[:, 1]), '', v[:, 1])
so you're using df, just give an example in terms of data.
you can use .apply(i think thats the name) if needed.
untold belfry
I know, I can make it run also with apply,
but I'd like to learn the numpy logic.
stone marlin
Yeah, I think ultimately this'll be an apply.
untold belfry
Because of the vectorization and the parellelly running "loops".
lapis sequoia
you wanted it vectorized right? well df is good in that. and you're dealing with strings, df has better suport.
stone marlin
Lemme check the code out for a hot second. Yeah, pandas dfs usually have an str accessor with all sorts of cool stuff.
Yeah, you def don't have to initialize simRows, you can construct it with apply, I think.
untold belfry
I do it in numpy strings which were transformed from dfs:
v = df[[strName, simRows]].to_numpy(dtype=str)
v[:, 1] = np.core.char.lstrip(v[:, 1], '|')
v[:, 1] = np.where(np.char.isnumeric(v[:, 1]), '', v[:, 1])
any reason why not using in df and wanting to use numpy?
untold belfry
Ok, then I will try apply as it seems there is no numpy solution for that.
I just saw that numpy is the fastest of the fastest in terms of running time.
That's why I used it as first (after my loop version).
lapis sequoia
untold belfry
I just saw that numpy is the fastest of the fastest in terms of running time.
Th...
numpy is good with numbers. and df is so good too. you can create non loop version there.
stone marlin
Pandas dataframes are "basically" columns of numpy ndarrays with metadata, so they're usually "just as fast".
lapis sequoia
exactly^
stone marlin
Vectorization is extremely important when working with dfs (as with numpy) as this is how we take advantage of their structure, as you def already know (since this is what you're asking about).
untold belfry
But I was not sure how and if it's possible to combine it with the use of a functions.
Ok, then I will turn it into apply functions.
Thanks a lot for your advice.
lapis sequoia
untold belfry
But I was not sure how and if it's possible to combine it with the use of a func...
we can help you with that ofc! just give an example!
stone marlin
But, for you, you've already got a df. You could go back and forth between pure numpy and do a similar thing --- you'd take your function, vectorize it, then apply it to the appropriate ndarray --- but this is essentially what the apply stuff will do.
untold belfry
No, I think i will try it myself for now as I already did one version with apply and halfly finished it,
but then thought I should turn to numpy.
stone marlin
I'd recommend apply because of this. If you're really running into memory issues and the like, dask is fairly similar to Pandas but can do a bit more with medium-sized data.
untold belfry
But seems I was wrong about that.
lapis sequoia
ow i see! well good luck 😄
feel free to ask here if stuck!
stone marlin
You weren't wrong! You can totally do it with numpy. It'll just be a bit easier with pure pandas. :']
stone marlin
I'm looking now to see if we gain anything from using vectorize vs. apply, because I actually don't know this. I'd assume this is what they'd do, but let's check ---
untold belfry
True.
I mean my main intention was, I was new to python, but not new to programming.
So I grasped Python logic quite fast, but also knew from VBA that it can matter a lot whether you write a loop in way a or in way b.
And so I tried to begin already with the fastest way to loop. ^^
lapis sequoia
np.vectorize is just a convenience function. It doesn't actually make code run any faster. If it isn't convenient to use np.vectorize, simply write your own function that works as you wish.

The purpose of np.vectorize is to transform functions which are not numpy-aware (e.g. take floats as input and return floats as output) into functions that can operate on (and return) numpy arrays.

Your function f is already numpy-aware -- it uses a numpy array in its definition and returns a numpy array. So np.vectorize is not a good fit for your use case.

The solution therefore is just to roll your own function f that works the way you desire.
via: https://stackoverflow.com/questions/3379301/using-numpy-vectorize-on-functions-that-return-vectors
Stack Overflow
numpy.vectorize takes a function f:a->b and turns it into g:a[]->b[].
This works fine when a and b are scalars, but I can't think of a reason why it wouldn't work with b as an ndarray or list, i.e...
still i guess implicit looping would make bit may be bit faster.
mint palm
There are various techniques to improve accuracy but the research paper only mentions use of CNN, LSTM, Softmax and no. Of layers....should i assume they already incorporated those small techniques
And they also mentioned the dataset and its distribution
stone marlin
https://stackoverflow.com/questions/52673285/performance-of-pandas-apply-vs-np-vectorize-to-create-new-column-from-existing-c Here also, first answer. Interesting. I did not know about raw=True.
Stack Overflow
I am using Pandas dataframes and want to create a new column as a function of existing columns. I have not seen a good discussion of the speed difference between df.apply() and np.vectorize(), so I
lapis sequoia
stone marlin
https://stackoverflow.com/questions/52673285/performance-of-pandas-apply-vs-np-v...
hehe, row=True is pure heaven.
apply is best for weird transformation depending on alot of cols
stone marlin
This is the first time I've ever seen it. Yeah, I feel like, as this post notes, if you're really, really trying to optimize, maybe numba or jit.
I've never really had a problem with Pandas / Dask being too slow or anything. If it is, I probably ought to be using something a bit more optimized for whatever I'm doing.
Yeah, looks like vectorize doesn't do exactly what I thought it did, though. Though the actual vectorized functions work as expected. Cool.
untold belfry
I guess for now the post helps me a lot.
And on the other side I'm also a bit time constrained between wanting to use python the first time on job level in around four months and optimization,
so I guess using numpy for numbers and pandas for strings seems to be a good middle way.
Next to working fulltime.
stone marlin
It strongly depends on what you're doing and what you're trying to optimize.
untold belfry
Optimizing running time, I mean.
lapis sequoia
untold belfry
I guess for now the post helps me a lot.
And on the other side I'm also a bit ti...
moreover using their vectorized functions to do tasks.
untold belfry
Of course I always need to think about the smartest way to do something and not just python make it do fast, too.
But I'm already doing that as far as my brain is capable, too (and always try to improve from project to project).
stone marlin
What I mean to say is: if you're trying to optimize this down to the ms, then you're prob not gonna want to use Python in the first place.
Otherwise, you're probably going to find equally good solutions in Numpy and Pandas.
 exotic thicket

Hello peeps would u mind solving this problem or could u share an explained video on this problem (1st problem)
untold belfry
I know, I know. But for now I want to learn Python, later I will learn something more difficult as next one.
lapis sequoia
(i heard julia is faster(word of mouth))
exotic thicket
exotic thicket
Hello peeps would u mind solving this problem or could u share an explained vide...
Euclidean, city block and chessboard
untold belfry
Because considering only having four months while working fulltime,
I'm not sure I will have enough time to learn C or similar.
I probably will learn C once I've earned enough to do my master abroad in a year and using the semester breaks for programming.
Anyway, have a nice weekend and thanks a lot again!
Others will need help, too, so I'm gonna continue programming now. ^^
stone marlin
I can barely read the image, Pari, but I think you're looking at different types of distances? We try not to solve homework problems in here.
https://www.analyticsvidhya.com/blog/2020/02/4-types-of-distance-metrics-in-machine-learning/ Here's an article on a few different common distances.

Distance metrics play a huge part in many machine learning algorithms. In this article we cover 4 distance metrics in machine learning and how to code them.
exotic thicket
stone marlin
I can barely read the image, Pari, but I think you're looking at different types...
No it's an image processing and computer vision based problem..
Question: Find the Euclidean, city block and chessboard distances between the two extreme diagonal squares for the given patch?
stone marlin
I'm a bit confused, the text in the picture is giving you both the equations and also seems to be solving the problem for you, though I don't know exactly where the raw values are coming from.
Also, wait, yeah, this is already solved in the bold part below. For Euclidean distance, it's 2sqrt(2), taxicab gives 4 (two down, two right for example), and chessboard is 2 (two diagonal).
 flat sable
hey guys can someone give me roadmap to learn AI that he follow
and is this good https://madewithml.com/
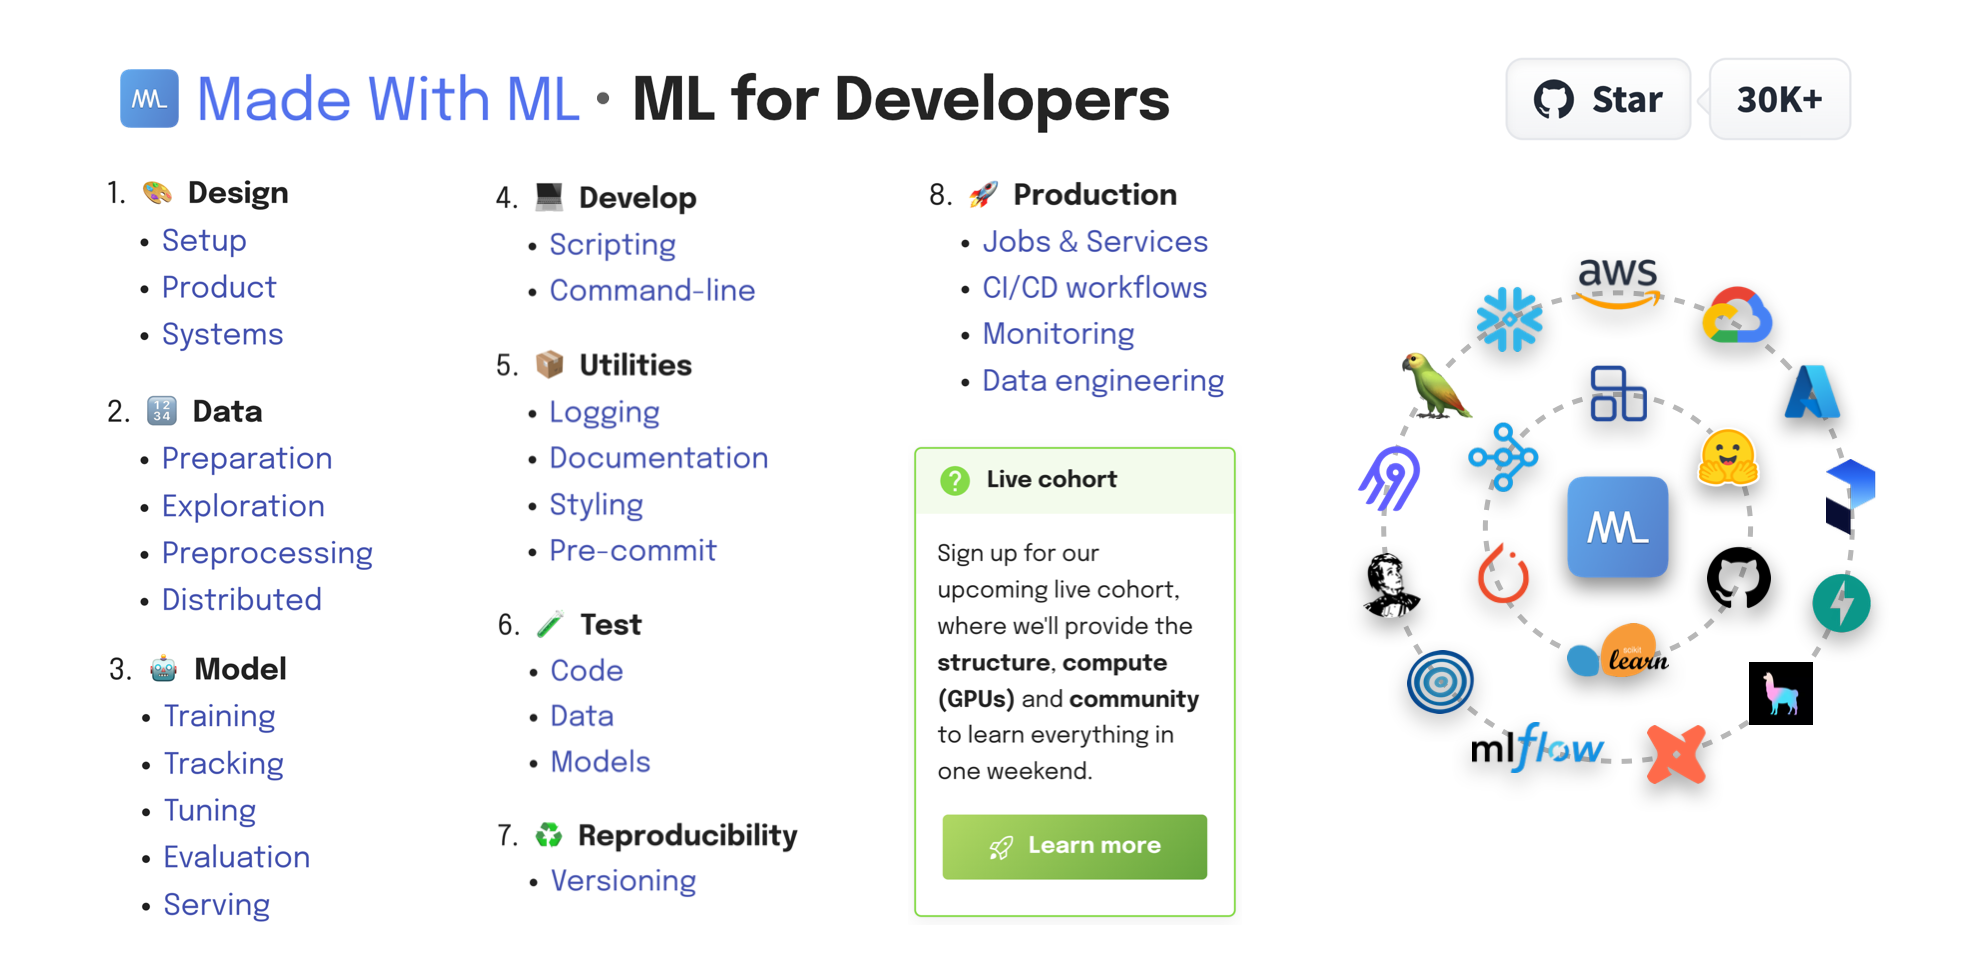
Learn how to responsibly deliver value with ML.
flat sable
 azure geode
Ok
azure geode
Ok
okeyy im gonna follow this road

GitHub
Contribute to srcolinas/roadmap-to-AI development by creating an account on GitHub.
odd meteor
flat sable
hey guys can someone give me roadmap to learn AI that he follow
and is this good...
Try it out first and see for yourself; people's experiences differ. If it doesn't work for you, you can always drop it and get another resources that works for you. There's Coursera, Udemy, DataQuest, etc.
Nonetheless, MWML is a great platform. It was recommended to me mainly for learning MLOPs (I'm not into MLOps yet) but will most likely utilize it when I'm ready.
flat sable
odd meteor
Try it out first and see for yourself; people's experiences differ. If it doesn'...
ah thank you smmmm
 slender birch
what online free resources can i use to learn machine learning?
 lime loom
Does anyone have tips for how to make prettier jupyter html exports? I saw someone's R notebook and I'm a little jealous how nice it looks https://adamoshen.github.io/gsg2022/02-exploratory-numerical.html
 lone drum
    images= cv2.cvtColor(images, cv2.COLOR_BGR2GRAY)
cv2.error: OpenCV(4.5.5) D:\a\opencv-python\opencv-python\opencv\modules\imgproc\src\color.cpp:182: error: (-215:Assertion failed) !_src.empty() in function 'cv::cvtColor'``` how to fix this error ? ping me wehn replying!traceback
arctic wedgeBOT
Please provide the full traceback for your exception in order to help us identify your issue.
While the last line of the error message tells us what kind of error you got,
the full traceback will tell us which line, and other critical information to solve your problem.
Please avoid screenshots so we can copy and paste parts of the message.
A full traceback could look like:
Traceback (most recent call last):
  File "my_file.py", line 5, in <module>
    add_three("6")
  File "my_file.py", line 2, in add_three
    a = num + 3
TypeError: can only concatenate str (not "int") to str
If the traceback is long, use our pastebin.
untold belfry
Somehow I am a bit stuck at this very last point (I want to remove the last loop standing, now I removed nearly all loops out of my processes):
def compare_row(value, index):
    return df[[strName, simRows]].apply(lambda y: y[simRows] + '|' + str(
        index + 1) if fuzz.partial_token_sort_ratio(value, y[strName]) > 90 else y[simRows], axis=1)


for i in range(len(df)):
    df[simRows] = compare_row(df.at[i, strName], i)
How can I remove the last loop standing (let's keep the i outside, as I can use lambda.name for it or add a column just for getting the index)?
serene scaffold
untold belfry
Somehow I am a bit stuck at this very last point (I want to remove the last loop...
this is kind of confusing to look at. can you show the df and explain what the transformation is?
print(df.head(10).to_dict('list'))
untold belfry
serene scaffold
this is kind of confusing to look at. can you show the df and explain what the t...
It's a column of names ([strName,) and a column in which I store the index of similar row (+ the own row) (, simRows]).
The similarity gets defined by the levensthein algorithm (fuzz...) and now I want to get rid of even the last for loop.
serene scaffold
print(df.head(10).to_dict('list')) is the only format I'll accept.
untold belfry
I can also write you the whole code, if it helps.
But it's basically a comparing of each row, with each other row.
serene scaffold
For this moment, I only want to see the result of print(df.head(10).to_dict('list'))
 faint scaffold
Can someone please suggest final year project ideas related to AI?
untold belfry
Ok, one minute. As I'm still using the for loop right now, it might take shortly.
serene scaffold
untold belfry
Ok, one minute. As I'm still using the for loop right now, it might take shortly...
Please ping me when you have shown the dataframe as text in the result I specified. I cannot continue until I have this.
serene scaffold
faint scaffold
Can someone please suggest final year project ideas related to AI?
Have you been to Kaggle? you might look at what datasets are on there and use the k nearest neighbors algorithm
untold belfry
{'ID': [1, 2, 3, 4, 5, 6, 7, 8, 9, 10], 'Job Title': ['Auditor', 'Auditor', 'Staffing Consultant', 'Service Supervisor', 'Executive Director', 'Baker', 'Doctor', 'Project Manager', 'Retail Trainee', 'Service Supervisor'], 'FirstName LastName': ['Bryce Clark', 'Henry Robertson', 'Catherine Sloan', 'Noah Kidd', 'Luna Strong', 'Ruth Gates', 'Chloe Rowan', 'Daniel Allen', 'Julius Atkinson', 'Manuel Kerr'], 'Product': ['Kits', 'Kits', 'Kinder', "Wendy's", 'Doritos', 'Wonder Bread', 'Pizza Hut', 'Tic Tac', 'Cheetos', 'Wonder Bread'], 'Job Title Product': ['Auditor Kits', 'Auditor Kits', 'Staffing Consultant Kinder', "Service Supervisor Wendy's", 'Executive Director Doritos', 'Baker Wonder Bread', 'Doctor Pizza Hut', 'Project Manager Tic Tac', 'Retail Trainee Cheetos', 'Service Supervisor Wonder Bread'], 'Similar Rows': ['1|2', '1|2', '3|475', '', '', '6|613|689', '', '', '', '']}
As you can see, it lists the pair 1|2 as it's a similar pair (or after the code I posted it would list |1|2), but there are two functions afterwards which removes the first | and all numbers (only self referencing)).
untold belfry
untold belfry
Somehow I am a bit stuck at this very last point (I want to remove the last loop...
df[simRows] = df[simRows].apply(lambda x: x[1:])
df[simRows] = df[simRows].apply(lambda x: '' if x.isnumeric() else x)
They come afterwards, also. But they aren't my problem. Just the one lasting for loop I want to remove. ^^
serene scaffold
why do some rows have themselves as a similar row?
do you want to ignore it when that happens?
untold belfry
serene scaffold
why do some rows have themselves as a similar row?
Because I'm interested in all rows which are similar + itself.
serene scaffold
alright. let me see.
faint scaffold
serene scaffold
Have you been to Kaggle? you might look at what datasets are on there and use th...
I've heard of it but don't know what you're telling me look for exactly...
serene scaffold
but basically, for any two rows that are given as similar, you want to apply fuzz.partial_token_sort_ratio to each pair of elements?
untold belfry
serene scaffold
but basically, for any two rows that are given as similar, you want to apply `fu...
No, with that one I find out whether they are similar.
Only this one loop is a bit annoying as it increases running time by a lot.
serene scaffold
You can do this to get a mapping of which rows you want to compare
In [21]: df['Similar Rows'].replace('', np.NaN).dropna().str.split('|').explode().astype(int)
Out[21]:
0      1
0      2
1      1
1      2
2      3
2    475
5      6
5    613
5    689
Name: Similar Rows, dtype: int32
Ok, thanks a lot. That will help a lot for the next step. Another problem solved, I guess. ^^
But any idea, how I can remove the last for loop?
I guess it's probably like a small stupid mistake I'm doing right now.
 last salmon
how to make machine learning ai?
serene scaffold
@untold belfry the point of the last loop is to compare each pair of rows of interest, right?
untold belfry
Yes, to compare each row with each other row.
When I try to turn it into another apply lambda function, I seem to do something wrong, like:
df[simRows] = df[[simRows, strName]].apply(lambda x: compare_row(x[strName], 1), axis=1)
(I know I have to replace the 1 with an index, later.)
serene scaffold
serene scaffold
You can do this to get a mapping of which rows you want to compare
```py
In [21]...
but you only want to compare pairs of rows given here, right?
not every single possible pair of rows (the cartesian product)?
untold belfry
serene scaffold
but you only want to compare pairs of rows given here, right?
No, actually I want the cartesian product, based on similarity after the leventhstein algorithm.
I will later be able to split it in smaller blocks to reduce running time even further,
but this main part will be the basis of all (and be turned into a function then for any block of data I will enter, right now I just take all data).
As 100x100x10 is faster than 1000x1000 by 10. For 10x10x100 it's even 100 times faster (at least in turns of mathematical operations needed).
pastel valley
yo i use tf sequential.fit() what this mean?
 lapis sequoia
Hello guys,
need some help with how i can organise the this text file in such a way that i have 1989_0: its words, 1990_0: with its words..... 2004_0: its words one after the other.

something that looks like this:

someone please help!!!!
iron basalt
lapis sequoia
You only want all of the lines with "_0"?
lapis sequoia
first all the ones with _0 and later _1 ...._10
iron basalt
You can use a regex or other method, just get all _0, then all _1, etc, then append all those lists together into one big list.
Or you can loop over each line and add it to the _0..._10 lists depending which type it is (and combine them into one final list).
lapis sequoia
iron basalt
You can use a regex or other method, just get all _0, then all _1, etc, then app...
ok, i will give this a try!!
for this i will need to create 10 lists....
Thank you so much for the ideas!! 🙂
iron basalt
Also if you are on Linux, etc just use grep.
lapis sequoia
I am on windows... and my data to be organised is in .txt file
iron basalt
lapis sequoia
I am on windows... and my data to be organised is in .txt file
Yeah, grep is like the regex solution, just without having to even make a Python script. On Windows you don't have that (unless you install it).
lapis sequoia
nope, not possible to install at the moment. in the middle of analysing and documenting something
since i didnt wanted to do the manual work, i thought i will write some code to do that
lets see how successful i will be in doing this
iron basalt
Python is fine for this.
lapis sequoia
after organising this fine into _0, _1's..._10. I will need to compare each 0's lines to each other to find how many new words appear in each corresponding lines--
-_-
any idea, what regular exp can i use here?
iron basalt
When you have the lines it's easy because they are structured.
number::word,word,...
Python's string split method is sufficient.
lapis sequoia
after splitting and i read line by line, one line has this data : 1987_1988_0::analog,ieee,technology,resistive,designed,message,line,hardware,include,provided,resistance,matching
can you give me the regex to find all the lines with _0
iron basalt
lapis sequoia
ok, thanks, i will go through this document.
lapis sequoia
ah... I am trying what you wrote here..
i am getting all blank lists. But i will modify this and check it out.. Thank you so much for your time
minor elbow
yeah maybe start with one line before throwing it into the list comprehension
it splits on :: to get the foo_bar_xx part
iron basalt
If you want to use regex as a solution: https://regex101.com/

regex101
Regular expression tester with syntax highlighting, explanation, cheat sheet for PHP/PCRE, Python, GO, JavaScript, Java. Features a regex quiz & library.
For testing.
minor elbow
then takes the first element from the split (the [0] part) and then looks at the last 2 characters of that (the [-2:] part)
lapis sequoia
yes, your regEx worked!!
thank you so much @minor elbow
@iron basalt thank you so much for your amazing resources. i am going to refer and learn more about it
minor elbow
👍🏽
upper spindle
can i use sentiments to predict percentage changes in prices
ive been told that % changes can't be used as outputs
serene scaffold
there's a pretty straightforward pandas question in #help-ramen if anyone has time
 fresh shadow