#data-science-and-ml
1 messages · Page 376 of 1
 safe elk
 sterile talon
I remember giving QGIS a shot as self study summer of 2020 but the tutorial video series I found on YouTube was by this Swedish guy (I'm Swedish myself) and his English was really boring to listen to and had a strong Swedish accent. I fell asleep
😜
safe elk
Map box /web version might be useful if you want something like an online Dashboard ...but it is more work compared to QGIS if you are coming from ArcGIS...depends on what you are using the maps for
 brazen spire
Biais are updated the same way as weights in a neural network?
with the Delta rule?
safe elk
sterile talon
I remember giving QGIS a shot as self study summer of 2020 but the tutorial vide...
Lol I have worked with Danes and Swedes myself and ate Swedish Meatballs...its good
sterile talon
safe elk
Lol I have worked with Danes and Swedes myself and ate Swedish Meatballs...its ...
Surströmming and lutfisk next?
sterile talon
safe elk
Map box /web version might be useful if you want something like an online Dashbo...
Webdev is a hobby of mine so that's why I considered it
Aha ok I see.. Dashboards..
safe elk
sterile talon
Webdev is a hobby of mine so that's why I considered it
Lol I did Web dev as a job but also did desktop software dev, backend, research and scientific computing and some DS stuff
sterile talon
I'm in Earth science 🙂
Hydrology /hydrogeology as a specialty
Have you tried Julia? I started a few weeks ago. I like it a lot!
It has great potential imho
safe elk
sterile talon
Surströmming and lutfisk next?
I have moved on and no longer work in the Danish owned firm we are in asia and the smelly fish might not transfer well so they served only meatballs to be safe lol.
sterile talon
Makes sense
I'd like to travel around Asia at some point
Just need to finish my degrees and get a job!
safe elk
sterile talon
Have you tried Julia? I started a few weeks ago. I like it a lot!
I have considered playing with julia ...one of these days lol
safe elk
sterile talon
Hydrology /hydrogeology as a specialty
There is this package called Delft 3D i have used it and you may have too lol
sterile talon
safe elk
I have considered playing with julia ...one of these days lol
You can do \sqrt and get root
Julia has UTF-8 support
sterile talon
safe elk
There is this package called Delft 3D i have used it and you may have too lol
Sounds interesting! Delfts University is IIRC strong in hydro
If its related to the uni that is..
safe elk
They need to... and yes it is related
sterile talon
^^
safe elk
safe elk
Used Matlab too lol
sterile talon
Geochemical simulations, fluid simulations
Phreeqc, GMS (gui to mod flow)
And others
safe elk
Navier Stokes and like
sterile talon
Ye they are in there somewhere. I'm glad I didn't have to look for em
safe elk
Yep having them there is nice
sterile talon
I've been thinking about doing something crazy on my spare time and write something in perhaps Julia to simply working with phreeqc.
Started on a webdev project for a hydrochemistry course. Haven't had time to finish
Sorry if I'm way off topic.
sterile talon
I was at the gym today earlier 😉
Yes I'm quite geeky.. Even my GF with a PhD in organic chemistry says so.
safe elk
Lol I majored in Chem
 hexed schooner
GitHub
An AI agent that use Double Deep Q-learning to teach itself to land a Lunar Lander on OpenAI universe - Lunar-Lander-Double-Deep-Q-Networks/Lunar_Lander_v2.py at master · anh-nn01/Lunar-Lander-Doub...
can anyone tells me why this code uses tensorflow v1 but not v2, and why it runs very slow if i use tensorflow v2?
sterile talon
Wow that's cool!
hexed schooner
tensorflow 2 is worser than v1?
hmm... I dont know pytorch, I am more familiar with tensorflow v2
hexed schooner
hexed schooner
https://github.com/anh-nn01/Lunar-Lander-Double-Deep-Q-Networks/blob/master/Code...
for this code, what is it using huh
yea I'll learn Pytorch but not now 😢 because I need to submit the work by 14 feb and I only know tensorflow now
at first I thought that it is because tensorflow v2 is using GPU but even if i switch to Google Colab and use GPU it runs slow too
but when I include
import tensorflow.compat.v1 as tf
tf.disable_v2_behavior()
it runs very fast
 karmic moth
oh nw
no im a student as well
am in my final year..i'm trying to find some experts to interview for my final year thesis, cuz im implementing a deep learning model for detecting inconsistent reviews on Amazon, and i need to interview some experts to gain their opinions on my approaches and techniques
and i have been struggling and couldnt find anyone..
karmic moth
karmic moth
am in my final year..i'm trying to find some experts to interview for my final y...
if anyone of u guys know any experts, pls let me know, it would be really helpful
u want me to run the code?
uhm k...is this to check if im a bot or not?
then..
wait
il run

i dont have the packages
hexed schooner
wait so what do u meant by narrow it down
ohhh i see
i tried to do that too
but it seems like normal to me...
because it is just normal Sequential model fit and predict
its jupyter notebook
 restive rock
hi a friend of mine needs help making reports with python....some data science stuff...would anyone be willing to assist....
I've hardly used python..
 serene scaffold
restive rock
hi a friend of mine needs help making reports with python....some data science s...
serene scaffold
restive rock
hi a friend of mine needs help making reports with python....some data science s...
Someone might be willing to assist, but you haven't explained what you need in enough detail for anyone to know what to say.
you're making reports. what reports?
restive rock
he doesn't need rn....
he'll do it tomorrow, i just saw his text and since i don't have experience with python i hopped here
serene scaffold
restive rock
he doesn't need rn....
he'll do it tomorrow, i just saw his text and since i don...
if you or he has a specific question, feel free to ask it here whenever you're ready
restive rock
cool
 grave frost
its a long fixed issue 🤷♂️ please don't give wrong advice to others without reading your own link first....
grave frost
hexed schooner
can anyone tells me why this code uses tensorflow v1 but not v2, and why it runs...
because Gym wasn't maintained for a long time. It was just left to collect dust. fortunately, there are now different forks and RL envs now
 strong tapir
Thanks now im getting non-zero outputs but just like you said its gonna require some further tuning for desired behavior
i think this is mainly just because i need better input data but i think i can do it from here, I appreciate the help
 late ruin
Hi guys, maybe someone could help me, I have this function, that im using at the start of my machine learning script, and I'm stuck understanding how I could predict the winner when the winners in my column are the name of the team, thanks in advance

 chrome marten
how do i pass an actual image in this model to get 128 dimensional vectors?
inputs = tf.keras.Input(shape=(32, 32, 3))
x = tf.keras.layers.Conv2D(filters=32, kernel_size=(1, 1), activation='relu')(inputs)
x = tf.keras.layers.MaxPool2D()(x)
x = tf.keras.layers.Conv2D(filters=64, kernel_size=(3, 3), activation='relu')(x)
x = tf.keras.layers.MaxPool2D()(x)
x = tf.keras.layers.Conv2D(filters=128, kernel_size=(3, 3), activation='relu')(x)
x = tf.keras.layers.MaxPool2D()(x)
x = tf.keras.layers.GlobalAveragePooling2D()(x)
 prime hearth
hello im doing a linear regression model however my cost function is fluctuating
is this normal
?

my lowest cost is 1
 dusk tide
late ruin
Hi guys, maybe someone could help me, I have this function, that im using at the...
dusk tide
late ruin
Hi guys, maybe someone could help me, I have this function, that im using at the...
What name you gave to your model??
(Model name ). predict (dfy_train)
prime hearth
im trying to predict anual salary based on 3 features
dusk tide
prime hearth
my lowest cost is 1
Have you tried any evaluation metric??
What's the total cost coming after training??
prime hearth
oh no not yet, also this was implemented from scratch without any libraries
so i dont think i have access to these metrics
lemme check total cost
total cost is 320
not sure what this mean
i can try using libraries i just practicing with implementing from scratch
dusk tide
prime hearth
total cost is 320
Total cost is too much
Is this cost after testing or training??
dusk tide
prime hearth
which is worse im guessing
High bias I guess
prime hearth
lemme try visualziing the current weights and the testing data and il get back here
its because the data is not quite linear in every feature
its from kaggle dataset insurance
so i picked the top 3 features with high corelation to the target
and removed ones with very low corelation
dusk tide
prime hearth
its from kaggle dataset insurance
I assume that you know the assumptions for doing linear regression??
prime hearth
gaussian distribution and linear decision boundaary?
i know these are two
not sure for other assumptions
and relationship- some type of corelation
dusk tide
prime hearth
gaussian distribution and linear decision boundaary?
There are more
Data should be linear
Multicollinearity should not be present
Normal distribution of error terms
dusk tide
And also features preprocessing and other things is required before modelling and
prime hearth
yes i did do that
i scaled data and also applied catergorical transformation
and removed outliers with IQR
dusk tide
You can try polynomial regression
prime hearth
oh moving it up a dimension
i guess i will need to learn how to do that from scratch
only know how to do that with libraries
dusk tide
prime hearth
i guess i will need to learn how to do that from scratch
I think this might get help
prime hearth
okay thanks
it cause i saw someone else in kaggle
do linear regressoin
and got 70% accurary
with sklearn
i though i could get same without sklearn
hexed schooner
is deep q network same as double q learning?
https://wingedsheep.com/lunar-lander-dqn/ can anyone see what algorithm is he using? is it deep q network or double q learning

Wingedsheep: Artificial Intelligence Blog
Solving the OpenAI gym LunarLander environment using double Q-learning.
 gilded bobcat
Hi all quick question
is it normal or atypical to see a simple train test split beat out k-fold cross validation in out of sample prediction?
2 models, 2 methods of sample splitting.


 uneven cargo
👋 Hey all, I've put together a Jupyter notebook that I'm trying to make sure has a really good developer experience when sharing as I want to use it as a tutorial for how to encode data as vectors, cluster it using KMeans, dimensionality reduce it with PCA and then visualise in a projector and dashboard. I'd be super keen on getting your thoughts and feedback on how to make it as usable as possible: https://colab.research.google.com/drive/1C6waQQCXKqXyG2ZRmrJohZn9UEe-8iI3?usp=sharing

 kind rock
I'm trying to build a machine that plays rock papers and scissors against a user and then learns along the way. Does this come under supervised or unsupervised?
 dim heart
hi
any one here know about tensorflow
i have some problem with it
can someone help me ?
 pastel valley
is it ok to use this kind of images on training a model lets say to classify a cat or not?

or its better to just use single cat on images for the dataset?
im talking about in training convolutional neural network models
so its better to use just like these kind of images?

the model will learn better with that? but if i try to input an image with multiple cat will it still recognize it as cat?
even i only trained it with images of single cat?
 pastel valley
yo any tips on resizing an image to be a NxN without making it like fat?
 cunning parrot
brazen spire
cunning parrot
brazen spire

in this case
are they multiple way to update b2?
If L = 0.5*( (u_target1 - n_3out)**2 + (u_target2 - n_4out)**2 )
is it ∂L/∂b2 = ∂L/∂n_3out * ∂n_3out/∂n_3in * ∂n_3in/∂b2 ?
or ∂L/∂b2 = ∂L/∂n_4out * ∂n_4out/∂n_4in * ∂n_4in/∂b2?
 charred wedge
What would you use to capture data from a json streaming api?
I mean you don't really ask the api for anything, you just.. listen to a stream.
 ionic palm
inputs=tf.ragged.constant([[[0,0],[3,0],[0,4]],[[0,0],[1,0]]])
print(inputs.shape)```
```(2, None, None)```
It does not recognize it is `(2,None,2)` , what should I do? shut raven
Hey.
I wanna do a survey (this system is finished) but I need a good library to display the results.
That library should be able to display the results as rendered images (but with a good vision on each input, since there will be mostly 30-50 answers/per user/per survey) & with percentage/custom text.
Does anyone here know a good one for my project?
dim heart
anyone here using tensorflow
 nova tapir

-
is f(i) the same as "x(i)" features. i mean, it is just a different symbol, right?
-
if i'm not mistaken, l(i) is placed at the point where x(i) is, but the sim(similarity) between them is always 0? because l(i) is on x(i)
prime hearth
i would like some way to know how the differen values of regulariation is affecting the performance of my model
all i see right now is the cost is going down but thats it and plotting it on graph doesnt help since it looks all same
for linear regression model implemented from scratch ^
@nova tapir is this from school or website? Might need to know how the writer is intepreting "l"
oh waut
l is actually data point
X is the full data
so it comparing one sample of observation with the full dataset
 gilded kestrel
how can this be explained: high test accuracy but moderate accuracy in practice?
late ruin
hi quick question, if i want to give int values to a column of strings, is there a way to do it? i have a column of team names, and i want to give each team a unique value of an int, is there a way to do it?
 junior wharf
Hey everyone. So, I was trying to find a fast, stable way to solve a system of equations Ax = b for constant A and many vectors, one at a time (so vectorization doesn't help me). I could calculate numpy.linalg.inv(A) and then multiply the vector b and that is very fast, but I believe it is unstable for the matrix and vectors I have to go through. I could also use np.linalg.solve(A, b) on every iteration, and that looks like it can be more stable, but is much slower. I thought if I factored my matrix beforehand and then used scipy.linalg.cho_solve() I could have a faster solution, but even though the factorization is done beforehand, solving the system is slower than the solve option. Is there a way to get better performance in this case?
serene scaffold
late ruin
hi quick question, if i want to give int values to a column of strings, is there...
Be careful assigning arbitrary numbers to non-quantity data. You're basically telling the computer that one team is "twice as much" as another
late ruin
serene scaffold
Be careful assigning arbitrary numbers to non-quantity data. You're basically te...
so is there a way to uniquely index them?
serene scaffold
late ruin
so is there a way to uniquely index them?
Are you trying to create inputs for a model ?
late ruin
serene scaffold
Are you trying to create inputs for a model ?
yea im trying to use a svm model to predict match result between two teams, but it has problem with identifying a column of dates, and im sure later on it will have a problem identifying the string columns as well
serene scaffold
late ruin
yea im trying to use a svm model to predict match result between two teams, but ...
so, that's actually a great example of how assigning arbitrary numbers to each value wouldn't work. each input for a SVM is a point in space, and the SVM finds the boundaries between types of points. It doesn't make any sense to say that one team is "more in one direction" than another.
question is, is the team name a feature (information about a data point), or the target (the label for the data point)?
late ruin
feature
serene scaffold
late ruin
feature
what is the model trying to predict?
late ruin
given a history of results in a match between two teams, predict a result of a match between them, or between any given two teams
serene scaffold
late ruin
given a history of results in a match between two teams, predict a result of a m...
interesting. did you decide to use SVM for this, or are you supposed to use SVM to fulfil some requirement?
late ruin
umm i decided because i found couple of projects that used it, but im ok to use anything
serene scaffold
if you're going to use SVM, it sounds like you'd need to have a different SVM for each combination of teams.
 tight dove
Hello all
I am trying to get a count of the nnumber of customers by country, so I did this -
df = df.groupby(by=['country'])['name'].count()
you're writing over the df variable, which I would avoid
if you're using a jupyter notebook, that's probably why you're having an issue.
tight dove
What is the best approach?
serene scaffold
tight dove
What is the best approach?
it's impossible to know without knowing the schema of the dataframe. can you do print(df.head().to_dict('list')) and show the text/not a screenshot?
tight dove
Asides that, I was trying to express the output or the dataframe as -
<COUNTRY>: <number>
<COUNTRY>: <number>
I have no further comments until seeing the raw text printed by print(df.head().to_dict('list')).
tight dove
Oh okay
serene scaffold
Ping me if you decide to show that. I'm happy to help you solve this, but I'm particular about what information askers make available.
 upper spindle
gives me this

nvm,
i think i know where i went wrong
still comes up with this AttributeError Can only use .dt accessor with datetimelike values
does anyone know how to convert the dates to just the day e.g. from 2021-12-31 23:48:38 to 2021-12-31
 umbral anvil
Good morning, I have a question, so I leave a message here.
It constitutes an airport user prediction model.
We're going to predict the number of users every month.
I'm not sure which model to build.
scikit-learn? k-means?
I'd like to get technical advice.
 lapis sequoia
hey they added support to py3.10 on a new tf?
lapis sequoia
upper spindle
gives me this
your column isn't in dt format
check out pd.to_datetime function
serene scaffold
upper spindle
gives me this
is that column secretly a string column? you have to use pd.to_datetime (credit to RA), but you also have to write over the existing column.
serene scaffold
umbral anvil
Good morning, I have a question, so I leave a message here.
It constitutes an ai...
kmeans clustering is an algorithm that makes a classifier. a classifier is a type of model. scikit-learn (also called sklearn) is a python library that has ready-to-use implementations of a lot of algorithms, kmeans included.
We're going to predict the number of users every month.
be really specific about what data you have that you can use to "predict the number of users".
umbral anvil
..um...
serene scaffold
let's forget that kmeans, classifiers, or sklearn exist for a moment. what data are you working with?
upper spindle
lapis sequoia
check out `pd.to_datetime` function
thanks for your reply, and ye, youre right
 serene scaffold
upper spindle
thanks for your reply, and ye, youre right
serene scaffold
upper spindle
thanks for your reply, and ye, youre right
you're welcome! going forward, please copy and paste text as text.
upper spindle
i tried converting to datetime but it still doesnt work
serene scaffold
upper spindle
i tried converting to datetime but it still doesnt work
do you remember how to use pd.to_datetime?
upper spindle
serene scaffold
you're welcome! going forward, please copy and paste text as text.
i will do next time
upper spindle
serene scaffold
do you remember how to use `pd.to_datetime`?
cant remember, been a few months since i went over it
umbral anvil
serene scaffold
> We're going to predict the number of users every month.
be really specific abo...
The data to be used here will be used by Korean Airports Corporation.
Based on this, I'm going to make a prediction.
lapis sequoia
upper spindle
thanks for your reply, and ye, youre right
upper spindle
thanks
serene scaffold
if you're lucky, it doesn't really require any work. see if pd.to_datetime(df['Date']) works. but remember, this won't change df or any of its columns in any way. it returns an entirely new Series.
serene scaffold
umbral anvil
The data to be used here will be used by Korean Airports Corporation.
Based on t...
Korean Airports Corporation. That's a company, I guess; it's not data. do you have a CSV file?
Those who I'm helping/attempting to help, please ping me if you respond.
umbral anvil
serene scaffold
Korean Airports Corporation. That's a company, I guess; it's not data. do you ha...
I'm writing the data officially released by this side by side.I have the data now, but it's Korean. Can I summarize the metadata information?
serene scaffold
umbral anvil
I'm writing the data officially released by this side by side.I have the data no...
if the data is in a table, I need to know what the columns are and what they represent.
@upper spindle did it work?
umbral anvil
serene scaffold
Those who I'm helping/attempting to help, please ping me if you respond.
How can I send you a ping?
Are you talking about dm?
upper spindle
serene scaffold
<@!722177620019511380> did it work?
doesnt work
serene scaffold
umbral anvil
How can I send you a ping?
Are you talking about dm?
by writing @serene scaffold in the chat, along with an informative message
upper spindle
just checking on stackoverflow
serene scaffold
upper spindle
doesnt work
what code did you write, exactly, and what happened that was different from what you expected?
upper spindle
I typed this code pd.to_datetime(df['Date']) , the dtype was datetime64[ns]
serene scaffold
upper spindle
I typed this code `pd.to_datetime(df['Date']) `, the dtype was `datetime64[ns]`
that's what you wanted.
upper spindle
then I tried this df['Time'] = pd.to_datetime(df['Time'], unit='d')
serene scaffold
datetime64[ns] is an unambiguous way of storing a time.
upper spindle
upper spindle
then I tried this `df['Time'] = pd.to_datetime(df['Time'], unit='d')`
to convert to a day
serene scaffold
why didn't you try using pd.to_datetime(df['Time']) in conjunction with the .dt. thing we talked about earlier?
umbral anvil
serene scaffold
by writing <@!253696366952316929> in the chat, along with an informative message
Thank you so much. This is one of the Toy projects I planned, and I was thinking about it because I wanted to make it a little big.
I wanted to do something else based on this, so I wanted to get help this time.
upper spindle
serene scaffold
why didn't you try using `pd.to_datetime(df['Time'])` in conjunction with the `....
let me give it a try,
serene scaffold
umbral anvil
Thank you so much. This is one of the Toy projects I planned, and I was thinking...
no problem! let me know when you've written down what columns of data you have, and what they represent.
upper spindle
Im not sure how to use pd.to_datetime(df['Time']) in conjunction with .dt.
umbral anvil
prime hearth
for linear regression model implemented from scratch ^
I'm sorry, but I'll leave an answer in Japanese only for this person.
泣いオオカミー さん、質問が難解です。 要約をしてください。
あなたこそ質問が難解なようです。
If you leave a message like this, no one can help you. I'm sorry.
serene scaffold
upper spindle
Im not sure how to use `pd.to_datetime(df['Time'])` in conjunction with `.dt.`
do you know what type of pandas object you can use .dt. on?
 green niche
should you learn AI before going into the math or should you learn the math before going into AI.
serene scaffold
green niche
should you learn AI before going into the math or should you learn the math befo...
they are inseparable, though since just learning lots of theoretical math is unsatisfying if your real goal is to learn about AI, you can approach it as one monolithic thing
(well, you can separate the theoretical math from the AI, but not vice versa.)
green niche
I heard you can do a lot with AI without the math, but to be proficient, you need a lot of math
upper spindle
serene scaffold
do you know what type of pandas object you can use `.dt.` on?
only datetime types i think
serene scaffold
green niche
I heard you can do a lot with AI without the math, but to be proficient, you nee...
you can apply existing AI techniques without understanding all the math. the more you understand, the better you'll be at making design choices. and then you can't really make novel contributions to AI without understanding the math.
green niche
ah ok
serene scaffold
upper spindle
only datetime types i think
.dt is an accessor for Series of datetimes, yes.
and what is pd.to_datetime(df['Date'])?
green niche
so overall, the math is crucial to learn first before the AI
serene scaffold
green niche
so overall, the math is crucial to learn first before the AI
I'm not suggesting you spend lots of time just reading about math before doing any amount of AI. I think you'd just lose interest if you did it that way.
though I don't know how much you like pure math.
upper spindle
serene scaffold
and what is `pd.to_datetime(df['Date'])`?
changes column Date to a datetime dtype, right?
serene scaffold
upper spindle
changes column Date to a datetime dtype, right?
it takes a Series of strings and returns a Series of datetimes.
upper spindle
before, i had converted my unix time using df['Time'] = pd.to_datetime(df['Time'], unit='s'), which converted to a normal datetime like 2021-12-31 23:58:50 , but when i try df['Time'] = pd.to_datetime(df['Time'], unit='s') on the same data column it comes out as ValueError: non convertible value 2021-12-31 23:48:38 with the unit 'd'
serene scaffold
any time you say something "doesn't work", please be specific about what happens instead.
I can't help you debug if I don't know what's actually happening. Did you try pd.to_datetime(df['Date']).dt.floor('D')?
this is assuming that df['Date'] is still a Series of strings that are timestamps.
upper spindle
serene scaffold
any time you say something "doesn't work", please be specific about what happens...
sorry, lesson learnt, i adjusted my original message
upper spindle
serene scaffold
I can't help you debug if I don't know what's actually happening. Did you try `p...
i executed that code and obvs as you said before it doesnt change any of my columns
serene scaffold
upper spindle
i executed that code and obvs as you said before it doesnt change any of my colu...
that is expected behavior. pandas functions/methods usually return new objects, without modifying the ones that you pass.
upper spindle
and btw, thanks for your responses, theyve helped a lot
serene scaffold
it's a difficult thing to wrap your head around: methods that change the object "in-place", vs functions/methods that return entirely new objects.
upper spindle
serene scaffold
that is expected behavior. pandas functions/methods usually return new objects, ...
is there a way that i could modify the values in my df and replace the original column of interest?
serene scaffold
upper spindle
is there a way that i could modify the values in my df and replace the original ...
yes, you can write over the original data with df['column_to_overwrite'] = ...
upper spindle
serene scaffold
it's a difficult thing to wrap your head around: methods that change the object ...
yeh, all of this, im learning as im doing it after going through tutorials, which didnt help as i was just not memorising/understanding it as i wasnt applying it to any projects
upper spindle
serene scaffold
yes, you can write over the original data with `df['column_to_overwrite'] = ...`
thanks
serene scaffold
in "normal python", it's mostly methods changing things in-place (like list.append), whereas the python data science world is mostly returning new objects.
 lime ocean
Is there any way to separate two IPython displays being run in the same notebook cell? Some sort of vertical spacer I can insert or something?

right now they are really squished together and they use the same horizontal scrollbar which is annoying
serene scaffold
@lime ocean does this help https://blog.softhints.com/display-two-pandas-dataframes-side-by-side-jupyter-notebook/amp/
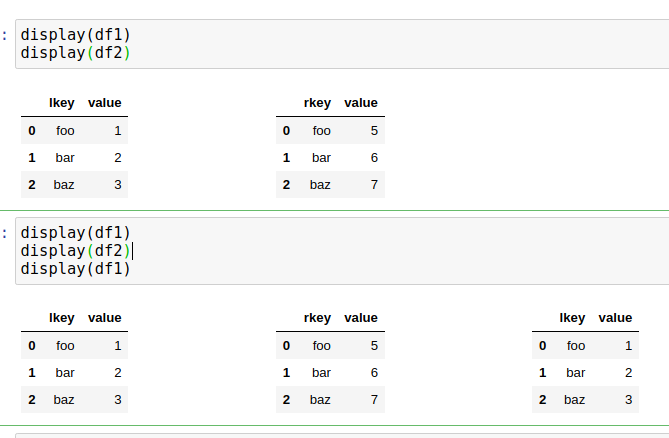
SoftHints - Python, Data Science and Linux Tutorials
In this brief tutorial, we'll see how to display two and more DataFrames side by side in Jupyter Notebook. To start let's create two example DataFrames: import pandas as pd df1 = pd.DataFrame({'lkey': ['foo', 'bar', 'baz'], 'value': [1, 2, 3]}) df2 = pd.DataFrame({'rkey': ['foo', 'bar', 'baz'], 'value': [5,
lime ocean
yeah, that helps :)
thanks
dusk tide
Pic is the ques. Of svm
We need to find | | theta | |
So pic 2 has the p(i) for example x which has projection on theta
So acc. To me p(i) | | theta | | >= 1 to classify example 'x'
So putting the value of p(i)= 2 we get | | theta | | = 1/2
So option 2 is correct ??


 fallow rune
Hi guys, just asking. Does anyone here has an experience in doing NLP?
lapis sequoia
Hi, I'm having trouble understanding what the parameters a, b, c and d correspond to and why they are passed as the second argument to plt.plot: ```py
x = np.linspace(0, 2, 100)
y = 1/3*x3 - 3/5 * x2 + np.random.randn(x.shape[0])/20
def f(w, a, b, c, d):
return a * x3 + b * x2 + c * x + d
params, param_covarience = optimize.curve_fit(f, x, y)
plt.figure(figsize=(8, 8))
plt.scatter(x, y)
plt.plot(x, f(x, params[0], params[1], params[2], params[3]), c='g', lw=3)
 wary breach
 lapis sequoia
Hi, I'm having trouble understanding what the parameters a, b, c and d correspon...
lapis sequoia
lapis sequoia
Hi, I'm having trouble understanding what the parameters a, b, c and d correspon...
hm so i assume you have a graph of x and some f(x) where f(x) is ax^3 + bx^2 + cx + d
I think they want to show you a line(which f(x) makes) (not straight ofcourse).
 tidal bough
lapis sequoia
Hi, I'm having trouble understanding what the parameters a, b, c and d correspon...
tidal bough
lapis sequoia
Hi, I'm having trouble understanding what the parameters a, b, c and d correspon...
They are the coefficients of the polynomial. curve_fit is used here to find the coefficients that make the curve fit the data best.
basically, it's nonlinear regression - you're finding the third-degree polynomial that fits the data best.
lapis sequoia
these parameters are coming from optimize.curve_fit. so basically optimzer is giving you this nice parameters, by which you can create a nice function which will give you a curve which will have all points on it. (it is more of a they will probably very closer to curve if not on curve.)
hm i am choosing worst words, follow what reptile says.
tidal bough
Here's the result, with the params estimated shown

note that the original params were 1/3, -3/5, 0, 0, so it's pretty close but not perfect (obviously)
in fact, here's it with the original polynomial shown too:

 cinder schooner
Hello, i have a question about the log loss metric. So what i understood is that logloss= -1*Log(Likelihood).
I have a model that i'm using for multi class classification, i'm showing for every epoch the accuracy, the precision, the recall, the logloss and the vallogloss. I'm using categorical crossentropy.
What i'm not understanding is why sometimes when the loss function decreases the logloss increases and sometimes when the loss function increases the log loss decreases. Shouldn't they like go together? like increase together or decrease together? What's the relation between them?
karmic moth
Does anyone know how to convert a request_json to a Dataframe
 serene scaffold
fallow rune
Hi guys, just asking. Does anyone here has an experience in doing NLP?
serene scaffold
fallow rune
Hi guys, just asking. Does anyone here has an experience in doing NLP?
Yes, but you have to ask your actual question, or I don't know how to help
serene scaffold
karmic moth
Does anyone know how to convert a request_json to a Dataframe
It depends on the structure of the json. It might be as simple as passing it to the dataframe constructor
karmic moth
serene scaffold
It depends on the structure of the json. It might be as simple as passing it to ...
yeah the json is a list
[{'ReviewId': 'RLP00H7L5ITZL', 'ReviewComment': "some dude yoinked my lil brothers bike, It's my fault for buying this dogsht fkn lock. DO NOT BUY IF YOU VALUE YOUR BIKE", 'StarRating': 1}, {'ReviewId': 'RMYJ0K43DKOLF', 'ReviewComment': "This lock literally fell apart after one use. All of the number rings slid off. It might be fixable, but for me this isn't worth it. Will be going back to a keyed lock", 'StarRating': 1}]
in this format
serene scaffold
Try pd.json_normalize

Stack Overflow
I have very large json data with the following syntax:
[
{
"origin": 101011001,
"destinations": [
{"destination": 101011001, "people": 7378},
{"destination": 101011002, "people": 12...
Tfw I'm answering python questions on my phone right after waking up. With one eye open
serene scaffold
Did it work?
 meager scroll
Hi guyz, do you know how to calculate sth like that on dataset in python?
 serene scaffold
meager scroll
Hi guyz, do you know how to calculate sth like that on dataset in python?
serene scaffold
meager scroll
Hi guyz, do you know how to calculate sth like that on dataset in python?
what is S?
and what is delta t?
meager scroll
I'm working on dataset from stock, it's closure prices
serene scaffold
is t a day?
meager scroll
yes
serene scaffold
so delta t is the difference in closure price from the previous day?
meager scroll
yes
serene scaffold
alright. do you have an array of t values?
meager scroll
yes
serene scaffold
can you show the array?
meager scroll
I just do something like np.arrange(1, len(data) + 1) which is equal to. number of days, and it's like 5k records
serene scaffold
okay, so it's just an arbitrary array of shape (len(data),)?
meager scroll
yeah
serene scaffold
great. though if each element is a t value, I'm still not sure how to get S(t)
alternatively, if each element is actually an S(t) value, then I don't know how to get S(t + Dt)
 serene scaffold
they define s(t) = ln(S(t))
meager scroll
yes, s(t) is ln of closure prices
serene scaffold
can you show figure 1?
meager scroll
 serene scaffold
does this mean that your data has a way to look up t and they're respective s(t) values?
meager scroll
yes
serene scaffold
is it in a csv?
meager scroll
yes
serene scaffold
please drag/drop the CSV into this chat.
meager scroll
serene scaffold
alright, one moment
serene scaffold
meager scroll
Hi guyz, do you know how to calculate sth like that on dataset in python?
I'm still confused by S(t + Dt). is it basically (Close) + (Close of previous day)?
meager scroll
Hmmm... they call it log return, I'm also confused about it
 meager scroll
https://www.r-bloggers.com/2019/03/inverse-statistics-and-how-to-create-gain-loss-asymmetry-plots-in-r/ There is R code, when some1 calculate it, but looks like in different way(?)

Asset returns have certain statistical properties, also called stylized facts. Important ones are: Absence of autocorrelation: basically the direction of the return of one day doesn’t tell you anything useful about the direction of the next day. Fat tails: returns are not normal, i.e. there are many more ...
ret <- cumsum(as.numeric(na.omit(ROC(p[d:end]))))
serene scaffold
If you know how the parts of the formula relate to the data in the CSV, I can help you with that
otherwise, I'm just guessing.
meager scroll
Alright. Will try to better understand what's going on in this paper. Thanks for your time!
 wicked grove
After training my model,i tried evaluating it
And i get this
I cant understand why the test loss ,is greater than the test acc
score = model2.evaluate(X_new_img_test,onehot_t,batch_size=128)
print('Test loss:', score[0])
print('Test accuracy:', score[1])``` ```3/3 [==============================] - 14s 2s/step - loss: 0.8399 - accuracy: 0.7333
Test loss: 0.8398879766464233
Test accuracy: 0.7333333492279053```These are my graphs
 upper spindle
is there a way to calculate the average sentiment of each singular day ?
 agile cobalt
how large are the Training and Test sets?
(*replying to urfaa)
lapis sequoia
where do i go to learn numpy, pandas, seabron etc
theres like no good tutorials
im lost
 shut obsidian
lapis sequoia
where do i go to learn numpy, pandas, seabron etc
shut obsidian
lapis sequoia
where do i go to learn numpy, pandas, seabron etc
try w3school it can give you some idea
 calm thicket
lapis sequoia
theres like no good tutorials
calm thicket
lapis sequoia
theres like no good tutorials
have you looked at the tutorial on the numpy docs?
or the pandas docs?
serene scaffold
@lapis sequoia there's this for pandas: https://www.kaggle.com/learn/pandas
Solve short hands-on challenges to perfect your data manipulation skills.
numpy is a subset of pandas, in some ways.
 stone marlin
Oh, this is a cool resource.
serene scaffold
here are all the other data science resources. please let me know if there's something we should be featuring but aren't. https://www.pythondiscord.com/resources/?topics=data-science
We're a large, friendly community focused around the Python programming language. Our community is open to those who wish to learn the language, as well as those looking to help others.
stone marlin
I was making "koans" for Pandas + Numpy for some students I am getting soon, a la https://github.com/gregmalcolm/python_koans, and I love looking at tutorial resources to see what people feel like beginners / intermediates struggle the most on. :''']
 arctic wedgeBOT
:incoming_envelope: :ok_hand: applied mute to @keen cairn until <t:1644769791:f> (9 minutes and 59 seconds) (reason: duplicates rule: sent 4 duplicated messages in 10s).
prime hearth
hello, i would like to please ask, why do we find the min for arg min -log(p(x|theta))
for me it makes more sense to find max so arg max -log(p(x|theta))
because min is infinite
like x^2 for example
why argmax of x^2 and argmin of -x^2
it makes more sense for opposite
 spare briar
p(x|theta) is our likelihood function
loss function is being derived by maximum likelihood
so arg max log(p(x|theta))
log is monotonic so arg max log(p(x|theta)) = arg max p(x|theta)
notice that arg max log(p(x|theta)) = arg min -log(p(x|theta))
prime hearth
yes but why do we take max of logp(x)
because if we graph it derivative
and the function
spare briar
because p(x|theta) is our likelihood function
prime hearth
the max is infinite
spare briar
we want the highest likelihood of the observed data under our model
spare briar
right so when our likelihood is gaussian
prime hearth
this isnt possible rigght
spare briar
then log p(x|theta) \approx -|x - mu|^2
because the gaussian has the form
e^(-|x-mu|^2/2\sigma)
so when we take the log we have exponent of gaussian concave down
but you are right
prime hearth
oh okay thanks i think that made more sense by showing the gaussian formula
spare briar
what if our likelihood function is more complicated
prime hearth
i forgot that p(x) is gaussian formula with - |x-u|
spare briar
this is why with these sorts of models we use likelihoods from exponential family distributions
these are basically the distributions where it is possible to write a closed form likelihood and get a loss
hope that helps a bit
i strongly recommend Bishop's book chapters 3 and 4 on this topic
prime hearth
thanks, i was just confused why we took max of log but i understand now because if we were to graph it it would give max value
i just forgot about the minus sign in the equation for probability density function
thanks!
ionic palm
How to use layers.Discretization() across dimention when a ragged tensor innermost dimension is 1 ? Is there any layers.Reshape() trick?
Like [[[10],[20],[30]],[[10],[20],[30],[40]]] to become [[[1],[2],[3]],[[1],[2],[3],[4]]]
And [] to become []Since it is ragged, reshape() need to flexiable right?
Also Flatten() is not supportive to ragged
 candid flare
Hey I am currently reading "Automate the boring stuff wit python" but I want to at some point learn how to do something with machine learning(Not sure what im a newbie). What do you think a good next book to read would be?
serene scaffold
@candid flare data science from scratch
candid flare
I was thinking of getting that one next! @serene scaffold
 trail ibex
Hi guys, I have a really basic question that I can't seem to find the answer to. It's a pandas dataframe I am working with. Newbie stuff for a college project - is this the right channel to ask about it?
Or should I use the help channels?
agile cobalt
just ask away
trail ibex
It's so simple, but I just can't get my head around it. I am counting the nulls for <column name> in a dataframe to see how many there are - all I want is "<Name of Column>: <number of nulls>"
I cannot seem to figure it out, I might be a bit tired :/
agile cobalt
have you checked the user guide for working with missing data? it should mention the methods you'd need
serene scaffold
You can use the isna and sum methods.
trail ibex
I've been googling to the point where I can't even read anymore tbh, really frustrated now. I know I'm missing something silly as all hell
serene scaffold
Pandas sometimes uses "na" in reference to nan/null
@trail ibex don't worry, we'll fix this. Deep breaths 
Start by calling isna() on your dataframe and print it to see what you get
trail ibex
So I'm working with a data file where there's countries (with names "country") and iso codes for the 3 letter abbrev. I'm trying to get a list of "<Country>: <number of nulls>". I can get a list with no issues, but it's 1002 lines long, I am just missing something silly. I apologise for the silly question again, I am only 2 weeks into my course
Here's my code:
fixing ISO codes first
Let's look at the iso_codes column and see where the nulls are
null_isos = df[df['iso_code'].isna()]
print(null_isos['country'])
df is the dataframe containing all the stuffs
serene scaffold
df[df.isna()] is wrong for this
You'll lose entire rows that have a single nan
Or something like that
Just look at df.isna() by itself first.
trail ibex
Let me try that
serene scaffold
I'm about to drive home. I'll be back in ten minutes or so.
trail ibex
It's giving me a list of bools now, it's the same output basically but instead of country names, I now get row numbers
 minor elbow
u can sum() bools
trail ibex
No worries Stel
minor elbow
so like df.isna().groubpy('country').sum()
trail ibex
groupby.....I didn't know this method. Let me try this
I swear if it works I'm gonna cry
trail ibex
So it did.....something, but not quite what I expected hehe
It's so nice to have help....jesus the relief is real
minor elbow
its not clear to me what counts as being na? you might want to subset the colums to country and whatever u are looking for na in
serene scaffold
whether or not something is na/null is unambiguous. it is or it isn't.
minor elbow
i mean like the structure of the df, is it just country, code or are their other columns
trail ibex
I am not sure that I phrased my question very well now :/ So I have a dataset that has a bunch of country names - it's a little messy cos it's joined from 2 sources. One source has individual countries, with ISO codes (the 3 letter abbreviations for them). The other source has stuff I want to exclude in this sense like "Americas" or "Europe" - those don't have 3 letter iso codes. I want to just look at how many countries have null iso codes, and how many, and make this a displayable list, if you get me (I'm using Jupyter Notebook for my project). So basically it's a preclean step - I know how to drop them, no issue, I just want to display what I am dropping, and it's driving me crazy heh
serene scaffold
I didn't expect .groubpy('country') to be part of the solution. do you mind doing print(df.head().to_dict('list')) and copying the exact string output into the chat as text?
@trail ibex ^
trail ibex
serene scaffold
<@!551072707899424806> ^
Sure, here you go:
{'biofuel_consumption': [nan, nan, nan, nan, nan], 'biofuel_electricity': [nan, nan, nan, nan, nan], 'coal_consumption': [nan, nan, nan, nan, nan], 'coal_electricity': [nan, nan, nan, nan, nan], 'coal_production': [0.691, 0.726, 0.842, 0.842, 0.859], 'country': ['Afghanistan', 'Afghanistan', 'Afghanistan', 'Afghanistan', 'Afghanistan'], 'electricity_generation': [nan, nan, nan, nan, nan], 'fossil_electricity': [nan, nan, nan, nan, nan], 'fossil_fuel_consumption': [nan, nan, nan, nan, nan], 'gas_consumption': [nan, nan, nan, nan, nan], 'gas_electricity': [nan, nan, nan, nan, nan], 'gas_production': [nan, nan, nan, nan, nan], 'gdp': [31712751616.0, 32398444544.0, 33068124160.0, 34692370432.0, 35319054336.0], 'hydro_consumption': [nan, nan, nan, nan, nan], 'hydro_electricity': [nan, nan, nan, nan, nan], 'iso_code': ['AFG', 'AFG', 'AFG', 'AFG', 'AFG'], 'low_carbon_consumption': [nan, nan, nan, nan, nan], 'low_carbon_electricity': [nan, nan, nan, nan, nan], 'nuclear_consumption': [nan, nan, nan, nan, nan], 'nuclear_electricity': [nan, nan, nan, nan, nan], 'oil_consumption': [nan, nan, nan, nan, nan], 'oil_electricity': [nan, nan, nan, nan, nan], 'oil_production': [nan, nan, nan, nan, nan], 'other_renewable_consumption': [nan, nan, nan, nan, nan], 'other_renewable_electricity': [nan, nan, nan, nan, nan], 'population': [13356500.0, 13171679.0, 12882518.0, 12537732.0, 12204306.0], 'renewables_consumption': [nan, nan, nan, nan, nan], 'renewables_electricity': [nan, nan, nan, nan, nan], 'solar_consumption': [nan, nan, nan, nan, nan], 'solar_electricity': [nan, nan, nan, nan, nan], 'wind_consumption': [nan, nan, nan, nan, nan], 'wind_electricity': [nan, nan, nan, nan, nan], 'year': [1980, 1981, 1982, 1983, 1984]}
C:\Users<me>\AppData\Local\Temp/ipykernel_13120/1923355927.py:1: UserWarning: DataFrame columns are not unique, some columns will be omitted.
print(df.head().to_dict('list'))
serene scaffold
alright, let me see
trail ibex
I only have the notebook saved locally at the moment, but if it helps, I could set up a Git and push it, I guess. Might take me a while to figure it out
serene scaffold
so, I would add the country to the index.
trail ibex
So index(['country'])
Let me see if I can get back to where I was
Guys, thank you so much for the help on this
I can do later steps, I just can't demonstrate why I'm doing them, and it's.....argh
serene scaffold
do you mind drag/dropping the CSV into this chat?
trail ibex
Ofc that's no prob, I'm working with a Kaggle file. OK to just link?
serene scaffold
df.isna().sum() "works" but doesn't organize it by country. it sounds like at the end you want a table with rows for each country and columns for each kind of data.
and each cell is the number of nans.
trail ibex

Consumption of energy by different countries
minor elbow
df[['country', 'iso_code']].groupby('country').iso_code.apply(lambda x: x.isnull().sum())
trail ibex
I will google this, thanks for the pointer 🙂
serene scaffold
minor elbow
df[['country', 'iso_code']].groupby('country').iso_code.apply(lambda x: x.isnull...
does that work? I don't really agree with accessing columns like attributes.
trail ibex
Basically what I want to do with this bunny is give a justification for zapping areas like "America", "Europe" and ISO codes with zero data
minor elbow
well it works on the 5 rows with no nulls 😉
trail ibex
So I want to show the number of nulls for the country name, and say "This is why I am dropping these" - is that makes sense
I am thinking I am overthinking it badly hehe
Ah it's a college course, I want to do well. No questions at the end, you get me 🙂
I mean, that is what I will argue, but I want to show that the data wouldn't have helped either, so I zapped it
Pretty sure it was calculated as the sum of the territories anyhow, so I could always reproduce it just by summing if I needed to
I agree 🙂 But I want to show what I am zapping
serene scaffold
this worked for me:
df.drop(['year', 'iso_code'], axis=1).groupby('country').apply(lambda d: d.isna().sum())
I'll explain why this works
trail ibex
year.....hokay. That's interesting, didn't see that one playing in
 slow sable
how can i interpret this graph? is test set overfitting with higher degrees and train set underfitting?
 serene scaffold
.drop(['year', 'iso_code'], axis=1) -- we don't care about these columns (columns are axis 1)
.groupby('country') -- this sort of makes a separate dataframe for each country, where every df is for one country
.apply(lambda d: d.isna().sum()) -- this does isna().sum() for each of those dataframes
trail ibex
serene scaffold
`.drop(['year', 'iso_code'], axis=1)` -- we don't care about these columns (col...
Thanks, I'll need to look up the lambda to see how this works. Let me try it now though
serene scaffold
trail ibex
Thanks, I'll need to look up the lambda to see how this works. Let me try it now...
for the lambda, d is a dataframe with the same columns as df.drop(['year', 'iso_code'], axis=1), except country
trail ibex
I did. I got down from 123 columns to 32 I was interested in. The ISO column is one I kept for 2 reasons - (1) as a cleaner - if it's blank I can dump it (2) I'll use it as the ref to get the flag graphics from somewhere else for the viz 🙂 Again, it's a college project, I have to demonstrate this stuff
trail ibex
serene scaffold
for the lambda, `d` is a dataframe with the same columns as `df.drop(['year', 'i...
Ahhhh.....so it basically generates a "this is the stuff we'll minus from the df"? That's clever
I know. There are other columns like GDP which I want to use back and forward fills on. I only wanted to deal with the blanks in the iso_codes column tbh
But I can't seem to find the right syntax
Gonna try Stel's suggestion now though
Ah, Stel is using a drop. That's my next step for sure (although he's 1000000000 miles beyond me) but I need to display what I'm dropping first, if that makes any sense
minor elbow
did u try the one i posted
serene scaffold
trail ibex
Ah, Stel is using a drop. That's my next step for sure (although he's 1000000000...
this code doesn't actually change df in any way, so those columns will still be there in the original df.
trail ibex
Sorry about all the stupid questions btw :/ I really am a newb, Python is my first programming language and man it's rough with the syntax
minor elbow
yeah pandas is like its own little language in some respects
trail ibex
minor elbow
did u try the one i posted
Let me scroll back and check
serene scaffold
you can't do df.var2 == NaN, btw. comparisons to NaN are just always false.
but in either case, lst is not trying to filter rows or columns that have nans. they're trying to count them
trail ibex
minor elbow
df[['country', 'iso_code']].groupby('country').iso_code.apply(lambda x: x.isnull...
Holy bananas batman. This one works. I mean, I have no idea how, but it does what I need. Well, it shows non-nulls as well, which I'd like to remove, but this is what I needed
serene scaffold
not the rows or columns, but the instances of nan.
trail ibex
I'll read that, thank you YoDaddy 🙂
trail ibex
serene scaffold
but in either case, lst is not trying to filter rows or columns that have nans. ...
That's true, but when I drop them, I will need to filter to them, so I appreciate that view too
serene scaffold
I don't understand what you mean by "show what you drop". We're just ignoring two columns that either don't have nans or which are redundant.
minor elbow
u can subset dfs by indexing with a list of cols, so it gets the country/iso_code, then it groups by country, then for each group it counts the nulls in the iso_code series
it returns a series indexed by country so you can sort_values() ascending/descending, filter out those with 0 values etc
trail ibex
So, it's a college project - introductory data analysis. I need to do a project showing the steps I take to arrive at certain conclusions. With a dataset like this, I am not gonna use everything, so I am gonna zap a big part of it. Some of that I can do by justifying only importing certain columns (done), but other parts I need to justify getting rid of stuff that's not consistent or in the right format. The ISO code column is one of those. I want to zap the ones with none, cos they're generally territories (not what I want) or have no data. I need to say "This is what I am dropping, and this is why"
It's just the requirements of the course, is all 🙂
But I'd still need to be able to select them to drop them anyhow
 untold belfry
Can anyone tell me shortly how to use numpy's rjust for the second value of each numpy array inside the big array (arr[:, 1])?
trail ibex
serene scaffold
this worked for me:
```py
df.drop(['year', 'iso_code'], axis=1).groupby('country...
I think this does the next step for me, tbh. Looks like Dizzy has the select, but you were ahead with the drop part 🙂
Yup, those are the bunnies I want rid of, but I can't say "Well, it looked shit in Excel" 😛 I have to show I am doing it with Python
I may have lost this in the chat tbh :/ Let me scroll back. At the moment, I have dizzy's line, which does do the trick, but also shows the ones which have no nulls

Man, so much googling tomorrow to even figure that line out, but again, let me scroll back to the groupby
Ahhh, so it's the same line. Is there a method to exclude the ones that have no nulls from it?
Damn, that is useful. How did I not find that. Newbie search terms ftl :/
I seriously cannot thank you guys enough
You're saving my sanity here
minor elbow
trail ibex
I may have lost this in the chat tbh :/ Let me scroll back. At the moment, I hav...
that line will return a series, which you can then do further things on like
srs[srs > 0].sort_values()
you can use .sort_values(ascending=False) to sort highest to lowest
trail ibex
minor elbow
that line will return a series, which you can then do further things on like
``...
I think that I love you a bit. Let me show you.

I mean, I love everyone here so far, but this.....will let me get to tomorrow's bit. I'm gonna have to do some serious googling into why this works, but I seriously thank you man, really
YoDaddyM, I looked at the filtering example, but I got some weird outputs on that one. I probably need to read up a bit on the methods used
minor elbow
haha urw it turns out i have spent a lot of time working with pandas
trail ibex
Am sorry if it seems like I am begging to "solve it for me please" but honestly, I am finding this course way harder than I thought :/
I seriously do appreciate the help
And the explanations
minor elbow
theres a book "python for data analysis" by the original author of pandas which is a great reference to have around if you are going to be using pandas often
trail ibex
minor elbow
theres a book "python for data analysis" by the original author of pandas which ...
Ordered! Thank you again! Expensive fecker but I can see the value hehe 🙂
So here's another question
It may not be a sensible one
Actually
It isn't. I just noticed the answer to my question is a few lines up hehe. So I won't ask it 😛
trail ibex
minor elbow
haha urw it turns out i have spent a lot of time working with pandas
Dizzy. Can I ask about this bit please:
iso_code.apply(lambda x: x.isnull().sum())
The x:x - are they supposed to be something?
Or is this saying " well, we're calling it x, so we'll call isnull() on x"?
That is how I am reading it
minor elbow
yeah the latter, lambda's are just like little one line functions
trail ibex
Gotcha, thank you. Google time on lambdas 🙂
minor elbow
its like having ```
def something(x):
return x.isnull().sum()
Yeah, that makes sense, just wanted to make sure I was reading it right 🙂
minor elbow
theres some quirks to what is returned by the grouping things in pandas, i try to avoid lambdas but sometimes they are the only option
trail ibex
Can I ask about isnull and isna - is there any difference?
minor elbow
i dont think there is no, isnull is preferred i believe but isna is kept for compatibility
dataframes originated in a different language called R which has isna so a lot of data science ppl are used to using it
trail ibex
Ah OK
I noticed that YoD was intimating that a filter would do in this case - is it a good idea looking into that to see if I can find a second way of doing this?
R is not in this course for me, it's in the next one. If I survive this.
minor elbow
yes filtering is a worth a look, its a logical predicate used to index (ie goes in the [] part)
trail ibex
So filtering is the same as slicing? (sorry, again, newbie)
minor elbow
yes and no but mostly no, slicing is a way to select a subset based on the index, filtering is a way to select a subset based on conditions
trail ibex
Ah, so filtering sounds much more interesting. I'll read up on that - thanks man 🙂
The weird thing here is that I make bloody dashboards all day long in Tableau, and I can't fathom the basic stuff
SQL is nice, Python is yuck. Fight me 😛
trail ibex
I know hehe 🙂 And the reason for the course is because I need to move into dirty nasty areas of the business I'm in where it's all in excel files and not in the db
minor elbow
python is cool cause everyone knows excel but less ppl know python so its better for job security 😉
trail ibex
minor elbow
id take python over sql every day unsurprisingly
I mean, I get this too. A badly designed DB is worse than a nasty excel file. Specially if you can't change it
minor elbow
sql dbs are good if you have a lot of well structured data
doing data science stuff in python is more like a map/apply functional approach
trail ibex
They usually end up not well structured tho. The place I work has some......spaghetti.....DBs. Yes, I can query them in SQL, but eh, who designed this
minor elbow
which can scale easier than sql
trail ibex
minor elbow
doing data science stuff in python is more like a map/apply functional approach
That's why I want to learn it 🙂 It's not as easy as I thought it would be though, for sure
minor elbow
but sql dbs have been around a long time and very good at what they do
yeah having a good ref really helps
its a different way of thinking about things, it took me a long while to get my head around it, i wouldnt say i have mastered it yet either
trail ibex
Does it drive you guys nuts when two parts of the business are recording the same stuff, but seperately, and with different names? And often different units?
trail ibex
minor elbow
its a different way of thinking about things, it took me a long while to get my ...
I'm 2 weeks into this course. It's gonna kill me
minor elbow
it'll be fine dude, taking the time to understand every step is the way to go, eventually it will all click
trail ibex
welp, you helped me out a lot this evening man. I'm gonna do some googling on lambas to see what it is that worked. Thanks again 🙂 Sorry in advance but expect many more stupid questions in the near future 😛
Thanks Stel and YoD too 🙂
 vagrant kite
what do you need?
that is a question that you should post in this channel without pinging admins or moderators
ping moderators only if you need moderation, and admins only if there's something wrong with the server
 nova pollen
typically you get a response faster if you ask your question instead of asking if someone can answer your question
so what's your question
sure
send it
arctic wedgeBOT
Pasting large amounts of code
If your code is too long to fit in a codeblock in discord, you can paste your code here:
https://paste.pythondiscord.com/
After pasting your code, save it by clicking the floppy disk icon in the top right, or by typing ctrl + S. After doing that, the URL should change. Copy the URL and post it here so others can see it.
nova pollen
while im reading it, what's your question about it?
which is?
can you show a screenshot of what you mean
serene scaffold
All help in this server is given by volunteers. There's no guarantee about when or if you'll get an answer.
Also, most of the mods and admins are not data scientists.
nova pollen
m1d = (-2/n) * sum(y - y_predicted) * x1
m2d = (-2/n) * sum(y - y_predicted) * x2
note the *x1 at the end, that's a numpy array
hence m1d is an array
hence later,
m1_curr = m1_curr - (learning_rate * m1d)
m1 curr becomes an array too
perhaps you want sum((y-ypred)*x1)
same for m2d
(y-ypred)²
partial wrt m1
-2(y-ypred) * x1
average of gradients
1/n sum(-2(y-ypred)*x1)
= -2/n sum((y-ypred)*x1)
more accurately i would write
1/n sum(-2(y[i]-ypred[i])*x1[i])
-2 is a constant, hence can come out
anything that depends on the index stays inside
looks right, you might need to test run it yourself though
feel free to ping me again if something seems wrong
serene scaffold
yes. though do not ping me to ask me questions. I will answer if I am reading the channel.
though if someone expresses interest in your question, then you can ping them with respect to that question, to keep communication going.
with what? please ask a question, giving enough information that I can answer it if I know how.
Sorry, I can't do that right now. Did you check the output to see if it's correct? It's a lot more reliable to confirm that code has the expected result, than to stare at it convince yourself that it is or isn't written correctly.
 viral jackal
 hybrid isle
Hey, is there anyone who uses macbook to for ml, I had some problems while using tensorflow, I am a rookie on mac, needed someone to help me out in setting up an ml environment
 humble garnet
hello everyone
I have a problem, I have a 2 class dataset with 2500 images, I need to put it in a csv file, the problem is, when I place the image matrix, it becomes an object, not float64, what advice can you give to collect it in float64 format?


 royal crest
data_frame.Image.astype('float64') I guess
key function being astype() https://pandas.pydata.org/pandas-docs/stable/reference/api/pandas.DataFrame.astype.html
 desert oar
humble garnet
desert oar
humble garnet
pandas doesn't have specific support for columns that contain arrays. each individual value might still be a numpy array of dtype float64, but the pandas column itself can only have dtype object because that is the "generic" dtype for arbitrary python objects that pandas doesn't know how to handle
important question: how did you expect to put a multi-dimensional array into a csv in the first place?
upper spindle
does anyone know if it is possible to scrape twitter for historical tweets using selenium or beautifulsoup based on a keywords/hashtags?
the twitter api wont let me do a large scale scrape as historical tweets are mainly for academic research
 rotund isle
Hi, how does this snippet of code create training data and add some noise?
#We will create some one dimensional data with a bit of noise
num_points = 50
X = np.linspace(0,100,num_points).reshape(num_points,1)
y = (4 + 3 * X) + 25*np.random.randn(num_points, 1)```the problem is that each array--the whole array--is a single element of the dataframe. and even though the elements of the array are float64, the array is a python object, and the array is what's in the dataframe.
 modest shuttle
Hello,
Why did the image change?

 tidal bough
well, presumably you inverted the image somehow between these two cells
modest shuttle
tidal bough
well, presumably you inverted the image somehow between these two cells
where?

in jupyter it is okay but pycharm doesn't correctly show it

Why?
tidal bough
modest shuttle
in jupyter it is okay but pycharm doesn't correctly show it
hmm, interesting, then it might be that in pycharm your matplotlib pycharm defaults to a different colormap
although inverting colors is a very weird behaviour for a colormap
tidal bough
modest shuttle
in jupyter it is okay but pycharm doesn't correctly show it
That's not doing the same thing, though. You're showing the red channel here.
modest shuttle
tidal bough
That's not doing the same thing, though. You're showing the red channel here.
sorry

how to fix it in pycharm?
 deft sapphire
hey could anyone help me with this issue
i have been trying to capture video from my own webcam using opencv
but the window keeps greying out
any solution to it ?
i am trying to run this
import cv2 as cv
cap = cv.VideoCapture(0)
while True:
s, img = cap.read()
cv.imshow("Image", img)

cv.Waitkey(0)
anyone ?
 orchid kayak
I've got a model which, when trained on the exact same data different times, has very different accuracy scores. Does this make sense? Does it mean the data is not good? (the accuracy values themselves range from around 0.04 to 0.09, so the scale itself is small but its always in that scale)
I simply don't understand how the same model architecture, trained with the same data can have different accuracy scores each time it is trained.
brazen spire
Anyone good with amazon Sagemaker?
 viral bone
orchid kayak
I've got a model which, when trained on the exact same data different times, has...
viral bone
orchid kayak
I've got a model which, when trained on the exact same data different times, has...
Maybe it's randomization? There are a lot of models that involve randomization. For example in clustering, the start points are selected randomly each time
strong tapir
I've been trying to tackle the Snake with AI problem using the NEAT algorithm but I can't seem to get any behavior. I can't tell if its from my input data, bugs in the game itself (using pygame), or my NEAT config. My code is very junky so for further information I'll provide the important stuff below.
My input data right now is
input_data =
[(distance of snake head to food in north south east west directions (4 inputs)),
(distance of snake head to walls (4 inputs)),
(nearest snake body in north south east west directions (4 inputs))]

'if there isnt any food or a snake torso on one of the directions it returns 0 for the input'
my activation function is defaulted to relu but can mutate to tanh
my output is toggling a list of directions [UP, DOWN, LEFT, RIGHT] to either True or False for the desired direction.
[NEAT CONFIG]
[NEAT]
fitness_criterion     = max
fitness_threshold     = 100000
pop_size              = 10
reset_on_extinction   = False

[DefaultGenome]
# node activation options
activation_default      = relu
activation_mutate_rate  = 0.5
activation_options      = relu tanh

# node aggregation options
aggregation_default     = sum
aggregation_mutate_rate = 0.2
aggregation_options     = sum

# node bias options
bias_init_mean          = 0.0
bias_init_stdev         = 1.0
bias_max_value          = 30.0
bias_min_value          = -30.0
bias_mutate_power       = 0.5
bias_mutate_rate        = 0.9
bias_replace_rate       = 0.1

# genome compatibility options
compatibility_disjoint_coefficient = 1.0
compatibility_weight_coefficient   = 0.5

# connection add/remove rates
conn_add_prob           = 0.5
conn_delete_prob        = 0.5

# connection enable options
enabled_default         = True
enabled_mutate_rate     = 0.05

feed_forward            = True
initial_connection      = full

# node add/remove rates
node_add_prob           = 0.2
node_delete_prob        = 0.2

# network parameters
num_hidden              = 0
num_inputs              = 12
num_outputs             = 4

# node response options
response_init_mean      = 1.0
response_init_stdev     = 0.0
response_max_value      = 30.0
response_min_value      = -30.0
response_mutate_power   = 0.0
response_mutate_rate    = 1.0
response_replace_rate   = 0.0

# connection weight options
weight_init_mean        = 0.0
weight_init_stdev       = 1.0
weight_max_value        = 30
weight_min_value        = -30
weight_mutate_power     = 0.5
weight_mutate_rate      = 0.8
weight_replace_rate     = 0.1

[DefaultSpeciesSet]
compatibility_threshold = 3.0

[DefaultStagnation]
species_fitness_func = max
max_stagnation       = 20
species_elitism      = 2

[DefaultReproduction]
elitism            = 2
survival_threshold = 0.2
I can provide more info, visualization, or code if needed
minor elbow
orchid kayak
I've got a model which, when trained on the exact same data different times, has...
what model is it? likely its using randomness somewhere, you can make it always give the same result by setting the random seed to be the same, poke around the models docs there will likely be an option for it
lapis sequoia
how do i train python???
minor elbow
very carefully
trail ibex
C:\Users<me>\anaconda3\lib\site-packages\pandas\core\indexing.py:1884: SettingWithCopyWarning:
A value is trying to be set on a copy of a slice from a DataFrame.
Try using .loc[row_indexer,col_indexer] = value instead
See the caveats in the documentation: https://pandas.pydata.org/pandas-docs/stable/user_guide/indexing.html#returning-a-view-versus-a-copy
self._setitem_single_column(loc, val, pi)
Am I safe enough to ignore this? It appears to have done the job
Code used is:
# Still 2 issues here. GDP and population. We're going to tackle both with forward and back fills
# Let's fix those
cols = ['gdp', 'population']
df.loc[:,cols] = df.loc[:,cols].ffill()
it might be df is already a copy
like from earlier code
u can pass inplace=True to skip the assignment
trail ibex
That was the issue, thanks a mill - again!
Dizzy, your advice last night got me to the point where I can play with pictures now with my dataset. Super pleased. I wanted to just say thanks again 🙂 I know I was annoying, I was just super frustrated - you were kind and patient
minor elbow
ur welcome and i appreciate the thanks. i didnt find you annoying fwiw, theres definitely a pretty steep learning curve
trail ibex
Yeah hehe 🙂 But when you look at the output you wanted (I'm still using excel to test if my code output matches) and find it's the right stuff......man, quite a buzz 🙂
minor elbow
haha yeah i still get that feeling
trail ibex
Now all I gotta do is learn Seaborn 😛
minor elbow
if anything it was enjoyable to see your enthusiasm, its easy to get a bit jaded after a while
seaborn is so pretty
trail ibex
But for this set (what's left of it), I won't be doing anything nuts
It is, isn't it? 🙂
minor elbow
the examples are good too
trail ibex
Man the documentation is exceptional
trail ibex
It does, absolutely. The issue I had yesterday was just that I didn't know how to phrase my questions 🙂
You helped a lot though, seriously
My googles today were better than yesterday's ones. And that's a result
I use Tableau at work, but Seaborn is actually prettier, I think
minor elbow
yeah theres 2 things in python i use a lot, dir() and help(), dir gives you a list of all the functions an object has so like i will go dir(df) to see if theres anything that looks like what i want, and like help(df.ffill) will load up the docs for the function, im not sure how help() works in ipython
trail ibex
I didn't know about dir, actually, that one will be useful. The help() tends to give a LOT of info all in one blast. Thanks!
minor elbow
yeah i use python from the command line mostly so help just gives the info one page at a time and its easier to search through
trail ibex
Ah yes, OK. I am using Jupyter (I am required to for this project, but I actually kinda like it anyhow)
Jupyter tends to squash the output if there's more than a few lines
minor elbow
jupyter is good for sharing examples/demos with others
trail ibex
I have PyCharm installed as well, but I am still too afraid to tackle using it 😛
orchid kayak
minor elbow
what model is it? likely its using randomness somewhere, you can make it always ...
I had thought of that, especially considering I was using sk.learn's train_test_split(). But I have disabled the randomness in the method and run it still, to no success.
The model type is regression
minor elbow
i use visual studio code a lot, not for python but for other langs
trail ibex
Anyhow, looks like MooseMom needs help more than me. Again, thanks so much!
minor elbow
orchid kayak
I had thought of that, especially considering I was using sk.learn's train_test_...
yeah regression should always give the same output
can u share ur code or parts of it?
orchid kayak
I'd be happy to, but just to be clear I am following a semi-tutorial and this is the first time I am meddling in the machine learning field (signal processing), so I may not fully understand all the choices here
minor elbow
sure np
orchid kayak
The model:
  model = Sequential()
  model.add(Conv2D(32, (3,3), padding='same', input_shape=(513, 26, 1), name='conv_1'))
  model.add(LeakyReLU(name='leaky_relu_1'))
  model.add(Conv2D(16, (3,3), padding='same', name='conv_2'))
  model.add(LeakyReLU(name='leaky_relu_2'))
  model.add(MaxPooling2D(pool_size=(3,3), name='max_pooling_1'))
  model.add(Dropout(0.25, name='dropout_1'))
  model.add(Conv2D(64, (3,3), padding='same', name='conv_3'))
  model.add(LeakyReLU(name='leaky_relu_3'))
  model.add(Conv2D(16, (3,3), padding='same', name='conv_4'))
  model.add(LeakyReLU(name='leaky_relu_4'))
  model.add(MaxPooling2D(pool_size=(3,3), name='max_pooling_2'))
  model.add(Dropout(0.25, name='dropout_2'))
  model.add(Flatten(name='flatten_1'))
  model.add(Dense(128, name='dense_1'))
  model.add(LeakyReLU(name='leaky_relu_5'))
  model.add(Dropout(0.5, name='dropout_3'))
  model.add(Dense(513, name='dense_2'))

  sgd = SGD(learning_rate=0.001, decay=1e-6, momentum=0.9, nesterov=True)
  model.compile(loss='mse', optimizer=sgd, metrics=['accuracy'])
The feature method:
def transforming_librosa(y_mixture, y_vocals=None):
  mixture_librosa_stft = lb.stft(y=y_mixture, n_fft=1024, win_length=1024, hop_length=256)
  mixture_librosa_stft = abs(mixture_librosa_stft)
  mixture_stft = normalize(mixture_librosa_stft)

  if y_vocals is not None:
    vocal_librosa_stft = lb.stft(y=y_vocals, n_fft=1024, win_length=1024, hop_length=256)
    vocal_librosa_stft = abs(vocal_librosa_stft)
    vocals_stft = normalize(vocal_librosa_stft)

    return mixture_stft ,vocals_stft

  else:
    return mixture_stft, []
def featue_extract(cls):
  y_mixture = []
  y_vocals = []
  for i in range(len(df_data)):
    a = df_data.at[i, 'mixture']
    b = df_data.at[i, 'vocals']


    m, v = transforming_librosa(a, b)

    if(cls[i] == 1):
      t = binary_mask(v)
    else:
      t = np.zeros(shape=(513, 26), dtype=np.float64)

    t = t.T
    t = t[13]

    y_mixture.append(m)
    y_vocals.append(t)

  return np.array(y_mixture) ,np.array(y_vocals)
ok thats a deep learning model, it will randomly initialize the weights
orchid kayak
y_mixture = np.reshape(y_mixture, newshape=(3168, 513, 26, 1))
y_vocals = y_vocals.astype(np.float64)
its not uh regression strictly speaking
minor elbow
neural networks are effectivetly weighted sets of regression models
the weights is what gets "learned"
usually they are randomly initialized
also dropout layers will randomly drop things
try put np.seed(x) at the top
orchid kayak
So are you saying that due to the random initialization the results won't necessarily repeat themselves
orchid kayak
I should have thought about that, thanks
Now I just need to figure out how to increase the accuracy
minor elbow
also sgd = stochastic gradient descent, and stochastic is just a fancy way of saying random so theres randomness in that as well
orchid kayak
the sgd part I copied, I was not taught the meaning of it
minor elbow
if ur new to ML, starting with deep learning is definitely hard mode
thats a good reference though
orchid kayak
My high school decided it was a good idea to let us do final projects in this area
I could've done something a lot simpler i.e image classification but I wanted something more interesting hence the signal processing
Had I had any idea how complicated it would be I'd had never done it
minor elbow
if theres termporal ordering to the data, ie samples from a signal over time, a different type of model like rnn or lstm might be more effective
*temporal
yeah its pretty full on, most of the problems i deal with arent really suited to deep learning, plus the training time for the models is too long for me so i dont use it much
orchid kayak
I think I understand what you are saying, but in reality what this whole project is, is converting the audio data into image data, and converting a regression problem to a classification one
minor elbow
oh right
model building and tuning is quite a lot of work
id find a tutorial/example model that does what you want and try it out, which sounds like maybe what you are doing?
realistically coming up with a novel/new method of using deep learning for signal anaylsis would be a phd worthy topic
orchid kayak
Exactly my issue lol, I've discovered that my topic has almost 0 results on a deep learning model, except a pair of articles by the same person who discusses EXACTLY my topic. But his articles don't give a fully detailed explanation on how to do it yourself, so the struggle still remains
 mint palm
i saw a sitation of kaggle dataset
it mentioned it had 65000 entries
but when i download it and open in excel it doesnt have entries...whats the matter
citation [33] on this page has the link to dataset : https://link.springer.com/article/10.1007/s10922-021-09636-2

SpringerLink
Journal of Network and Systems Management - In current era, the next generation networks like 5th generation (5G) and 6th generation (6G) networks requires high security, low latency with a high...
but i cant see 65000 entries
prime hearth
hello , for map estimate linear regression
how would i find the posterior term?
shold i use chi square method
or any arbitary value?
 minor elbow
are u on a gpu instance
brazen spire
yeah
which is weird
i know we can force it on tensorflow
but i don't know with pytorch
minor elbow
ive only used mxnet with sagemaker
prime hearth
hello
for map estimation linear regression
can i please ask
from predictor import Predictor
import numpy as np


class LinearRegressionMLE(Predictor):
    def __init__(self):
        self.weights = None

    def train(self, train_x, train_y):
        bias = np.ones((train_x.shape[0], 1))
        X = np.concatenate((train_x, bias), axis = 1)
        self.weights = np.linalg.inv(X.T.dot(X)).dot(X.T).dot(train_y)


    def predict(self, test_x):
        bias = np.ones((test_x.shape[0], 1))
        X = np.concatenate((test_x, bias), axis = 1)
return X.dot(self.weights)```from this website https://medium.com/@luckecianomelo/the-ultimate-guide-for-linear-regression-theory-918fe1acb380
i would like to please know for the train method(), how do we get x weights?
also the formula for mle is
X^T Y(X^T X)^-1
tidal bough
np.linalg.inv(X.T.dot(X)).dot(X.T).dot(train_y)
this looks like the logistic equation - that's how.
prime hearth
because when i do the math i get (1,1)
for weights
and if i have 3 features
how to get 3 weights?
i see they aded bias as second column to x
to get 2 weights i think
but i dont understand why they did this
thanks so much for taking time to respond
tidal bough
prime hearth
how to get 3 weights?
X is a matrix of shape sample_number, feature_number. train_y is a vector of shape sample_number. Then let's look at the shape of the result:
X.T @ X is (feature_number,feature_number).
Inverting it preserves the shape.
Multiplying by X.T once more produces a shape of (feature_number,sample_number)
finally, multiplying by a vector of (sample_number,1) gets you a (feature_number,1) vector
so indeed, the shape of the result should always be correct - a vector of feature_number weigths.
prime hearth
hmm okay so let say i have x shape (2,1) and y is (2,1)
if i apply this to the math above that you wrote i get
(1,2) x (2,1) = (1,1)
we take inverse of this so (1,1)
(1,1) times (1,2) = (1,2)
now times y (2,1) becomes (1,1)
this is using dot product like code above
tidal bough
yeah, that's right - you started with a dataset with 1 feature and ended up with 1 weight
though note that this is counting the bias among the features
so if you have 1 feature, including the bias, that means you actually have no data at all, only the bias column of ones.
prime hearth
oh so i have one feature and one label
so 2 features in total but one is x and another is y
tidal bough
the label doesn't count as a feature
tidal bough
features are the inputs to your model that you use to determine the output (label)
tidal bough
in my definition, I count the bias as a feature, which means you'll never have less than 2 features, yeah
prime hearth
so the reason why they added bias
to X
so you are saying we need to add bias
before doing the formula to calculate weights
tidal bough
We need to add the bias to X because if we don't have the bias column, then our linear regression won't have a constant term
like, it won't be able to learn relationships like y = 5 + x - it'll approximate it with something like y=x and be consistently wrong by the constant of 5
prime hearth
oh okay thanks and that @ symobol
is that like mul;tiplication of amtrix
or dot product as well
tidal bough
numpy uses @ for matrix multiplication; it's the same as using np.dot and I'd say it's more readable
tidal bough
prime hearth
or dot product as well
both, just like dot
prime hearth
oh okay
lapis sequoia
Is anyone here familiar with bagging (bootstrapping + aggregating)? I have one doubt about a thing which I'm not sure I'm doing right:
is it normal to get the same accuracy no matter the number of bootstrapped trees??
I don't think it's right
but I can't quite see what I'm doing wrong
prime hearth
thanks conufsed reptile
prime hearth
oh sorry forgot to ask one more thing, why did they use np.ones for bias
they only estimate weights use mle but not for the bias and most website dont explain this
when i derived mle for bias it comes to be BiasMLE = 1/N summation Yi - 1/N *Weights * summation Xi
 hollow sentinel
are there any courses i can use for scikitlearn?
tidal bough
prime hearth
oh sorry forgot to ask one more thing, why did they use np.ones for bias
basically, you can either consider bias a totally separate thing from the weigths... or you can just add a column of ones to the data, and regress on it too, and that's the same thing
the latter approach is easier
 hidden wadi
serene scaffold
hidden wadi
serene scaffold
Looks like that person left.
hollow sentinel
i think it's better to understand how the diff algos work than sklearn
i'm not sure tho
 frosty flower

This represents 10 images of 1024w and 768h
I want to look at a specific pixel (i, j) in all 10 images and see it as a vector with length 10
How do I do that?
minor elbow
z[:,i,j]
serene scaffold
frosty flower
I want to look at a specific pixel (i, j) in all 10 images and see it as a vecto...
it will be a 2d array, not a vector. but try dizzy's solution
"vectors of tuples" aren't really a thing.
minor elbow
hollow sentinel
are there any courses i can use for scikitlearn?
the andrew ng courses on coursera are good starting points
serene scaffold
minor elbow
the andrew ng courses on coursera are good starting points
I thought that course uses a different programming language than Python, and thus wouldn't have sklearn?
minor elbow
its a bit more under the hood than sklearn but you should be able to pick up skl afterwards
serene scaffold
in either case, you should not aim to learn specific libraries
minor elbow
i cant remember what lang it is, im sure ppl have done python versions u can look at
serene scaffold
libraries are tools. you should try solving different problems, and over time you'll figure out which libraries can help you solve those problems.
minor elbow
yeah sklearn is a pretty straight forward ml lib if you dont know how to do ML then sklearn or any other library will be no use
serene scaffold
right. also sklearn does a lot of different things that are kind of unrelated.
lapis sequoia
Hello everyone, Any one who is interested in H&M Fashion Recommendation challenge ? The dataset is so much cool and doiing stuff on that would be fun. So anyone interested, please check the competition out (link: https://www.kaggle.com/c/h-and-m-personalized-fashion-recommendations/overview), and if you are interested to collab, please DM me. Thank you.

Provide product recommendations based on previous purchases
 inland zephyr
Hello all, i want to explore multi-input cnn which combine wavelet and CNN which mentioned in this paper... however i need sufficient good example or hands-on for multi-input CNN model. The paper source for the diagram: http://arxiv.org/abs/1805.08620


arXiv.org
Spatial and spectral approaches are two major approaches for image processing
tasks such as image classification and object recognition. Among many such
algorithms, convolutional neural networks...
frosty flower
minor elbow
z[:,i,j]
Thanks that's what I needed
But now I've got a different problem: I need a 1024 by 768 matrix that each entry (i, j) is the original entry (i, j)'s dot product with itself
I can do it with a loop but is there a vectorized way to do it?
serene scaffold
frosty flower
But now I've got a different problem: I need a 1024 by 768 matrix that each entr...
you need a matrix that is (1024, 768)-shape, but where each element is a two-tuple? again, that's not how it works. every element of an array is a scalar. What you're describing is an array of shape (1024, 768, 2).
frosty flower
serene scaffold
you need a matrix that is (1024, 768)-shape, but where each element is a two-tup...
I meant ith row and jth col

 iron basalt
frosty flower
I meant ith row and jth col
iron basalt
frosty flower
I meant ith row and jth col
I think you just described matrix powers: ```py
import numpy as np
x = np.arange(25).reshape((5, 5))
x
array([[ 0, 1, 2, 3, 4],
[ 5, 6, 7, 8, 9],
[10, 11, 12, 13, 14],
[15, 16, 17, 18, 19],
[20, 21, 22, 23, 24]])
y = np.dot(x, x)
y
array([[ 150, 160, 170, 180, 190],
[ 400, 435, 470, 505, 540],
[ 650, 710, 770, 830, 890],
[ 900, 985, 1070, 1155, 1240],
[1150, 1260, 1370, 1480, 1590]])
np.dot(x[0,:], x[:,0])
150
np.dot(x[1,:], x[:,0])
400
np.dot(x[0,:], x[:,1])
160
np.dot(x[1,:], x[:,1])
435
Is anyone here familiar with bagging (bootstrapping + aggregating)?
I'm trying to implement both the bootstrapping and aggregating phase manually, but I get inaccurate results
Can someone help me sort this out?
iron basalt
iron basalt
I think you just described matrix powers: ```py
>>> import numpy as np
>>> x = n...
Or is your array 3D? Do you mean this? ```py
import numpy as np
x = np.arange(8).reshape((2, 2, 2))
x
array([[[0, 1],
[2, 3]],
   [[4, 5],
    [6, 7]]])
y = np.sum(x * x, axis=2)
y
array([[ 1, 13],
[41, 85]])
y = np.einsum("ijk,ijk->ij", x, x)
y
array([[ 1, 13],
[41, 85]])
(Dot product along last axis)
inland zephyr
Hello, i have tried to build a multi-input model and try to predict the output of the model. However, i have problem when try to run the model.
I have four input (it is image actually), and processed in parallel (through multiple Conv2d) before concatenated at the end. However, i got error while run the model to predict the inputs ``` ValueError: Exception encountered when calling layer "model_6" (type Functional).
Input 0 of layer "conv2d_3" is incompatible with the layer: expected min_ndim=4, found ndim=3. Full shape received: (32, 142, 32)

Call arguments received:
  • inputs=('tf.Tensor(shape=(32, 142, 32), dtype=float32)', 'tf.Tensor(shape=(32, 142, 32), dtype=float32)', 'tf.Tensor(shape=(32, 142, 32), dtype=float32)', 'tf.Tensor(shape=(32, 142, 32), dtype=float32)')
  • training=False
  • mask=None```
I dont know if i missing something, but i modified my model based from the answer from here https://stackoverflow.com/questions/69143694/concatenating-parallel-layers-in-tensorflow
Stack Overflow
I am going to implement neural network below in tensorflow
Neural network with paralle layers
and i wrote code below for it
Defining model input
input_ = Input(shape=(224, 224, 3))
Defining fi...
iron basalt
inland zephyr
Hello, i have tried to build a multi-input model and try to predict the output o...
Do you have a question?
inland zephyr
I think i missing something to feed the model with my four images
if I can see the model summary, why i cannot feed the model directly
this is the model that i build and compiled, however when I try to call model.predict(x=[img1,...,img4]) the errors happen
 umbral anvil
I'm working on a project to predict congestion at the airport.
We are trying to build a pipeline that connects data and machine learning.
The API data is currently DB, and the SQL used here is 'postgra sql'.
 vivid ridge
Which book/course is recommended for Time series analysis/prediction (for someone without statistics background, but with math degree)
umbral anvil
vivid ridge
Which book/course is recommended for Time series analysis/prediction (for someon...
Did you say that to me?😓
mint palm
I saw some work.....it had used CNN for detecting malicious data....but the dataset was actually in csv file and not at all related to image.....it was kind of a typical data used in normal ANN....
Is it actually possible to do that
??
agile cobalt
hollow sentinel
are there any courses i can use for scikitlearn?
https://www.fun-mooc.fr/en/courses/machine-learning-python-scikit-learn/ is starting today but I cannot vouch much for it

FUN MOOC
Build predictive models with scikit-learn and gain a practical understanding of the strengths and limitations of machine learning!
orchid kayak
Do the amount of data and the model accuracy go hand in hand? Does lack of data mean poorer accuracy? If I add more data for my training, can my accuracy improve?
 kindred silo
I am not sure if this is the right place to ask but does anyone have a good dataset on pronouns/neo-pronouns ?
 misty flint
umbral anvil
I'm working on a project to predict congestion at the airport.
We are trying to ...
misty flint
umbral anvil
I'm working on a project to predict congestion at the airport.
We are trying to ...
postgres SQL? sounds like you will need to read up on REST APIs and this will be more of a data engineering problem than data science one
you can start here i guess https://restfulapi.net
REST API Tutorial
REST is an acronym for REpresentational State Transfer. It is an architectural style for hypermedia systems and was first presented by Roy Fielding.
misty flint
orchid kayak
Do the amount of data and the model accuracy go hand in hand? Does lack of data ...
generally the more data, the more accurate the model.
2 caveats: 1) depending on your use case, it can be more about having the "right" data over more data, 2) even if you have more data, you might run into the overfitting problem so make sure you mitigate that
orchid kayak
Thanks, so just to make sure for myself: If I am following a tutorial where the creator has a dataset of 15M examples, while I have 3000, it is expected my model will preform worst, correct?
lapis sequoia
orchid kayak
Thanks, so just to make sure for myself: If I am following a tutorial where the ...
not exactly, sometimes it depends on the data too.
assume the task can be done by a simple function, it can be done with that too.
agile cobalt
I wouldn't be surprised if it performed better against the training data, but a bit worse on the test data
how many samples you need depends mostly on how many features you're using iirc, but it can vary a lot
lapis sequoia
it depends on the task and data. but having worst result at 3000 is not a thumb rule at all.
and hm if it has 1.5M for training then it can fall into overfitting too. (not necessaily)
umbral anvil
misty flint
postgres SQL? sounds like you will need to read up on REST APIs and this will be...
Thank you. I'll keep that in mind.
desert oar
vivid ridge
Which book/course is recommended for Time series analysis/prediction (for someon...
Forecasting: Principles and Practice should be okay if you don't have a statistics background i think? as long as you know the basics. it's in the pinned messages
desert oar
umbral anvil
Thank you. I'll keep that in mind.
i concur, this is a job for a data engineer and not a data scientist
the job of a data scientist is to build models and design business solutions using data and data-derived products. the job of a data engineer is to support data science with software
umbral anvil
desert oar
i concur, this is a job for a data engineer and not a data scientist
I'm learning now, so I'm doing many things.
However, I want to do DE more than DS.
desert oar
then i recommend that you start by learning sql and specifically postgresql
because if that's where the data is currently stored, then you will need to be able to at least query from it and connect to it from other systems
it's also important to define what you need to accomplish, in more detail than "connect machine learning to data" which is vague
umbral anvil
@desert oar Thank you very much for your advice.
I understand what you mean.

 umbral anvil
Is the purpose of learning the size of the image? That's how I understood it.
frosty flower
The training set is 10 of 1024x768 images, the target is one array with shape (1024, 768)
I want to do a linear regression for each of the pixels
and store w and b (or w0 and w1, whatever you call it) separately in two 1024x768 arrays
umbral anvil
@frosty flower I think it's about image learning among AI techniques. Is that right?
I won't be able to help, but others will be able to help you.😢
 storm stone
hey, is anyone here familiar with openAI, GPT-3 or their API?
serene scaffold
storm stone
hey, is anyone here familiar with openAI, GPT-3 or their API?
Please always ask your actual question, not if anyone knows about the topic of a question you haven't asked.
storm stone
serene scaffold
Please always ask your actual question, not if anyone knows about the topic of a...
oh okay sorry
so basically, i'm trying to develop a program that uses two bots to talk to each other
sorta like a chatbot in a way
with the openAI API which uses GPT-3 models
 mild dirge
frosty flower
and store w and b (or w0 and w1, whatever you call it) separately in two 1024x76...
mild dirge
frosty flower
and store w and b (or w0 and w1, whatever you call it) separately in two 1024x76...
You could always flatten the images
storm stone
but my API settings for GPT must not be configured correctly
mild dirge
Depends on how complicated your desired transformation is
storm stone
because it is unable to speak fluently with each other
if anyone could help me out with this, i would really appreciate a dm or anything
brazen spire
What are some applications of neural rendering?
i can't find much online
besides deepfakes
vivid ridge
desert oar
Forecasting: Principles and Practice should be okay if you don't have a statisti...
Thanks
desert oar
frosty flower
I want to do a linear regression for each of the pixels
each pixel individually? meaning, you want 1024x768 individual models? why?
frosty flower
desert oar
each pixel individually? meaning, you want 1024x768 individual models? why?
yes
desert oar
linear regression with 1 variable has a closed form solution, maybe you can just write a vectorized numpy expression and apply it to your 10x1024x768 array of training images
but i have to say this seems like a weird thing to want to do
modest shuttle
Why pycharm doesn't show correctly the image???
 frosty flower
modest shuttle
Why pycharm doesn't show correctly the image???
frosty flower
modest shuttle
Why pycharm doesn't show correctly the image???
my guess is you have to change cmap
modest shuttle
frosty flower
my guess is you have to change cmap
where is cmap?
Why????????????????????
 frosty flower
It's likely your cv2.imread parameters
I'm not too familiar with it but I think:
- The imread and imshow cmaps should probably match each other
- By default, the cv2 reads images using a BGR order instead of RGB. Might also be something you should aware
mild dirge
yeah iirc matplotlib is RGB and cv2 is BGR by default
 silk basin
hey i want to create a programm that lets u check other ppl's usernames what should i use
cause idk
mild dirge
Seems like a discord.py question, not ds and ai
modest shuttle
frosty flower
I'm not too familiar with it but I think:
1. The imread and imshow cmaps should...
yes, but problem is jupyter has a different show.
silk basin
i just wanna know if i can use dict
modest shuttle
modest shuttle
yes, but problem is jupyter has a different show.
but pycharm has incorrect show with same code!
modest shuttle
modest shuttle
but pycharm has incorrect show with same code!
how to fix this problem?
 shut trail
modest shuttle
Why pycharm doesn't show correctly the image???
shut trail
modest shuttle
Why pycharm doesn't show correctly the image???
dark theme inverts images?
iron basalt
modest shuttle
Why pycharm doesn't show correctly the image???
You can always file a bug report to the pycharm devs.
 shut trail
dark theme with big white blocks can be hard on the eyes
desert oar
shut trail
i bet it's an attempt to make charts with matplotlib defaults look good on the dark background
what a funny default
mild dirge
yeah it's just strange to me, you can change matplotlib plot styles anyways
making it invert images just is weird haha
 neat schooner
does anyone have a recommendation for learning Pandas Multiindexing. I am struggling with this concept. Been reading Python data science handbook by Vanderplas, but it's just not sticking.
shut trail
desert oar
what a funny default
agreed. i like the option but default? strange
shut trail
neat schooner
does anyone have a recommendation for learning Pandas Multiindexing. I am strugg...
are you on page 128?
if you use tuples as indices, it gets annoying to use one index at a time
pandas multiindex allows you to get past that
neat schooner
@lapis sequoia, not sure if it's 128 but the chapter on Hierarchical Indexing (reading it online)
shut trail
ya thats the right section. "the bad way" describes the situation it helps with
neat schooner
the whole chapter seems disparate and not cohesive (to me at least)
shut trail
haha fk the whole chapter just read the 'the bad way' and forget everything else . at least then you'll know the what and why of multiindex
neat schooner
Pandas: when doing it the bad way works....
shut trail
it does lol read
if you produce documents that you dont want to scare people, these kinds of tools are really nice
serene scaffold
neat schooner
does anyone have a recommendation for learning Pandas Multiindexing. I am strugg...
what are you trying to do with multiindexing? often, the best way is to learn what solves the problem you're currently having, and over time you'll figure out how it all generalizes
desert oar
shut trail
ya thats the right section. "the bad way" describes the situation it helps with
I haven't read the book, what is the bad way?
shut trail
re munging every time you want to use one index in a multi index situation
desert oar
shut trail
re munging every time you want to use one index in a multi index situation
can you give a specific example?
sometimes the reset_index/set_index dance is unavoidable, eg. after groupby or before join
desert oar
neat schooner
does anyone have a recommendation for learning Pandas Multiindexing. I am strugg...
the index is an array of row labels, and a multiindex is just what happens when each row has multiple labels
shut trail
yup. pandas tries to simplify the code and and make it more efficient
desert oar
oh, no the "bad way" here is literally just a multiindex but worse
there is no reason imo to explicitly use a tuple-valued index instead of a multiindex
shut trail
lol no kidding
neat schooner
I guess what isn't clicking is when creating a Multiindex. do I just create a Series, a dataFrame, do I use from.array, from.tuple, from.product? I get having options it seems overly complicated
serene scaffold
neat schooner
I guess what isn't clicking is when creating a Multiindex. do I just create a Se...
I've only instantiated a MultiIndex directly with .from_product. Otherwise I get them implicitly with method calls on the dataframe that add levels to the index.
shut trail
^ this is why i love pandas. but I felt like you did at first dr.venture
neat schooner
thats why I asked. I want to understand this and maybe a different approach would make it click. Was looking at Corey schafer's tutorials to see if he had one
shut trail
https://pandas.pydata.org/pandas-docs/stable/user_guide/advanced.html
search for 'As a convenience', its about a page or two in
shut trail
serene scaffold
I've only instantiated a MultiIndex directly with `.from_product`. Otherwise I g...
this is the way to do it
you dont need to call multiindex, the logic just works
neat schooner
ok, thank you!
 frosty flower

Hey everyone
So a general question: what makes you interested in data science?
Personally I feel like the more ML courses I take (and the more assignments I do), the less I feel like working in this field.
Most CS concepts I've learned at uni made me feel like "aha that's smart, that's the way it should be done". But DS concepts are more like "this works alright, and now let's look at it algebraically to see if we can make it work even better"
If any of you genuinely find DS interesting, would you share your thoughts on what makes it fun? Because I kind of can't see it right now (while taking multiple courses and struggling). Need some motivation.
 worldly dawn
frosty flower
If any of you genuinely find DS interesting, would you share your thoughts on wh...
worldly dawn
frosty flower
If any of you genuinely find DS interesting, would you share your thoughts on wh...
I am looking at it with a more applied lens. So it's part of the product r&d with meaningful impacts to users. That helps a lot in keeping it interesting.
 fringe igloo
Can someone help with fixing this matplotlib chart animation? It's recreating the lines each call instead of redrawing them
from random import randint
from datetime import datetime, timedelta
import matplotlib.pyplot as plt
from matplotlib.animation import FuncAnimation

x = [datetime.now() - timedelta(seconds=i) for i in range(10)]
random_numbers = [randint(0, 100) for i in range(10)]
random_numbers_again = [randint(0, 25) for i in range(10)]


def update(_frame):
    x.pop(0)
    x.append(datetime.now())
    random_numbers.pop(0)
    random_numbers.append(randint(0, 100))
    random_numbers_again.pop(0)
    random_numbers_again.append(randint(0, 25))

    plt.plot(x, random_numbers, label="random_numbers", color="#1f78ff")
    plt.plot(x, random_numbers_again, label="random_numbers_again", color="#ff4747")

    plt.xlabel("Time")
    plt.ylabel("Random Number")
    plt.title("Random Number Graph")
    plt.legend(loc="upper left")


def main():
    fig, ax = plt.subplots()
    _animation = FuncAnimation(fig, update, interval=1000)
    plt.show()


if __name__ == "__main__":
    main()
 misty flint
frosty flower
If any of you genuinely find DS interesting, would you share your thoughts on wh...
misty flint
frosty flower
If any of you genuinely find DS interesting, would you share your thoughts on wh...
for me, im applying it at work - part of the ai & data team. so its more about applying it to my industry that makes it interesting.
in the real world, the problems are never straightforward and theres usually more than one solution
shut trail
fringe igloo
Can someone help with fixing this matplotlib chart animation? It's recreating th...
Stack Overflow
I was wondering why some people put a plt.draw() into their code before the plt.show(). For my code, the behavior of the plt.draw() didn't seem to change anything about the output. I did a search o...
fringe igloo
shut trail
https://stackoverflow.com/questions/23141452/difference-between-plt-draw-and-plt...
Oh
So something like this?
def update(_frame):
    x.pop(0)
    x.append(datetime.now())
    random_numbers.pop(0)
    random_numbers.append(randint(0, 100))
    random_numbers_again.pop(0)
    random_numbers_again.append(randint(0, 25))

    plt.plot(x, random_numbers, label="random_numbers", color="#1f78ff")
    plt.plot(x, random_numbers_again, label="random_numbers_again", color="#ff4747")

    plt.xlabel("Time")
    plt.ylabel("Random Number")
    plt.title("Random Number Graph")
    plt.legend(loc="upper left")

    plt.draw()


def main():
    fig, ax = plt.subplots()
    _animation = FuncAnimation(fig, update, interval=1000)
    plt.show()
Nvm nope
shut trail
tbh honest i didnt read the first snippet, just thought it would be a good piece of info for you
try it haha
shut trail
are you in interactive mode ?
fringe igloo
No idea what does that mean, I just run the code above
Is that in interactive mode?
I'm just looking for a chart that updates with the lines with the data every sec
Which it does but it creates new lines each time
shut trail
when i read "recreating the lines each call instead of redrawing them", i think, add a plt.draw() before the plt.show()
fringe igloo
I'm doing it completely wrong I just realized
from random import randint
from datetime import datetime, timedelta
import matplotlib.pyplot as plt
from matplotlib.animation import FuncAnimation

x = [datetime.now() - timedelta(seconds=i) for i in range(10)]
random_numbers = [randint(0, 100) for i in range(10)]

plt.xlabel("Time")
plt.ylabel("Random Number")
plt.title("Random Number Graph")

fig = plt.figure()
line, = plt.plot(x, random_numbers, label="random_numbers", color="#1f78ff")
plt.legend(loc="upper left")


def update(_frame):
    x.pop(0)
    x.append(datetime.now())
    random_numbers.pop(0)
    random_numbers.append(randint(0, 100))

    line.set_data(x, random_numbers)
    return line,


def main():
    _animation = FuncAnimation(fig, update, interval=1000)
    plt.show()


if __name__ == "__main__":
    main()
I think this is much closer to the correct one
Though still not yet correct
shut trail
dont want to try plt.draw before plt.show ? lol
fringe igloo
Like this or what?
def main():
    _animation = FuncAnimation(fig, update, interval=1000)
    plt.draw()
    plt.show()
I don't see why/where/how I need to use it
shut trail
GeeksforGeeks
A Computer Science portal for geeks. It contains well written, well thought and well explained computer science and programming articles, quizzes and practice/competitive programming/company interview Questions.
fringe igloo
Pretty sure that's completely different
Since I'm using FuncAnimation
I haven't seen draw used anywhere in the examples
shut trail
Learn matplotlib - Basic animation with FuncAnimation
you dont need draw with animation
fringe igloo
Right
So what's wrong with my code?
from random import randint
from datetime import datetime, timedelta
import matplotlib.pyplot as plt
from matplotlib.animation import FuncAnimation

x = [datetime.now() - timedelta(seconds=i) for i in range(10)]
random_numbers = [randint(0, 100) for i in range(10)]

fig = plt.figure()
line, = plt.plot(x, random_numbers, label="random_numbers", color="#1f78ff")
plt.legend(loc="upper left")
plt.xlabel("Time")
plt.ylabel("Random Number")
plt.title("Random Number Graph")


def update(_frame):
    x.pop(0)
    x.append(datetime.now())
    random_numbers.pop(0)
    random_numbers.append(randint(0, 100))

    line.set_data(x, random_numbers)
    return line,


def main():
    _animation = FuncAnimation(fig, update, interval=1000)
    plt.show()


if __name__ == "__main__":
    main()
The output of that makes no sense
shut trail
nothing since you havent defined featrues or outcomes
shut trail
fringe igloo
The output of that makes no sense
you get an error or?
shut trail
likee... randomly chosen numbers ?
shut trail
no
shut trail
if you had defined features and outcomes, train_test_split does just what it says. it returns training and testing sets of the size you asked for
and random sate is used for reproducibility
mild dirge
Why is random_state always set to 42 for that one?
Is there like a single popular guide that uses that value or something?
shut trail
hitchhikers guide