#data-science-and-ml
1 messages · Page 374 of 1
 plush jungle
why have self.in2ouput and self.in2hidden
if you only need one network for an RNN?
it's not like it's passing the output from one into the other
it goes:
input + hidden --> in2output = output
input + hidden --> in2hidden = hidden
 thin palm
what's your take on it then?
 iron basalt

The AI dream
The article dives deep into the working principles of the Recurrent Neural Network(RNN) and Long Short-Term Memory(LSTM). Credits “Humans don’t start their thinking from scratch every second. As you read this article, you understand each word based on your understanding of previous words. You don’t throw everything away and start thinking from s...
plush jungle
iron basalt
https://www.theaidream.com/post/introduction-to-rnn-and-lstm
ok now I'm even more confused. not only does this tutorial not explain why you need two neural nets or what the purpose of either one is, it seems to suggest that you calculate the hidden state Ht and then calulate the output using that
whereas my code clearly calculates it with Ht-1
and then calculates Ht
thin palm
Can anyone help me with the question of One Hot Encoding???
iron basalt
Consider a plain old feed forward neural network with 1 hidden layer, how is the output calculated?
plush jungle
I have a firm understanding of how basic deep neural nets work with images, but this natural language stuff is confusing
plush jungle
iron basalt
Consider a plain old feed forward neural network with 1 hidden layer, how is the...
each neuron in the input layer gets passed to each neuron in the hidden layer
mutliply the inputs times the weights
add bias
apply relu
iron basalt
plush jungle
each neuron in the input layer gets passed to each neuron in the hidden layer
And what would you call that output (variable)?
plush jungle
a vector
iron basalt
What would you label that vector in math?
plush jungle
output_1
output_2
etc?
plush jungle
iron basalt
The hidden state is not the output state.
oh you're saying that the hidden state is just a vector that the hidden layer outputs?
and it's the same in RNNs?
iron basalt
Yes.
plush jungle
so the only difference is that instead of one deep neural net with three layers
it's two neural nets
that run seperately
plush jungle
right
iron basalt
What label / letter would you assign to the input vector?
plush jungle
x?
plush jungle
xh?
iron basalt
It's just 1 letter, not an operation
single variable that is the end result of the operation
plush jungle
y?
iron basalt
Nope. Look at this image of a simple feed forward neural network with 1 hidden layer:
 plush jungle
oh I see, h1?
iron basalt
h_1 is just 1 component of it, each layer's output/activation is a vector remember?
plush jungle
yeah
iron basalt
So what is the vector called?
plush jungle
the hidden layer vector?
iron basalt
Yes, but if you chose a single letter for it cause math, which letter would you choose?
(Not a trick question)
plush jungle
h
iron basalt
Ok, so now, the output?
plush jungle
y
iron basalt
ok, so y is computed using what as input?
plush jungle
h
iron basalt
and h is computed using what as input?
plush jungle
x
iron basalt
ok, so now you can see that the hidden and the output are two different things, and it's still 1 single network.
plush jungle
but what I'm confused about is that in a normal deep feed forward net, the layers are each passed on into the next
but in an RNN, the hidden state is ht-1
iron basalt
Try reading the link again.
And see how the hidden state is computed.
The hidden state will change over time, and hence the subscript.
plush jungle
I guess one thing that's really tripping me up is I don't know what the hidden state represents. in an image recognition net, each layer is classifying sub patterns in the image
and then further layers are classifying patterns of those patterns
but this RNN is predicting words
and it doesn't have multiple layers
just two, that run concurrently?
iron basalt
The hidden state is an encoded form of the input (and in the case of an RNN, previous inputs too).
plush jungle
iron basalt
The hidden state is an encoded form of the input (and in the case of an RNN, pre...
but in this particular code example, the vocabulary size (input size) is 6, and the hidden size is 256
and concatenating them together creates a tensor of size 262,1
iron basalt
plush jungle
but in this particular code example, the vocabulary size (input size) is 6, and ...
You can choose whatever hidden layer sizes you want.
iron basalt
plush jungle
but in this particular code example, the vocabulary size (input size) is 6, and ...
It's also important to note that in some cases, the hidden state is considered to ALSO be the output of the RECURRENT CELL (y = h), that is, it's to be used by some later part (e.g. classification). It depends where you draw the line, but the important thing is that the hidden state is part of the input back into the cell (it gets kept for later and is updated based on the new input and what it is/was), unlike a feed forward neural network, where you just compute the hidden state, then use it to compute some more stuff, and then throw that hidden state away (when not learning).
thin palm
When dropping a specific column in Pandas how do we adjust the count?
For example if I delete row 46 the pandas data frame will go from 44, 45,47,48, etc.. how do I get those numbers adjusted?
 serene scaffold
thin palm
For example if I delete row 46 the pandas data frame will go from 44, 45,47,48, ...
serene scaffold
thin palm
For example if I delete row 46 the pandas data frame will go from 44, 45,47,48, ...
you're referring to the index? if I remember correctly, even if you drop rows, the index won't be reset unless you reset it intentionally, as there might be dataframes derived from it that depend on the original indexing.
question is, do you actually need it to be reset? is there a practical reason you need that, or are you just put off by the non-consecutive numbers?
thin palm
serene scaffold
question is, do you actually need it to be reset? is there a practical reason yo...
Because that's why when I concat another pandas dataframe there's a NaN towards the bottom
serene scaffold
thin palm
Because that's why when I concat another pandas dataframe there's a NaN towards ...
what two dataframes are you concating? you don't want to just concat any two rows--the index tells you which two rows represent the same thing.
thin palm
serene scaffold
what two dataframes are you concating? you don't want to just concat any two row...
The one hot encoded dataframe and the original dataframe, they need to be of same size rows
I see what you mean though
serene scaffold
thin palm
The one hot encoded dataframe and the original dataframe, they need to be of sam...
that's probably going to be more than I want to get into right now.
thin palm
serene scaffold
that's probably going to be more than I want to get into right now.
fair enough, makes sense though thanks
serene scaffold
I guess the one hot encoding is a numpy array.
one_hot_df = pd.DataFrame(one_hot_array, index=source_df.index)
this assumes that one_hot_array is derived from source_df
this would cause the indices to be the same.
 lapis sequoia
im so fucked
 worldly dawn
lapis sequoia
im so fucked
worldly dawn
lapis sequoia
im so fucked
it's better to share that fact in an off topic channel
lapis sequoia
Trying to build my linear regression model
for this class
due tomorrow at 10:30 am and
I've been working so much i hardly have time to catch up to speed
basically guaranteed to fail at this point.
can anyone help me with this
I just need something remotely acceptable
worldly dawn
lapis sequoia
I just need something remotely acceptable
You have written 8 lines and you still haven't described your problem
serene scaffold
@lapis sequoia you have to give people enough information that they can actually help with your question. I understand that you're in a predicament, but the truth is that details about your circumstances aren't relevant, and in your case, they're distracting you from focusing on making the best of this situation.
lapis sequoia
I’m just struggling to get my code to output what I need to do
I watched all the videos available from my program but nothing
detailed the actual code
I understand I need to split my data gram into a training set and testing set - I know I need to avoid overfitting or underfitting the model
I was hoping watching the videos tonight would help since I finally had time to watch them but it had nothing to do with the actual coding and everything to do w the concepts
anyways I’m going to try and get like 3 hrs of sleep bc I have tomorrow off but it’s due at 11am my time. I’m just too burnt out to continue right now.
 wicked grove
hello, i did this after model.evaluate ```py
print(" generate predictions ")
predictions = model2.predict(x_test)
print(predictions)
print("predictions shape:",predictions.shape)
or how can i use these predictions to improve the model
[[5.6149113e-01 8.4923755e-04 4.3765956e-01]
 [4.2210612e-01 7.7323330e-04 5.7712066e-01]
 [0.0000000e+00 1.0000000e+00 0.0000000e+00]
 ...
 [6.1014265e-01 6.2321435e-04 3.8923416e-01]
 [9.0939850e-01 3.8023779e-04 9.0221383e-02]
 [1.0643599e-31 1.0000000e+00 1.9610209e-31]]
predictions shape: (1017, 3)```@odd meteor can you please help me out in evaluating the model
 odd meteor
wicked grove
<@519319496868233227> can you please help me out in evaluating the model
odd meteor
wicked grove
<@519319496868233227> can you please help me out in evaluating the model
I'm afraid I can't be of help at this time. I'm busy in the office now.
You can evaluate your model by using the appropriate metric to guage your model performance on train set vs holdout set.
 somber prism
can someone explain me what is from_logits in every loss function in keras
 bold timber
What is the meaning of 5 in the Poisson?

 hollow sentinel
serene scaffold
<@456226577798135808> you have to give people enough information that they can a...
hollow sentinel
serene scaffold
<@456226577798135808> you have to give people enough information that they can a...
stel you are the best i love spyder
so so so much better than jupyter notebook
 safe elk
hollow sentinel
stel you are the best i love spyder
safe elk
hollow sentinel
stel you are the best i love spyder
Yeah I also prefer spyder
hollow sentinel
it looks so cool too
and i made the text size a bit bigger bc my eyes are getting meh
jupyter notebook is sucky in comparison
the syntax highlighting makes my errors much easier to catch
i would say my productivity is a lot higher
wicked grove
odd meteor
I'm afraid I can't be of help at this time. I'm busy in the office now.
You can...
alrightt i will try it
serene scaffold
@hollow sentinel glad it's working out for you :D
hollow sentinel
serene scaffold
<@567030124306759710> glad it's working out for you :D
literally saving so much of my time
 wicked grove
serene scaffold
<@567030124306759710> glad it's working out for you :D
wicked grove
serene scaffold
<@567030124306759710> glad it's working out for you :D
hello, this the result from model.predict ```[2 2 1 0 0 0 2 0 1 2 0 1 2 0 0 0 0 1 2 2 2 0 0 1 2 1 1 1 1 0 2 0 2 1 2 2 0
1 0 2 2 0 0 0 0 1 2 1 1 0]
[0 2 1 2 0 2 2 0 1 2 0 1 0 0 0 0 0 1 0 0 2 2 0 1 0 1 1 1 1 0 2 2 0 1 2 0 0
1 0 2 0 0 2 0 0 1 2 1 1 2]
Hello gentlemen
lapis sequoia
serene scaffold
<@567030124306759710> glad it's working out for you :D
Hey Stelercus, So.... I've managed to split my training set and testing sets
I've got 20% of my data accomodating for the testing set. And i removed all the null values prior
My last challenge here is to Create the plotting for the regression model, and im unsure where to start
wicked grove
lapis sequoia
My last challenge here is to Create the plotting for the regression model, and i...
You can try using matplotlib?
 wicked grove
Ah okay ,you can follow this ?

scikit-learn
The example below uses only the first feature of the diabetes dataset, in order to illustrate the data points within the two-dimensional plot. The straight line can be seen in the plot, showing how...
wicked grove
Create the regression model
Model= linear_model.LinearRegression
wicked grove
Then use model.fit(x_train,y_train)
lapis sequoia
ahhh
Im a bit stumped on these lines
regr.fit(diabetes_X_train, diabetes_y_train) ```how would i put my info into this
oh i see
regr.fit(x_train, y_train) ```fatass error
alueError: could not convert string to float: 'Ford Endeavour 3.2 Titanium AT 4X4'
can i not use
x=df.drop('Price',axis=1) ```to intoduce other dropped values in there for my x ?
things that are giving me issues ?
wicked grove
Hmm i think you have to do encoding before the fit
For the y_train
One min what are your labels??
wicked grove
lapis sequoia
alueError: could not convert string to float: 'Ford Endeavour 3.2 Titanium AT 4X...
Can you show the entire error
 arctic wedgeBOT
Hey @lapis sequoia!
You either uploaded a .txt file or entered a message that was too long. Please use our paste bin instead.
lapis sequoia
its huge
wicked grove
Ohh
lapis sequoia
ValueError Traceback (most recent call last)
/var/folders/lh/z0j9gb155nnfmny85hnsq34r0000gn/T/ipykernel_16605/1990009532.py in <module>
----> 1 regr.fit(x_train, y_train)
~/opt/anaconda3/lib/python3.9/site-packages/sklearn/linear_model/_base.py in fit(self, X, y, sample_weight)
516 accept_sparse = False if self.positive else ['csr', 'csc', 'coo']
517
--> 518 X, y = self._validate_data(X, y, accept_sparse=accept_sparse,
519 y_numeric=True, multi_output=True)
520
~/opt/anaconda3/lib/python3.9/site-packages/sklearn/base.py in _validate_data(self, X, y, reset, validate_separately, **check_params)
431 y = check_array(y, **check_y_params)
432 else:
--> 433 X, y = check_X_y(X, y, **check_params)
434 out = X, y
435
/opt/anaconda3/lib/python3.9/site-packages/sklearn/utils/validation.py in inner_f(*args, **kwargs)
61 extra_args = len(args) - len(all_args)
62 if extra_args <= 0:
---> 63 return f(*args, **kwargs)
64
65 # extra_args > 0
~/opt/anaconda3/lib/python3.9/site-packages/sklearn/utils/validation.py in check_X_y(X, y, accept_sparse, accept_large_sparse, dtype, order, copy, force_all_finite, ensure_2d, allow_nd, multi_output, ensure_min_samples, ensure_min_features, y_numeric, estimator)
869 raise ValueError("y cannot be None")
870
--> 871 X = check_array(X, accept_sparse=accept_sparse,
872 accept_large_sparse=accept_large_sparse,
873 dtype=dtype, order=order, copy=copy,
~/opt/anaconda3/lib/python3.9/site-packages/sklearn/utils/validation.py in inner_f(*args, **kwargs)
61 extra_args = len(args) - len(all_args)
62 if extra_args <= 0:
---> 63 return f(*args, **kwargs)
64
65 # extra_args > 0
~/opt/anaconda3/lib/python3.9/site-packages/sklearn/utils/validation.py in check_array(array, accept_sparse, accept_large_sparse, dtype, order, copy, force_all_finite, ensure_2d, allow_nd, ensure_min_samples, ensure_min_features, estimator)
671 array = array.astype(dtype, casting="unsafe", copy=False)
672 else:
--> 673 array = np.asarray(array, order=order, dtype=dtype)
674 except ComplexWarning as complex_warning:
675 raise ValueError("Complex data not supported\n"
~/opt/anaconda3/lib/python3.9/site-packages/numpy/core/_asarray.py in asarray(a, dtype, order, like)
100 return _asarray_with_like(a, dtype=dtype, order=order, like=like)
101
--> 102 return array(a, dtype, copy=False, order=order)
103
104
~/opt/anaconda3/lib/python3.9/site-packages/pandas/core/generic.py in array(self, dtype)
1991
1992 def array(self, dtype: NpDtype | None = None) -> np.ndarray:
-> 1993 return np.asarray(self._values, dtype=dtype)
1994
1995 def array_wrap(
~/opt/anaconda3/lib/python3.9/site-packages/numpy/core/_asarray.py in asarray(a, dtype, order, like)
100 return _asarray_with_like(a, dtype=dtype, order=order, like=like)
101
--> 102 return array(a, dtype, copy=False, order=order)
103
104
ValueError: could not convert string to float: 'Volkswagen Jetta 2013-2015 2.0L TDI Highline AT'
literally a nightmare
serene scaffold
@wicked grove @lapis sequoia I'm not always available. please direct your questions to the channel in general.
@lapis sequoia I can show you how to plot the data that is in a dataframe, but I don't look at screenshots of dataframes; I'll only accept df.head().to_dict('list') as text.
lapis sequoia
'S.No.': [0, 1, 2, 3, 4],
 'Name': ['Maruti Wagon R LXI CNG',
  'Hyundai Creta 1.6 CRDi SX Option',
  'Honda Jazz V',
  'Maruti Ertiga VDI',
  'Audi A4 New 2.0 TDI Multitronic'],
 'Location': ['Mumbai', 'Pune', 'Chennai', 'Chennai', 'Coimbatore'],
 'Year': [2010, 2015, 2011, 2012, 2013],
 'Kilometers_Driven': [72000, 41000, 46000, 87000, 40670],
 'Fuel_Type': ['CNG', 'Diesel', 'Petrol', 'Diesel', 'Diesel'],
 'Transmission': ['Manual', 'Manual', 'Manual', 'Manual', 'Automatic'],
 'Owner_Type': ['First', 'First', 'First', 'First', 'Second'],
 'Mileage': ['26.6 km/kg',
  '19.67 kmpl',
  '18.2 kmpl',
  '20.77 kmpl',
  '15.2 kmpl'],
 'Engine': ['998 CC', '1582 CC', '1199 CC', '1248 CC', '1968 CC'],
 'Power': ['58.16 bhp', '126.2 bhp', '88.7 bhp', '88.76 bhp', '140.8 bhp'],
 'Seats': [5.0, 5.0, 5.0, 7.0, 5.0],
 'New_Price': [5.51, 16.06, 8.61, 11.27, 53.14],
 'Price': [1.75, 12.5, 4.5, 6.0, 17.74]}
great. what kind of plot do you want, and which are your x and y?
lapis sequoia
y=df.Price
x=df.drop('Price',axis=1)
x_train,x_test,y_train,y_test=train_test_split(x,y,test_size=0.2)
x_train.head() ```let's back up a bit: what kind of figure do you want again? a scatterplot or what?
wicked grove
lapis sequoia
can i not use
I dont think you can send all the strings as x_train to the .fit
lapis sequoia
just trying to use the features to predict used car prices
scatter plot w a line of best fit
avoiding underfitting or overfitting
with an rsquare score
honestly im not even worried about nailing this project i just want to turn something in that shows i tried
final boss is plotting
serene scaffold
okay, so let's start with the scatterplot. what do you want your x axis and y axis to mean?
lapis sequoia
I was thinking Y for price since its dependent on whatever x would be
is my issue calling all strings into x here?
when i run
regr.fit(x_train, y_train)
i get an error basically saying i cant convert strings to float in the dataframe
serene scaffold
please don't get ahead of the question; I asked what you want the x and y axis to mean. you said you want the y axis to be the price. what about the x axis?
lapis sequoia
Im trying to figure that out. Perhaps the "New_Price"
based on my EDA - first time buyers are likely to spend more so that comparison might not be so valuable
serene scaffold
when you make figures with an x and y axis, what you want to show is how the x value determines the y value.
lapis sequoia
Then i think
since its a model trying to predict used car prices since that market is hot
perhaps the New_price should be x
serene scaffold
I bought a used car recently, so I feel that 
lapis sequoia
I also ran bar graph vizualizations that clearly show
Diesel and electric command higher used prices
Same with first time buyers - diminishing in expenditure as you aproach second time buyers, third, etc
Same with obviously the year the car was made
The new value of a car is regulated where as used is not.
So perhaps predicting a used price based off of the "new_price" would be helpful
So i guess x would be New_Price
serene scaffold
since this is a situation where (new_price, miles_driven) -> used_price, this would probably make more sense for a 3d plot. or two plots; one for each relationship.
lapis sequoia
okay I see where youre coming from
serene scaffold
since at a high level, cars have a value when they're built, and lose value the more you drive them. and then other factors affect the value to a lesser extent.
lapis sequoia
Yeah - and theyre more easily vizualized and sort of obvious in a sense
So... how would i approach this
So id ake a
y = Price
x = new_price model
then a Y = price
x = Mileage?
or something else...?
I have a little under an hour to get something running and i feel so close
serene scaffold

this is just df.plot.scatter('New_Price', 'Price')

and you can guess what the code is to make this one.
serene scaffold
you can adjust the x and y scale to more clearly illustrate the relationship
 serene scaffold
actually I think this is fine
this demonstrates that the relationship is there, generally, but that there are a lot of other factors at play
which is true
!docs pandas.DataFrame.plot.scatter
arctic wedgeBOT
DataFrame.plot.scatter(x, y, s=None, c=None, **kwargs)```
Create a scatter plot with varying marker point size and color.

The coordinates of each point are defined by two dataframe columns and filled circles are used to represent each point. This kind of plot is useful to see complex correlations between two variables. Points could be for instance natural 2D coordinates like longitude and latitude in a map or, in general, any pair of metrics that can be plotted against each other.I guess look into what the kwarg would be to change the axis limits. I don't remember.
 serene scaffold
guess people don't care about gas mileage.
lapis sequoia
So for the sake of turning something in could i focus on Y price x New price
ill leave it in the code and just comment on it
so now that im splitting it
y=df.Price
x=df.drop('Price',axis=1)
would i not need to make that x drop all the other Columns and if so how would i present that
serene scaffold
you don't make x and y variables when you plot stuff with df.plot.
lapis sequoia
Im talking about the regression model
i've split my set into training and testing data
x_train,x_test,y_train,y_test=train_test_split(x,y,test_size=0.2)
x_train.head()
x_train.shape
that yields 4.6k x 183 rows
x_test.shape
oh. well, you can only use numeric features. so you need to clean the columns that have numbers as strings with their units (like Power)
lapis sequoia
Yeah!
serene scaffold
and you need a different way to encode things like Transmission
lapis sequoia
y=df.Price
x=df.drop('Price',axis=1)
you've shown me that code a few times now; it's not enough.
serene scaffold
well, you don't even want that code anyway
lapis sequoia
okay
serene scaffold
In [9]: df.drop('Price',axis=1)
Out[9]:
   S.No.                              Name    Location  Year  Kilometers_Driven Fuel_Type Transmission Owner_Type     Mileage   Engine      Power  Seats  New_Price
0      0            Maruti Wagon R LXI CNG      Mumbai  2010              72000       CNG       Manual      First  26.6 km/kg   998 CC  58.16 bhp    5.0       5.51
1      1  Hyundai Creta 1.6 CRDi SX Option        Pune  2015              41000    Diesel       Manual      First  19.67 kmpl  1582 CC  126.2 bhp    5.0      16.06
2      2                      Honda Jazz V     Chennai  2011              46000    Petrol       Manual      First   18.2 kmpl  1199 CC   88.7 bhp    5.0       8.61
3      3                 Maruti Ertiga VDI     Chennai  2012              87000    Diesel       Manual      First  20.77 kmpl  1248 CC  88.76 bhp    7.0      11.27
4      4   Audi A4 New 2.0 TDI Multitronic  Coimbatore  2013              40670    Diesel    Automatic     Second   15.2 kmpl  1968 CC  140.8 bhp    5.0      53.14
This has tons of shit that the model can't use. Like the name of the car.
serene scaffold
or the location. or strings like '998 CC'
lapis sequoia
which i understand
serene scaffold
okay great, so you see the problem
lapis sequoia
yup
serene scaffold
so for one thing, let's ignore the name column entirely
lapis sequoia
im just frustrated bc the pre recorded lectures have almost no coding shit at all
so conceptually i get whats going on but ahhhh
serene scaffold
"Maruti Wagon R LXI CNG" means nothing to the model.
lapis sequoia
yes exactly
serene scaffold
now the location column. in what way might the location matter, or does it not?
lapis sequoia
I could see that If i could convert location to a float and graph it against price but
I'd rather just get a rudimentary regression fit against price and Newprice so i can turn that in bare bones
or not a float but an Int.
serene scaffold
you want to convert the mileage to ints? not floats?
lapis sequoia
noooo not that
regr.fit(x_train, y_train)
should ideally just be training data for price
and new price
and not all the other noise
regr = linear_model.LinearRegression() is my preceding line
serene scaffold
we still have to clean the data
the thing that goes into the model has to be all numbers.
lapis sequoia
okay...
serene scaffold
In [15]: df['Mileage'].str.extract(r'(\d+\.\d*)').astype(float)
Out[15]:
       0
0  26.60
1  19.67
2  18.20
3  20.77
4  15.20
this will get you the mileage.
see if you can apply this to the other value-unit columns.
lapis sequoia
File "/var/folders/lh/z0j9gb155nnfmny85hnsq34r0000gn/T/ipykernel_16891/1395843460.py", line 2
    Out[15]:
            ^
SyntaxError: invalid syntax
this is from an IPython REPL; you can't copy and paste it directly
df['Mileage'].str.extract(r'(\d+\.\d*)').astype(float) is the code part.
lapis sequoia
OH i see
makes sense i see i see.
I dont understand how i'd implement this
do i just plug in the other columns into that same function
serene scaffold
"implement" and "use" mean different things.
you should make a new dataframe that only has clean columns that you can pass to the fit function.
lapis sequoia
I've only got like
20 minutes to turn this in
pretty sure im fucked. I think im going to submit as far as i got .
And just study more bc thats all i can do .
I appreciate all the help
serene scaffold
In [31]: pd.concat(
    ...:     {
    ...:         'milage': df['Mileage'].str.extract(r'(\d+\.\d*)').astype(float),
    ...:         'power': df['Power'].str.extract(r'(\d+\.\d*)').astype(float),
    ...:         'engine': df['Engine'].str.extract(r'(\d+)').astype(float),
    ...:     },
    ...:     axis=1
    ...: )
Out[31]:
  milage   power  engine
0  26.60   58.16   998.0
1  19.67  126.20  1582.0
2  18.20   88.70  1199.0
3  20.77   88.76  1248.0
4  15.20  140.80  1968.0
sometimes you have to accept that outcome
hollow sentinel
it eez what it eez
dw you will always improve
keep up the dedication and discipline!
lapis sequoia
I paid 3k for this course and i feel so taken advantage of lmfao
Literally i'd rather teach myself at this rate bc The support within the program is abysmal
lapis sequoia
Nope...
hollow sentinel
oh
lapis sequoia
post graduate program in tandem with University of Tx Mccombs School of Business
hollow sentinel
ut austin?
lapis sequoia
ya
hollow sentinel
woah
yep that makes sense
most coding curriculums like to throw you in the deep end
lapis sequoia
I filed a ticket asking for a credit back so i could take the course at a later time.
hollow sentinel
and see if you can float
lapis sequoia
Bc im working my ass off IRL
hollow sentinel
yeah it's a tough life
lapis sequoia
Not a refund just
lapis sequoia
Well unfortunately
About 2 weeks ago i got called to travel for some crunch time projects that
hollow sentinel
did they like jam ml down your throat without the math knowledge behind it?
lapis sequoia
have me spending most of my day busting my ass
Not so much
more like they were like "Yeah no coding experience required we'll teach you" etc etc
lapis sequoia
So during the 1 actual class session we have a week
hollow sentinel
no coding experience required 💀 hands students ml projects
lapis sequoia
Im usually at the warehouse busting my fucking ass
trying to watch the lecture on my phone in zoom
w my airpods
hollow sentinel
well i would recommend you build your coding fundamentals
first
before this
like urgently
hollow sentinel

In this Python Beginner Tutorial, we will start with the basics of how to install and setup Python for Mac and Windows. We will also take a look at the interactive prompt, as well as creating and running our first script. Let's get started.
Mac Install: 1:25
Windows Install: 5:44
Installs Complete: 8:37
Watch the full Python Beginner Series he...
this playlist is nice if you like videos
https://automatetheboringstuff.com/ this is nice if you like books
and i would recommend you get the spyder ide on your computer
lapis sequoia
I might just get a refund and use that pocket cash to help pay to move to the NE
bc they keep fucking making me fly out here for months at a time
lapis sequoia
Im trying to get into the new BI department w my job
hollow sentinel
that's a lot of stuff to learn in a short amt of time
lapis sequoia
Like im tryna get out of where i am now
lapis sequoia
And my job usually isnt this fucked its just that were understaffed so they have me fly from texas to PA like
usually with less than 48 hours notice
lapis sequoia
Its not bad i love the work and what we do.
hollow sentinel
i don't wanna detract from the data science ai subject
lapis sequoia
yeah.
hollow sentinel
and i also gotta go take a walk
but keep it up and use the resources in this server bc they are very helpful
lapis sequoia
Nice side conversation.
I've learned a lot and appreciate all the folks here - sorry for all the bitching i do.
lapis sequoia
I think turning this half baked project in will feel alright bc i know i tried so
itll get this whole self railing im doing off my shoulders
hollow sentinel
don't beat yourself up, you're learning
lapis sequoia
Hopefully the next project I can really knock it out of the park. I just dont want them to assume i dont give a shit
hollow sentinel
give yourself credit
lapis sequoia
That i will try to do
hollow sentinel
good!
lapis sequoia
Hi
I am new to this stuff. I want to learn this stuff. Please suggest me some resources specially for AI programming
 prime hearth
For machine learning it good to learn while getting hands dirty
wicked grove
prime hearth
For machine learning it good to learn while getting hands dirty
Hello, could you please help w this model.predict
 1 0 2 2 0 0 0 0 1 2 1 1 0]
[0 2 1 2 0 2 2 0 1 2 0 1 0 0 0 0 0 1 0 0 2 2 0 1 0 1 1 1 1 0 2 2 0 1 2 0 0
1 0 2 0 0 2 0 0 1 2 1 1 2]``` is there any way to improve the prediction to get the 2s right'Oh sorry I dont know much about bytes but generally to improve accuracy of model requires hyper param tuning or adding regularization and checking which values gave wrong output and outlier removal in some cases
 quiet vault
Does anyone know how I can use to_categorical on a tensorflow dataset?
serene scaffold
@wicked grove please stop directing your questions to specific (but otherwise random) people. I have already explained that you need to direct your questions to the whole channel. Please DM @sonic vapor if you have any questions about this.
wicked grove
prime hearth
Oh sorry I dont know much about bytes but generally to improve accuracy of model...
Thank you so much, no they are not bytes
The first row of 0,1 ,2 are predicted labels and the second row of 0,1,2 are true labels
wicked grove
serene scaffold
<@!696373334119546890> please stop directing your questions to specific (but oth...
Yes im sorry
Got it ,will keep in mind
wicked grove
wicked grove
Thank you so much, no they are not bytes
The first row of 0,1 ,2 are predicted...
The wrong output can be checked with model.evaluate ? But how can i further remove the outliers ( it's 3 class image classification)
serene scaffold
wicked grove
``` model.predict [2 2 1 0 0 0 2 0 1 2 0 1 2 0 0 0 0 1 2 2 2 0 0 1 2 1 1 1 1 0 2...
what is this, exactly? is an array of predictions and an array of expected?
 dire nymph
Hey can anyone give me road map of learning data science with python?
lapis sequoia
Collecting package metadata (current_repodata.json): failed
CondaHTTPError: HTTP 000 CONNECTION FAILED for url https://repo.anaconda.com/pkgs/main/win-64/current_repodata.json
Elapsed: -
An HTTP error occurred when trying to retrieve this URL.
HTTP errors are often intermittent, and a simple retry will get you on your way.
If your current network has https://www.anaconda.com blocked, please file
a support request with your network engineering team.

Anaconda
Anaconda is the birthplace of Python data science. We are a movement of data scientists, data-driven enterprises, and open source communities.
i get this error when trying to update conda
please help
 brave granite
sql and python
i am trying to remove certain row where specific data exist that data is user input
sqlliet3
    email=str(input("Enter your email assosiated with with email subusbsription:"))
    conect=sqlite3.connect("data.db")
    c=conect.cursor()
    c.execute("DELETE FROM customer WHERE emails=email VALUES emails=(")
    conect.commit()
conect.close()```What's up Python gang, I'm doing a machine learning model for foreclosed homes and have lats and longs but I have another columns called zip any idea on how to go about encoding this or if I should just drop it??
 inland latch

I want to drop the rows that have No in the column B
using pandas
Can someone come on VC and help me out?
serene scaffold
!docs pandas.DataFrame.drop
arctic wedgeBOT
DataFrame.drop(labels=None, axis=0, index=None, columns=None, level=None, inplace=False, errors='raise')```
Drop specified labels from rows or columns.

Remove rows or columns by specifying label names and corresponding axis, or by specifying directly index or column names. When using a multi-index, labels on different levels can be removed by specifying the level. See the user guide <advanced.shown\_levels> for more information about the now unused levels.@inland latch see if you can figure it out from that
If not, let me know
Alternatively, it's often easier to select the rows that you do want.
serene scaffold
lapis sequoia
Collecting package metadata (current_repodata.json): failed
CondaHTTPError: HTT...
do you have to use anaconda? nine times out of ten (actually more), you don't.
 tawny wyvern
the accuracy and loss in my keras model aren't changing
import tensorflow as tf
from keras.models import Sequential
from keras.layers import Dense, Dropout, Activation, Flatten, Conv2D, MaxPooling2D
from keras.callbacks import TensorBoard
import pickle
import time
import numpy as np

X = pickle.load(open("X.pickle", "rb"))
y = pickle.load(open("y.pickle", "rb"))

dense_layers = [1, 2, 3]
layer_sizes = [64, 128, 256]
conv_layers = [1, 2, 3]

for dense_layer in dense_layers:
    for layer_size in layer_sizes:
        for conv_layer in conv_layers:
            NAME = f"{conv_layer}-conv-{layer_size}-nodes-{dense_layer}-dense-{time.time()}"
            tensorboard = TensorBoard(log_dir=f'logs/{NAME}')

            model = Sequential()
            model.add(Conv2D(layer_size, (3, 3), input_shape= X.shape[1:]))
            model.add(Activation("relu"))
            model.add(MaxPooling2D(pool_size=(2, 2)))

            for l in range(conv_layer - 1):
                model.add(Conv2D(layer_size, (3, 3), input_shape=X.shape[1:]))
                model.add(Activation("relu"))
                model.add(MaxPooling2D(pool_size=(2, 2)))

            model.add(Flatten())
            for l in range(dense_layer):
                model.add(Dense(layer_size))
                model.add(Activation("relu"))

            model.add(Dropout(0.5))
            model.add(Dense(10))
            model.add(Activation("softmax"))

            model.compile(loss="categorical_crossentropy",
                          optimizer="adam",
                          metrics=['accuracy'])

            model.fit(X, y, batch_size=50, validation_split=0.1, epochs=10, callbacks = [tensorboard])
``` here's the model, I'm using the CIFAR-10 dataset, but loss is stuck at 2.3026 and accuracy is hovering around 0.0975if anyone wants to try it out i can send the data files im using, but as far as I know, there should be some sort of change, when there just isn't
any ideas?
wait something else just happened
loss became "nan"
by the third batch
 desert oar
lapis sequoia
i get this error when trying to update conda
desert oar
lapis sequoia
i get this error when trying to update conda
are you on a school network or other institution? it might be blocked
plush jungle
i'm trying to understand RNNs better, but the this MIT lecture has code like this to calculate the hidden state:

and my code is like this
    def forward(self, x, hidden_state):
        combined = torch.cat((x, hidden_state), 1)
hidden = torch.sigmoid(self.in2hidden(combined))```so in my code, they concatenate the input vector with the hidden_state vector
then they pass that larger vector into a neural net layer (which applies weights and adds a bias)
in the MIT lecture, it looks like they're applying weights to the hidden layer h, then applying weights to the input vector x, and then adding the output together
but these are different operations, aren't they?
wicked grove
serene scaffold
what is this, exactly? is an array of predictions and an array of expected?
Yess!!
serene scaffold
@wicked grove do you know how to read confusion matrices? I made you one
        0   1  2
0      14   0  8
1       0  14  0
2       6   0  8
all the confusion is between 0 and 2. what do those represent?
wicked grove
Iknow how ro read a 2×2 confusion matrix
wicked grove
serene scaffold
all the confusion is between 0 and 2. what do those represent?
Exactlyy!! And idk how to fix that
0 represents healthy eye images
And 2 represents diabetic retinopathy images
serene scaffold
what is 1
wicked grove
1 is glaucoma images
I took the images from this dataset for diabetic retinopathy and normal https://www.kaggle.com/c/diabetic-retinopathy-detection/dataal

Identify signs of diabetic retinopathy in eye images
And kept NO DR as normal
Combined images with labels 2,3,4 and called it DR
wicked grove
serene scaffold
all the confusion is between 0 and 2. what do those represent?
Should i plot this for the entire prediction?
serene scaffold
@wicked grove I don't really know about image classification. might hold out for someone who does
but your question isn't just "how do I fix the 2s". you're trying to reduce confusion between two classes in multi-classification.
wicked grove
serene scaffold
but your question isn't just "how do I fix the 2s". you're trying to reduce conf...
Yeahh
serene scaffold
try asking in #editors-ides if you don't get an answer here.
iron basalt
plush jungle
but these are different operations, aren't they?
>>> a = np.arange(9).reshape((3, 3))
>>> a
array([[0, 1, 2],
       [3, 4, 5],
       [6, 7, 8]])
>>> b = np.arange(9).reshape((3, 3))
>>> b
array([[0, 1, 2],
       [3, 4, 5],
       [6, 7, 8]])
>>> x = np.arange(3)
>>> x
array([0, 1, 2])
>>> h = np.arange(3)
>>> h
array([0, 1, 2])
>>> np.dot(a, x)
array([ 5, 14, 23])
>>> np.dot(b, h)
array([ 5, 14, 23])
>>> np.dot(a, x) + np.dot(b, h)
array([10, 28, 46])
>>> combined = np.concatenate((x, h))
>>> combined
array([0, 1, 2, 0, 1, 2])
>>> w = np.concatenate((a, b), axis=1)
>>> w
array([[0, 1, 2, 0, 1, 2],
       [3, 4, 5, 3, 4, 5],
       [6, 7, 8, 6, 7, 8]])
>>> np.dot(w, combined)
array([10, 28, 46])
>>> np.all((np.dot(a, x) + np.dot(b, h)) == np.dot(w, combined))
True
yes , i need it for a project
lapis sequoia
desert oar
are you on a school network or other institution? it might be blocked
no , my personal laptop
serene scaffold
lapis sequoia
yes , i need it for a project
which dependency requires anaconda?
plush jungle
iron basalt
```py
>>> a = np.arange(9).reshape((3, 3))
>>> a
array([[0, 1, 2],
[3, 4,...
this was enlightening squiggle, thank you for your patience and help as always
quiet vault
training = image_dataset_from_directory(directory='D:\PycharmProjects\SelfDrivingCar\Data\Image Data\Data', labels="inferred",
                                    label_mode="categorical",  shuffle=True, image_size=(size[0], size[1]),
                                    validation_split=0.3, subset="training", seed=163035, batch_size=32, color_mode="grayscale")
Does anyone know why the images look like this when using grayscale?
 plush jungle
quiet vault
```py
training = image_dataset_from_directory(directory='D:\PycharmProjects\Self...
plush jungle
quiet vault
```py
training = image_dataset_from_directory(directory='D:\PycharmProjects\Self...
are you using imshow in matplotlib?
quiet vault
Actually, yes I am
plush jungle
this stackoverflow post suggests that you are actually converting the image to grayscale in cv2, and then matplotlib is interpreting those greyscale values with a colormap
so to change it to actual greyscale, you have to select a greyscale colormap in matplotlib
quiet vault
Makes sense, thanks

 carmine cedar
How do I interpret the following formula?

It is talking about the Bayes Error Rate
quiet vault
iron basalt
https://external-content.duckduckgo.com/iu/?u=https%3A%2F%2Fstuff.mit.edu%2Fafs%...
Yeah
I changed it to gray and it works great
safe elk
wicked grove
And kept NO DR as normal
Combined images with labels 2,3,4 and called it DR
Reasonable if you just want a binary classification for simplicity the other labels maybe subtypes that are useful clinically and hence why they are under their own labels...
wicked grove
safe elk
Reasonable if you just want a binary classification for simplicity the other lab...
yupp!! im doing multi class classification, with 3 classes
safe elk
Do check what the subtypes are thou before folding them into one or the other
wicked grove
labels 0 and 2 are normal and DR ...and that's where the confusion occurs and im unsure how i should go about solving that
wicked grove
safe elk
Do check what the subtypes are thou before folding them into one or the other
yeah i checked them..they are ranked as moderate ,severe and proliferate so i thought they could be combined into 1 class
safe elk
I think it is ok then lol
So they seemed to have made a scoring system for severity
0 to 2 no DR
Above 2 clinically significant DR
wicked grove
safe elk
Above 2 clinically significant DR
Yeahh
I have removed the images which been marked as 1,kept 2,3,4
But ig there's a confusion between 0 and 2
The confusion matrix was plotted for the 1st 20 predictions
safe elk
Show the matrix then might be interesting
 hollow silo
can someone help me with this numpy problem - its pretty simple.
import numpy as np
a = np.random.rand(2,3,3)
b = np.random.rand(2,3,3)
c = a.dot(b)
I am struggling to understand how the shape of c is (2,3,2,3)
wicked grove
safe elk
Show the matrix then might be interesting
i tried plotting but i get this
 [  0 135   0]
[ 57 0 113]]```so basically the confusion only lies between 0 and 2?
iron basalt
hollow silo
can someone help me with this numpy problem - its pretty simple.
```
import nu...
dot does the sum product of the last axis of the first argument and the second to last of the second argument.
wicked grove
wicked grove
so basically the confusion only lies between 0 and 2?
is this due to the different preprocessing techniques i used for the 3 classes?
 mint quail
The underwater robot must autonomously find the red area and the robot must be precisely positioned within the area. How do you think I should proceed?
lapis sequoia
guys im new about this daya science and i only know numpy, pandas, matplotlib, and seaborn...
can you guys recommend any tips on learning data science? like where should beginners will start to learn data science?
like from beginner to complex and cool stuffs?
 formal lava
Is GNU Octave a good programming enviroment?
 minor pine
lapis sequoia
guys im new about this daya science and i only know numpy, pandas, matplotlib, a...
minor pine
lapis sequoia
guys im new about this daya science and i only know numpy, pandas, matplotlib, a...
I've found coursera is a great place for literally any programming related content
Right now they're also offering a 7 day free trial for their coursera plus program (credit card required sadly) but I think it's a great offer. You pay a monthly fee and you can get as many Coursera Plus certificates as you want for no additional cost
 deft basalt
There's a graph of what I'm getting
hollow sentinel
hey, does anyone know how to multi-line comment with the spyder ide on a mac?
figured it out, nvm
 low spear
how to use hdf5 weights as a model?
 safe elk
wicked grove
```[[144 0 60]
[ 0 135 0]
[ 57 0 113]]```
safe elk
wicked grove
```[[144 0 60]
[ 0 135 0]
[ 57 0 113]]```
0 and 2 are both normal cases and maybe too alike leading to the results
wicked grove
So 0 is normal and 2 indicates DR
But yeah i used clahe for 1 and normalization as preprocessing for 0 and 2
and 0 and 2 are from the same dataset whereas 1 has been combined from various datasets
 wicked grove
safe elk
Could be imbalance
wicked grove
safe elk
Could be imbalance
Imbalance? There's 1200 images for each class
wicked grove
safe elk
https://towardsdatascience.com/4-ways-to-improve-class-imbalance-for-image-data-...
Thank you i will check it out
wicked grove
safe elk
Could be imbalance
Are the same preprocessing techniques required for all the classes??
safe elk
Not necessarily but the preprocessing techniques could have some impact and introduce some artifacts. I think balance can be an issue thou. If you merge two datasets then that doubles the count in that merged class than in the unmerged classes
Unless you randomly select perhaps equal portions from the classes to be merged and make it similar in count to the other classes
wicked grove
safe elk
Not necessarily but the preprocessing techniques could have some impact and intr...
Cause now when i applied clahe to all images the accuracy reduces drastically to 33%
wicked grove
safe elk
Unless you randomly select perhaps equal portions from the classes to be merged ...
Yupp,all are similar in count
 tidal bough
It looks like you're drawing it on the frame, but I don't see you showing that frame in any way
oh, nevermind, I see the imshow now
but you're showing it right after reading the frame, before you do recognition or draw the rectangle.
 ionic palm
In tensorflow, I got 3 locations [ location id, location x, location y]
[
['a',0,0],
['b',3,0],
['c',0,4]
]
I want shortest route distance to go through all locations so output would be the order to go between them
['c','a','b']
To train tensorflow model, what convolution should i use? 2d, 3d or 4d?
 modest goblet
ionic palm
In tensorflow, I got 3 locations [ location id, location x, location y]
```
[
['...
modest goblet
ionic palm
In tensorflow, I got 3 locations [ location id, location x, location y]
```
[
['...
3d
ionic palm
Thanks, i will stuck in figuring what shape they will be
quiet vault
Definition of overfitting

 urban ore
i wanted to ask whats the difference between a dataset and a training set
serene scaffold
urban ore
i wanted to ask whats the difference between a dataset and a training set
a dataset can be used for training or evaluation. the training set is the subset of the dataset that is used for adjusting the algorithm.
whereas the evaluation/test set is used to measure whether or not the algorithm works correctly.
formal lava
Is GNU Octave a good programming enviroment?
urban ore
serene scaffold
whereas the evaluation/test set is used to measure whether or not the algorithm ...
Great I had a course where a guy used a dataset as well as training set and test set so I got a bit confused thanks for helping me
 wooden cosmos
Hi, i'm trying to teach a neural net to predict winners of a competition. The idea is to make multiple forward passes, compute probabilities for each player using softmax, compute the loss only for the winner using -log(probabilities[winner_position]) as a loss function and then propagate back the error. The problem is, that my gradients are empty : they are just all equal to None. Could someone tell me what is wrong with my code ?
#data
X = []
Y =  np.array([])
for i in range(10000):
    N = np.random.randint(8,15)
    M = 12
    race = np.random.rand(N, M)
    WIN_INDEX = np.random.randint(0,N-1)
    race[WIN_INDEX][0]=race[WIN_INDEX][0]*4
    race[WIN_INDEX][1]=race[WIN_INDEX][1]*5
    race[WIN_INDEX][2]= -race[WIN_INDEX][1]*3
    X.append(race) # multiple feature vectors
    Y=np.append(Y,WIN_INDEX) # Y = position of the winning vector

arr = np.empty(10000,object)
arr[:] = X
X = arr


#test train split
x_test = X[-5000:]
y_test = Y[-5000:]
x_train = X[:-5000]
y_train = Y[:-5000]
import tensorflow as tf
from tensorflow import keras
from tensorflow.keras import layers
import numpy as np

#model
inputs = keras.Input(shape=(12,), name="features")
x1 = layers.Dense(6, activation="relu")(inputs)
x2 = layers.Dense(3, activation="relu")(x1)
outputs = layers.Dense(1, name="rating")(x2)
model = keras.Model(inputs=inputs, outputs=outputs)


#custom loss function
def loss(x):
    return -tf.keras.backend.log(x)


loss_fn = loss
optimizer = keras.optimizers.SGD(learning_rate=1e-3)

#Training
epochs = 2
for epoch in range(epochs):
    print("\nStart of epoch %d" % (epoch,))


    for x_batch_train, y_batch_train in zip(x_train,y_train):


        x_batch_train =tf.convert_to_tensor(x_batch_train)# tf.Variable(x_batch_train)  #tf.convert_to_tensor(x_batch_train)
        with tf.GradientTape() as tape:

            tape.watch(x_batch_train)
            results = model(x_batch_train,training=True) # as so we make multiple forward passes

            probabilities =tf.keras.activations.softmax(x, axis= 0) #computing probabilities

            loss_value = loss_fn(probabilities[int(y_batch_train)])#optimising only for one pass (optimizing only the winner)


        grads = tape.gradient(loss_value, model.trainable_weights) # this returns a list of None


        optimizer.apply_gradients(zip(grads, model.trainable_weights))

        # Log every 200 batches.
        if step % 200 == 0:
            print(
                "Training loss (for one batch) at step %d: %.4f"
                % (step, float(loss_value))
            )
            print("Seen so far: %s samples" % ((step + 1) * batch_size))
Any tips to make the learning more stable?
 tawny wyvern
hey so i'm trying to run my neural network model, and have it inside a few loops to try and test different parameters, but it gives this error by about the second or third run, it changes everytime i run it
Allocator (GPU_0_bfc) ran out of memory trying to allocate tensorflow
https://www.toptal.com/developers/hastebin/rimidiwoki.py here's the code
Hastebin is a free web-based pastebin service for storing and sharing text and code snippets with anyone. Get started now.
note, it seemed to have happened when it added a third Conv2D layer, but when i do the same parameters but without having them contained within loops, it runs without any problems
quiet vault
You need more vram
tawny wyvern
i have all of it allocated, and when i check task manager, it doesn't seem to be using much at all
and even when i go to the biggest possible size i set the neural network to be able to go, with the most number of layers and nodes per layers, it works just fine
but only when it's looped does it start having problems, so why is that?
arctic wedgeBOT
:incoming_envelope: :ok_hand: applied mute to @fierce wadi until <t:1644194335:f> (9 minutes and 59 seconds) (reason: duplicates rule: sent 4 duplicated messages in 10s).
 molten magnet
sup everyone,
anyone know their way around object detection w/ keras by any chance ?
i'm working on images where the Ys can sometimes be 0 bounding boxes, sometimes 5 or 6.
Not sure what the input / output format of the model would be in this situation, like how to make a sequential model based on this.
for example Ys can be :
[] or [[20, 45, 30, 98], [50, 12, 60, 43]
 pastel valley
hello
i used ImageDataGenerator() to generate augmented images but some of em got this weird thing

is it ok for the model or there is something wrong on what i did?
 magic dune
hello does anyone have some good articles on linear Regression?
 tame latch
Hi guys,
Could you please let me know the best certification for python with pandas ..
 lavish zinc
What is file with .config extension in checkpoint directory of tensorflow model? I want to convert that saved model to tflite model but my project doesn't have .config file, how to create it??
 glass minnow
in simple term can someone explain what is homoscedasticity
glass minnow
magic dune
hello does anyone have some good articles on linear Regression?
you can check out statquest video on linear regression
 agile cobalt
a situation in which the variance of the dependent variable is the same for all the data
Simply put, homoscedasticity means “having the same scatter.” For it to exist in a set of data, the points must be about the same distance from the line, as shown in the picture above. The opposite is heteroscedasticity (“different scatter”), where points are at widely varying distances from the regression line.
If the ratio of the largest variance to the smallest variance is 1.5 or below, the data is homoscedastic.
 white hinge
hey guys, i have a sentiment analysis using logistic regression homework
I have the dataset, but I don't know how my input should be shaped
I am able to find frequency of words
but what should my input be?
sample of the dataset looks like this:
1 a stirring , funny and finally transporting re-imagining of beauty and the beast and 1930s horror films
0 apparently reassembled from the cutting-room floor of any given daytime soap .
i have been working on it for 7 hours now, so the slightest hint or help will be highly appreciated
urban ore
magic dune
hello does anyone have some good articles on linear Regression?
https://realpython.com/linear-regression-in-python/
https://www.kdnuggets.com/2019/03/beginners-guide-linear-regression-python-scikit-learn.html
In this step-by-step tutorial, you'll get started with linear regression in Python. Linear regression is one of the fundamental statistical and machine learning techniques, and Python is a popular choice for machine learning.

KDnuggets
What linear regression is and how it can be implemented for both two variables and multiple variables using Scikit-Learn, which is one of the most popular machine learning libraries for Python.
arctic wedgeBOT
:incoming_envelope: :ok_hand: applied mute to @tall fox until <t:1644229287:f> (9 minutes and 59 seconds) (reason: duplicates rule: sent 4 duplicated messages in 10s).
urban ore
white hinge
hey guys, i have a sentiment analysis using logistic regression homework
1 means a positive and 0 means negative ig this is a SST2 dataset for movie reviews and ig you should test on test data and get your results
white hinge
i am aware of that
but
the professor has already implement a feature selection, and we are using it
it is returning a Counter object
but I don't know how I can use that object as x (input)
glass minnow
Can someone explain why R square value increase with more number of variable ?
 brazen spire
How to create a custom activation function from scratch in pytorch?
i want to create a square signal like activation function
 urban ore
brazen spire
How to create a custom activation function from scratch in pytorch?
urban ore
brazen spire
How to create a custom activation function from scratch in pytorch?
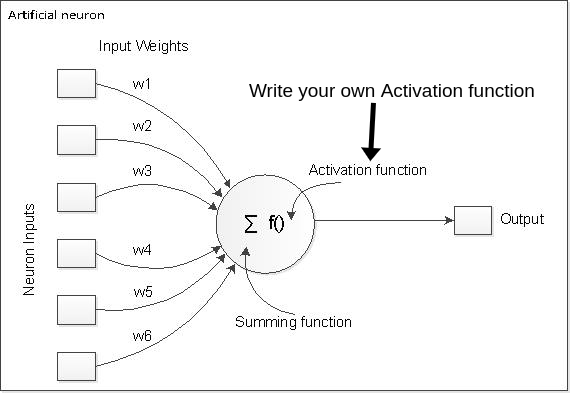
Medium
Learn to write Custom activation function in TensorFlow as it is an essential building block for neural network’s performance and speed.
ig you must make create a math function for the same
y = 1 if x<1
y =0 if x>= 1
something like that
ionic palm
Where can I ask tensorflow.js questions?
 long zephyr
Medium
Data science is the domain of study that deals with vast volumes of data using modern tools and techniques to find unseen patterns, derive…
lapis sequoia
am broke oof
 acoustic forge
I have a model that summarises a sequence.
Now I would like to have a model that essentially rewrite that sequence and add word(s). So if I have the following summarisation
Buy your dracula costumes here, we have the best dracula costumes in the world, made from the best materials one could hope for -> And I would like a model to rewrite the sentence to also include the word "Vampire" somewhere, what would this task be?
Is it text generation?
 glossy shadow
hello guys, so I was working with ML with Tensorflow ang some error like .................... TypeError: Value passed to parameter 'x' has DataType int32 not in list of allowed values: bfloat16, float16, float32, float64, complex64, complex128 ..................... so how can I define x as float32 for a session
 reef dock
Hi
{'ABC': [['AP'], ['AP'], ['tbd'], ['AP', 'AP'], ['xyz']],
 'Index': [[1], [2], [3], [4, 4], [5]]}
I have this sample df where my goal is to have only one element per row, so I want to basically have the ['AP', 'AP'] turn to ['AP']['AP']. The same would apply to the [4, 4] in the Index column.
How can I do this with a for loop? I can make it so it takes the first value of the list element however I want to have the other element there in the next row.
lapis sequoia
Hi ! I use the following code in order to get the city the iss is flying over: ```py
import reverse_geocoder
from orbit import ISS
coordinates = ISS.coordinates()
coordinate_pair = (
coordinates.latitude.degrees,
coordinates.longitude.degrees)
location = reverse_geocoder.search(coordinate_pair)
print(location)
This is what i get ```
[OrderedDict([
    ('lat', '42.82701'),
    ('lon', '-75.54462'),
    ('name', 'Hamilton'),
    ('admin1', 'New York'),
    ('admin2', 'Madison County'),
    ('cc', 'US')
])]
What kind of data is this ? and how can i for example print out only name and get Hamilton
lapis sequoia
lapis sequoia
Hi ! I use the following code in order to get the city the iss is flying over: `...
location['name']
anybody knows why numpy is returning me an array of list ? 🤔 🤔
 agile cobalt
inconsistent shape I think?
acoustic forge
I have a model that summarises a sequence.
Now I would like to have a model that essentially rewrite that sequence and add word(s). So if I have the following summarisation
Buy your dracula costumes here, we have the best dracula costumes in the world, made from the best materials one could hope for -> And I would like a model to rewrite the sentence to also include the word "Vampire" somewhere, what would this task be?
Is it text generation?
lapis sequoia
agile cobalt
inconsistent shape I think?
yes, so how do you handle weights for multiple layers of varying size?
for example, I have 1 layer of 2 neurons followed by an output layer of 1 neuron
therefore my weights and biases array are going to have different sizes
 slender kestrel
 magic dune
urban ore
https://realpython.com/linear-regression-in-python/
https://www.kdnuggets.com/20...
magic dune
urban ore
https://realpython.com/linear-regression-in-python/
https://www.kdnuggets.com/20...
thx
slender kestrel
slender kestrel
can anyone explain what the decoded_review part is doing and also why did you offset the indices like if "i" starts from 0 then i-3 will be -3 it all just dont make sense to like how it working
arctic wedgeBOT
:incoming_envelope: :ok_hand: applied mute to @fathom scroll until <t:1644248932:f> (9 minutes and 59 seconds) (reason: duplicates rule: sent 4 duplicated messages in 10s).
 crude hemlock
theoritical question, would it be possible to use a recurring neural network to split or remove vocals from songs like an instrumental song generator?
 river maple
i want to count the number of ducks in this image

how would i do that
i dont know anything about AI
 mild dirge
There seems to be multiple methods. But this image loops pretty complicated for counting objects in the image. The ducks aren't separated, they overlap.
I would suggest googling "counting objcts in an image python ai" and see what comes up
find a paper that has successfully done it and try and use that method
river maple
okay thanks for the help
urban ore
river maple
can it count overlapped objects too?
i guess for this you can train for duck's faces?
which might work
desert oar
river maple
does tensorflow do the work here?
tensorflow itself is just a framework for building machine learning models. it's like numpy or pandas. it's too "low level" to do what you are asking for
you'd need to train a model to detect ducks, or maybe you can try using a pre-existing object detection / image segmentation model and hope that it recognizes individual duck faces
or even try using opencv to heuristically segment the duck faces. e.g. try counting yellow beaks
you should be able to use opencv to isolate each yellow beak from the white/green stuff in the rest of the image
not every machine learning problem requires deep learning
urban ore
desert oar
you should be able to use opencv to isolate each yellow beak from the white/gree...
yes but ig that only works for this particular image and not all the images which have multiple ducks
desert oar
urban ore
yes but ig that only works for this particular image and not all the images whic...
sure, but they only asked about "this image" 🙂
even so, yellow beaks and white heads probably stand out against most backgrounds
urban ore
desert oar
sure, but they only asked about "this image" 🙂
right as well ig i misread it for all images somewhere
urban ore
desert oar
even so, yellow beaks and white heads probably stand out against most background...
but there might be different birds with yellow beaks as well?
desert oar
crude hemlock
theoritical question, would it be possible to use a recurring neural network to ...
removing/isolating vocals is already something you can do with existing software. idk if you need a RNN for it
urban ore
alright ig you are right
desert oar
urban ore
but there might be different birds with yellow beaks as well?
one of the hardest problems in data science and machine learning is making sure that your goals are well-defined 🙂
urban ore
desert oar
one of the hardest problems in data science and machine learning is making sure ...
right 😂
ig you always learn with the model in ml
 eager imp

MIT Researchers Introduce a Machine Learning Technique that can Automatically Describe the Roles of Individual Neurons in a Neural Network with Natural Language
Could that work with a 'meta-NN' looking at the primary NN and describing those correlations automatically?
desert oar
eager imp
https://www.marktechpost.com/2022/02/06/mit-researchers-introduce-a-machine-lear...
i'm very very skeptical of this
brazen spire
urban ore
https://medium.com/@chinesh4/custom-activation-function-in-tensorflow-for-deep-n...
i did
activation = lambda x: torch.where(x > 0, 1, 0)

worked with sine
but not this one

ok fixed
wicked grove
Can someone please tell me how to understand sensitivity for multi class
Sensitivity for binary classification is the percentage of images that are truely positive
But i cant understand what is positive in multi class
serene scaffold
@wicked grove sensitivity is the same thing as "recall". "recall" is used more often, I think.
it's not too different than what it is in binary classification.

every instance that isn't labeled correctly counts against the recall score for its class, regardless of which class it was classified as.
wicked grove
serene scaffold
every instance that isn't labeled correctly counts against the recall score *for...
Can you please tell me an example im kinda confused
 wicked grove
serene scaffold
whereas it counts against the precision score *for the class it was labeled as*
wicked grove
serene scaffold
whereas it counts against the precision score *for the class it was labeled as*
Okay so if i have a sensitivity of 77 for a class it means that 77% of the data is being predicted correctly ? And that is the same for recall?
serene scaffold
wicked grove
Okay so if i have a sensitivity of 77 for a class it means that 77% of the data ...
it's not as simple as "the data is being predicted correctly". these different metrics, like precision, recall/sensitivity, and specificity, give you different views into how the model is performing
there isn't always one metric that tells you in absolute terms how "correct" the model is on a scale of 0 to 1.
wicked grove
serene scaffold
there isn't always one metric that tells you in absolute terms how "correct" the...
Yess okayy
But when considering only sensitivity
What does it exactly tell about the model?
serene scaffold
wicked grove
What does it exactly tell about the model?
the sensitivity (which is usually called "recall") tells you if the model "finds" every instance of a given class, regardless of whether it mislabels other instances as being in that class
if you have three classes named A, B, and C, and the model says that every single instance belongs to A, the recall score for A will be 100%
because it "found" every instance of A
but the model is still hot garbage.
brazen spire
Anyone encountered this error before

"One of the differentiated Tensors appears to not have been used in the graph. Set allow_unused=True if this is the desired behavior."
serene scaffold
brazen spire
"One of the differentiated Tensors appears to not have been used in the graph. S...
I've never seen that error message before. Try copying that part of the message into Google and see if you find anything relevant.
wicked grove
serene scaffold
but the model is still hot garbage.
Ohhh I'm getting it now
Thank you so much
So with just sensitivity i won't be able to tell much about the model w/o the confusion matrix if I'm not wrong?
Like if the model gives 77,57,99,81 as the sensitives
For 4 classes
serene scaffold
wicked grove
So with just sensitivity i won't be able to tell much about the model w/o the co...
you usually use recall along with precision. in the example where every instance is classified as A, the precision score for A would be very low, as each mislabeled A and B would count against it.
serene scaffold
wicked grove
Like if the model gives 77,57,99,81 as the sensitives
This is a frequency in the confusion matrix?
("frequency" is "instance count")
wicked grove
serene scaffold
you usually use recall along with precision. in the example where every instance...
Ohhh
wicked grove
serene scaffold
("frequency" is "instance count")
I'm guessing it was given in a paper as sensitivity and a separate table for specificity
They haven't plotted the confusion matrix
wicked grove
serene scaffold
In this 50,35, 15 are the recall values?
serene scaffold
wicked grove
In this 50,35, 15 are the recall values?
Not possible. Recall is always between 0 and 1. It's a metric, not a count.
Looks like those three integers are the number of instances of each class @wicked grove
 native rune
can anyone suggest me an approach or share resources on how to do Image/Signal Classification using DNN architecture?
I searched for so long on internet, but there are only resources for classification using CNN
thin palm
What's up Python gang, can anyone help with me visualizing a Pandas dataframe for Normal Distribution purposes? That way I can understand which scaling method to use for my ML model
serene scaffold
thin palm
What's up Python gang, can anyone help with me visualizing a Pandas dataframe fo...
Do you mean that you want to plot the data that's in a dataframe like this?
 thin palm
hmm, not exactly. I'm trying to work with Feature Scaling and understand that each "Scaler" requires different criteria's such as data being normalized or it's not normalized. And i'm trying to understand if I have to look at feature / column of our dataset to figure this out or if there's an easier approach to this. Does that make sense?
thin palm
serene scaffold
Do you mean that you want to plot the data that's in a dataframe like this?
^
serene scaffold
Doesn't sound like something I can help with. Sorry 
thin palm
serene scaffold
Doesn't sound like something I can help with. Sorry <:sad_cat:827636798666309712...
ahh no worries! Maybe I can ask this, when you perform feature scaling any key points you look for / can point me to?
serene scaffold
are you just trying to make it so that every instance of a feature is between 0 and 1, or something like that?
thin palm
serene scaffold
are you just trying to make it so that every instance of a feature is between 0 ...
well I'm trying to understand if I need to do this, I do know for KNN Algorithm (since it's distance) we need feature scaling
but the question becomes which dang scaling do I use! So i'm going through some googling but still unclear since my Stats game is HORRID
serene scaffold
Well, there's a bunch of preprocessing tools here. Maybe one is the one you need: https://scikit-learn.org/stable/modules/classes.html#module-sklearn.preprocessing
scikit-learn
This is the class and function reference of scikit-learn. Please refer to the full user guide for further details, as the class and function raw specifications may not be enough to give full guidel...
thin palm
serene scaffold
Well, there's a bunch of preprocessing tools here. Maybe one is the one you need...
Thank you sir! Will check these out
hollow sentinel
x = np.array([[1,2,3]])
np.swapaxes(x,0,1)
array([[1],
       [2],
       [3]])
i'm confused on how swapaxes works
thin palm
serene scaffold
Well, there's a bunch of preprocessing tools here. Maybe one is the one you need...
Okay actually let me ask you this, is it okay to use different scaling features for each column?? Or does it have to be one universal scaling technique for all the features?
desert oar
thin palm
Okay actually let me ask you this, is it okay to use different scaling features ...
Okay actually let me ask you this, is it okay to use different scaling features for each column
yes
does it have to be one universal scaling technique for all the features
no
as long as it's consistent between train and test, it's ok to do something different for each feature. it's also very important that you don't accidentally use any test data in the feature transformation (e.g. if you need to estimate the sample mean)
 gilded bobcat
Hi all I had a question on calculating MSE, namely that I made a graph where I calculate MSE with different sizes of my training set
and I am noticing that MSE is small, then it will randomly blow up to ~100x the size, then go back to normal for another split size

something like this
idk why
if I rerun with a different seed sometimes itll go away, sometimes itll be there again... I am running a very high dimensional model btw
just curious on insights, is there just one massive outlier that I am sometimes (possibly) training on?
here is a different view where I try doing cross_val_score and _test_train_split with scikitlearn to test differences

super weird
alternatively is there anyway in scikitlearn to show me the dataframe it estimates over to try to find the possible outlier/
mild dirge
having very high dimensional data should probably not matter a lot for this, the MSE is just about the output. So what I had for a machine learning project once, was when trying to estimate recipe rating, is that there was a recipe with a preparation time of 2,147,483,647 instead of 10 or 30 mins, so this is probably the case for you too.
Is your output 1 dimensional?
@gilded bobcat
gilded bobcat
I believe so, 1 dimensional as the Y-variable is a single a scalar?
mild dirge
make a boxplot with outliers
gilded bobcat
I manually interacted variables because I didnt want to interact everything
outliers from the data or from the training data?
mild dirge
Whatever you are getting this weird peaks on, boxplot the desired outputs
gilded bobcat
Ok let me try I am pretty new to python
mild dirge
If it's a list of numbers, just :
import matplotlib.pyplot as plt

plt.boxplot(y)
plt.show()
Where y is the list of desired outputs
gilded bobcat

This is over my y_training data
import seaborn as sns
X_train, X_test, y_train, y_test = train_test_split(X_flexible, Y, test_size=ts)


fig, axes = plt.subplots()
sns.boxplot(x=y_train)
train_test_split randomly splits the data every run iirc
So you might just want to sns.boxplot Y
instead of y_train
To view all data
gilded bobcat
regardless its looking similar
I think theres a horrible mistake on how I made my flexible model
mild dirge
also with Y?
gilded bobcat
 mild dirge
alright, it could have been 1 datapoint, so only checking 1 part of the data wouldn't have cleared it
Yeah lemme think about what else it could be...
gilded bobcat

So 4 columns, the simple is where I run my model with raw regressors, no interactions or polynomials
the 'flex' refers to when I interact things (manually, I worte a large loop to do this)
mild dirge
gilded bobcat
Interacting means you manually multiply different input values or something?
gilded bobcat
cv_score and _split just refer to the way I did it (using cross_val_Score or test_train)
gilded bobcat
mild dirge
Interacting means you manually multiply different input values or something?
Yeah, I literally do this
for exp in ['exp1', 'exp2', 'exp3', 'exp4']:
    for var in X_simple.drop('exp1', axis=1).columns:
        X_flexible[empty] = X_flexible[exp]*X_flexible[var]
        empty = empty + 1
I did this because when I try to do
blah = PolynomialFeatures(...)
itll interact exp1 with exp2, exp2 with exp3, etc.... I didn't want that to occur so I had to write a loop
gilded bobcat
OLS
yeah
I am just following notes from my class, but they did it in R
I believe they have a python script too maybe I should just use that
Would you like to see either?
mild dirge
your model is made from scratch, no tensorflow keras or anything?
gilded bobcat
Unfourtanly I never learn them
I can send you my code, but I am super new to ML and python
scikitlearn is what I kinda know but its polynomial command is way too broad
I might not follow, but I use the LinearRegression command in scikitlearn
I do it all in a massive loop here:
test_mse = pd.DataFrame({
    'mse_cv_score_simple': 0,
    'mse_split_simple': 0,
    'mse_cv_score_flex': 0,
    'mse_split_flex': 0,
    'counter': np.arange(2,52)
})

for cv_num in range(2,52):
        for x_type in [X_simple, X_flexible]:
            add = cross_val_score(LinearRegression(), x_type, Y, scoring='neg_mean_squared_error', cv=KFold(n_splits=cv_num,shuffle=True)).mean()
            name_of_col = "mse_cv_score_"+ x_type.name
            test_mse[name_of_col].loc[cv_num-2] = -add

            ts = 1/cv_num

            X_train, X_test, y_train, y_test = train_test_split(x_type, Y, test_size=ts)
            p = LinearRegression().fit(X_train, y_train)
            y = p.predict(X_test)
            add = mean_squared_error(y_test, y)
            name_of_col = "mse_split_"+x_type.name
            test_mse[name_of_col].loc[cv_num-2] = add
sorry for the mess lol
mild dirge
gilded bobcat
Unfourtanly I never learn them
scikit learn is sklearn 😛
So how many dimensions and how many datapoints do you have?
gilded bobcat
So you can see I was just curious "hey whats the different between these two methods" so I did all of this to test it
~5k datapoints
simple model: 49 var
flexible: ~300?
so its not too crazy
and the other R code and stuff seems to be well behaved so I think I am miscoding something and shit is going way too wild
mild dirge
5k datapoints and 49 predictor variables?
Oh if the other code does seem to behave well than yeah it will probably be some coding error
and not the data
gilded bobcat
yeah I guess my thing is like where did I mess up
I think its two things:
- how I make a categorical variable into dummies
- how I make my flexible model
#Grab outcome
Y = df['lwage']

#Grab vector of covariates, make all categorical variables into dummies
#first drop outcomes & exponential variables
X_dummies = pd.get_dummies(df, columns=['ind2', 'occ2'])
X_simple = X_dummies.drop(['lwage','wage','exp2', 'exp3', 'exp4', 'ind', 'occ'], axis=1)
X_flexible = X_dummies.drop(['ind', 'occ', 'lwage', 'wage'], axis=1)

empty = 0
#Here, interact what we need for X_flexible
for exp in ['exp1', 'exp2', 'exp3', 'exp4']:
    for var in X_simple.drop('exp1', axis=1).columns:
        X_flexible[empty] = X_flexible[exp]*X_flexible[var]
        empty = empty + 1
So X_simple is fine, no crazy spikes
so my thought is that its the loop
mild dirge
Don't see anything super strange I believe, how high can your inputs range?
desert oar
how big are the splits?
i am wondering if you are accidentally generating really small splits somehow
mild dirge
desert oar
i am wondering if you are accidentally generating really small splits somehow
Even if that would be the case, cross val gives the same spikes
And leave-one-out cross validation is a very viable method 😛
desert oar
heh, sorry i missed the full context
desert oar
gilded bobcat
if I rerun with a different seed sometimes itll go away, sometimes itll be there...
i like to take a "stepwise" approach to this kind of thing. start with a very simple model and keep adding stuff until the problem arises
then the last thing you added is a good place to at least start debugging
+1 to pccamel's suggestion to look at the data ranges
mild dirge
It could be that the weight is made pretty big because all training data contained low values for a specific variable, but then in the test data there is a data point with a very big value for that variable, so the output blows up.
But if everything works perfectly in R (which you should probably make sure that it really does and your test wasn't just a lucky fluke) then the problem still might lie somewhere else
And did you normalize your input data?
desert oar
what's on the x axis of this chart? https://cdn.discordapp.com/attachments/366673247892275221/940359860577501204/unknown.png

a different training run?
mild dirge
so the K for k-fold cross val?
gilded bobcat
yes
mild dirge
right
gilded bobcat
3 of them are small, then the last one is like 2131942914281942
mild dirge
did you normalize input data?
gilded bobcat
again its random
I don't believe so
I took raw data and slammed that shit in
no NAs though
 desert oar
gilded bobcat
X axis refers to number of splits
desert oar
gilded bobcat
X axis refers to number of splits
you might want to try re-running several times at each number of splits, with a different seed each time
gilded bobcat
this is the "solutions" in python
mild dirge
Again, one very very large value in your input can cause these spikes
desert oar
mild dirge
Again, one very very large value in your input can cause these spikes
especially for MSE which is squared errors and therefore is sensitive to outliers
i would actually look for an outlier in your target/label variable
something that's 0 or -9999 or 1e-100 or 1e100 or whatever
gilded bobcat
mild dirge
Again, one very very large value in your input can cause these spikes
my thoughts exactly, but I wish I could peer into the dataset where this occurs
mild dirge
gilded bobcat
thats this @desert oar
desert oar
nah
what are the max and min?
also what is the "flex" model? maybe it's just having numerical stability problems and the optimizer fails to converge to a useful result
mild dirge
Are you predicting logwages or wages?
 gilded bobcat
desert oar
also what is the "flex" model? maybe it's just having numerical stability proble...
gilded bobcat
desert oar
also what is the "flex" model? maybe it's just having numerical stability proble...
flex model is interacting all raw regressors (and like 30 dummies for job and inudstry) with experience, experience^2, experience^3, experience^4
I didnt think of that, its just me copying our lesson in R ( I am tring to learn python so am just trying to translate it over)
Basic Model:  X  consists of a set of raw regressors (e.g. gender, experience, education indicators, occupation and industry indicators, regional indicators).
Flexible Model:  X  consists of all raw regressors from the basic model plus occupation and industry indicators, transformations (e.g.,  exp2  and  exp3  ) and additional two-way interactions of polynomial in experience with other regressors. An example of a regressor created through a two-way interaction is experience times the indicator of having a college degree.
from the notebook from class
I really think its how I made the variables for the flexible model
more of a hunch tho
mild dirge
It's probably a single data point (or a few) that has/have a very high value for a dimension that is used in flex and not in simple
and because you don't normalize your data it inflates your output
You should probably remove outliers and then normalize
gilded bobcat
yeah def
That might be out of my coding scope/expertise so far
but curious
if I was to remove outliers what is a perferred method, I am just thinking find any Y that is 2SD above the mean?
then to normalize, demean all X by the average?
mild dirge
The fact that it only happens for certain split sizes is still weird, as it would be used for each k-fold cross validation for testing
gilded bobcat
mild dirge
The fact that it only happens for certain split sizes is still weird, as it woul...
I think it happens just because that bad variable randomally shows up in the training or testing split at random times
mild dirge
k-fold cross val means you test on all data as well
mild dirge
try training on some data, then loop over the rest of data points and check the errof or each, if the error is very high, print the input and output and desired output
That way you can see on what datapoints it happens
mild dirge
mild dirge
try training on some data, then loop over the rest of data points and check the ...
Do this for multiple folds so that you get to try it on all data
gilded bobcat
lemme try
mild dirge
Use squared error*
gilded bobcat
mild dirge
Use squared error*
Something like this?
X_train, X_test, y_train, y_test = train_test_split(X_flexible, Y, test_size=.5)
p = LinearRegression().fit(X_train, y_train)
y_hat = p.predict(X_test)
for X in range(0,len(y_hat)):
    print(Y[X]-y_hat[X])
X_train, X_test, y_train, y_test = train_test_split(X_flexible, Y, test_size=.5)
p = LinearRegression().fit(X_train, y_train)
y_hat = p.predict(X_test)
for i in range(0,len(y_hat)):
    if (y_test[i] - y_hat[i]) ** 2 > 1000:
        print(x_test[i])
        print(y_test[i], y_hat[i])
like this
Changed it*
Using 1000 since your values only go from 0 to 6 ish
so anything above that would be very unexpected
gilded bobcat
Ok here is the situation
im just clicking run over and over
99% time nothing
.5% I get an error
.5% I get a big number
mild dirge
Right but when you get a big number, what is the input


 mild dirge
x[i] should be the input for the linear regression
so not sure why it would be 30k rows
gilded bobcat
its 2575 rows
gilded bobcat
this is flexible, so it has 269 vars
mild dirge
still
gilded bobcat
maybe due to dummy vars?
should we throw in the towel lol
its confusing
I dont even understand why it was 30k rows, how does that even happen
thin palm
desert oar
> Okay actually let me ask you this, is it okay to use different scaling feature...
okay so this makes sense thank you. Final question is once we rescale our X_train and X_test, if we have multiple "Scalers" how can we re assign these values??
thin palm
desert oar
> Okay actually let me ask you this, is it okay to use different scaling feature...
For example:
X_train, X_test, y_train, y_test = train_test_split(X, y, random_state=0, test_size=0.3)
scaler = StandardScaler()
scaler.fit(X_train)
rescaled_X_train = scaler.transform(X_train)
rescaled_X_test = scaler.transform(X_test)
this makes sense because there's one scaler, but what about re assigning these when there's multiple scalers? Does this make sense?
 swift basin
what do you mean by that? like using both standard scaler and minmax scaler for instance?
I just read the other comment, I got it now... you'd have to add the original column names to X_train and X_test as these are arrays and not dataframes, and then use .loc to separate their columns into groups according to the scalers you want to use
and then you merge them back
 violet talon
dumb (?) question, but I can't find this in the docs anywhere... when I do a series[] or dataframe[], what indexing mode is pandas operating in? loc, iloc?
(I think it's loc but can't find anything to confirm that)
serene scaffold
violet talon
dumb (?) question, but I can't find this in the docs anywhere... when I do a `se...
since a series is one-dimensional, subscripting it gives you whichever element is for that key, kind of like a dict. and then a dataframe gives you the column with that name.
it's not the same as loc or iloc.
violet talon
hm, would it be fair to say that series[] is iloc (because you can't really index a series with loc) and dataframe[] is loc?
or is there no relationship at all between the class[] operators and loc/iloc
serene scaffold
I'm not sure why you're trying to force a relationship between the two __getitem__ methods and (i)loc. iloc is strictly for positional indexing, whereas a Series can have any kind of index that Pandas supports.
violet talon
not trying to force anything, I'm debugging something I don't particularly understand (would it be OK to ask a more specific question about that here?) and am trying to get a better picture of how things are getting interpreted
serene scaffold
DataFrame.__getitem__ isn't the same as loc because loc can index by both row and column (starting with row), whereas DataFrame.__getitem__ selects columns.
DataFrame.__getitem__ does allow row-based selection if you pass a boolean series, but it doesn't allow you to select an exact row given its index.
df['foo']  # gives you a Series that is the foo column of df
df[['foo', 'bar']]  # gives you a DataFrame of just the foo and bar columns of df
df[df['foo'] > 3]  # gives you every column, for every row where the foo values is > 3
df.loc["boop"]  # gives you a Series that is the boop row of df, indexed by the column names of df
df.loc["boop", ["bar", "baz"]]  # gives you a Series that is the boop row of df, but only the bar and baz elements
scikit-learn provides ColumnTransformer and FeatureUnion for this
violet talon
looking at __getitem__ is a good idea, was poking around the pandas docs to try and figure that out but it seems going to the code is going to be easiest; I'm troubleshooting something specifically related to boolean filters that seem to have some index-related behavior I'm having trouble wrapping my head around (and I'll take that to a help channel probably); appreciate you explaining the behavior of the operators to me
serene scaffold
violet talon
looking at `__getitem__` is a good idea, was poking around the pandas docs to tr...
No problem. if you got an error message, feel free to show it, and maybe I can explain what it means.
desert oar
serene scaffold
I'm not sure why you're trying to force a relationship between the two `__getite...
my rule of thumb is:
- selecting columns from a dataframe: use
df[ - selecting rows from a dataframe by index: use
df.loc[ - selecting rows from a dataframe by boolean mask:
df.loc[ - selecting rows from a dataframe by position: use
df.iloc[of course
i also try to avoid "chaining" selections when possible, so i prefer to df.loc[mask, 'foo'] instead of df['foo'].loc[mask]
i also try to use .at and .iat when i am definitely trying to obtain a scalar, so that i don't accidentally take a slice if i pass in the wrong types:
df.apply(lambda row: row.at['x'] + row.at['y'], axis=1)
instead of:
df.apply(lambda row: row['x'] + row['y'], axis=1)
i think the slight extra verbosity is worth the extra layer of typo-safety
violet talon
serene scaffold
No problem. if you got an error message, feel free to show it, and maybe I can e...
I posted the question (with a reproducible example) in #help-pineapple (don't want to pollute this chat)
 stark zenith
Damn, master class in dataframes going on in here tonight.
serene scaffold
desert oar
my rule of thumb is:
* selecting columns from a dataframe: use `df[`
* selecting...
I was enjoying reading this until you got to .apply
serene scaffold
we should probably cook up a unified overview of DF indexing and pin it 
desert oar
or the .apply wit haxis=1?
file under "blog posts i wish i had the motivation to write"
obviously that .apply was contrived and you shouldn't do it 🙂
serene scaffold
violet talon
I posted the question (with a reproducible example) in <#697134086614941706> (do...
thanks, I'll look in a sec
stark zenith
I like .ats but my stuff doesn't need to be very performant
for what I've been doing lately anyway.
desert oar
theoretically .at is slightly faster anyway, but that's definitely not the main benefit
stark zenith
desert oar
theoretically `.at` is slightly faster anyway, but that's definitely not the mai...
what is it faster than?
desert oar
stark zenith
oh really? I just like doing stuff like ``df.at(x, 'column') = 'value'` or `y =...
well normally you shouldn't be looping like that. .at[1] is (or at least used to be) faster than .loc[1], but only slightly anyway
stark zenith
desert oar
well normally you shouldn't be looping like that. `.at[1]` is (or at least used ...
I'm iterating through stuff I want to add to the dataframe though, usually URL for a Selenium thing or an HTML parser.
At least for stuff lately.
desert oar
i see. normally i like to build up the data in a list or dict, and then convert to a dataframe all at once
in your case it won't make much of a difference
 final cairn
can some help flatten out following json row
{"resourceType":"Condition","id":"ae8aedf6-73f0-4a2d-b124-2a574f8bb0b1","clinicalStatus":{"coding":[{"system":"http://terminology.hl7.org/CodeSystem/condition-clinical","code":"active"}]},"verificationStatus":{"coding":[{"system":"http://terminology.hl7.org/CodeSystem/condition-ver-status","code":"confirmed"}]},"code":{"coding":[{"system":"http://snomed.info/sct","code":"15777000","display":"Prediabetes"}],"text":"Prediabetes"},"subject":{"reference":"Patient/fbfec681-d357-4b28-b1d2-5db6434c7846"},"encounter":{"reference":"Encounter/7dbeb310-bd64-43a4-b795-f6642bfae028"},"onsetDateTime":"1982-07-10T03:52:44-04:00","recordedDate":"1982-07-10T03:52:44-04:00"}
using pandas. I tried examples from stackoverflow those were less complex ones.
 marble tulip
ooh okaay understiid thank you
How do I find which tweet got the most likes. I tried df.likes.nlargest(n=5)
it is giving me numbers like **20435 165702.0 611955 74528.0 196718 59403.0 996551 59345.0 281655 45540.0**
 desert oar
final cairn
can some help flatten out following json row
desert oar
final cairn
can some help flatten out following json row
any time you have to flatten nested data, you must decide how the result should look
there is no generic flattening algorithm
what result do you actually want?
desert oar
marble tulip
ooh okaay understiid thank you
How do I find which tweet got the most likes. I t...
can you explain more? i don't understand this output. ideally you should provide example data that someone can use to reproduce your problem
 hexed kestrel
Hi guys, I am doing some exploratory analysis on some data, in which it contains an user id column, and each user can log on many times, I want to check the distribution on this user column, I tried to plot histogram but since i have a lot of unique users, the distribution is not very clear. What other visualization method can i use?
my goal is to see what abundance of users we have for very frequent users, and non frequent users
final cairn
desert oar
any time you have to flatten nested data, _you_ must decide how the result shoul...
let me put some excel format and show here
final cairn
desert oar
any time you have to flatten nested data, _you_ must decide how the result shoul...
thats how the flattened data will look like

i have been trying to get this worked out for hours now.
any help or tips would make my day
desert oar
final cairn
thats how the flattened data will look like
my suggestion: write a function that turns one of these json "documents" into a dict with your desired columns as keys
then all you have to do is loop over json documents and then collect the results into a dataframe at the end
 stray nymph
predictions = model.predict_classes(x_test)
for i in range(len(predictions)):
    if(predictions[i] >= 9):
        predictions[i] += 1
predictions[:5]
hi
did they remove predict_classes
im getting an 'Sequential' object has no attribute 'predict_classes'
desert oar
stray nymph
did they remove predict_classes
what library is this?
stray nymph
keras?

Explore and run machine learning code with Kaggle Notebooks | Using data from Sign Language MNIST
im referring to this notebook
 stray nymph
The truth value of an array with more than one element is ambiguous. Use a.any() or a.all()
what does this mean
desert oar
stray nymph
The truth value of an array with more than one element is ambiguous. Use a.any()...
it means you tried to turn an array into a bool, and numpy won't let you do that (for good reason)
if you want to check if an array is empty, check its length
ionic palm
If sequential does not accept 2 input feature, 1 output result, then which model supports it?
stray nymph
correct = np.nonzero(predictions == y)[0]
Length of values (1) does not match length of index (7172)
i dont understand the error


 potent sky
urban ore
like future stock prices
potent sky
urban ore
like future stock prices
look into Time Series Forecasting using LSTMs
urban ore
potent sky
look into Time Series Forecasting using LSTMs
ok thanks
urban ore
potent sky
look into Time Series Forecasting using LSTMs
i had a look at it but this is what i have done . Its actually done on test set and i need it to check for values for in future
potent sky
stray nymph
try displaying predictions the same way you've done with y?
stray nymph
idu what u mean by that
basically
i think this stores the correctly predicted classes in a list?
i think thats what it's supposed to do?


Explore and run machine learning code with Kaggle Notebooks | Using data from Sign Language MNIST

 prisma jay
guys i had this dataframe:

and want to do this:

but this raised an error, is there any valid way to do this?
potent sky
stray nymph
idu what u mean by that
try checking the dimensions of both predictions and y properly instead of just printing them
 shy tundra
 urban ore
lmao
i would like to have some ideas on bankruptcy prediction like what more can i do with it
safe elk
Lol seen funny image detection things too like a friend with hair getting classified as a potted plant instead of a person from a pretrained NN
odd meteor
ionic palm
If sequential does not accept 2 input feature, 1 output result, then which model...
Do you mean two input models? 'Cos Sequential model can take two input features.
Well, In Keras, shared layers are advanced deep learning concept and are only possible with with Keras Functional API. In essence, you can build two input models, three input models and beyond
ionic palm
So if I want to teach tensorflow 1+2+3=6, the dense layer shape is [3,1] right?
[[[1],[2],[3]],[[4],[5],[6]]]
[[[6],[15]]]
@odd meteor
odd meteor
ionic palm
So if I want to teach tensorflow 1+2+3=6, the dense layer shape is `[3,1]` right...
That's not a Dense layer bro.
You can either use your knowledge on numpy or tensor operation to do simple arithmetic like 1 + 2 + 3.
So, these are just list of lists. However if you convert them to numpy ( or tensor) it'll be easier for you to do those arithmetic.
So for example:
import numpy as np
x1 = np.array([[[1],[2],[3]],[[4],[5],[6]]])
print(x1.shape)
The shape of x1 will be (2,3,1)
ionic palm
Ok, need to reshape them to lower dimension but are there any other kind of layer to accept it?
odd meteor
ionic palm
Ok, need to reshape them to lower dimension but are there any other kind of laye...
You can easily reshape your data. It's really not about layers. Sequential model accepts 3-dimensional data.
To be honest, I haven't quite grasp what you wanna do.
ionic palm
I am beginner in tensorflow, trying to solve traveling salesmen problem
locations=[
['a',0,0],
['b',3,0],
['c',0,4]
]```
With `[location id, coordinate x, coordinate y]` finding shortest path c→a→b, but i had been stuck on how to do config layer inputshapehuh I thought .to_frame() should've changed it into a dataframe kind of structure
 odd meteor
ionic palm
I am beginner in tensorflow, trying to solve traveling salesmen problem
```
loca...
odd meteor
ionic palm
I am beginner in tensorflow, trying to solve traveling salesmen problem
```
loca...
So in essence, you have 2 features and a target variable in your dataset and you want to predict the shortest path.
This kinda sound like Operation Research related problem but hey, back to your question. You could simply use Keras Sequential model & Dense Layer to do this.
from keras.layers import Dense
from keras.models import Sequential

model = Sequential()
model.add(Dense(50, activation = 'relu', input_shape = (2, )))
.
.
#You could add more hidden layers here
.
.
model.add(Dense(1))
So what we have here is just 1 hidden layer with 50 neurons, and an output layer.
ionic palm
Theres no need for hidden layers right?
odd meteor
ionic palm
Theres no need for hidden layers right?
If you're building a neural network, you definitely need a hidden layer. The number of hidden layer(s) to add is entirely up to you.
ionic palm
Thanks, and not sure how to do labeling, like a=[0,0]
odd meteor
ionic palm
Thanks, and not sure how to do labeling, like `a=[0,0]`
Are you working with a tabular data? If yes, load your data with numpy or Pandas.
ionic palm
tf.keras.layers.IntegerLookup are just lookup int to int, cannot find array to string
odd meteor
ionic palm
`tf.keras.layers.IntegerLookup` are just lookup int to int, cannot find array to...
You might wanna also check TensorFlow documentation or Google for more clarity.
ionic palm
Thank you so much, is it possible to dm you directly if I have more questions?
odd meteor
ionic palm
Thank you so much, is it possible to dm you directly if I have more questions?
You're welcome.
No please. 😊 I believe you'll get much quicker responses if you ask your questions here.


 kind rock
what is the difference between .predict() and .evaluate() .
Is .evaluate() something like a superset of .predict() where I use the predict function to get the output and then use it further to compute the cost and optimize the parameters ?
 desert bear
Hello, I have a problem regarding ML. I want to build a model that takes 6 parameters. Each can have value {-2, -1, 0, 1}.
So the input has a form of a vector. Vector space in this problem is: 44444*4 = 4096.
How can I analyze the density of my dataset, in a way that I can get information on how each vector from dataset is placed in this vector space
lapis sequoia
Y'all, I am new and is trying to get to data science and AI. I am currently learning beginner stuff and wanted to ask if you guys have any tips that I should know as a beginner or something to watch out for
lapis sequoia
I've completed the basic python knowledge and want to learn data analysis, can anyone suggest me some courses or resources?
serene scaffold
lapis sequoia
Y'all, I am new and is trying to get to data science and AI. I am currently lear...
since AI is hyped in media/culture at large, a lot of newcomers to AI are disappointed when they find out that it's mostly math.
Don't become addicted to jupyter notebooks. They're alright for data exploration and visualization, but they'll hinder your understanding of how programming works if you try to use them for more than that.
also, don't install anaconda.
lapis sequoia
serene scaffold
since AI is hyped in media/culture at large, a lot of newcomers to AI are disapp...
Oh hell yeah I am learning math for this
huh 2 contradicting statements from my studies
I am using jupyter and pycharm but a guy recommended me to use fully jupyter since I am going to use it alot
serene scaffold
Try using it as little as possible.
you can't "import a notebook" into another Python program. You might end up with a notebook in a state that can't be reproduced. You can't deploy a model from a notebook.
lapis sequoia
serene scaffold
Try using it as little as possible.
noted
hollow sentinel
serene scaffold
since AI is hyped in media/culture at large, a lot of newcomers to AI are disapp...
jupyter notebooks = BEST 😡
stel bad
lapis sequoia
serene scaffold
you can't "import a notebook" into another Python program. You might end up with...
That's actually a good reason, How come I never consider this lol
hollow sentinel
it's ok i thought jupyter notebooks was the holy grail for a while
serene scaffold
because there's a lot to learn when you're getting into AI, and resources intended to teach AI to complete beginners can't also teach software engineering
but you can only get so far without understanding both.
lapis sequoia
serene scaffold
also, don't install anaconda.
How about anaconda? what's wrong about it? I thought its essential for data science?
hollow sentinel
metaverse 😡
lapis sequoia
The only reason I am learning AI is to hopefully make AGI ||waifu|| and improve human life on day to day basis and I am doing great and is making sure not to miss anything including math and such
serene scaffold
lapis sequoia
How about anaconda? what's wrong about it? I thought its essential for data scie...
if your only understanding of python dependency management is through anaconda, your understanding is locked in to something that only a small minority of Python developers use, even though the benefits of using it over venv are ever fewer and further between.
the point of anaconda is that you can install pre-compiled binaries that may or may not be written in Python. but that's rarely needed these days.
it's easier to just learn the system that everyone else is using, and then if you ever need a dependency that you truly can't build on your own (or which doesn't come pre-built), you'll be knowledgeable enough by then to use anaconda in that instance.
serene scaffold
lapis sequoia
The only reason I am learning AI is to hopefully make AGI ||~~waifu~~|| and impr...
AGI, as in "artificial general intelligence"? I would set your sights on something obtainable.
lapis sequoia
serene scaffold
AGI, as in "artificial general intelligence"? I would set your sights on somethi...
Well, a man can dream
serene scaffold
well, yes. but if you're not interested in a career of developing AIs that have nothing to do with that, this endeavor is going to be unfulfilling for you.
lapis sequoia
I do, I gave it a really long thought on this and decided why not. It's fascinating to see. Although things may look simpler once I get into it, I am still willing to do it. Might be on road straight to disappointment, but who knows really
serene scaffold
lapis sequoia
I do, I gave it a really long thought on this and decided why not. It's fascinat...
well, everything is simple once you understand it.
lapis sequoia
serene scaffold
it's easier to just learn the system that everyone else is using, and then if yo...
so basically "as beginners, don't touch anaconda, when you need it, you are probably already good and deep enough on it"?
serene scaffold
lapis sequoia
so basically "as beginners, don't touch anaconda, when you need it, you are prob...
more or less. anaconda separates you from the rest of the Python ecosystem, and that means there will be fewer resources available to you, but you won't necessarily get any benefit from using it for a long time.
lapis sequoia
I see, reasonable. I guess I wont be learning anaconda then.
serene scaffold
Also, in the Python channel for my work's slack server, someone asked "why are you all even using anaconda? like 1/4 of the questions here are people confused about anaconda."
lapis sequoia
That both really surprised me ngl, I am following a course and the guy advised us to get used to Jupyter since once we get a job, we are going to use it extensively. I am also under the impression that anaconda is literally essential
lapis sequoia
serene scaffold
Also, in the Python channel for my work's slack server, someone asked "why are y...
oof, I probably just dodged a bullet then lol
Anymore tips?
serene scaffold
don't use "list" and "array" interchangeably, as the distinction is critical for data science
and don't iterate over arrays. or DataFrames.
hollow sentinel
iterating over dataframes defeats the purpose of pandas, right?