#data-science-and-ml
1 messages · Page 371 of 1
 hollow sentinel
 desert oar
another example https://machinelearningmastery.com/sequence-classification-lstm-recurrent-neural-networks-python-keras/

Sequence classification is a predictive modeling problem where you have some sequence of inputs over space or time and the […]
conceptually it's the same thing: you are using the LSTM layers to "vectorize" each time series
desert oar
as in, each time series gets embedded in some vector space, which is optimized to make it as easy as possible to separate the 2 (or more) classes
hollow sentinel
hm
desert oar
caveat: im not sure how this will work with varying-length time series
hollow sentinel
i'm just worried because i'm being asked how to apply this practically
and uh if this doesn't work my internship goes bye bye
but that's my fault ig
i mean i am using keras so i can suggest hey we can use an ML kit for the app
but idk if the dev team even wants to acommodate or try that
the second step would be to deploy it on aws sagemaker
 prime hearth
hello, sorry could i please ask for machine learning linear regression models using feature selection with heatmap (pearson corelation), should i choose features that have high corelation with the target or label and remove any features that have high corelation with each other or just remove features with high corelation not related to label?
thanks
I understand also regression model require corelation but i was wondering if it good practice to just pick features with corelation to label and disregard any or instead disreagrd high corelated features then check accuracy of model and continue to apply feature engineering or hyperparamter tuning
hollow sentinel
what i said is a good idea ngl using a machine learning sdk
and then deploying the model on aws sagemaker
that is a good application
hollow sentinel
i'm just gonna put a presentation together
 stone marlin
How to do Time-Series stuff 101:
- Resample to make everything even.
- ARIMA
- Figure out why your ARIMA didn't quite work
- ARIMA
- Continue until "Okay, got it."
- Make a prediction where your 95% CI is absurdly large.
- No one is happy about it.
hollow sentinel
what's arima
stone marlin
Weirdly, I'm also looking at LSTM today for timeseries. I haven't really used them much, and I wanna learn a bit more about it.
hollow sentinel
a model that's used to predict future events given past observations
dude i don't know if i can put this lstm together in time
lowkey stressed
stone marlin
Why, ARIMA is, of course, AutoRegressive, Integration-based, Moving Average models. :'] Haha, it's a very common time-series first-step. https://otexts.com/fpp3/arima.html But the LSTM is pretty fun too, try that noise out.
I honestly have no idea how LSTMs work on general timeseries. That's what I plan to learn today!
hollow sentinel
oh wow
sentdex
sentdex i love you
what a god
wait shit i know this
more linear algebra
oh my god i think i can actually DO THIS
thank the lord i actually looked at lin alg the past 2 months or so
so i guess this is the explaining to corporate part of the intership
desert oar
hollow sentinel
i'm just worried because i'm being asked how to apply this practically
what do you mean by "apply this practically"? do you have to use time series classification for your project?
fortunately you don't need to know how an LSTM works, keras has LSTM layers built in 😆
i'd recommend reading the articles i posted first, just so you can stop being afraid of the programming/application side
since you seem to be short on time (?), get a proof of concept working, and then spend your energy trying to understand it enough to explain it to your manager
desert oar
stone marlin
How to do Time-Series stuff 101:
1. Resample to make everything even.
2. ARIMA...
lol, i literally did this for a work project once
hollow sentinel
desert oar
what do you mean by "apply this practically"? do you _have_ to use time series c...
i have to somehow explain how it could be used for his company
desert oar
hollow sentinel
i have to somehow explain how it could be used for his company
this seems backwards. you should start with some business problem first. and if time series classification is indeed the right approach to solving that problem, then the answer is obvious: it's useful because it solves the problem!
so what have you actually been asked to do here?
hollow sentinel
find a model that can accurately predict whether a call is spam or not
desert oar
great, so you have a classification problem
so start there
"we need to classify calls"
which naturally leads to "we need a way to turn a call into a vector so that we can classify it"
stone marlin
desert oar
lol, i literally did this for a work project once
Haha, it legit is the best way, IMO, to just get something rough and reasonable from a time series! :']
hollow sentinel
i see
desert oar
and this is where the machine learning comes in: "we can encode the call as a sequence of tokens and/or some kind of audio waveform, and use well-established sequence classification techniques on it. we can augment the sequence encoding with metadata about the call, and/or specialized features constructed using our domain knowledge about phone calls."
hollow sentinel
that fits along the lines of what i was thinking
desert oar
but maybe you want to start simpler. look up how email spam filtering works
instead of jumping right for the deep learning and sequence classification, maybe you can transcribe the audio and use a good old bag-of-words representation
hollow sentinel
i can’t do that as they don’t record the audio
at least they didn’t give it to me
desert oar
ah, well there's a whole different problem. what do they record?
if you don't have audio or a transcript of the call, you might not have a sequence at all!
hollow sentinel
i can show you exactly what they gave me i’m just gonna finish eating
desert oar
this is why it's important to start with your 1) business problem and 2) your data. your solution will always consist of using (2) to solve (1). literally everything else is an implementation detail.
welcome to data science
hollow sentinel

the first three rows of the data
i have a meaningless id, the phone number the spam call came from, and then the “honey pot number”
the company owns a ton of these “honey pots” to receive calls
desert oar
so why did you even start asking about sequence classification? this doesn't look like a sequence or time series at all
hollow sentinel
i saw dates
desert oar
🤔
you could use the date/time of the call as an indicator
you could look for unrealistic clustering for example
hollow sentinel
that’s what i just started thinking of
desert oar
but i don't see anything sequential about this. you have a few data points that are probably only weakly correlated with the label
so i'd actually suggest avoiding all thoughts of deep learning here. traditional stats and a lot of exploratory data analysis will serve you best in a problem like this (IMO)
desert oar
are there other data points you can integrate from other data sources at the organization? have you talked to anyone else that you work with, in order to get insight about what "subjectively" constitutes spam?
no problem: it's fun thinking about these problems, since i don't get to do data science work at my job nowadays
it helps me stay sharp
hollow sentinel
no, these are the only columns they collect 😦
it was basically yo rahul you want some data
desert oar
these are all USA numbers, so you could maybe look at geographical clustering w/ the area codes
maybe you can knock out some easy cases if you find unrealistic combinations of area code + time
e.g. EST 3 AM calling from a 202 number (Connecticut)
hollow sentinel
hmmm
desert oar
i know fuck-all about spam calls btw so i am just making stuff up
the point is: get creative and do lots and lots of EDA
hollow sentinel
ok
desert oar
ask your coworkers
desert oar
who is managing the internship? who gave you this task?
hollow sentinel
the ceo
desert oar
yikes. this sounds like you are set up for failure
is this a co-op through school? or something you found on your own?
does the ceo have stats or data analysis training?
hollow sentinel
nope
i’m the only one 😀
and i’m not even a “data scientist” i’m more like in training
what a shitshow
desert oar
there are some pros and cons of your situation
-
pro: literally anything you do is better than nothing, in this situation
-
pro: you can impress people with rudimentary skills (resist the temptation to do anything fancy)
-
con: the data is probably fucked up because nobody (?) is auditing it
-
con: you have no support, guidance, or direction, and the business has no idea what they want
desert oar
i mean, your "internship" is more like "unpaid chief data scientist"
hollow sentinel
it’s paid
desert oar
underpaid, then
hollow sentinel
$20 an hour to do an entire team’s worth of data science
desert oar
so you are going to have to put on your business hat here and focus heavily on "how do i deliver value to this CEO"
desert oar
meaning: talk to the CEO. be honest that this data probably is not useful for classifying spam calls. maybe you can do better than random guessing, but probably not much. suggest that you might be more valuable if you first spend time helping the business understand its data better: making plots, describing cycles in call volume, etc.
so there is no data analyst working there at all currently?
desert oar
i assume this is some kind of call center?
desert oar
i was just reading that
if they have 0 data analysts that means they clearly are not using "AI" to do this
do they have a call center full of humans who audit calls?
hollow sentinel
well
desert oar
maybe your contribution to the business could be suggesting new data that they should collect in order to make their data useful for analysis + prediction
hollow sentinel
this is not going to sound good
but the ceo told me that his “algorithm” for blacklisting is essentially if conditions
desert oar
that's how all good products start
so he came up with some rules of thumb that work pretty well?
desert oar
well that's... questionable
hollow sentinel
desert oar
maybe your contribution to the business could be _suggesting new data that they ...
that’s smart
i’m just a bit disappointed in myself
desert oar
hollow sentinel
i asked if i could look at it, but he said no
tell him that understanding how things work is necessary for you to understand the problem well enough to be able to do anything intelligent with the data.
desert oar
hollow sentinel
i’m just a bit disappointed in myself
no, you should be disappointed in this ceo for trying to put a $200k+/year job onto an intern's shoulders, and lying to you about having a "training" program
hollow sentinel
that’s true i’m more like pissed off at the ceo
desert oar
and on top of it, stonewalling you when you tried to learn about how the business actually works
it's one thing if they understand your situation and are willing to cooperate
desert oar
it's another if they are actively obstructing you from doing your job
hollow sentinel
well i mean i should’ve seen the signs
not a single data analyst on the team and that it’s an “independent internship”
desert oar
hollow sentinel
but i don’t like blaming other people
it's important to give people the benefit of the doubt, but it's important to know when it's not your fault. you know how i often say that you have to "get stupid before you get smart"? that applies to life, not just programming. sometimes you have to do something kind of stupid before you learn.
hollow sentinel
thanks man
i appreciate those words
i really have been learning a ton and developing my skills so
desert oar
fortunately it's an internship on a limited basis. you will come out of it with unusually good experience dealing with the real life data science bullshit that all data scientists have to deal with at some point. you just need to keep your head above water and keep the ceo happy enough to give you a good recommendation for your next job.
desert oar
hollow sentinel
i really have been learning a ton and developing my skills so
i have noticed. you are doing great
hollow sentinel
so it’s basically confirmed i’m most likely not going to get anything for the summer
but honestly
i’m ok with that
i would rather get a proper internship than this
i mean a huge red flag right from the start was “we’ll see if you can make any meaning out of this and if you don’t at least you make some cash”
desert oar
heh
fwiw that is where the money is
i have to head back to my own work, but i will reiterate: focus on doing the simplest things first. pretty charts, correlations, etc.
hollow sentinel
got it
thanks
ok i have a dumb idea
maybe i can slice the area code from each string in the series
and somehow try to see if i can predict if it's a spam call... based on the area code?
 lapis sequoia
does numpy have stuff specifically for slicing vectors into subvectors
hollow sentinel
i don't know the practicality of this i am spitballing here
hollow sentinel
lapis sequoia
does numpy have stuff specifically for slicing vectors into subvectors
lapis sequoia
Because the course I'm taking has an exercise which needs it
thanks
basically axpy operation but with a notation that involves partitioning vectors
hollow sentinel
data({"phone_num_from": "str"}).dtypes
---------------------------------------------------------------------------
TypeError                                 Traceback (most recent call last)
<ipython-input-12-070555c35392> in <module>
      1 # data["phone_num_from"].astype("str")
      2 # phone_num_from.slice(stop=7)
----> 3 data({"phone_num_from": "str"}).dtypes

TypeError: 'DataFrame' object is not callable
actually i don't even need to do that i believe
hollow sentinel
an object isn't what it's expected to be called on

i am trying to get the values in this column
phone_num_from
 serene scaffold
I don't look at screenshots of DataFrames; only the result of df.head().to_dict('list') as text.
 iron basalt
lapis sequoia
does numpy have stuff specifically for slicing vectors into subvectors
iron basalt
lapis sequoia
does numpy have stuff specifically for slicing vectors into subvectors
Numpy arrays support Python's slicing syntax.
 hollow vector
Hey, I have a program to get prices of something into a db (connected with a time), I want to be able to use these prices to predict future prices, what module do you think would be best for that?
lapis sequoia
is this the right channel for cv2 topics?
hello who ping
oh alr
how do I use np.split
import numpy as np

x = np.array([1, 2, 3, 4, 5, 6, 7, 8])
y = np.array([2, 4, -2])

def axpy_unb(x, y):
    if isinstance(x, np.ndarray) and isinstance(y, np.ndarray) == False:
        print("x and/or y need to be a vector")
    else:
        np.split(x, 2, axis=0)
        print(x)

axpy_unb(x, y)``` this is my codethe end goal is to make axpy operation and partition x and y into subvectors and preform axpy to those subvectors
the second param is supposed to be an int
when i make it 2 does nothing at all
the vector is the same
desert oar
lapis sequoia
does numpy have stuff specifically for slicing vectors into subvectors
what is a "subvector"? maybe you want to read this: https://numpy.org/doc/stable/user/basics.indexing.html#slicing-and-striding
lapis sequoia
desert oar
what is a "subvector"? maybe you want to read this: https://numpy.org/doc/stable...
My course mentions partitioning vectors in smaller vectors called "subvectors"
and how that is a very handy for matrices and large vectors
desert oar
lapis sequoia
My course mentions partitioning vectors in smaller vectors called "subvectors"
partitioning i think is the key word here
perhaps "block partitioning" even
lapis sequoia
cutting up
il give example
you have 2 column vectors
vector x which is (1, 2, 3, 5) and vector y which is (2, 7, 1, 4)
I could put a line between components of the vector to turn it into a subvector
turn it into 2 subvectord
in a vector
here is the explanation
desert oar
lapis sequoia
I could put a line between components of the vector to turn it into a subvector
which vector? you just showed 2 different vectors
this is a 5-minute video... were you given a more precise written definition somewhere?
desert oar
i see.. i didn't watch the whole video, but i did skip around a bit. it does kind of look like you just want "slicing"
np.split is maybe useful too, but first i recommend reading the documentation page i linked
lapis sequoia
I just need to slice a vector into 2 subvectors
desert oar
afterwards, read the documentation page for np.split https://numpy.org/doc/stable/reference/generated/numpy.split.html#numpy.split
hollow sentinel
what happened to discord for a solid two hours
hollow sentinel
serene scaffold
I don't look at screenshots of DataFrames; only the result of `df.head().to_dict...
{'id': [4870332158, 4870332159, 4870332160, 4870332161, 4870332162],
 'phone_num_from': ['161', '185', '180', '131', '161'],
 'phone_num_forwarded_from': ['1301445XXXX',
  '1770693XXXX',
  nan,
  '1310833XXXX',
  '1610664XXXX'],
 'is_blocked': [1, 1, 0, 0, 0],
 'created_at': ['2021-12-01 00:00:00',
  '2021-12-01 00:00:00',
  '2021-12-01 00:00:00',
  '2021-12-01 00:00:00',
  '2021-12-01 00:00:00']}
i managed to shorten the spam phone numbers to area codes with str.slice
my next plan of action is to try mapping these area codes to actual countries
 knotty crystal
I was wondering if you guys know about any good beginner level projects I can start to sharpen my skills ?
serene scaffold
hollow sentinel
```python
{'id': [4870332158, 4870332159, 4870332160, 4870332161, 4870332162],
...
what do you want to do with this data? Also, note that nan is shown here as a name, not as a string.
hollow sentinel
serene scaffold
what do you want to do with this data? Also, note that `nan` is shown here as a ...
i wanted to use the area code to predict whether or not a call is spam
i just do not think there is a heavy correlation at all and I am confused on finding a correlation b/w them
in other words i do not think you can predict whether or not a call is spam from simply the area code itself
i think it's just a case of garbage in, garbage out
desert oar
hollow sentinel
```python
----------------------------------------------------------------------...
i bet you $5 that you know what this error means
 plush jungle
I'm trying to train a vanilla RNN on an extremely basic dataset that looks like this as a proof of concept to make sure I understand how RNNs work:
dataset = ["Alice saw Bob.",
           "Alice saw Carmen.",
           "Bob saw Alice.",
           "Bob saw Carmen.",
           "Carmen saw Alice.",
"Carmen saw Bob."]```this is my code so far
I've encoded the dataset so that each word is a one hot vector, since that seems to be the way most people do it in pytorch
my goal is for it to predict the next word
but my problem is I'm not sure where to go from here
forward propagation seems to work:
output, hidden_state = model(word, hidden_state)```but then I want to calculate the loss and back propagate
the tutorial I saw did it like this
        loss = criterion(output, category)
        optimizer.zero_grad()
loss.backward()```but the output in that tutorial was a category, not the next word
hollow sentinel
desert oar
i bet you $5 that you know what this error means
i figured it out
hollow sentinel
desert oar
i bet you $5 that you know what this error means
i thought abt what you were saying with pretty graphs and all
i was thinking of using geopandas and maybe mapping where all these calls came from
i don't know how helpful that is going to be, because spam calls are spoofed nowadays
but at least it's something
desert oar
hollow sentinel
i don't know how helpful that is going to be, because spam calls are spoofed now...
might as well try it. if nothing else, it might give you insight into spoofing patterns
hollow sentinel
my thought too
desert oar
i'd also suggest plotting a time series of call volumes
maybe a bar chart of calls per hour over the course of a week, averaged over all weeks
hollow sentinel
i have a couple questions on that
desert oar
or maybe a bar chart of calls per hour, as a full time series
maybe even per minute if you have enough calls
hollow sentinel
i thought you said i didn't have time series data
desert oar
you do! but not for the classification problem
hollow sentinel
i see
desert oar
you have a huge dataset of call "events", each with a timestamp
you can count the number of events in some regular interval, e.g. minute or hour, and then you have a time series of counts
iron basalt
When in doubt, bucket things and make some bar charts.
iron basalt
Bar chart is like the most simple dumb chart.
iron basalt
pie charts are not good at anything
 arctic wedgeBOT
Pasting large amounts of code
If your code is too long to fit in a codeblock in discord, you can paste your code here:
https://paste.pythondiscord.com/
After pasting your code, save it by clicking the floppy disk icon in the top right, or by typing ctrl + S. After doing that, the URL should change. Copy the URL and post it here so others can see it.
serene scaffold
hollow sentinel
ok, so this must be the wrong format
what do you mean that it's the wrong format?
nan isn't a string. we don't want it to be.
hollow sentinel
serene scaffold
what do you mean that it's the wrong format?
oh
oh no, are there nans still in the dataset?
serene scaffold
well, there's at least one in the dataframe you showed me.
but if you don't know what you want to replace them with, you might as well leave them.
hollow sentinel
i know why there were nans in the first place
and it has to do with why you hate jupyter notebook
actually
no it doesn't
memes
i mean if i don't drop these nan values from the dataframe
and i try to convert these strings to datetime
won't i just run into errors?
actually jupyter notebook is being hella confusing
my stuff was working fine an hour ago and now it's broken
serene scaffold
well, that definitely means that it either didn't work before like you think it did, or you broke it. it's very unlikely that you uncovered an error with python or jupyter.
hollow sentinel
yeah it's definitely me lol
data.fillna({"phone_num_forwarded_from": "Missing"})
data.fillna({"phone_num_from": "Missing"})
i don't see what's wrong here
serene scaffold
it has to do with something we've already talked about
spend at least ten minutes thinking about it.
@hollow sentinel did you figure it out?
hollow sentinel
i believe so
hollow sentinel
wdym
serene scaffold
there's nothing inherently bad about having NaNs in your data, but there is something inherently bad about having data that violates your schema
if you have a column of phone numbers as strings, but one of them is the string "Missing", that is much worse than having a NaN in that spot instead.
hollow sentinel
so i'm just wasting my time
serene scaffold
could be. what are you actually trying to do, in broad terms?
and how was putting the string "Missing" in the dataframe intended to get you closer to it?
hollow sentinel
i thought i had to somehow handle those NaN values
but i should've considered it better
i saw it on a kaggle notebook a while ago
serene scaffold
no. trying to delete NaNs "just to make them go away" is like suppressing all exceptions in your code.
serene scaffold
👍🏻
a lot of pandas operations, if one of the values is a NaN, it will just copy the NaN
hollow sentinel
i see
serene scaffold
sometimes you can pick what you want to have happen (that is, letting the nan "propagate" or raising an exception)
but the whole API surrounding missing data deals with NaNs, not arbitrary placeholder values.
that's why you have methods like isna and fillna
hollow sentinel
so how exactly do you handle NaNs
what do you fill them in with?
does it depend on the dataset?
like you can't replace a column that with phone numbers that has NaNs inside of it with "Missing"... so is it better to just leave it alone?
serene scaffold
the dataset, and what you're trying to do more broadly
hollow sentinel
i see
is there a method i can call on my created_at column to see what format code it is?
because i am trying to figure out what format "2021-12-01 00:00:00" is ... that last part
it looks to me like %Y-%m-%w
serene scaffold
hollow sentinel
because i am trying to figure out what format "2021-12-01 00:00:00" is ... that ...
strictly speaking, there's no way to know if "january twelfth" or "december first" was intended. you have to know what convention the dataset creator was using.
serene scaffold
In [7]: pd.to_datetime(df['created_at'])
Out[7]:
0   2021-12-01
1   2021-12-01
2   2021-12-01
3   2021-12-01
4   2021-12-01
Name: created_at, dtype: datetime64[ns]
you can go by whichever pandas assumes.
plush jungle
can someone help me understand pytorch a little better? I've got this code:
for epoch in range(num_epochs):
    for sentence in dataset:
        hidden_state = model.init_hidden()
        input_tensor = get_one_hot_sentence_tensor(sentence)

        loss = 0
        for word in input_tensor:
output, hidden_state = model(word, hidden_state)```note the dtype, datetime64[ns], which is a proper date type.
plush jungle
and I want to calculate the loss
hollow sentinel
serene scaffold
note the dtype, `datetime64[ns]`, which is a proper date type.
i see, thank you
serene scaffold
plush jungle
and I want to calculate the loss
what is word?
plush jungle
word is a tensor that looks like this:
tensor([[1., 0., 0., 0., 0.]])
it's a one hot encoded word with a vocabulary of 5
output successfully returns a tensor of the same shape
serene scaffold
plush jungle
it's a one hot encoded word with a vocabulary of 5
I see. you can also call this a one-hot vector of shape (1, 5)
plush jungle
got it
output is a vector of the same shape
which I understand represents the RNN's best guess
for the next word
grad_fn=<AddmmBackward0>)```so, the loss function is intended to represent how far off the prediction was from the answer
plush jungle
right
serene scaffold
well, the result of the loss function, anywya
do you know what loss function you're using?
plush jungle
people keep using the criterion() function
so I'll use that
one tutorial did this:
        l = criterion(output, target_line_tensor[i])
loss += l```Pasting large amounts of code
If your code is too long to fit in a codeblock in discord, you can paste your code here:
https://paste.pythondiscord.com/
After pasting your code, save it by clicking the floppy disk icon in the top right, or by typing ctrl + S. After doing that, the URL should change. Copy the URL and post it here so others can see it.
serene scaffold
hollow sentinel
```python
data.loc["created_at"].day_name()
```
do you know what loc is for?
hollow sentinel
loc is for a specific columm
serene scaffold
other way around.
serene scaffold
no...
hollow sentinel
loc is for a group of cols
serene scaffold
you just use regular df[...] to get columns
hollow sentinel
oh ok
serene scaffold
if it's more than one column, the thing you put as ... as to itself be a list
so you might end up with something like df[[1, 2, 3]]
I always make sure my column names have no whitespace so I can do df['first_column second_column'.split()]
cuz laziness
plush jungle
so i've seen people use an off-by-one tensor for their target to compare the output to. would I do that like this? (tensor is in word form for clarity)
sentence_in_dataset = ['alice', 'saw', 'bob', '.']
target_sentence = ['saw', 'bob', '.', "end of sentence"]```
data["created_at"] = pd.to_datetime(data["created_at"])
data["created_at"].day_name()
the .dt. is part of it.
hollow sentinel
oh i'm dumb
it's called an attribute error because something after that dot to access the attribute from the class
is messed up
right?
serene scaffold
when you use the . operator, it first looks for the attribute name in the attribute table for the instance, and then each class in that instance's class's method resolution order.
hollow sentinel
i see
plush jungle
serene scaffold
do you know what loss function you're using?
oh
criterion = nn.CrossEntropyLoss()```didn't see that
hollow sentinel
data["created_at"].dt.day_name().nunique()
oh shit i have to specify axis
according to the doc
actually i'm unsure if i have to because i specified it was for that "created_at" col
i want something like Monday 5000
Friday 9000
i think value_counts would be the best for that and i can pass in a (normalize = True) to get me %s
i think i have a plan of attack for this now after reading some stack overflow posts
i'm going to groupby for a specific day by day in month and then maybe by week as well
and graph both
see what happens
 robust jungle
Apologies for such a late reply, I would love to. That’s what im here for
hollow sentinel
image recognition = central neural network = neural network = linear algebra + statistics + calculus
i can recommend an introductory stats course that i think is quite good at introducing people to stats up to an almost intermediate-level

YouTube
This Channel is dedicated to quality mathematics education. It is absolutely FREE so Enjoy! Videos are organized in playlists and are course specific. If they have helped you, consider Support:
You may find and support me at Patreon.com/Professorleonard
Please consider "Whitelisting" this Channel on your AdBlock if it is enabled.
Your su...
I would recommend this guy's Statistic Playlist 1 and Calculus 1, 2, and 3 videos along with his diff eq. videos
for linear algebra, I would recommend Strang's MIT OCW linear algebra course, but I also suggest you use Professor Dave Explains and Organic Chem Tutor as supplemental videos.
once you get the basics of linear algebra, i suggest you start with this video https://www.youtube.com/watch?v=T73ldK46JqE&list=PLiiljHvN6z1_o1ztXTKWPrShrMrBLo5P3 and work through the series

Welcome to the “Mathematics for Machine Learning: Linear Algebra” course, offered by Imperial College London.
Week 1, Video 1 - Introduction: Solving data science challenges with mathematics
This video is part of an online specialisation in Mathematics for Machine Learning (m4ml) hosted by Coursera. For more information on the course and to ...
I also suggest this video series for linear algebra in machine learning : https://www.youtube.com/watch?v=Qc19jQWHdL0&list=PLRDl2inPrWQW1QSWhBU0ki-jq_uElkh2a

This is a warm welcome to the Machine Learning Foundations series of interactive video tutorials. It provides an overview of the Linear Algebra, Calculus, Probability, Stats, and Computer Science that we'll cover in the series and that together make a complete machine learning practitioner.
It also outlines the innovative combination of hands-...
Krohn aditionally does videos on calculus in machine learning
and finally, for statistics in machine learning, Krish Naik is quite good
since you want to do neural networks, I believe sentdex has a pretty decent video series on yt for it that explains the math
 austere swift
hollow sentinel
image recognition = central neural network = neural network = linear algebra + ...
austere swift
hollow sentinel
image recognition = central neural network = neural network = linear algebra + ...
theres also calculus involved for the optimization process
hollow sentinel
yes sorry i forgot to include that
 warped turtle
any particular methods or libs you like using to produce relatively simple html/pdf reports including matplotlib plots and dataframes?
 modest shuttle
Hello,
I want to learn computer vision, where to start? OpenCV or TensorFlow?
stone marlin
warped turtle
any particular methods or libs you like using to produce relatively simple html/...
https://streamlit.io/ I started using this, and it's pretty awesome. (It's free, I think their cloud service is the paid part.)
warped turtle
stone marlin
https://streamlit.io/ I started using this, and it's pretty awesome. (It's fre...
that's pretty cool!
I was thinking to start I just need a simple pdf/html generation similar to jupyter save-as pdf
but for my dynamic stuff I think streamlit would make for an interesting option
only thing is nbconvert doesn't support input parameters directly
stone marlin
I was about to say, I use nbconvert for doing like jupyter-to-blog-post stuff.
What do you expect to do with this? Do you want people to be able to alter parameters of your model, or are you displaying data, or what's the deal?
warped turtle
I have a pretty standard notebook that generates like 10+ charts, outputs some statistics, etc.. at the top I have a python cell that reads something like input_file = "/path/to/some/csv" df = pd.read_csv(input_file) I would absolutely love to just be able to run like ... nbconvert ... --set input_file=/tmp/csv1.csv or similar
reading up on https://nbconvert.readthedocs.io/en/latest/execute_api.html now
stone marlin
Ahh, got'cha. So, you only care about like, batch generation, not having the user pick a file and do the calculations and all?
warped turtle
correct
tbh being able to pass a value into an ipynb or whatever seemed to be so basic I never thought it might not be supported
I tried reading sys.argv, even setting environment variables
only thing I can think of is writing a nbconvert frontend in python and adding my args there then outputting them to some well-known location then the notebook reading that file
but alas, I could then only run 1 job at a time since the config flie would get clobbered
I must be missing something somewhere
stone marlin
Yeah, the deal would be that nbconvert doesn't necessary run the commands, it just converts. There is https://github.com/takluyver/nbparameterise but I've never used it before.
I can't really think of a good way to do this for a notebook since, without a kernel, it's basically just json. So, you need to "put in a value" then run all the stuff. My thoughts are, then:
- Convert to a script and use something like Dash / Streamlit to generate html pages.
- Use Jinja to do the same deal.
- Maybe try that nbparameterise or https://github.com/nteract/papermill. No promises, tho.
warped turtle
yeah will try nbparameterise first, thanks for pointing that out
jinja would be nice too except I'd need to deal with all the stylesheets and formatting
and I love jinja!
stone marlin
Yeah, it's a pain. I'm sure there's other generation tools out there for reports, but I've only used jinja and, now, Streamlit. Alas.
 swift oxide
hey guys
so I am learning machine learning and new to all the algortihms
I had one doubt
when we use SVC (support vector classifier)
What if the new data point is on that line
how does the classifier predict that value
stone marlin
Like, if the point lies exactly on the decision boundary?
swift oxide
ya
stone marlin
I'm not sure what every implementation does, but ultimately the answer is, "It doesn't matter which group it's classified into."
Having a point on the decision boundary is an interesting thing, practically, since it sometimes will give you what a "general" case could potentially look like (or, to take things further, these are good points to use to test new models, if you expect one particular outcome from it).
But, in general, for each classifier, if a point is on the decision boundary then there is sort of a "it doesn't matter where this goes" situation.
swift oxide
but then how to get the accuracy of it
what if this is a cancer prediction type situation
am a noob, please bare
stone marlin
If that point is in the test set and it's supposed to be on one side, then 1) the model isn't doing a great job classifying this particular point, and 2) it should not affect the accuracy so much if it's a single point.
If many, many points are on the decision boundary, that's very bizarre.
swift oxide
oh okay, so we just have to ignore it
stone marlin
In actual implementations of the classifier, I'm sure there's some "tie-breaking" thing (like, "send it to the class with the lower number").
But because, in computing score, a single point should not heavily influence the accuracy too much, it's not a problem to kind of randomly put it in whatever pile.
swift oxide
okay
actually what I was trying to do was
I read about knn classifier
but then I thought rather than using that much computation
maybe we take the mean and then check
which mean is closer
but then I found out about svc, so
stone marlin
They're all good in different situations (knn, k-means, svm, etc.) so, yeah, just try'em out.
 sour shoal
anyone mind helping me with code in voice chat?
Like i think i am pretty close to getting this NN right, its for the MNIST
I tried using classes to do it and i just have 0 clue what to do
like ive written the code
except i used classes to do this project and i have never used classes before
 amber lark


 tidal bough
That's not the output - judging by the title "Park", rather than "Translated", it's the original image.
presumably your program blocks on showing the image or something like that, and you need to close it to let it run further.
 dire plover
hey, I am beginner learner of python my goal is to learn python so I can do some freelance (data science and machine learning) what could be best road map for me if I want to learn this for free, I would really appreciate your help.
hollow sentinel
woah timedelta is so cool
i had a feeling it was somehow a change in time b/c delta means change in math
hollow sentinel
so i thought a bit and decided to do some more data processing on that date time stuff in my dataframe
i filtered the pandas data by week, and then used groupby on whether or not it was blocked
i will then make a histogram for each week that compares how many numbers were blocked to how many weren’t
and then take a sample of the dataframe and do the same thing see what turns out
i don’t see the problem in trying to construct a frequency histogram as well
this way maybe i can show some kind of peak week for spam calls
 dusky dome
Hi it really affect if we model a feature in Boolean vs numeric(1 for true and 0 for false) while using scikitlearn ML ?
hollow sentinel
fig, ax = plt.subplots()
ax.plot(data["created_at"], data["created_at"].dt.day_name.value_counts)
``` clearly i have messed something up syntactically civic stone
Hello Everyone,
I have one question regarding the cluster number by using K-Means; how to know the best value for K? I mean, how to choose the best value for K ?
Thanks for your support
hollow sentinel
i have got to be thinking about this incorrectly as i simply want the week # on the x-axis, and then the number of spam calls on the y-axis to show certain peaks
serene scaffold
dusky dome
Hi it really affect if we model a feature in Boolean vs numeric(1 for true and 0...
it won't really make a difference
well, I guess it depends. but True is treated as 1 and False is treated as 0, in pretty much every context.
hollow sentinel
maybe it would be smarter to filter the dataset for spam calls for a certain week and count it from there
and then instead of graphing it on a histogram graph it on a simple lineplot
that way peaks would be much easier to tell
sorry i am just writing my thought process here
arctic wedgeBOT
:incoming_envelope: :ok_hand: applied mute to @outer silo until <t:1643295988:f> (9 minutes and 59 seconds) (reason: duplicates rule: sent 4 duplicated messages in 10s).
:incoming_envelope: :ok_hand: applied mute to @lapis sequoia until <t:1643296103:f> (9 minutes and 59 seconds) (reason: duplicates rule: sent 4 duplicated messages in 10s).
dusky dome
serene scaffold
well, I guess it depends. but True is treated as 1 and False is treated as 0, in...
mm Then i may try to replace and see how much will be effected
 stuck badge
What are some good projects in this area for beginners/intermediates in Python?
 radiant kayak
Create a program who takes an Input (a skill) and return similar skills
For example
<Python
R
SQL
Jupyter
@stuck badge
hollow sentinel
i was thinking of applying some basic hypothesis testing to the internship as well
but then i would also need access to that larger dataset
stuck badge
radiant kayak
Create a program who takes an Input (a skill) and return similar skills
Could you give another example to make sure I understand it?
stuck badge
radiant kayak
Sure
<Data science
>SQL
>Tensorflow
>Big Data
>Python
Hmm, so is this only about programming languages or is that just an example?
radiant kayak
Is an Example
If you want to go to the next level, you can relation anythinh
Like softs skills, etc
You do those types of programs with algorithms used in Data Science
Or you can use dictionaries :b
stuck badge
Ah I get it now I think
radiant kayak
Good luck
 gentle lion
Hey, does anyone know if i'm doing something wrong here: I have a big dataset of chairs that all have a specific rotation around the Z axis. I feed the 100k chair images to a CNN that should try to predict the chairs rotation. Input = chair, output is sin and cos of the chair angle. I trained a model for 36 hours and it started with a loss (mse) of about 0.5 and went all the way down to 0.009 after 150 epochs. This suggests that it made quite some improvement.
Now i save the model : py history = model.fit(train_data, epochs=epochs, validation_data=val_data, callbacks=[early], batch_size=batch_size) model.save('model_saved.h5')
here is how the data is generated from file paths: ```py train_data = train_data_generator.flow_from_dataframe( # use the dataframe to read all the actual image
dataframe=train_df,
x_col='Filepath',
y_col=['RotationSin', 'RotationCos'],
target_size=image_size_2d,
batch_size=batch_size,
subset='training',
color_mode='rgb',
class_mode='raw',
shuffle=True,
seed=44
)
val_data = train_data_generator.flow_from_dataframe(
dataframe=train_df,
x_col='Filepath',
y_col=['RotationSin', 'RotationCos'],
target_size=image_size_2d,
batch_size=batch_size,
subset='validation',
color_mode='rgb',
class_mode='raw',
shuffle=True,
seed=44
)
test_data = test_data_generator.flow_from_dataframe(
dataframe=test_df,
x_col='Filepath',
y_col=['RotationSin', 'RotationCos'],
target_size=image_size_2d,
batch_size=batch_size,
color_mode='rgb',
class_mode='raw',
shuffle=True
)```
then i load the model again and try to predict it for chairs from the test data
loaded_model = keras.models.load_model('C:\\Users\\Wouter\\Desktop\\model_saved.h5')
predicted_rotations = np.squeeze(loaded_model.predict(test_data))
true_rotations = test_data.labels
average_error = 0

for i in range(22000):

    real = math.degrees(math.atan2(true_rotations[i][0],true_rotations[i][1]))
predicted = math.degrees(math.atan2(predicted_rotations[i][0],predicted_rotations[i][1]))```now the weird thing:
after all that , the predictions on average are 90 degrees off
the maximum mistake it can make is 180 degrees off the right answer, which means 90 degrees is basically random guessing
because if it guesses random degrees in range 0 to 180 it will average 90
Does anyone see something wrong with the way i save or load my model ? its a bit weird to me that it makes a big loss improvement and still random guesses
here is how the test data looks: at the top you can see that it contains all the file paths and at bottom there are the labels (sin and cosine)
 arctic wedgeBOT
:incoming_envelope: :ok_hand: applied mute to @tiny kettle until <t:1643308712:f> (9 minutes and 59 seconds) (reason: duplicates rule: sent 4 duplicated messages in 10s).
desert oar
gentle lion
Does anyone see something wrong with the way i save or load my model ? its a bit...
if you load the model and make predictions on the validation set that you used during training, you should get the same results!
unfortunately i don't know anything about saving models in keras
 main fox
Quick pandas question, I have a df with columns A and B
I need the values in B to change if a row in A has a match with a row in array C. What would the syntax look like?
hollow sentinel
i don't either, but i can maybe point in the right direction: https://www.tensorflow.org/tutorials/keras/save_and_load

TensorFlow
desert oar
did you look at the distribution of errors? @gentle lion histogram or kde. is it possible that you saved the un-trained model and not the trained one?
desert oar
main fox
Quick pandas question, I have a df with columns A and B
I need the values in B ...
what are the dtypes? you are talking about rows and arrays, but these are individual columns of a dataframe? can you give some example data?
it sounds like a straightforward task, but i also don't fully understand what you're asking
main fox
Numerical for A and C, categorical for B
main fox
Looks right, let me try
arctic wedgeBOT
Series.isin(values)```
Whether elements in Series are contained in values.

Return a boolean Series showing whether each element in the Series matches an element in the passed sequence of values exactly.It works, thanks. I've been mostly using Excel now because of a new job and have gotten rusty in Pandas. I'm ashamed of myself lol.
 dreamy cradle
gentle lion
desert oar
did you look at the distribution of errors? <@!317291065029689355> histogram or ...
dreamy cradle
gentle lion
desert oar
did you look at the distribution of errors? <@!317291065029689355> histogram or ...
i'll try that distribution to see if it gives my any insights. I'll also add the average error prediction before i save the model so i know if i am saving it wrong
hollow sentinel
data["created_at"].dt.day_name().value_counts()
Wednesday    10556274
Thursday     10201780
Friday        8592693
Tuesday       8293590
Monday        7715902
Saturday      4163796
Sunday        2962196
i am slightly confused on how exactly i should typecast this to get this timedata onto a line graph
nvm, i think i figured most of it out
serene scaffold
hollow sentinel
i am slightly confused on how exactly i should typecast this to get this timedat...
what do you mean, typecast it?
 misty vault
hey is anyone here good with KSQL?
is it a mistake to make a huge KSQL table with hundreds of millions of rows, in a topic with thousands of partitions, and use it for joins?
hollow sentinel
serene scaffold
what do you mean, typecast it?
i meant how do i turn a series into a list, but i figured out the answer to my question by reading the documentation
hollow sentinel
i got it guys, i graphed it the number of spam calls by day
just gonna make it a bit more pretty
 brittle flower
hi yall, how come with linear regression people use Y = a + bX instead of Y = mX + b?
 iron basalt
a and b are next to each other, unlike m and b. It follows the form y = ax^0 + bx^1 + cx^2 + ....
brittle flower
ohhh so it keeps the format consistent for bendy lines?
hollow sentinel
for linear regression it is a linear combination
iron basalt
Yeah, or all are just x^1 (for linear only) (plus one x^0).
hollow sentinel
you could have y = mx + b for a linear regression
but
that isn't very realistic in the real world if you're doing linear regression
most of the times you will deal with ...+ theta(n) x(n) + a theta (0) intercept
i highly recommend statquest's videos on lin regression
iron basalt
Basically, y = mx + b makes no sense and does not extend past just that.
hollow sentinel
^
brittle flower
hollow sentinel
i highly recommend statquest's videos on lin regression
ill take a look, thanks!
hollow sentinel
np
iron basalt
It's not even a nice form at all. I recommend also getting use to the ... = 0 form.
hollow sentinel
what's not a nice form? lin regression?
iron basalt
No, y = mx + b specifically.
(If you are ever programming with lines involved (e.g. in graphics programming), you probably want the generic form Ax + By = C, as it avoids some issues (vertical lines (div by zero)))
hollow sentinel
i see
didn't know that
%matplotlib inline
plt("Days", "Number of Spam Calls By Day")

plt.ylabel("Number of Spam Calls By Day")
---------------------------------------------------------------------------
TypeError                                 Traceback (most recent call last)
<ipython-input-44-d3200255d28d> in <module>
      1 get_ipython().run_line_magic('matplotlib', 'inline')
----> 2 plt("Days", "Number of Spam Calls By Day")
      3
      4 plt.ylabel("Number of Spam Calls By Day")

TypeError: 'module' object is not callable
from matplotlib import pyplot as plt
import matplotlib.pyplot as plt
(ofc, you might as well just do the ax + by + c = 0 then, it's whatever, but makes it align more nicely with linear algebra stuff)
hollow sentinel
i tried the documentation import statement, but it still didn't work
actually, the problem might be the fact that i am passing the wrong datatype in
no, this won't work period
that is so strange
df_days_spam_calls.plot("Days", "Number of Spam Calls By Day")
when i call .plot directly on my dataframe (against the doc and using the G4G syntax), it is plotted
however when i don't, it is not plotted
because it is an object
because df_days_spam_calls["Days"] is an object
nope, that is not why

like this works
i'm gonna check out the matplotlib doc
hollow sentinel
iron basalt
(ofc, you might as well just do the `ax + by + c = 0` then, it's whatever, but m...
agreed
lapis sequoia
What is inference cost? if you reply to this, pls use reply
hollow sentinel
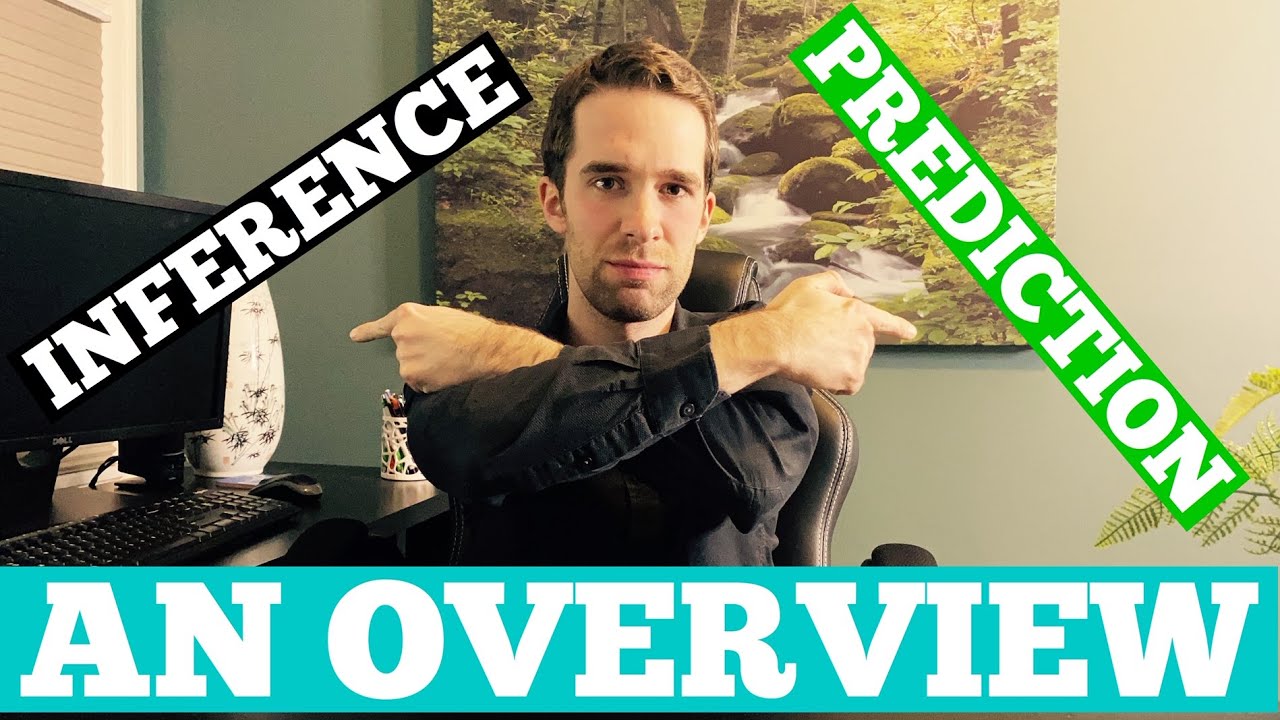
Subscribe to RichardOnData here: https://www.youtube.com/channel/UCKPyg5gsnt6h0aA8EBw3i6A?sub_confirmation=1
In this video I go over the difference between inference and prediction, in the statistical modeling and machine learning context.
It happens all the time - clients have requests to incorporate machine learning and/or statistical model...
ooh sorry i should've hit reply
my b
lapis sequoia
Now that you've seen batch processing of static data, now let's explore what it looks like with time-series data or other data types that are updated frequently and which you need to read in as a stream.
What's stream here?
hollow sentinel
idk bro
lapis sequoia
@hollow sentinel Do you know what's inference cost?
hollow sentinel
"Inference is the process of making predictions using a trained ML model"
another definition i saw was "Machine learning (ML) inference is the process of running live data points into a machine learning algorithm (or “ML model”) to calculate an output such as a single numerical score."
and this is why we read documentation ladies and gentleman
lapis sequoia
hollow sentinel
"Inference is the process of making predictions using a trained ML model"
Yeah, but what's inference cost? Is that how much you need to paid for hardware so good hardware can provide complex model who can provide good predictions?
hollow sentinel
i'm not sure, sorry
hollow sentinel
i did it guys, i crunched it by week number as well as by day
the next thing would be to crunch it by hour and graph it
there's something really weird going on and i think the ceo is going to be very interested
 quiet vault
lapis sequoia
Yeah, but what's inference cost? Is that how much you need to paid for hardware ...
quiet vault
lapis sequoia
Yeah, but what's inference cost? Is that how much you need to paid for hardware ...
I guess it is the amount of computational power it takes to make an inference
not sure though
@lapis sequoia
 cyan basin
hey guys
is anyone able to explain to me how do I read those std values? I know that standard deviation mean an average distance between a point and mean
but how exactly do I read it here?
what does 2.0 of std mean in relation to -119 mean?
should I read it as there are points that on average are distanced from the mean of 2 units?

meaning that on average points have usually values of -117 and -121?
or to put it better - they tend to deviate from the mean on average to the points of -117 or -121?
lapis sequoia
hollow sentinel
i did it guys, i crunched it by week number as well as by day
What you mean by "crunch" and what did you crunch?
hollow sentinel
well, i extracted weeks out the datetime column , summed up the number of spam calls per week, and graphed them. showed a really interesting peak around week 49 of the calendar year 2021
lapis sequoia
cyan basin
hey guys
is anyone able to explain to me how do I read those std values? I know ...
if it's 2, I'd say your distribution is fairly near to mean. as the std/variance increases, the distribution is more.... varied or say has comparatively a bigger range.
assuming the std is 0, that means basically your whole distribution is weighted on mean itself.
 quick kestrel
guys i am new to data science, where should i start learning from in order to learn data science
stone marlin
Gawds, I am going through the t-SNE paper, because I thought I could ween a better idea of when to use it --- it's not an easy paper, sheesh.
 prisma mist
when you learn data science in python and get in a university that uses R 😑
quick kestrel
prisma mist
when you learn data science in python and get in a university that uses R 😑
lol
rip
 dusk tide
Anyone can suggest a good beginner friendly book for ML with maths also??
prisma mist
called api on imports data instead of exports because forgot to change a parameter value from a 1 to a 2

i dum
never viewing an api again without 3 cups of coffee . while cups_count < 4: drink coffee ; cups_count += 1
 azure orchid
anyone whoo know AI Voice Assistant ??
 odd meteor
prisma mist
when you learn data science in python and get in a university that uses R 😑
odd meteor
prisma mist
when you learn data science in python and get in a university that uses R 😑
Unfortunately I can't pretend to be indifferent about this ... I just realized Ludwig Maxmillian University uses R for its graduate school program instead of Python. I know it's good to be language agnostic but I'm heart broken .... 😂 😂
prisma mist
odd meteor
Unfortunately I can't pretend to be indifferent about this ... I just realized L...
continued usage of python would be beneficial in other areas such as web development (eg for data mining)... you also get used to zero indexed counting so a non-zero index language presents a minor pause
 coarse umbra
what is the best, tensorflow or scikit learn??
odd meteor
cyan basin
hey guys
is anyone able to explain to me how do I read those std values? I know ...
Remember in Statistics, variance, just like the name reads accounts for variability. It's the average of the squared difference from the mean (-119.57)
Standard Deviation on the other hand is simply the square-root of Variance. So whenever you ask the question:
At which extent does my data varies from the mean?, computing the Standard Deviation answers that for you. So for example, are all scores somewhat closer to the mean of the longitude or are they below the mean score (-119.57)? You can see your S.D = ~2.00
In essence, Standard Deviation tells you how spread out your data is.
Meanwhile, Variance & Standard Deviation are both measures of dispersion in Statistics.
lapis sequoia
In essence, Standard Deviation tells you how spread out your data is. in a nutshell🌻
lapis sequoia
Is there any GUI tool for testing opencv HSV masks?
 shrewd saddle
could someone point me to an example of using CNN to classify the pixels of an image into categories ( satellite image land cover for example)
One example I found online used Conv1D on a 204 band data, but I only have 7 bands, and I am not sure if Conv1D considers neighboring pixels to make prediction.
 toxic hollow
Hey Quick question, Do I need to learn SQL for database management if I am going to study AI?
hollow sentinel
well there are databases for in-database machine learning
but you should know basic sql at least anyways
SQLBolt provides a set of interactive lessons and exercises to help you learn SQL
i can recommend this
a_new_series = data["created_at", "is_blocked"]
i believe this should work
it's from this documentation
!pastebin
arctic wedgeBOT
Pasting large amounts of code
If your code is too long to fit in a codeblock in discord, you can paste your code here:
https://paste.pythondiscord.com/
After pasting your code, save it by clicking the floppy disk icon in the top right, or by typing ctrl + S. After doing that, the URL should change. Copy the URL and post it here so others can see it.
hollow sentinel
ah i think i figured it out
documentation saves me again
if you are taking specific cols out of a dataframe, you need it in a 2d list, not a 1d list
serene scaffold
toxic hollow
Hey Quick question, Do I need to learn SQL for database management if I am going...
I wouldn't make it a high priority, but it's quite likely that you would use SQL in your career. And even if you don't use SQL specifically, you're going to become familiar with tabular/relational data pretty quickly, so you'd be learning a lot of the same concepts.
 dry hatch
Panda is good too
lapis sequoia
do we have function similar to randint in numpy which kind of follows normal distribution instead of uniform?
arctic wedgeBOT
random.normal(loc=0.0, scale=1.0, size=None)```
Draw random samples from a normal (Gaussian) distribution.

The probability density function of the normal distribution, first derived by De Moivre and 200 years later by both Gauss and Laplace independently [[2]](https://docs.scipy.org/doc/numpy/reference/random/generated/numpy.random.normal.html#rf578abb8fba2-2), is often called the bell curve because of its characteristic shape (see the example below).

The normal distributions occurs often in nature. For example, it describes the commonly occurring distribution of samples influenced by a large number of tiny, random disturbances, each with its own unique distribution [[2]](https://docs.scipy.org/doc/numpy/reference/random/generated/numpy.random.normal.html#rf578abb8fba2-2).

Note

New code should use the `normal` method of a `default_rng()` instance instead; please see the [Quick Start](https://docs.scipy.org/doc/numpy/reference/random/index.html#random-quick-start).hm but this will give floats right?
hollow sentinel
i have an idea, but i'm not sure if it's going to work

what i want to do is take the day and see if it it has a 1 in the is_blocked col
so i would end up with like a dictionary of {"Wednesday": x, "Monday": y, etc.}
lapis sequoia
 calm thicket
that should be fine, probably
calm thicket
that should be fine, probably
hm lets say I have some N as 10, I basically want more numbers generated around 5 and less on 0 to 10.
(i mean imagine bell curve around 5)
now i can take this function and give mean as 5, but what about sigma/std which makes sure that I don't fall out of 10 and 0.
calm thicket
you can't make sure that the values never go out of the range, but you can do mafs™️ to make it really unlikely
well actually you can, if you just remove all the elements that go out, but that's cheating
lapis sequoia
yeah that's kinda cheating since we are gonna spacify some number of elements.
hollow sentinel
ok here's my idea
i drop the values in that is_blocked col that are equal to zero
i then sum up the amount of times each weekday appears
lapis sequoia
why not just group them by is_blocked and day? you're done.
hollow sentinel
let me try it again
calm thicket
lapis sequoia
hm lets say I have some N as 10, I basically want more numbers generated around ...
if you make the std dev 1.25, something like 99.99% of data will be within the range
lapis sequoia
calm thicket
if you make the std dev 1.25, something like 99.99% of data will be within the r...
I see, what is calculation of 1.25 here?
calm thicket
99ish % of values fall within 4 std devs, so just 5/4
hollow sentinel
99ish%... within 4stdevs?
calm thicket
probably
hollow sentinel
are we talking about normal dists
i thought it was the 68-95-99 rule
ohhh
i'm being dumb sorry
lapis sequoia
hollow sentinel
i thought it was the 68-95-99 rule
what is 68-95-99? also yes, normal distributions.
hollow sentinel
68% of the data is within one stdev
95% of the data is within two stdevs
99.7% is within three stdevs
anything outside of two stdevs (positive or negative 2) of the mean for a normal distribution is considered unusual
lapis sequoia
calm thicket
99ish % of values fall within 4 std devs, so just 5/4
wait wait, 1.25 is not... constant right? can you explain again, how?
hollow sentinel
did i derail the chat
 calm thicket
lapis sequoia
wait wait, 1.25 is not... constant right? can you explain again, how?
calm thicket
lapis sequoia
wait wait, 1.25 is not... constant right? can you explain again, how?
no. you want it to stay within 0-10, the mean is 5. if you make the std deviation 1.25, then 0 is 4 std dev away
lapis sequoia
I'm sorry but I'm lost.
calm thicket
which part
dry hatch
What is standard deviation?
lapis sequoia
if you make the std deviation 1.25, then 0 is 4 std dev away
okay so basically N/(2*4) should be my std?
calm thicket
sure
lapis sequoia
oh okay, let me just see if I have not mistaken. So basically if we want very less chances of some number not coming in distribution(thinking like a border(fuzzy border)), we choose std as (mean-the_number)/4
which is theoretically (4th std??) which puts 99% of points before it.
i know this is not 100% right
calm thicket
it's not about the mean, it's the mean - the_border, it's just in this case, the lower border is 0
lapis sequoia
yeah which is why i put mean-the_number
lapis sequoia
 calm thicket
yeah yeah 😔
lapis sequoia
ah i see. makes sense. I will need to have better theory on it.
shrewd saddle
how can i make a custom discrete colour map in matplotlib (mapping each number to a custom color)?
lapis sequoia
hm I just ran some tests with 10_000 points over 1000 for some N times, seems like fairly fine result after converting to int too.! thanks a lot @calm thicket
 lapis sequoia
What I am about to say might be controversial but I am very curious. Wouldn't AI and ML is very useful for military purposes?
For example you can feed it bunch of data on terrain, weather, best tactics for those situations, etc. And let it make an effecient strategy for example to win or to minimalize casualties
hollow sentinel
they most likely already have stats that predict that
lapis sequoia
Interesting
lapis sequoia
Say, if you need to choose, would you rather make the AI predict as much way as possible and make a short prediction or let the AI pick the few options with high probability and go in-depth to it?
hollow sentinel
what do you mean by "predict as much ways as possible"?
lapis sequoia
Basically predict what to do if the enemy do something, it is short but would be very precise, from the worst case to the best case scenario
In the latter option, the AI would predict a few paths what is the most likely thing the other side will do and go in-depth on those paths
hollow sentinel
i think this question might exceed my own knowledge at this point
lapis sequoia
I am just interested what you would think since I have been thinking about this
desert oar
lapis sequoia
What I am about to say might be controversial but I am very curious. Wouldn't AI...
i would be surprised if there wasnt someone at the DoD working on stuff like this since the 1980s or before
desert oar
the problem is that it probably wont work well
hollow sentinel
with deep learning
desert oar
hollow sentinel
it sounds like chess games
well no: it's nothing like chess, and that's the problem
lapis sequoia
The problem with the latter is AI can't really predict a single human but rather a community as a whole.
desert oar
it's superficially like chess
but really you are asking to build a "reality simulator"
we aren't there yet
hollow sentinel
i see
desert oar
deep reinforcement learning + clever techniques like the ones used in alphago have so far proven to give excellent results on increasingly complicated game-like scenarios
playing dota, for example. and starcraft i believe as well
but those are still simulated game worlds with finite knowable rules, designed by humans for humans to enjoy
hollow sentinel
and games don't apply to real life
desert oar
because the real world is significantly messier
look at how difficult robotics is
getting a metal dog to climb stairs is still state of the art
getting a robot to move boxes around a warehouse is cutting edge
so yeah theoretically it might be possible to train some kind of agent on some kind of simulator
but we arent "there yet" and probably won't be for a while
we seem to be running into limitations of computing power and energy requirements
so in order to scale up further we might need to figure out how to compute more efficiently
neural networks are kind of "stupid" with respect to modeling actual brains
nothing like a real brain
lapis sequoia
desert oar
so in order to scale up further we might need to figure out how to compute more...
Quantum computing perhaps?
desert oar
and the computing power of an animal brain is orders of magnitude greater than any "ai" we have developed so far
my impression of quantum is that you can do massively parallel computations (good for deep learning) but that the computers need to be highly specialized for the task and can't move anywhere, because that would mess up the quantum stuff
so maybe... but not any time soon
desert oar
hollow sentinel
facebook meta ai 😡
marketing
desert oar
isnt it just like a vr platform?
serene scaffold
when I took theory of computation (Turing machines and stuff), the professor said that quantum computing would fundamentally change theory of computation. but as far as I can tell, quantum computing doesn't introduce a new model of computation, it's just faster.
desert oar
serene scaffold
when I took theory of computation (Turing machines and stuff), the professor sai...
it might, in terms of what instructions you will have available to you in a "quantum cpu"
von neumann architecture etc
serene scaffold
well, von neumann architecture isn't part of theory of computation, either
in order to change the theory of computation, quantum computers would need to be able to solve problems that are undecidable by Turing machines.
lapis sequoia
Do you guys think those graphs that predict AIs will get a sharp incline on breakthrough and we will get AGI in [insert year] is real or not?
hollow sentinel
yeah uh ^
lapis sequoia
Artificial General Intelligence, basically a AI almost if not as smart as humans
hollow sentinel
desert oar
marketing
agreed
serene scaffold
lapis sequoia
Artificial General Intelligence, basically a AI almost if not as smart as humans
what would it even mean for an AI to be "as smart as a human"? what are all the tasks that such an AI would need to be able to perform? how would we measure how well it does them?
lapis sequoia
There are some tests I think, mostly simple stuff like can it order a coffee
Let me whip it out from wikipedia
lapis sequoia
Tests for confirming human-level AGI Edit
The following tests to confirm human-level AGI have been considered:[15][16]
The Turing Test (Turing)
A machine and a human both converse unseen with a second human, who must evaluate which of the two is the machine, which passes the test if it can fool the evaluator a significant fraction of the time. Note: Turing does not prescribe what should qualify as intelligence, only that knowing that it is a machine should disqualify it.
The Coffee Test (Wozniak)
A machine is required to enter an average American home and figure out how to make coffee: find the coffee machine, find the coffee, add water, find a mug, and brew the coffee by pushing the proper buttons.
The Robot College Student Test (Goertzel)
A machine enrolls in a university, taking and passing the same classes that humans would, and obtaining a degree.
The Employment Test (Nilsson)
A machine performs an economically important job at least as well as humans in the same job.
serene scaffold
The way AI is portrayed in the media is wrong. Programs that use AI do specific tasks.
hollow sentinel
i actually wrote an essay on this
for my writing class last sem
not that ai is smarter than humans
just the overall misconception about ai and ml in the general public
i mean opinions range from "it's all if conditions" to "skynet"
serene scaffold
A chat bot that can pass the Turing test after long conversations is going to be far off. But a chat bot that can pass the Turing test isn't necessarily going to be able to do a lot of the things that we want AIs to be able to do.
lapis sequoia
serene scaffold
The way AI is portrayed in the media is wrong. Programs that use AI do specific ...
Well there are some AIs that are mewnt to do certain task but there are general AIs that are meant to be "smart AIs"
hollow sentinel
we are a long way from skynet lol
lapis sequoia
I hope skynet level super AI never will be achieved lol
 sharp radish
Hey! In pandas how can i sum 2 columns from different dataframes? I'm getting the error "cannot reindex from a duplicate axis"
lapis sequoia
sharp radish
Hey! In pandas how can i sum 2 columns from different dataframes? I'm getting th...
No clue so I can't help, sorry mate
serene scaffold
sharp radish
Hey! In pandas how can i sum 2 columns from different dataframes? I'm getting th...
yes, but it does addition between rows with the same index, so if the indices of both columns aren't equivalent, you have to know what fill value you want.
serene scaffold
lapis sequoia
No clue so I can't help, sorry mate
the question was posed to the whole channel; you can ignore general questions that you don't know how to help with in any way, as adding more messages to the channel moves the question off-screen faster.
lapis sequoia
Yeah but i feel kind of bad to ignore it
sharp radish
serene scaffold
yes, but it does addition between rows with the same index, so if the indices of...
I got the same index on the rows:
lapis sequoia
I wanted to ask about something but got a moral dilemma if the guy would feel ignored if i just instantly do so
serene scaffold
lapis sequoia
Yeah but i feel kind of bad to ignore it
if you can't help answer the question, or help them better expose the question, ignoring it is the best way you can help the asker.
sharp radish
This is df 1:

This is df 2:

I want to sum a column that doesn't appear but it's the same name on both, "diff"
serene scaffold
@sharp radish the only way I will look at dataframes is print(df.head().to_dict('list')), though it might be possible to address your question without looking at them.
can you give the whole error message and the line of code that caused it?
sharp radish
sure, can i send it through private message?
arctic wedgeBOT
Here's how to format Python code on Discord:
```py
print('Hello world!')
```
These are backticks, not quotes. Check this out if you can't find the backtick key.
sharp radish
ok!
serene scaffold
I have to leave in seven minutes, btw
sharp radish
def closest_vote(sheet):
  df = pd.read_excel("C:/Users/joaof/Downloads/fichasSantaMartaPortuzelo/Mazedo/test.xlsx", sheet_name="{}".format(sheet), index_col=0)
  partidos = list(df.columns.difference(["Freguesia","inscritos","votantes","brancos","nulos"]))

  df2 = pd.read_excel("C:/Users/joaof/Downloads/fichasSantaMartaPortuzelo/Mazedo/test.xlsx", sheet_name="{}".format(2016), index_col=0)
  partidos2 = list(df2.columns.difference(["Freguesia","inscritos","votantes","brancos","nulos"]))

  for partido in partidos:
    df[partido] = df[partido] / df["votantes"] * 100
    df["diff_{}".format(partido)] = (df[partido] - df[partido].iloc[0])**2

  for partido in partidos2:
    df2[partido] = df2[partido] / df2["votantes"] * 100
    df2["diff_{}".format(partido)] = (df2[partido] - df2[partido].iloc[0])**2

  df["diff"] = df.filter(regex="diff_").sum(axis=1)
  df2["diff"] = df2.filter(regex="diff_").sum(axis=1)

  df["sum"] = df["diff"]+df2["diff"]

  #df.to_csv("C:/Users/joaof/Downloads/fichasSantaMartaPortuzelo/Mazedo/out{}.csv".format(sheet))
  df = df.sort_values(by=["sum"])


  results = df[partidos]#.head(10)
  return results
``` this is my codeY not use loops ...
arctic wedgeBOT
Hey @sharp radish!
You either uploaded a .txt file or entered a message that was too long. Please use our paste bin instead.
serene scaffold
dry hatch
Y not use loops ...
well, you should avoid loops as much as possible when you're working with dataframes
sharp radish
dry hatch
serene scaffold
well, you should avoid loops as much as possible when you're working with datafr...
Yeah , so true
sharp radish
this is the traceback
serene scaffold
@sharp radish looks like at least one key appears more than once within one of the dataframes
>>> df1
     x  y
a    1  2
a    3  4
b    5  6

>>> df2
    x  y
a   7  8
b   9  10
c   11 12
Use panda , Lol
sharp radish
hmmm ok, thanks! Do I have a way to see which one?
serene scaffold
suppose you have these two dataframes. if you do df1['x'] + df2['x'], which rows from df1 should you add to a 7 8 in the other one? pandas can't decide that for you.
dry hatch
Panda will, i think...
serene scaffold
sharp radish
hmmm ok, thanks! Do I have a way to see which one?
you can do df.index.value_counts()
serene scaffold
dry hatch
Panda will, i think...
yes, they're asking how to do it, specifically...
serene scaffold
serene scaffold
you can do `df.index.value_counts()`
you can see which one has a value count greater than one.
@sharp radish also, be mindful of cases like the c row in df2. pandas won't know what to do with that, either, since it doesn't have a match in df1.
dry hatch
That's what u think hehe, k. Bye
sharp radish
serene scaffold
suppose you have these two dataframes. if you do `df1['x'] + df2['x']`, which ro...
i'm working with a dataframe where in the rows we got the name of locations and in columns we got the political parties name. So i added a dif column that makes a calculation with all of the values in that row and sums that to give dif the value. I have 2 elections so I want to sum the 2 dif value to sort the df!
The locations don't change from one to another, so I don't know how to do it
serene scaffold
sharp radish
i'm working with a dataframe where in the rows we got the name of locations and ...
I'm in a meeting now but there's definitely an easier way to do it than what you showed in the code earlier
if you do print(df.head().to_dict('list'), df.head().index) for each one, and give the result in the chat as text, I will look at it later.
sharp radish
Ok, thank you!!
 grave frost
lapis sequoia
Basically predict what to do if the enemy do something, it is short but would be...
grave frost
lapis sequoia
Basically predict what to do if the enemy do something, it is short but would be...
you could - but you just don't need to
overall politics and predictions are handled very well by intel depts. in most countries
along with intra-agency communications like FVEY, the infrastructure is enough to decide whether Russians deploying a percentage of their troops at a location is enough to decide whether they would like to invade said country.
 tall fern
hello
grave frost
lapis sequoia
Do you guys think those graphs that predict AIs will get a sharp incline on brea...
mostly around 2040-2070
that's based on some researchers' papers. They're arguments aren't perfect, but the ballpark seems reasonable for most of the scientific community
Schmidhuber for instance, predicts 2040. Seeing the progress rn, we would definitely be very close
The thing is though, once you actually start researching all the arguments - things start to become very ambigous. In the end, its always "we'll see"
serene scaffold
@sharp radish my meeting is ending soon. remember to print the dataframes using the code I gave you if you want to continue.
 fluid sigil
anyone know a way to plot time series data this way? I think it's called an array of plots, but as opposed to subplots there is no separation in between them.

 shell depot
hello guys
Please if you have any idea about a machine learning algorithm that can detect abbreviation meaning
e.g: ADJ -> stands for Adjectif
robust jungle
Does anyone know of any guides on how to better understand ML?
 mild dirge
shell depot
e.g: ADJ -> stands for Adjectif
mild dirge
shell depot
e.g: ADJ -> stands for Adjectif
This doesn't seem like a machine learning task, maybe if one abbreviation can have multiple meanings and you want the most probable one given the context
but abbreviation by itself would not make sense
 neat skiff
Hi all, question about pandas:
So if I want to use apply multiple times to create multiple columns in a dataframe, currently I think it iterates through the entire dataset for every apply? Is there any way to combine them so that the program iterates through all the data only once?
serene scaffold
neat skiff
Hi all, question about pandas:
So if I want to use `apply` multiple times to cre...
I would first figure out if there's a better way to do it than apply, since apply doesn't benefit from any of pandas' optimizations.
you can make a function (either using def or with lambda) that does everything, and apply that.
what are you trying to do anyway?
desert oar
neat skiff
Hi all, question about pandas:
So if I want to use `apply` multiple times to cre...
yes, it iterates and also makes a copy for every apply operation. an engine like spark or dask might be able to optimize repeated apply-like operations into a single pass over the data
if data size is a concern, combine as much logic as you can into a single apply. but this kind of breaks the elegance of the pandas dataframe model, so use it only when necessary as an optimization
see also numexpr for another way to "compile" sequential pandas operations into a single efficient pass over the data
!pypi numexpr
arctic wedgeBOT

Fast numerical expression evaluator for NumPy
desert oar
but of course it only supports a specific set of numerical operations, and does not support arbitrary row-wise function application
finally, if you do need to do several passes of row-wise operations, consider not using a data frame! a list of dicts might be a better data structure for that kind of data processing, you can always convert it to a data frame later
stone marlin
This came up in that stats channel yesterday, so I wanted to ask the smarties here:
I'm familiar with most of the dim-reduction techniques, but I'm not great at knowing when to apply things other than PCA. Generally, I try to trim dimensions first and then get it to a place where PCA works nicely. Having said that, there are other things like UMAP and LDA and t-SNE.
General Question: When looking at a dataset, how do you choose what dim-reduction thing you go with? Do you have a preference for one-or-the-other in certain situations?
neat skiff
@serene scaffold and @desert oar , thanks for the comments! A couple of points/comments to answer:
- "what are you trying to do anyway?" - I'm defining a couple of derived columns that are calculated based on conditions on multiple other columns. But they involve string checking for the other columns, so I just put them all into a function
- "better way to do it than
apply- currently I'm defining a function for every apply I want to do, and it's just all of the formdf[a] = df.apply(do_a, ...) - "an engine like spark or dask might be able to optimize" - interesting! I suppose pandas doesn't try to maintain context between operations
- "if data size is a concern, combine as much logic as you can into a single apply" - it's not right now, the dataset is really small, total size is about 25MB :D. I was just curious if there was a pattern for this kind of thing, since it seems like it should be a common occurrence
neat skiff
desert oar
finally, if you do need to do several passes of row-wise operations, consider no...
that's really interesting! I just assumed that dataframes would have any and all of the optimizations. Why exactly would a list of dicts help? Wouldn't we need to implement the helper code to iterate through the list as well? Would that be faster?
serene scaffold
I'm defining a couple of derived columns that are calculated based on conditions on multiple other columns. But they involve string checking for the other columns, so I just put them all into a function
it's possible that you can use this using pandas' data model (ie, not with apply), but I would need to know exactly what the data looks like and what you're trying to do
The only format I accept for that is print(df.head().to_dict('list'))
neat skiff
serene scaffold
The only format I accept for that is `print(df.head().to_dict('list'))`
Do you mean the way you'd like the sample data presented?
serene scaffold
neat skiff
Do you mean the way you'd like the sample data presented?
yes, that way it can be copied and pasted verbatim.
neat skiff
Ah, gotcha, I'll be back
serene scaffold
if the index is of interest, df.head().index as well. though it doesn't really matter if it's a range index.
arctic wedgeBOT
Hey @neat skiff!
You either uploaded a .txt file or entered a message that was too long. Please use our paste bin instead.
odd meteor
stone marlin
This came up in that stats channel yesterday, so I wanted to ask the smarties he...
I've not used UMAP before so idk about it.
LDA is kinda same with PCA in the sense that they're both used to perform linear transformation. However, LDA is majorly used for supervised learning and PCA for unsupervised learning task.
Unlike PCA and LDA, t-SNE belongs to the Manifold learning. Manifold Learning is an approach used for non-linear dimensionality reduction.
Algorithms for this kinda task are based on the idea that dimensionality of many data sets is only artificially high.
So t-SNE is one of the commonly used manifold learning algorithms used to visualize high dimensional data in one, two, or three dimensional space.
Other manifold learning algorithms can be found here https://scikit-learn.org/stable/modules/manifold.html
scikit-learn
Look for the bare necessities, The simple bare necessities, Forget about your worries and your strife, I mean the bare necessities, Old Mother Nature’s recipes, That bring the bare necessities of l...
stone marlin
Yeah, I'm mostly familiar with what they are, I guess I was more curious about how y'all actually use them. I've got this terrible habit where I start with a dataset and if it's got targets I try LDA and PCA, and if it doesn't, I just use PCA. Haha.
That's interesting re: artificially high, I didn't think of this being a determining factor. I like that idea.
neat skiff
serene scaffold
if the index is of interest, `df.head().index` as well. though it doesn't really...
Data has 365 columns, so attached as a paste bin: https://paste.pythondiscord.com/eqimuvegiv.pl
 grizzled stirrup
What is the best package to begin building linear/logistic regression models in Python? Or is R more suited for this type of thing?
neat skiff
neat skiff
Data has 365 columns, so attached as a paste bin: https://paste.pythondiscord.co...
Also the kind of function that I apply looks something like this:
def getFirstPatchDateApply(row) -> Optional[str]:
    """
    Get first patch date from list of attachments for an issue
    """

    attachments = row[ATTACHMENT_COLUMNS]
    firstPatchDate = None
    for atmt in attachments:
        if not pd.isna(atmt):
            try:
                patchName = getAttachmentName(atmt)
                match = re.match(f"YARN-.*1.patch", patchName)
                if not match:
                    continue

                patchDate = getCommentOrAttachmentDate(atmt)
                if firstPatchDate is None or (
                    pd.to_datetime(firstPatchDate) > pd.to_datetime(patchDate)
                ):
                    firstPatchDate = patchDate
            except IndexError:
                continue

    return firstPatchDate
Thanks for taking a look!
odd meteor
stone marlin
Yeah, I'm mostly familiar with what they are, I guess I was more curious about h...
I also think people use t-SNE because it's much more advanced than PCA, and perhaps, because it could be used to atone for the deficiency of PCA.
stone marlin
I've been reading the papers for t-SNE and UMAP, and it seems like a lot of t-SNE is about visualization. I dunno. But yeah, that could be --- manifold methods seem to be pretty good in certain situations, I've still got a lot to learn. But dang, those papers are pretty dense.
hollow sentinel
data["created_at"]
a_new_series = data[["created_at", "is_blocked"]]

a_new_series["day"] = data["created_at"].dt.day_name()

# a_new_series["Week #"] = data["created_at"].dt.isocalendar().week

a_new_series.groupby[a_new_series.is_blocked==1].day()
# weeks = a_new_series["created_at"].dt.week
 tropic pawn
I know how classification works in python. I created 2 projects with simple classification to choose 1 of 10 classes for each sample. But now I want to move forward and make a project to find specific sounds in a file. For example. Check that "shooting sound' is present in a file? (Yes or No) . I have no idea how to start. Please help or give some advice. Thank you in advance 🙂
hollow sentinel
hm i believe i think it's bc i used brackets
according to the doc
---------------------------------------------------------------------------
AttributeError                            Traceback (most recent call last)
<ipython-input-39-cd33da3af809> in <module>
      4 a_new_series["day"] = data["created_at"].dt.day_name()
      5
----> 6 a_new_series.dtype
      7
      8 # a_new_series["Week #"] = data["created_at"].dt.isocalendar().week

~/opt/anaconda3/lib/python3.7/site-packages/pandas/core/generic.py in __getattr__(self, name)
   5272             if self._info_axis._can_hold_identifiers_and_holds_name(name):
   5273                 return self[name]
-> 5274             return object.__getattribute__(self, name)
   5275
   5276     def __setattr__(self, name: str, value) -> None:

AttributeError: 'DataFrame' object has no attribute 'dtype'
doesn't that mean that it is a dataframe?
serene scaffold
hollow sentinel
doesn't that mean that it *is* a dataframe?
yes; are you not familiar with attribute errors and how to read their messages?
the attribute you're looking for is dtypes
hollow sentinel
no i was just trying to check my sanity
iron basalt
lapis sequoia
What I am about to say might be controversial but I am very curious. Wouldn't AI...
https://en.wikipedia.org/wiki/Game_theory yeah it's been a thing for a long time now (1950s is when it really took off and played a huge role in the cold war)

Game theory is the study of mathematical models of strategic interactions among rational agents. It has applications in all fields of social science, as well as in logic, systems science and computer science. Originally, it addressed two-person zero-sum games, in which each participant's gains or losses are exactly balanced by those of other par...
 hollow escarp
Hi , im using sqlite3 and i used the type DATE it return me unix but i dont know how to convert date to this unix
int((datetime.now() + relativedelta(hours=6)).timestamp()) this not works
hollow sentinel
my problem is figuring out how to use this groupby method
i need to somehow write it to count with both columns given a condition the is_blocked has to be 1 for each weekday
maybe i can use a .filter(lambda)
a_new_series.groupby("day").filter(lambda x: x == 1).value_counts()
something like this?
i feel like i'm just needlessly complicating this
what i want is each weekday with the amount of spam calls
hollow escarp
hollow escarp
Hi , im using sqlite3 and i used the type DATE it return me unix but i dont know...
??
iron basalt
desert oar
getting a metal dog to climb stairs is still state of the art
As someone who works in robotics, it's very hard to explain that making a dog walk up stairs is more difficult than an AI that can beat any human at chess or high level resource allocation / management. It has the interesting implication that if robots replace humans for jobs, the last thing to go would be something like the air condition repairer that comes to your house. For non-AI tasks that are repetitive, stuff that exists in a constrained / simplified environment, robots are already useful (the robot arms in factories), but as soon as it becomes slightly messy they fail hard (like the robot arm grabbing arbitrary object problem trying to be solved by many right now).
(it's even worse if the environment is dynamic)
hollow sentinel
i'm so stuck rn
iron basalt
(basically, reality is really complicated and stuff like chess is a very nice simple "universe" of its own (in the case of chess it's even nicer because it's turn based and both players have perfect knowledge of the universe (they see everything / no hidden state)))
(introducing hidden state already makes the problem many orders of magnitude more difficult, the best starcraft AIs can only win by cheating in that they have super human reflexes / timing and can compute some stuff really fast like the sum total damage output of their units, however, when a player uses a novel strategy they fail hard (again not constrained), the only way it could deal with this is either having already seen it, or (as humans do) adapt on the fly (online learning, etc))
(starcraft also has many things like micro strats that can't be beat, but can only be really pulled off by a bot, a human has a limited input channel with the game (keyboard / mouse), and humans can only track so many objects (which some animals can do better than humans))
arctic wedgeBOT
:incoming_envelope: :ok_hand: applied mute to @tame knoll until <t:1643410314:f> (9 minutes and 59 seconds) (reason: duplicates rule: sent 4 duplicated messages in 10s).
hollow sentinel
data["created_at"]
a_new_series_2 = data[["created_at", "is_blocked"]]

a_new_series_2["week"] = data["created_at"].dt.isocalendar().week

a_new_series.dtype

df_blocked_by_week_num = a_new_series_2[a_new_series_2["is_blocked"]==1]

df_blocked_by_week_num.shape


df_blocked_by_week.groupby(by = df_blocked_by_week).count()
---------------------------------------------------------------------------
AttributeError                            Traceback (most recent call last)
<ipython-input-32-0f458f2c2d77> in <module>
      4 a_new_series_2["week"] = data["created_at"].dt.isocalendar().week
      5
----> 6 a_new_series.dtype
      7
      8 df_blocked_by_week_num = a_new_series_2[a_new_series_2["is_blocked"]==1]

~/opt/anaconda3/lib/python3.7/site-packages/pandas/core/generic.py in __getattr__(self, name)
   5485         ):
   5486             return self[name]
-> 5487         return object.__getattribute__(self, name)
   5488
   5489     def __setattr__(self, name: str, value) -> None:

AttributeError: 'DataFrame' object has no attribute 'dtype'
i upgraded pandas to v 1.3.5 bc i thought that was the reason
i read the documentation for .isocalendar and googled applications of it
but it still won't work
yeah, i'm stumped
it could potentially be because isocalendar doesn't work on a dataframe and instead works on a series
---------------------------------------------------------------------------
AttributeError                            Traceback (most recent call last)
<ipython-input-33-a8635dbc2ef6> in <module>
      3
      4
----> 5 a_new_series_2 = data["created_at"].isocalendar()
      6 # a_new_series_2["week"] = data["created_at"]
      7

~/opt/anaconda3/lib/python3.7/site-packages/pandas/core/generic.py in __getattr__(self, name)
   5485         ):
   5486             return self[name]
-> 5487         return object.__getattribute__(self, name)
   5488
   5489     def __setattr__(self, name: str, value) -> None:

AttributeError: 'Series' object has no attribute 'isocalendar'
it still won't work
aaand airball still won't work
sigh
i'm gonna go hit the gym
are you kidding me
are you kidding me pandas
 agile cobalt
AttributeError: 'DataFrame' object has no attribute 'dtype'
usedf.dtypesto check the data type of each column in a dataframe
AttributeError: 'Series' object has no attribute 'isocalendar'
weird,pandas.__version__shows 1.3.5 in that notebook?
if you used the ""global"" pip, then it may not reflect the version your Anaconda environment's using
serene scaffold
@hollow sentinel before you had data["created_at"].dt.isocalendar().week
and then you did data["created_at"].isocalendar()
and you got AttributeError: 'Series' object has no attribute 'isocalendar'

well, I don't think either of those is supposed to work
did you look for instances of isocalendar in the pandas docs?
agile cobalt
yeah, it should be pandas.Series.dt.isocalendar().week
<#help-corn message>
 flat sable
hello folks i just wondering wich of these two courses shoud i start with

Udemy
Learn Data Science, Data Analysis, Machine Learning (Artificial Intelligence) and Python with Tensorflow, Pandas & more!
or this
Udemy
Learn how to use NumPy, Pandas, Seaborn , Matplotlib , Plotly , Scikit-Learn , Machine Learning, Tensorflow , and more!
serene scaffold
@flat sable just going by the titles, the second one looks like it might be more generally applicable.
flat sable
serene scaffold
<@!401953390042677261> just going by the titles, the second one looks like it mi...
thank you
serene scaffold
are you going to give it back?
 oak olive
Give it back?
oak olive
I was just wondering if doing it using Octave was really worth it?
Maybe doing the same stuff in python would be more beneficial
But of course, I am an ignorant, you would probably give nice suggestions
serene scaffold
what even is octave
oak olive
A strange programming language
serene scaffold
it's the question on everyone's mind
oak olive
I have never heard of it until I started the course
flat sable
used for what
oak olive
I guess that it is used for machine learning hahaha
flat sable
u learning maching learning? right
flat sable
what's courses did u take
serene scaffold
well, learning other languages can broaden your mind as a programmer
stone marlin
Octave is like a free version of Matlab that I made the huge mistake of learning when I also took Ng's course a long time ago.
It's not bad by any means, but you will literally never use it again after Ng's course --- unless, I dunno, you go into... uh... a very old research university or something.
It's a blessing in disguise, though, because if you can re-do the work in Python or R (whatever one you'd like), you'll probably learn the material better.
oak olive
flat sable
what's courses did u take
Andrew Ng (currently taking it), I am reading Elements of Statistical Learning from Hastie and I just recently quit a book called Hans on Machine Learning
oak olive
stone marlin
Octave is like a free version of Matlab that I made the huge mistake of learning...
Hi! Thanks a lot for your feedback, that is what I thought
stone marlin
The lizard book?
oak olive
Yep
stone marlin
I remember reading it, I don't remember what I thought of it, haha.
flat sable
oak olive
Andrew Ng (currently taking it), I am reading Elements of Statistical Learning f...
aa idk why i can't learning from book
oak olive
It has a looot of python and less mathematical stuff, so I think that it would be worth later
flat sable
stone marlin
The lizard book?
lizard book for data science?
stone marlin
ESL is a fantastic book, but I've mainly used it as a "read this once, use it for reference later." Ng's course is good for a theoretical overview.
stone marlin

Hands-On Machine Learning with Scikit-Learn, Keras, and TensorFlow: Concepts, Tools, and Techniques to Build Intelligent Systems
flat sable
yeh ive this book
oak olive
@stone marlin May I ask what would your approach be today if you had started Andrew Ng course?
Would you use Python?
flat sable
stone marlin
https://www.amazon.com/Hands-Machine-Learning-Scikit-Learn-TensorFlow/dp/1492032...
but what should i start first if u want to becoame Ml engineering
stone marlin
Yes. I used Python when I did Ng's course, but I had already been using Python for a few years. I've got a number of coworkers who are kind of "split" between R and Python, so either one is fine. You should eventually know at least a little of both.
flat sable
because ive 3 books and one told me to start data science from scratch
then move on
to
Introduction to Machine Learning with Python
and then hands on ml
stone marlin
I like Python only because I like doing general programming with it as well. R is a bit more difficult, but the trade-off is that R is (IMO) a bit nicer to visualize things in.
oak olive
Extremely interesting
stone marlin
ML Engineering is a huge field, Mouadjg. What type of thing would you like to do in your ideal job? Modeling? Pipeline building? What kinds of things and technologies do you want to work with?
flat sable
stone marlin
ML Engineering is a huge field, Mouadjg. What type of thing would you like to d...
idon't know now
oak olive
Also, you ve just mentioned that Hands on Machine Learning was a great book. Are "pandas", "matplot", etc.. libraries used on the daily basis of a ML specialist?
I was overwhelmed but the amount of Python stuff introduced on the book. Jupyter Notebook, Pandas, etc. That made me quit it for now