#data-science-and-ml
1 messages · Page 369 of 1
 arctic wedgeBOT
:incoming_envelope: :ok_hand: applied mute to @lapis sequoia until <t:1642842722:f> (9 minutes and 59 seconds) (reason: duplicates rule: sent 4 duplicated messages in 10s).
:incoming_envelope: :ok_hand: applied mute to @mint locust until <t:1642842823:f> (9 minutes and 59 seconds) (reason: duplicates rule: sent 4 duplicated messages in 10s).
 lapis sequoia
Hey, can i have access to this graphing tool? It's legitimately exactly what i need in my project
 fast nova
it is matplotlib
 sour shoal
I am reading some NN text and it talks about using mini batches of data to train your NN in versus training it on each data point individually. What is the difference?
Like I dont see how there is any other way but to train the weights and biases using a single data point each time then looping over every data point in your training set...
 last echo
Can someone tell me why, the plotted images is not matching with the labels. Even though there are 11 classes of foods
 rocky rivet
Can anybody help me figure out why my opencv is not properly getting imported?
I'm using the latest version for both python and opencv2
last echo
I am sorry pretty new to this stuff, my prof just sent us a copy of colab cnn and we try on other datasets on kaggle
 grave frost
sour shoal
Like I dont see how there is any other way but to train the weights and biases u...
grave frost
sour shoal
Like I dont see how there is any other way but to train the weights and biases u...
its the same thing - just that loading your entire dataset is not memory efficient. so minibatches help in training
its been proved too, that it doesn't really matter in performance. just for convenience
 hollow sentinel
i'm a little bit confused by index_col in pandas
it allows you to use a specific col in the dataframe as the first col?
not confused anymore
last echo
Someone pls suggest me where to learn model model = tf.keras.Sequential video tutorial
 desert oar
a help channel might be better
desert oar
sour shoal
Like I dont see how there is any other way but to train the weights and biases u...
you are describing one of many many optimization algorithms called "stochastic gradient descent". it happens to be a good choice for deep learning because of its generality and because of the complexity of the gradient functions of neural networks. if anything, you should be amazed that you can optimize a loss function by computing the gradient on one point at a time!
 upper junco
some one can help me i can't use the lib of matplotlib it gives me this error

 plush grove
desert oar
a help channel might be better
plush grove
desert oar
a help channel might be better
? Topical Chat/Help > data-science-and-ai is not a help channel? What I'm asking is if data-science help is the place to ask about resources for learning to consume REST APIs.
I have an accounting API which I want to access. I have credentials, and made a basic request of an endpoint. All good.
Now I need to learn the syntax for URL requests, how to "link" endpoints, basic query and post activities for APIs.
Could use recommended resources to get up to speed. Books, video series, Udemy, Edx, etc.
 odd meteor
sour shoal
I am reading some NN text and it talks about using mini batches of data to train...
odd meteor
sour shoal
I am reading some NN text and it talks about using mini batches of data to train...
It might not make sense that passing an entire dataset to our NN isn't enough, and we need to pass the same full dataset multiple times to the same NN, but here's why...
Remember we're using a limited dataset, and to optimize the learning we're using gradient descent ; which is an iterative process. Hence updating the weights with a single pass isn't enough. Let's now drop epoch now and go to why using mini batch is preferred.
Remember, Batch Size != Number of Batches. So
- with mini-batch, NN trains even faster (handles more weight updates in same amount of time)
- It requires less compute power (it's a fine way to allow the RAM breathe easy)
- Above all, the noise produced by small batch-size extremely helps to escape getting stuck at local minima. SGD further demonstrates this.
 gentle lion
If my loss is 0.11 and val loss is 0.17, should i just use more drop out layers or higher rates? I guess they should be almost equal no?
To prevent overfitting
But on the other hand, my model stops training when the validation accuracy does not change for a couple epochs so maybe it does not matter
odd meteor
upper junco
some one can help me i can't use the lib of matplotlib it gives me this error
Try updating PIL. Maybe it'll work after that. 🤔
 wispy ledge
how do i get into ai
gentle lion
Youtube
Should there be a relation between trainable params and your problem or dataset size
wispy ledge
i got a dive into algors book and i was just wondering if there were any other resources
 jade creek
Hii
hollow sentinel
wispy ledge
i got a dive into algors book and i was just wondering if there were any other r...
check out what is pinned in the #algos-and-data-structs channel
jade creek
Can someone help me with an ai problem
How do i do feature extraction for sales dataset
I've no idea how do i do it
 serene scaffold
jade creek
How do i do feature extraction for sales dataset
serene scaffold
jade creek
How do i do feature extraction for sales dataset
feature extraction is where you take the data that you have, and using what you know about it, turn it into something that the algorithm can use. So the question is, what data do you have, and what are you trying to do with it?
jade creek
serene scaffold
feature extraction is where you take the data that you have, and using what you ...
I have a sales data and I'm required to predict the sales depending on various parameters
serene scaffold
jade creek
I have a sales data and I'm required to predict the sales depending on various p...
what is in the dataset? be as specific as possible; copy and paste lines of it, if needed
jade creek
serene scaffold
what is in the dataset? be as specific as possible; copy and paste lines of it, ...
ok
jade creek
serene scaffold
what is in the dataset? be as specific as possible; copy and paste lines of it, ...

here's the data set
serene scaffold
try doing df.head().to_dict('list') and put the text (not a screenshot) in this chat.
jade creek
 serene scaffold
I don't look at screenshots; sorry
jade creek
serene scaffold
try doing `df.head().to_dict('list')` and put the text (not a screenshot) in thi...
and i ok
jade creek
serene scaffold
I don't look at screenshots; sorry
ok
jade creek
serene scaffold
try doing `df.head().to_dict('list')` and put the text (not a screenshot) in thi...
{'itemCode': ['sku_id_1', 'sku_id_1', 'sku_id_38', 'sku_id_38', 'sku_id_38'],
'packet_size': [1.0, 1.0, 209.0, 209.0, 209.0],
'brand': ['brand_1', 'brand_1', 'brand_9', 'brand_9', 'brand_9'],
'category': ['sku_category_1',
'sku_category_1',
'sku_category_15',
'sku_category_15',
'sku_category_15'],
'class': ['sku_class_1',
'sku_class_1',
'sku_class_1',
'sku_class_1',
'sku_class_1'],
'outletCode': ['customer_id_1559',
'customer_id_1945',
'customer_id_2083',
'customer_id_2083',
'customer_id_2083'],
'invoice_date': ['09/01/2019',
'29/06/2019',
'19/02/2019',
'02/03/2019',
'23/03/2019'],
'sales_in_litres': [12.0, 24.0, 209.0, 209.0, 418.0],
'latitude': [30.17309952,
30.46240044,
29.589700699999998,
29.589700699999998,
29.589700699999998],
'longitude': [31.21920013,
31.18569946,
31.28739929,
31.28739929,
31.28739929],
'outletType': ['type_5', 'type_1', 'type_1', 'type_1', 'type_1'],
'outletCategory': ['category_1',
'category_2',
'category_2',
'category_2',
'category_2']}
jade creek
yes thanks
serene scaffold
@jade creek so you're trying to learn how to predict sales_in_litres given the data in the other columns, right?
jade creek
serene scaffold
<@!809817181369663520> so you're trying to learn how to predict `sales_in_litres...
yes
serene scaffold
great. so this is the part where you, as a human, have to apply things that you know about the real world. of the information in the other columns, which do you think actually have anything to do with the sales_in_litres value?
jade creek
serene scaffold
great. so this is the part where you, as a human, have to apply things that you ...
ig i can do pridiction based on location and sales
and category and sales
date of invoice and sales
serene scaffold
jade creek
ig i can do pridiction based on location and sales
the problem is that you're given the location as GPS coordinates, which are actually too specific
jade creek
serene scaffold
the problem is that you're given the location as GPS coordinates, which are actu...
yes ,i couldn't understand how do i do it
serene scaffold
if you can figure out what location they refer to generally, like a city or a country, that would probably be more useful. but if you can't do that, you might have to do the best you can with the other features.
jade creek
serene scaffold
if you can figure out what location they refer to generally, like a city or a co...
yes
but i need to know how do i impliment it
like I've never tried it before
serene scaffold
jade creek
but i need to know how do i impliment it
implement what?
a function that, given GPS coordinates, returns the name of a city as a string?
jade creek
serene scaffold
a function that, given GPS coordinates, returns the name of a city as a string?
no like if thats my train data then how do i extract features from it like what to do
i'm totally new to this thing
serene scaffold
@jade creek are you doing this for a class, or on your own?
jade creek
serene scaffold
<@!809817181369663520> are you doing this for a class, or on your own?
by my own
serene scaffold
jade creek
by my own
did you find this data on Kaggle?
Try using this: https://scikit-learn.org/stable/modules/generated/sklearn.tree.DecisionTreeClassifier.html
scikit-learn
Examples using sklearn.tree.DecisionTreeClassifier: Classifier comparison Classifier comparison, Plot the decision surface of decision trees trained on the iris dataset Plot the decision surface of...
jade creek
serene scaffold
did you find this data on Kaggle?
no i got the data from uci machine
jade creek
serene scaffold
Try using this: https://scikit-learn.org/stable/modules/generated/sklearn.tree.D...
ohh ok
serene scaffold
idk what that is
jade creek
serene scaffold
idk what that is
a website
serene scaffold
I mean, I figured that much...
Anyway, it sounds like you might want to watch some videos about machine learning fundamentals
jade creek
serene scaffold
Anyway, it sounds like you might want to watch some videos about machine learnin...
yes i must but i couldn't find any good videos
like i wasn't able to understand
first of all looking at problem statement i got confused that what i need to do
serene scaffold
jade creek
first of all looking at problem statement i got confused that what i need to do
can you copy and pate the problem statement, so that I know exactly what you're talking about?
jade creek
serene scaffold
can you copy and pate the problem statement, so that I know exactly what you're ...
yess
Problem description: you are provided with historical invoice data for many outlets located in different regions. you are required to forecast the sales at day level for a number of outlets. The expected outcome is: for each (date, outlet, item) triplet, forecast the sale. you are also provided additional information on outlets and items in ‘outlet_master.csv’ and ‘item_master.csv’ respectively.
serene scaffold
I see; do outlet and item correspond to specific columns in the data from before?
or are there multiple columns that represent that information?
jade creek
serene scaffold
I see; do `outlet` and `item` correspond to specific columns in the data from be...
yes
jade creek
serene scaffold
or are there multiple columns that represent that information?
no
actually there are 4 data sets provided
Data:
-
sales_train.csv.zip:
Attributes: -
outletCode: outlet identifier
-
invoice_date: date of transaction
-
itemCode: item/sku identifier
-
sales_in_litres: item volume sold in litres. You are predicting in litres.
-
outlet_master.csv:
Attributes: -
outletCode: outlet identifier
-
latitude: geographical latitude component of outlet
-
longitude: geographical longitude component of outlet
-
outletType: type of outlet
-
outletCategory: category of outlet
-
item_master.csv:
Attributes: -
itemCode: item/sku identifier
-
packet_size: packet size of item/sku in liter
-
brand : brand the item is from
-
category: item category
-
class: item class
-
test_data.csv.zip:
Attributes: -
outletCode: mentioned above
-
invoice_date: mentioned above
-
itemCode: mentioned above
-
actual_sales_in_litres: You are given the actual volume sold in litres
-
predicted_sales_in_litres: Predicted volume in litres
serene scaffold
@jade creek okay, so when they say (date, outlet, item), what they seem to mean is (invoice_date, outletCode, itemCode)
jade creek
serene scaffold
<@!809817181369663520> okay, so when they say `(date, outlet, item)`, what they ...
yes
serene scaffold
the date is meaningful in itself, but the two codes aren't really. so you have to do joins with the other tables to get features that can be used to predict the date.
jade creek
serene scaffold
the date is meaningful in itself, but the two codes aren't really. so you have t...
like?
jade creek
jade creek
{'itemCode': ['sku_id_1', 'sku_id_1', 'sku_id_38', 'sku_id_38', 'sku_id_38'],
'...
here i've merged all the attributes in a single data frame
serene scaffold
jade creek
like?
using itemCode as an example, that doesn't tell you much, but packet_size or brand might. you have to look at the data and see which of the features in item_master are most likely to be helpful for you.
so now you need to pick an algorithm and decide which of the columns has information that correlates with the target, which is sales_in_litres.
it might be helpful to just start by deciding which columns correlate with the target.
jade creek
ohh ok
jade creek
serene scaffold
so now you need to pick an algorithm and decide which of the columns has informa...
according to you which one would be better?
serene scaffold
jade creek
according to you which one would be better?
not sure
jade creek
serene scaffold
not sure
umm ok still any
serene scaffold
jade creek
umm ok still any
oh btw, are the dates you're predicting for mostly after the ones in the training data? or during them?
jade creek
serene scaffold
oh btw, are the dates you're predicting for mostly after the ones in the trainin...
after the ones in training data
serene scaffold
jade creek
after the ones in training data
you'll need to look into algorithms specifically for time series, then
jade creek
serene scaffold
you'll need to look into algorithms specifically for time series, then
like?
serene scaffold
jade creek
like?
I'm actually a computational linguist, so I've never done time series forecasting.
jade creek
serene scaffold
I'm actually a computational linguist, so I've never done time series forecastin...
ohh ok
no problem
thanks for the help
 shadow crypt
Guys, can anyone help me with netowrkx graph creation?
serene scaffold
shadow crypt
Guys, can anyone help me with netowrkx graph creation?
try being more specific, so that people know what helping you would entail.
shadow crypt
So, i'm creating a graph with networkX with tweets from twitter API, but the thing is: Looks like that if a tweet has the same author (user) the graph only represent the first one on the graph, than this break my code... Idk how to handle this...
serene scaffold
shadow crypt
So, i'm creating a graph with networkX with tweets from twitter API, but the thi...
don't tweets have a unique ID, or something?
shadow crypt
serene scaffold
don't tweets have a unique ID, or something?
should have, right?
but the author, or user, it's the same anyway
but i guess i can use this unique ID, i don't think that changes anything at my problem
let me try it
serene scaffold
@shadow crypt well, it sounds like the problem is that you're using the author ID to uniquely identify each node, even though that feature isn't actually unique.
shadow crypt
serene scaffold
<@!309144103994785802> well, it sounds like the problem is that you're using the...
yeah, that was it
but i kinda wanted to use to author ID, just makes more sense to my problem
wasn't a problem if i had two nodes with the same value/name
but with unique tweet ID worked, thanks man!
 serene scaffold
lapis sequoia
the `e` here is eulers number right?
serene scaffold
lapis sequoia
the `e` here is eulers number right?
yes
lapis sequoia
thanks
serene scaffold
if something is written in formal math notation, you can assume that e is euler's number.
lapis sequoia
im just getting into neural nets and it's very fun
with this video series
I understand the concepts
and also
what's better sigmoid function or ReLU
serene scaffold
one isn't better than the other; they're just different.
do you understand what they are?
relu(x) := max(0, x)
lapis sequoia
yeah activation functions
the video mentions "vanishing gradient problem"
and that's super fast and simple
serene scaffold
@lapis sequoia the range of relu is [0, inf) whereas the range of sigmoid is (-1, 1)
which one is better for your use case depends.
lapis sequoia
alright il keep that in mind
 thin palm
whats up Python gang, I have a question about this ML project I'm working on.
If I have lats and longs in a column, do I need to keep the columns of address , city , state, and zip ?
for my model to be trained on? I mean if I have lats and longs what's the point of having the rest of those columns ?
thin palm
Also
Lender Date City State Zip Balance ARV EQUITY Sold location_lats location_lngs
Above is my columns, which do you think columns should be dropped or we dont need any more
odd meteor
lapis sequoia
the video mentions "vanishing gradient problem"
The presence of activation function in NN doesn't always exactly solve the problem of Vanishing gradient or Exploding gradient.
desert oar
plush grove
? `Topical Chat/Help > data-science-and-ai` is not a help channel? What I'm aski...
I am suggesting that one of the dedicated general help channels is a better place to ask about this topic. Or possibly #software-architecture
plush grove
desert oar
I am suggesting that one of the dedicated general help channels is a better plac...
How would you characterize this topic? How would you describe my question?
desert oar
plush grove
How would you characterize this topic? How would you describe my question?
"How do I use APIs" is kind of a vague question. It sounds like you need to make HTTP requests to retrieve some data, and then process that data somehow. I'm not sure what you mean by linking endpoints, or what kind of "query" you need to perform
Automate the Boring Stuff has some material on this i think? But that book is getting kind of out-of-date
Point being, this isn't really a #data-science-and-ml topic
It's also not clear what your current level of understanding is. Do you know what HTTP methods are? Do you understand the documentation for the API? Are you stuck on some specific task? Do you have any code written already? Are you asking about what libraries to use in order to actually make network requests? Maybe you want to read about how URLs and HTTP work? Do you need help processing the data that you receive?
So if i had to characterize your question, it would be a general question asking for advice and a starting point on the broad topic of interacting with network resources and possibly also about JSON
 fiery walrus
hello can anyone help me out here? im doing a project and have no clue how to really start or go about it
im a beginner and its like very basic for some but for me seems hard af
odd meteor
lapis sequoia
I wish i knew what those were
Exploding gradient is a problem that can occur in any NN that uses backpropagation to update the weights. If the derivatives gotten by doing back propagation (applying chain rule) are large, then this will cause the gradient to increase exponentially as we transverse down the network until the gradient eventually explodes. So this leads to the gradient diverging to + ∞
On the other hand, Vanishing gradient occurs when the derivatives are small, this will lead to the gradient decreasing exponentially as we propagate down the network until it eventually vanishes. When this happens, the gradient converges to 0 hence stopping the network from training further.
desert oar
fiery walrus
im a beginner and its like very basic for some but for me seems hard af
everything is hard if you don't know what you are doing. but don't "ask to ask". describe what you actually need help with, and someone will help if they are able to help
lapis sequoia
odd meteor
Exploding gradient is a problem that can occur in any NN that uses backpropagati...
.bm
so I understand when I get to that level
Thank you
lapis sequoia
odd meteor
Exploding gradient is a problem that can occur in any NN that uses backpropagati...
summary the gradient can get to overload from exponential increase, vanishing makes the algorithm die from becoming all 0s
how do you avoid those or are they just the problems surrounding back propagation
arctic wedgeBOT
Hey @plush grove!
You either uploaded a .txt file or entered a message that was too long. Please use our paste bin instead.
plush grove
desert oar
"How do I use APIs" is kind of a vague question. It sounds like you need to make...
Thank you for your analysis of my inquiry.
Yes. I agree that what I'm asking for is very general--book. I was hoping there existed some go-to books for working with APIs that people might care to share. For example, if someone were to ask me where to start with Django, for example, I might recommend William Vincent. If you're not familiar with his book, he also has a podcast TalkDjango.
The reason I posted in this community is you can't perform data science if you don't have data. Do you see? If you really want to work with data, then you want to get over obtaining it really quickly. You want the Matrix download right into your brain--- now you know just what you need for valid JSON, and different API behaviors, and REST errors which trick you, and you just get over all the API stuff and get your data--resume your data science activities. right?
I asked for guidance about the community, because I thought it might help readers orient to my question faster. It didn't have the effect I had hoped for.
odd meteor
lapis sequoia
how do you avoid those or are they just the problems surrounding back propagatio...
This can solve the problem Vanishing gradient
- Better initialization of the weights
- using regularisation
- Using ReLU activation function instead of AF like tanh and sigmoid
- using LSTM or even GRU cells
For Exploding Gradient problem
_ applying Gradient Clipping
odd meteor
lapis sequoia
summary the gradient can get to overload from exponential increase, vanishing ma...
The algorithm doesn't die. Vanishing gradient renders gradient descent unable to ever converge to the optimum (or get to the global minimum)
lapis sequoia
what's tanh, LSTM and GRU cells
gradient clipping I use puts a limit on the gradients
regularisation and initialization of the weights means dont have overly large or small weights which lead to that problem
lapis sequoia
odd meteor
The algorithm doesn't die. Vanishing gradient renders gradient descent unable to...
I see
but the point is you can't train it further
odd meteor
lapis sequoia
what's tanh, LSTM and GRU cells
tanh is a type of activation function just like ReLU
odd meteor
lapis sequoia
yeah but what does it consist of
It's a hyperbolic tangent.

Activation functions are functions used in a neural network to compute the weighted sum of inputs and biases and then activate a neuron
lapis sequoia
odd meteor
This can solve the problem Vanishing gradient
- Better initialization of the w...
.bm
Thank you for all these explanations
 cobalt hearth
soo this is making me almost go crazy
this image is a proccessed image of a pic taken of a science book used cv2 to proccess it

never mind
here is what i use
    text = pytesseract.image_to_string(denoised, config=config).lower().split(" ")
    finished = []
    for word in text:
        if "\n" in word:
            new_word = word.split("\n")
            count = 0
            for i in range(len(new_word)):
                if new_word[count] == "" or new_word[count] == " ":
                    continue
                finished.append(new_word[count])
                count += 1
        else:
            if word == "" or word == " ":
                continue
            finished.append(word)
    output = ""
    for word in finished:
        output += word + " "
    print(output)
i used this to get out the text of it
here is the output
120 @ are fossil fuels? is something that contains a store of energy.
the energy is transferred to the surroundings when the fuel burns,
and the surroundings get hotter, burning a fuel does not make energy,
it only transfers it. energy cannot be created or destroyed.
this is called the law of conservation of energy.
is a way of transferring energy. it is not a fuel.
 most of the electricity we use is generated (produced) in power stations.
 most power stations use energy resources such as coal,
 oil or natural gas to generate the electricity.
 a whatis a fuel? b name three fuels. write down three things we use fuels for.
 was formed many millions of years ago from plants.
 when the plants died they became buried in mud,
 which stopped them from rotting away.
 organisms that never rot away completely are called fossils.
 more layers of the mud squashed the fossils.
 this squashing, together with heat from inside the earth,
 turned the mud into rock and the plant fossils into coal.
 coal is a fossil fuel. how coal wos formed.
 this bunsen burner uses natural gas.
 when the gas burns the energy stored in the gas heats up the surroundings.
everything works very well
but the bolded words in the input image such as "What" "Electricity" "Coal" arent in the output for some reason tessaract jus ignores them
so why?
also it ignored the "A fuel"
its clear not even blurry or the font is bad
hollow sentinel
reg = linear_model.LinearRegression()
reg.fit(df[["area"]],df.price)
reg.predict(3300)
!pastebin
arctic wedgeBOT
Pasting large amounts of code
If your code is too long to fit in a codeblock in discord, you can paste your code here:
https://paste.pythondiscord.com/
After pasting your code, save it by clicking the floppy disk icon in the top right, or by typing ctrl + S. After doing that, the URL should change. Copy the URL and post it here so others can see it.
 prime hearth
it means that you are passing scalar value , it needs an array
hollow sentinel
oh scalar as in lin algebra scalar?
prime hearth
so for fit(), it takes in an X which must be 2d array
and a y which can be an array
hollow sentinel
around the df["area]?
hollow sentinel
so just df["area"] alone should work
prime hearth
i think so
arctic wedgeBOT
Pasting large amounts of code
If your code is too long to fit in a codeblock in discord, you can paste your code here:
https://paste.pythondiscord.com/
After pasting your code, save it by clicking the floppy disk icon in the top right, or by typing ctrl + S. After doing that, the URL should change. Copy the URL and post it here so others can see it.
hollow sentinel
prime hearth
it saying X is a 1d array now
before it was jsut scalar so 10 for example
this error saying it 1d array now
prime hearth
scalar it just an integer value for example
hollow sentinel
ok
hollow sentinel
0 2600
1 3000
2 3200
3 3600
4 4000
area price
0 2600 550000
1 3000 565000
2 3200 610000
3 3600 680000
4 4000 725000
the second one is the full dataframe
the first one is the X
prime hearth
oh okay
so you can do this
data_x = dataframe.drop(['price']) # this should give 2d array of X
then pass in data_x to fit
however i not sure if fit() requires it to be a list type thats where we use numpy
cobalt hearth
i think i found a solution for my problem
hollow sentinel
hm
something is defo off
bc in the video i am watching it works fine

In this tutorial we will predict home prices using linear regression. We use training data that has home areas in square feet and corresponding prices and train a linear regression model using sklearn linear regression class. Later on predict method is used on linear regression object to make actual forecast.
To download csv and code for all t...
prime hearth
oh him
cobalt hearth
how old is it?
cobalt hearth
excatly
prime hearth
what happen when you did datafrane.drop
cobalt hearth
the packages has gotten more than 10 updates and changes since that
prime hearth
if it returns 1d array still
you can use numpy or pandas
to convert it to 2d array
prime hearth
yeah i think axis=0
hollow sentinel
nope
prime hearth
or axis=1
hollow sentinel
ValueError: Expected 2D array, got 1D array instead:
array=[2600 3000 3200 3600 4000].
Reshape your data either using array.reshape(-1, 1) if your data has a single feature or array.reshape(1, -1) if it contains a single sample.
i am just gonna switch to a newer source
i'll come back in a bit
after i look at the doc more
hollow sentinel
shit that's true
cobalt hearth
if this is 2d then there are 2 axis in this one horizontal and the other is vertical so axis = 2 i think
hollow sentinel
"ValueError: No axis named 2 for object type <class 'pandas.core.frame.DataFrame'>"
ok ok ok
i am gonna take a step back and look at this again
prime hearth
x = numpy.asarray(array)
x = x.reshape((1,len(array)) // should give 2d array with 1 row and 5 columns
cobalt hearth
i think it better if u use a newer source
prime hearth
Hello, I am learning about feature engineering and woud like to please ask, for linear regression models, it is best to use high corelated features to the label and disregard others or i should only disregard features with low corelation rather than low corelation to the label?

this is just for feature selection.
I was thinking since im trying to predict "charges" , the features with high corelation can remain while any other I should disregard
was thinking threshold should be 0.3 at least for it to be used in the model trainning
cobalt hearth
i have never done something like this but ill try to see if i can help
hollow sentinel
i thought using features that had heavy collinearity was not a good idea for lin reg
if i recall correctly from the ml o'reilly book
but i could be wrong
cobalt hearth
u guys read books?
prime hearth
oh yeah? I was thinking it depends since it for linear regression high corelation means as x increases y increases
so can help
hollow sentinel
"When predictor variables in the same regression model are correlated, they cannot independently predict the value of the dependent variable." - britannica
prime hearth
like a youtube im watching for feature engineering Krish naik, he says he disregard low corelation but not that related to label or target
hollow sentinel
seems like i could be potentially correct
cobalt hearth
soo the value of age what does it represent? how old or young or an age range
prime hearth
im predicting chargers
cobalt hearth
yeah ik
prime hearth
being a smoker, age and BMI are high colerated to insurance medical charges which im predicting
this means it influences the model more
so i want to keep them
despecito i think that for multiple regression unless im misunderstanding what is being said
cobalt hearth
i have no idea what is this so cant help
prime hearth
its okay thanks
hollow sentinel
plt.scatter(x_train, y_train, color='red')
plt.plot(x_test, y_predict)
plt.xlabel("area in sq. ft")
plt.ylabel('price in $$$')
plt.title('')
plt.show()

idk why there is no line here
oh
i'm an idiot
there's no line bc i never called for there to be a line
no wait this is strange
prime hearth
Also, I understand what you mean daspecito, that quote is being said for features but not feature related to label just when two features are highly corelated what i was talkign is for the label and feature
cobalt hearth
cobalt hearth
but the bolded words in the input image such as "What" "Electricity" "Coal" aren...
anyone got an idea on this? i tried changing the config to change the page segmenation mode from Auto with OSD to Auto and no OSD but made it worst i think it has to do with the engine mode
hollow sentinel
prime hearth
Also, I understand what you mean daspecito, that quote is being said for feature...
you would definitely want your features to be correlated with your label if you are trying to attempt linear regression
yeah
idk why this won't give me an actual line
weird as hell
prime hearth
thats because didnt include line
hollow sentinel
daksjnvklsdc
prime hearth
https://www.kite.com/python/answers/how-to-plot-a-linear-regression-line-on-a-scatter-plot-in-python
hollow sentinel
wait what
you can't use matplotlib anymore?
to sketch a line connecting points?
cobalt hearth
fucking -10c here my brain is freezing lol
not really -10 its -6 but i rounded it up 😂
hollow sentinel
what is going on
cobalt hearth
idk
hollow sentinel
this makes zero sense
 stone marlin
I'm not a matplotlib expert, but I think this is because you're plotting two different plots (as in, you're making two different plots, but it's only printing out the scatter one). Having said that, I was able to get the plot with your code in Jupyter, so, idk. Here's what I did to fix this in VSCode, though.
import matplotlib.pyplot as plt

x_train = [1, 2, 3, 4]
y_train = [3, 2, 3, 5]

x_test = [1, 2, 3, 4]
y_predict = [7, 8, 7, 6]

f, ax = plt.subplots()
ax.scatter(x_train, y_train, color='red')
ax.plot(x_test, y_predict)
ax.set(xlabel='x-label', ylabel='y-label', title="")
plt.show()
For correlation: if you happen to have something strongly linearly correlated with the label, great. Usually, corr plots are used to kill off features which are strongly correlated with each other. This is for two reasons (that I can think of, at least): one, it reduces dimensionality which is usually good for most models; two, for some models, it will slow convergence as strongly correlated features "share weight". Edit: this (https://datascience.stackexchange.com/a/24453) is a good answer to the question, as well.

Data Science Stack Exchange
I read somewhere that if we have features that are too correlated, we have to remove one, as this may worsen the model. It is clear that correlated features means that they bring the same informati...
stone marlin
What was the issue?
hollow sentinel
i think x_test was NAN
for a sec
and it was also a dataset that was just meh
this is how you know a lin reg model will not help

well this is not simple linear regression
stone marlin
Yeah, gott'a do some feature engineering there.
grave frost
no, cuz there's only 1 dependent feature
hollow sentinel
it is multiple linear regression
not multivariate
multiple linear regression uses multiple independent variables
my bad
i thought they were interchangeable lmao clearly not
grave frost
are you implying you have multiple corresponding dependent features? 🤔
hollow sentinel
no not at all
there is no correlation here between any of these dependent variables
and that independent variable total library size
actually wait
no
this is a simple linear regression model
getting ahead of myself my b
grave frost
hollow sentinel
there is no correlation here between any of these dependent variables
uhh, dependent implies they are linearly correlated
or I am getting something majorly wrong
hollow sentinel
yes you're correct it is not dependent at all i assumed they were
which is why i created the model to see if it would work
hollow sentinel
ik
i just wanted to do it for funsies
i'll do a simple linear regression model tomorrow with something that'll actually work
grave frost
what's the pearson's coefficient?
with such little data, I doubt there exists a function at all.
stone marlin
There is absolutely a model for this --- how good it is would be the question.
hollow sentinel
i gotta go thanks for the help
stone marlin
MLR is a model where the result is given as a linear combination of features:
yi=β0+β1xi1+β2xi2+...+βpxip
For example. We almost never use the term "multiple regression" and just use "regression" since the odds of having a model with a single feature (simple linear regression) is fairly low in the real world, unless two things are already well-correlated.
hollow sentinel
stone marlin
MLR is a model where the result is given as a linear combination of features:
...
that is actually really helpful
i have a quick question on that
is b1 a scalar?
or is it just like (m)(x)
stone marlin
Yeah, sorry that equation looks like garbagio on discord. Yes, all the betas are scalars. The x's are your feature variables.
hollow sentinel
got it
grave frost
stone marlin
MLR is a model where the result is given as a linear combination of features:
...
ahh,
hollow sentinel
just needed that sanity check
bc i have been looking at some lin alg lately
so it seemed familiar
stone marlin
So, like, how a line is y = mx + b, the m is the slope and the x is the "feature" variable --- in MLR, you just have a bunch of m's and a bunch of x's, corresponding to the features and their coefficients.
hollow sentinel
got it
grave frost
well yeah, I guess everyone just calls it regression so its now simply regression ¯_(ツ)_/¯
stone marlin
But, for whatever reason, we change the labels and usually use either "c" or "beta" for the "slope" coefficients. Sometimes there is also an error term added, but, you know, doesn't matter so much.
hollow sentinel
yeah i have just been reading it in the o'reilly book and they call it "multiple" linear regression
so that's why i was calling it multiple
but i'll stick to calling it regression now
stone marlin
Yeah, it's all good to just use [linear] regression, people'll know what it means.
hollow sentinel
that was a really solid explanation
plush grove
Hello. I'm learning about REST APIs. I hand't realized how diverse APIs can be.
One of the APIs I'm dealing with is https://api.mobilebytes.com/
Specifically, I need to model daily sales > group by room > each room showing each summary revenue for each category of sale.
There are two endpoints:
get /v2/reports/sales/reportCategories/{startDate}/{endDate}
get /v2/reports/sales/rooms/{startDate}/{endDate}
How can I related these two endpoints to get a picture of the same day of sales? What's more, Categories and Rooms are not labeled in the results, but instead have UIDs. You need to look up the IDs to get the string labels. And it's all like this. To build the representation of sales I need, there are many relations I need to lookup. How do you handle all of that?
In summary the service I'm calling is not just returning a 'report' of sales. (Not your basic "weather API"--get temperature in Catskills, Done). It the complete access to a commercial application. I need to generate custom reports that the provider doesn't offer.
hollow sentinel
thanks man that really simplified things for me @stone marlin
stone marlin
No problemo, good luck continuing on with this stuff!
 iron basalt
stone marlin
But, for whatever reason, we change the labels and usually use either "c" or "be...
iron basalt
stone marlin
But, for whatever reason, we change the labels and usually use either "c" or "be...
C is often used for constants (and k), while some greek letters like alpha, beta, gamma, and lambda are often coefficients. m and b are an english speaking math thing that they just decided to do (although all choices are arbitrary, C for constant at least makes some sense).
grave frost
inconsistency in papers however, is quite a pain - especially when learning new topics.
stone marlin
Yeah, I meant, specifically in this case, I usually see beta or c_ij in the wild when I'm looking at linreg.
grave frost
because that same alpha becomes a learning rate
not that its much of an issue tbh, but it is annoying to see the lack of convention
iron basalt
Yeah math always assumes some upfront definitions where they just say a bunch of let blah be foo.
(or after with where)
stone marlin
Yeah, it's pretty wacky. And then in linalg + abstract alg, you can't use k anymore, since it means "field", haha.
iron basalt
Yeah then you get into subscript / superscript hell.
grave frost
the most annoying are ES/Neuro-based papers IMO. Apparently, I encountered a paper trail of convention of nearly 4 citations before I finally figured out what all the symbols mean
iron basalt
(W_a,b,c,z)
grave frost
why they are the lone holdouts, I have absoluely no idea
 ruby folio
idk why but i get this error
    with 6222 stored elements in Compressed Sparse Row format>, dtype=object) cannot be considered a valid collection.```
when i do
from sklearn.compose import ColumnTransformer
from sklearn.preprocessing import OneHotEncoder
ct = ColumnTransformer(transformers=[('encoder', OneHotEncoder(), [0])], remainder='passthrough')
X = np.array(ct.fit_transform(X))
print(X)
from sklearn.model_selection import train_test_split
X_train, X_test, y_train, y_test = train_test_split(X, y, test_size = 0.2, random_state = 1)
This is the dataset i am using: https://www.kaggle.com/tylermorse/retail-business-sales-20172019?select=business.retailsales.csv
Dataset is actual sales from online store between 2017-2019
stone marlin
We had these particular manifolds to look at which were abbreviated K and you always had to specify the field over it, so it was always like, K_ij[k]. Super gross, and it ran together, but at least it was not ambiguous. You couldn't use the manifold name as a field. But it did blur together pretty quick.
iron basalt
Neuro papers all assume you are in on it. Small community that cares about the same stuff.
They just assume you have been following their papers.
grave frost
honestly, adding a few paras is not big deal
stone marlin
Reading ML/AI papers is a nightmare, coming from math papers. But some fields of math have terrible papers, so, you know, all depends.
grave frost
but I suppose being generally clueless about the field doesn't help anyways
iron basalt
Yeah but it can go too extreme the other way like with formal math. Let me give you 10 pages of definitions and assumptions. Need something in between, to not waste everyone's time but also not make it require a heavy context to know what is going on.
stone marlin
Haha, this is very true. It took many years to get used to the "what can i skim in this paper?" factor.
grave frost
I suppose 🤷♂️
BTW @iron basalt would you happen to have an idea of how cortical columns are structured in the neocortex? I couldn't find a definite resource in my search (mostly curious how its actually placed)
iron basalt
grave frost
BTW <@!119925597395877889> would you happen to have an idea of how cortical colu...

I recommend having this reference: https://discourse.numenta.org/t/htm-cheat-sheet/828

HTM Forum
This is a community-created and managed reference card about HTM theory and implementation for easy lookup for common information. Please add to it if you have something interesting to add. If you see “?” and know the answer, please fill it up. Just the numbers as rule-of-thumb in 10’s : item count capacity misc pattern ......
grave frost
iron basalt
https://aws1.discourse-cdn.com/standard14/uploads/numenta/original/2X/0/0a95eade...
mb, I phrased it incorrectly. I meant how they're arranged in a hierarchial strucutre definitely
all I've gotten is, "lower columns take stuff, pass it on to hierarchies - rinse and repeat"
iron basalt
The regions are defined by connectivity.

    Regions pass information to each other by sending bundles of nerve fibers into the white matter just below the neocortex. The nerve fibers reenter at another neocortical region.
    The connections between regions define a logical hierarchy.
From the link, it's a pretty nice compilation / reference card.
grave frost
iron basalt
```
The regions are defined by connectivity.
Regions pass information to ea...
yes.. but how are the connections? are the higher hierarchies modelling the same input, taking in consideration results of the lower hiearchies? are they like skip connections?
iron basalt
There can be skip-like connections. The brain can even have skip-like connections from one end to another, but those connections are far fewer than the shorter ones. However, even a few connections can give a lot due to how dendrite connection regions work. The entire neocortex is also not one hierarchy, like you might normally have in many ML models.
Higher hierarchies may be modelling the same input or some kind of fusion process.
grave frost
so higher hierarchies don't have any information about what their lower hierarchical peers computed?
iron basalt
They do. And it's thought that the neocortex might also have some kind of voting system between hierarchies at the top.
The higher layers / hierarchies have the encoded information of the others.
grave frost
so by building on features computed by lower hierarchies, they compute more abstract ones - from thin air?
iron basalt
Well say you have the bottom most one. It would give you an encoding of that raw input. One which is useful / has nice properties (e.g. a SDR). The other hierarchies may be storing object models and rather than working on the raw inputs, they work on SDRs as input plus lateral connections to other hierarchies and far reaching connections from elsewhere.
The current idea is that the columns do something like an optimized form of grid cells too. To store models of objects.
grave frost
Hmmm...
wouldn't this be simulated by stacking self-attention blocks in a hierarchial fashion (ignoring gradient problems)
iron basalt
grave frost
wouldn't this be simulated by stacking self-attention blocks in a hierarchial fa...
Sort of. Grid cells behave like an attention mechanism. There is a back and forth between the sensory system and the grid cell system. Getting input -> triggers certain grid cells (estimated locations (could be multiple, needs to more info to narrow it down)) -> movement input that may shift the grid cells -> signal sent back to the sensory hierarchy that narrows / turns off/on certain parts (attention-like) -> repeat.
(note that in actual grid cells those locations are actual locations, while in the neocortex (speculative), those "locations" are abstract / some other spaces)
(for example the neocortex's grid-cell-like system can encode language models)
(the turning parts on/off is where the nice properties of SDRs come into play, since they are semi-symbolic and have nice set operations that can be applied to them)
grave frost
iron basalt
Sort of. Grid cells behave like an attention mechanism. There is a back and fort...
signal sent back to
do you mean down the hierarchy?
iron basalt
grave frost
> signal sent back to
do you mean *down* the hierarchy?
From the grid cell module(s) to the hierarchy (higher up in it).
The hierarchy might have a signal sent down inside itself. But not like in backprop in DL where it can go multiple layers.
Backprop like in neuroscience (1 layer), plus it can have a forward operation downward too.
grave frost
Hmm... then I suppose any input representation could potentially traverse multiple columns, which could merge together at higher levels
iron basalt
The representations can yes, and they merge nicely because SDRs merge nicely. But also the representation is made up of many minicolumns, not individual neurons.
(So it's very sparse)
grave frost
oh, so you mean after each level the resulting SDR represents all the columns fired?
grave frost
so, that's just a gated (sparse) mixture-of-experts model
I don't see any stark differences in the base workings atleast
iron basalt
Well it might not be all, the brain can do whatever, some minicolumns might be doing whatever, like mediating the grid cell interaction.
It's all pretty messy so I can't say all ever.
Evolved whatever.
grave frost
I suppose. The overall objective then for higher levels is to model the input w.r.t computed representations in a more abstract fashion?
iron basalt
Yes, the encoded form (SDRs) are also just much nicer to work with for it, even for less abstract things, like your physical location.
Also does some denoising, etc.
grave frost
In a nutshell then, higher levels try and interpret what lower levels computed and build upon the representations to obtain more abstract ones.
iron basalt
Yes, but also they might have their specific goals involved, like modeling the right stuff to solve their RL problem.
grave frost
that just sounds like performing cross-attention between different multi-headed self-attention blocks (w/ skip connections for ze grads) put in a hierarchial fashion - no?
iron basalt
Yes, but you can go further, it's a bit of everything.
grave frost
ohh, but without the softmax normalization!
iron basalt
But the core that lets it all work together is a solid representation medium (SDRs), and grid cells.
grave frost
The way I see it, by computing QK^T one can project the pre-existing latent to another representation
iron basalt
Yeah, fusion.
grave frost
which would attend w.r.t the input as well as being conditioned on the processed latents from lower levels - yeah, basically fusion
the problem then however becomes the grads 🤔 but doable for some experimenting at the least
iron basalt
(See Grossberg's book for more, him and Carpenter have it all figured out (or at least the closest))
(the book covers all the specific network ideas of how the various parts can be implmeneted)
(and ofc ART (fusion ART is a thing))
grave frost
pity its not available in my locality
thanks a lot for your help! gave me good ideas to mull over
thin palm
Hi all, any recommendations for my date column to feed into my Machine Learning Model??
I've seen Feature Engineering and Handling Cyclical Features but i'm still confused on this
serene scaffold
thin palm
Hi all, any recommendations for my ```date ``` column to feed into my Machine Le...
what does the model do?
more specifically, what algorithm does the model use, and what is the input/output?
please ping me if you are able to answer these questions.
jade creek
@serene scaffold can we apply categorical data to ml algorithms without encoding?
serene scaffold
@jade creek usually you one-hot encode categories. If you were to assign each category an arbitrary number, the model might think that higher numbered categories are "more", in some way.
jade creek
serene scaffold
<@809817181369663520> usually you one-hot encode categories. If you were to assi...
ahh without encoding
serene scaffold
I'm not sure exactly what you mean by "without encoding".
This all depends on what your model is and what your data is. It's quite rare that a dataset can be loaded into memory with pandas and passed right into an sklearn model without any kind of preprocessing.
fiery walrus
progress
 odd meteor
hollow sentinel
a scalar is just a constant times a vector
odd meteor
hollow sentinel
a scalar is just a constant times a vector
This is the pictorial representation 😊
 lapis sequoia
Hey guys, when I run conda create -n TestEnv python and check the packages by running conda list and pip list, they are both empty.. I am on a mac. When I run the same sequence for creatin a new environment on a pc, I don't get the same issue.. what is the problem here?
but when I run the the same sequence again without deactivating the base environment, then it is working. So I have to create environments from base?
I hope my problem is clear
upper junco
someone can help me, why is the dataset like this in only one cell
 lapis sequoia
upper junco
someone can help me, why is the dataset like this in only one cell
lapis sequoia
upper junco
someone can help me, why is the dataset like this in only one cell
Because you have to use a comma delimiter.
upper junco
how to fix?
lapis sequoia
upper junco
someone can help me, why is the dataset like this in only one cell
If you look clearly values are separated with a comma -> ,
Depends on what you want to do? Use the dataset in Excel or in a pandas dataframe?
upper junco
excel
lapis sequoia
Ok. So open an empty/blank workbook like this

click From Text
Then you get some options depending on if you are on a mac or pc
let me know if get stuck, otherwise plenty of guides on google
upper junco
it works thx you
lapis sequoia
Awesome
 mint vine
Is there a GPT-NEO happytransformer group anywhere you know of?
 olive jackal
lapis sequoia
Ok. So open an empty/blank workbook like this
olive jackal
lapis sequoia
Ok. So open an empty/blank workbook like this
seeing excel on mac is a painful experience
olive jackal
upper junco
someone can help me, why is the dataset like this in only one cell
the correct way is as johnny said, but since you're on windows you will actually get power query.
another option is select the column, go to data > text to column > and choose the delimeter and data types.
but power query is the right way to do it (+ you can do so much more in there).
 olive jackal
you from holland?
anyways, choose the middle option, transform data
and change the thing on top left to unicode 8
upper junco
olive jackal
you from holland?
anyways, choose the middle option, transform data
and change t...
yes
it gives me this
 olive jackal
did you change it to utf8?
upper junco
yes
grave frost
odd meteor
This is the pictorial representation 😊
huh. A tensor doesn't have to be multidimensional though - so I think this is a bit misleading
olive jackal
on the source step, right side, bron, click the gear icon
grave frost
essentially, a tensor is just an array which can be moved across compute devices, and attached to graphs (until you .detach() it) for keeping track of ops. Its nothing fancy, just a framework specific way to keep thing clean and simple
there is no reason why one couldn't use numpy arrays (as some frameworks do), but they just convert it to a framework-specific standard to backprop and compute operations easily.
olive jackal
upper junco
yes
make sure it is like this
 upper junco
olive jackal
on the source step, right side, bron, click the gear icon
upper junco
olive jackal
on the source step, right side, bron, click the gear icon
now?
 olive jackal
yeah is it working?
upper junco
no idk why isn't working
upper junco
ok
olive jackal
i thought it is due to how comma and period are in dutch vs english but seems not
hollow sentinel
odd meteor
This is the pictorial representation 😊
oh so a scalar is just a constant itself
memes
 deft pollen
odd meteor
This is the pictorial representation 😊
deft pollen
odd meteor
This is the pictorial representation 😊
So each is comprised of multiples of the item before it? A tensor is a group of matrices?
hollow sentinel
thanks that clarifies things
a tensor is a matrix in which each corresponding row and column contains a matrix i think
deft pollen
hollow sentinel
a tensor is a matrix in which each corresponding row and column contains a matri...
So a matrix of matrices
Also it's spelled despacito 😛
hollow sentinel
changed the “des” part of it to my last name it’s a play on words
deft pollen
I assumed as much. Well played.
Does order matter when declaring which packages to import?
odd meteor
grave frost
huh. A tensor doesn't have to be multidimensional though - so I think this is a ...
Yeah, a tensor can come in different dimensions. 0 dimension, 1, 2, 3, etc. It's a concise pictorial representation of what's obtainable.
hollow sentinel
interesting
deft pollen
odd meteor
Yeah, a tensor can come in different dimensions. 0 dimension, 1, 2, 3, etc. It's...
A tensor of 0 dimensions is: (a) empty, or (b) nonexistant?
odd meteor
deft pollen
A tensor of 0 dimensions is: (a) empty, or (b) nonexistant?
Picture the front of a full loaf bread without any slices. That could be likened to a 0-dimensional tensor.
 odd meteor
hollow sentinel
oh so a scalar is just a constant itself
odd meteor
hollow sentinel
oh so a scalar is just a constant itself
Yeah
deft pollen
0-dimensional TensorToast 😛
hollow sentinel
i am so glad i have been looking at lin alg stuff
deft pollen
linear algebra?
deft pollen
noice.
hollow sentinel
i like using the strang lectures and then some other ppl on youtube to break things down as supplementals
also professor leonard for calculus and statistics is so so so good
hollow sentinel
meh strang’s lectures kinda confuse me
if i’m being honest i am lost 90% of the time i watch his stuff but it builds intrigue and makes me ask the right questions
deft pollen
Yesterday it was polynomials, today it's matrices. Go away, grade 8 math!
hollow sentinel
reduced row echelon formmm
deft pollen
hollow sentinel
if i’m being honest i am lost 90% of the time i watch his stuff but it builds in...
Never be afraid to ask.
hollow sentinel
yeah that’s why that math server i’m in comes in so handy
deft pollen
hollow sentinel
yeah that’s why that math server i’m in comes in so handy
here on disco?
hollow sentinel
mmhm
hollow sentinel
you got it
i’m also taking finite maths this spring semester so linear optimization should be interesting
i can’t wait till i know calc 3 well enough to do the partial derivatives for the cost functions in the o’reilly book
cobalt hearth
hollow sentinel
changed the “des” part of it to my last name it’s a play on words
your name is vier das?
cobalt hearth
DOXXED lol 😂😂
hollow sentinel
my name is totally vier
hollow sentinel
so elastic ridge regression and lasso regression are variations of linear regression to handle collinearity?
cobalt hearth
i dont know what regression is tbh
hollow sentinel
i.e
let’s say that i am trying to predict a patient’s weight given height, sex, and diet
the problem is that height and sex can be correlated and then the standard error of the coefficients would increase so ordinary least squares… wouldn’t work
so ridge regression would allow you to reduce the effect of the collinearity
i never heard of a “penalty term” in math
odd meteor
hollow sentinel
a tensor is a matrix in which each corresponding row and column contains a matri...
Essentially, a generalization of vectors and matrices to potentially higher dimensions. I think this picture will make it even more clearer
 hollow sentinel
huh
looks like an OLAP data cube
pretty sure that isn’t a coincidence
but anyways
a tensor is basically a cube then and allows us to reach a huge amount of dimensions
this has an A, B, C, G, J, I
it is a helpful way to visualize things because no doubt visualizing it as a matrix of matrixes would be difficult for us to process
especially when it keeps getting bigger
odd meteor
hollow sentinel
so elastic ridge regression and lasso regression are variations of linear regres...
Yes. Lasso and Ridge are excellent methods to improve the performance of your linear model. In fact, they're called Regularised Regression technique. We use this technique to penalize large coefficients.
Elastic Net on the other hand combines feature elimination from Lasso and feature coefficient reduction from the Ridge model to improve your model's predictions.
cobalt hearth
im too lazy to write the code in a picture soo im gonna use what i wrote to read it for me
odd meteor
hollow sentinel
i never heard of a “penalty term” in math
IDK about Math but since the discussion is on regularised regression, we have such in Statistics. In regularization, we have two penalty terms L1 and L2.
Remember, minimizing our loss function (MSE) makes our model as accurate as possible. However, we don't want our model to be super accurate on the training set if that means it won't be able to generalize well on a new data. so to avoid this ugly scenario from happening to us, we use regularization.
Regularization in Summary
MSE + α ( | β1 | + | β2 | + | β3 | + ... + | βn | )
where;
MSE = the loss function ==> Tries to make our model accurate
( | β1 | + | β2 | + | β3 | + ... + | βn | ) = Regularization Term ==> Tries to make our model simple
**α ** = The regularization hyperparameter we need to choose
when **α ** is too low ==> model might overfit
when **α ** is too high ==> model becomes too simple and inaccurate; leads to underfitting.
So, example of linear based models that embodies this type of regularization are Lasso and Ridge regression.
L1 is used by Lasso Regression, L2 is used by Ridge Regression and SVM, while Elastic Net combines both L1 & L2.
hollow sentinel
"However, we don't want our model to be super accurate on the training set if that means it won't be able to generalize well on a new data. so to avoid this ugly scenario from happening to us, we use regularization."
sounds like overfitting
the training data
df.rename(columns={"first_name": "first", "last_name": "last"}, inplace = True)
df

maybe the syntax was changed recently
no seems like the syntax in the doc matches
df = pd.DataFrame({"A": [1, 2, 3], "B": [4, 5, 6]})
df.rename(columns={"A": "a", "B": "c"})
   a  c
0  1  4
1  2  5
2  3  6
has anybody here worked with opencv and image manipulation?
odd meteor
hollow sentinel
sounds like overfitting
Yeah, it is.
arctic wedgeBOT
Pasting large amounts of code
If your code is too long to fit in a codeblock in discord, you can paste your code here:
https://paste.pythondiscord.com/
After pasting your code, save it by clicking the floppy disk icon in the top right, or by typing ctrl + S. After doing that, the URL should change. Copy the URL and post it here so others can see it.
hollow sentinel
df['full_name'] = df['first'] + " " + df['last']
not sure what the deal is here
figured it out 🙂
i modified the dataframe before which is why "first" did not exist as a key in the dataframe itself
 civic stone
Hi Everyone,
i am MSc Student and currently i am working on my practical project
i have one questions can anybody help me on that
I want to implement a K-Means algorithm for Document Clustering, but I don't understand what this parameter random_state does? Why should I use it?
Does that mean there is no problem to set any number to random_state?
I will also need to run K-Means algorithms for Document Clustering, but when changing the random state number, I got different results? But without using a random state for each Run, I get different results.
Can anybody explain which value I should use to random state?
 orchid kayak
How can I define a 2D output shape in a model? Can a dense layer output a 2D shape?
 stray oar
im new to python and im just wondering if there is any tutorials out there to help with ai assistants?
lapis sequoia
stray oar
im new to python and im just wondering if there is any tutorials out there to he...
there are many, but I think it will be too difficult for you if you're just starting out  https://www.activestate.com/blog/how-to-build-a-digital-virtual-assistant-in-python/
stray oar
ok thanks
 modern cypress
Hey guys could anyone take a look at #help-kiwi, I'm having a weird output with my model.predict
Hey, I'm getting a weird prediction with my mode.predict using tensorflow. I'm getting a picture and resizing it to (1, 400, 400, 3) to match the model's input but when I used the .predict function I get a numpy array of 1,10.
 serene scaffold
@modern cypress why do you do [[[[screen_image]]]]?
modern cypress
I have realised this is due to my dense layer, but I am now not sure how to fix this
serene scaffold
also, it's easier for people to read if you copy and paste the actual text.
modern cypress
ahh sorry
model = keras.Sequential([
  keras.layers.Conv2D(input_shape=(400,400,3), filters=8, kernel_size=3, strides=2, activation='relu', name='Conv1'),
  keras.layers.Flatten(),
  keras.layers.Dense(10, name='Dense')
])
model.summary()```what is this model intended to do? and what are the significance of each index in the dense layer?
modern cypress
serene scaffold
what is this model intended to do? and what are the significance of each index i...
I am trying to detect fire and smoke in cctv footage, so I have three classes: "default", "fire" and "smoke". I am not sure about the dense layer, this is my first time using keras
But I have realised that the dense layer unit does affect the output shape
I was following a youtube explanation to begin with, but I must have not listened closely enough
stone marlin
[Thanks to Emyrs above for making me finally look up what Elastic Net does, haha. I honestly thought it was just a crummy version of an SVM until now.]
serene scaffold
modern cypress
I am trying to detect fire and smoke in cctv footage, so I have three classes: "...
I'm not sure what the best architecture for that task would be, though it sounds like the dense layer doesn't mean anything. one option would be for there to be three indices representing default, smoke, and fire, and having the prediction be the argmax of the three.
modern cypress
Oh, I think that's pretty much what I'm doing right now. I'm feeding the image as the x data, and y as the image's class index. I was getting around 0.85 test accuracy, but that doesn't mean much if I don't have a usable output.
lapis sequoia
modern cypress
But I have realised that the dense layer unit does affect the output shape
depends on shape of dense later.
modern cypress
serene scaffold
I'm not sure what the best architecture for that task would be, though it sounds...
Should I try remove the dense layer and look into argmax?
lapis sequoia
modern cypress
Should I try remove the dense layer and look into argmax?
they meant argmax means just take the result which has maximum.
modern cypress
Oh, right
 molten kestrel
Q.url generated for Streamlit not working properly. ngrok tells me to register again even though I have already registered or gives me an error
Below is my code for deploying my ml model on streamlit.
I am using Google Collab
https://paste.pythondiscord.com/peyicuveco.py
Note: Initially I did not have ngrok on my PC
After running the last code block I got the url but ngrok wanted me to create an account. I created an account, extracted ngrok on Windows, authenticated my ngrok agent and restarted my computer. I ran the last block again and got an error "Your account may not run more than 2 tunnels over a single ngrok client session." So I killed the process and ran all code blocks. However, after gettiing the URl and running it in the browser it tells to to register again.
Note: There is a warning when the URL is generated 't=2022-01-22T22:40:55+0000 lvl=warn msg="can't bind default web address, trying alternatives" obj=web addr=127.0.0.1:4040'
Why is this hapenning?
Can someone tell me what I should to do in order to solve the situation?
Edit: I tried to change port to 5040 that has listening state but then it shows a different error 'The connection to URL was successfully tunneled to your ngrok client, but the client failed to establish a connection to the local address localhost:5040.'
 young cairn
does anyone know how to fix this? ;-;
i'm implementing binary classifier using keras
 odd meteor
civic stone
Hi Everyone,
i am MSc Student and currently i am working on my practical projec...
odd meteor
civic stone
Hi Everyone,
i am MSc Student and currently i am working on my practical projec...
Just like you've rightly experimented and observed, random_state is simply used for result reproducibility. If you don't wanna to get varying result each time you run your code, you need to set a seed or random_state
The value you use for setting the random_state doesn't really matter. You can use 2022, your atm password 😀, or any number of your choice.
civic stone
odd meteor
Just like you've rightly experimented and observed, `random_state` is simply use...
Thank you very much for your explanation; it's clear now.
but ATM password is a good idea LoL 😀
lapis sequoia
odd meteor
Just like you've rightly experimented and observed, `random_state` is simply use...
there's a famous number too for that right? I think 42.
civic stone
lapis sequoia
there's a famous number too for that right? I think 42.
Yes, I also noticed that many people used 42, but I have searched that, but all is saying 42 is also is a random number.
that's why i asked here to make sure and know reason behind that
stone marlin
42 (forty-two) is the natural number that follows 41 and precedes 43.
lapis sequoia
42 is a famous joke from hitchhiker yes.
it says that the meaning of everything is 42, I still need to goddamn read the novel.
also on page no 42 in philosopher's stone potter found out that You're a wizard harry.
https://grsahagian.medium.com/what-is-random-state-42-d803402ee76b
more of 42 things.
Ima stop here since this is more of an offtopic stuff.

Medium
A inquiry into what the number 42 has to do with machine learning and the universe
civic stone
but after all there is no any Machine learning meaning behind the 42 LoL
this is the ones that i wanted
lapis sequoia
the small humorous human elements in literature at the best
grave frost
odd meteor
Yeah, a tensor can come in different dimensions. 0 dimension, 1, 2, 3, etc. It's...
my point is that tensor is just an array. A vector, to simplify. A collection of scalars to simplify even more. There are no categories or taxonomy as was displayed in your pic - hence why I said that it looks misleading.
tensor = array = collection of scalars
stone marlin
I think it's a fair representation, considering there is structure to a tensor, it is not simply an array or a collection of scalars --- it's a multilinear mapping.
A vector is a "trivial" tensor, being a linear mapping --- it is not a way to simplify all tensors. You completely lose the structure of the tensor this way. The matrix representation in the figure, while simplified, retains this mapping structure by making it look like a "matrix of matrices" which is a reasonable way to represent multilinear maps.
lapis sequoia
Hello
I'm having an issue with calculating Cross-Entropy loss in my neural net
import numpy as np
import math
import nnfs
from nnfs.datasets import spiral_data
import matplotlib.pyplot as plt
nnfs.init


class LayerDense:
    def __init__(self, n_inputs, n_neurons):
        self.weights = 0.01 * np.random.randn(n_inputs, n_neurons)
        self.biases = np.zeros((1, n_neurons))

    def forward(self, inputs):
        self.output = np.dot(inputs, self.weights) + self.biases

class ActivationReLU:
    def forward(self, inputs):
        self.output = np.maximum(0, inputs)

class ActivationSoftmax:
    def forward(self, inputs):
        exp_values = np.exp(inputs - np.max(inputs, axis=1, keepdims=True))
        probabilities = exp_values / np.sum(exp_values, axis=1, keepdims=True)
        self.output = probabilities

class Loss:
    def CalculateLose(self, output, y):
        Sample_losses = self.forward(output, y)
        Data_loss = np.mean(Sample_losses)
        return Data_loss

class CrossEntropy(Loss):
    def forward(self, Y_prediction, Y_real):
        Samples = len(Y_prediction)
        Yp_clipped = np.clip(Y_prediction, math.e - 7, 1 - math.e - 7)

        if len(Y_real.shape) == 1:
            Correct_confid = Yp_clipped[range(Samples), Y_real]

        elif len(Y_real.shape) == 2:
            Correct_confid = np.sum(Yp_clipped * Y_real, axis=1)

        nlog_probabilities = -np.log(Correct_confid)
        return nlog_probabilities


X, y = spiral_data(samples=100, classes=3)

dense0 = LayerDense(2, 3)
activation0 = ActivationReLU()

dense1 = LayerDense(3, 3)
activation1 = ActivationSoftmax()

dense0.forward(X)
activation0.forward(dense0.output)

dense1.forward(activation0.output)
activation1.forward(dense1.output)

Loss_function = CrossEntropy()
loss = Loss_function.CalculateLose(activation1.output, y)
print("Cross-Entropy loss:", loss)``` this is the code, 2 input neurons, 2 hidden activation layers of 3 neurons each and 3 output neuronsIt prints out Cross-Entropy loss: nan
Not sure why, I looked around everywhere
If anyone spots it please let me know
thin palm
Does anybody know how to deal with "Dates" for a ML model?
thin palm
serene scaffold
what does the model do?
the model is predicting the price of a foreclosed home, haven't decided which algorithm to use yet. I hope I've answered your questions
 glad night
lapis sequoia
If anyone spots it please let me know
glad night
lapis sequoia
If anyone spots it please let me know
I ran it, and I got a runtime warning, it's trying to take the log of a negative value because correct_confid is negative in your CrossEntropy() function:
nlog_probabilities = -np.log(correct_confid)
Hope that helps anyway
lapis sequoia
I'm better at python then I am at maths 🤣
Like I'm trying to learn Neural nets to get into an interesting and cool field with a job market in FAANG and improve my maths
glad night
What IDE are you using btw?
lapis sequoia
VSC
glad night
Ah ok, I recommend Pycharm, it pointed out the exact line for me. Never used VSC though
stone marlin
I use VSC and it pointed the line out to me, too, haha. I think it's just gettin' used to whatever IDE one's workin' in.
I do love PyCharm, though.
glad night
PyCharm loves to scream at me about indenting, it's great
lapis sequoia
glad night
Ah ok, I recommend Pycharm, it pointed out the exact line for me. Never used VSC...
Pointed to that line as well
but I got confused
So I'm like what the hell?
glad night
Reminds me of the time I missed a semi-colon on the first line in MATLAB and the whole thing died. Anyway, I hope you resolve it!
lapis sequoia
import numpy as np
import nnfs
from nnfs.datasets import spiral_data


nnfs.init()

class Layer_Dense:
    def __init__(self, n_inputs, n_neurons):
        self.weights = 0.01 * np.random.randn(n_inputs, n_neurons)
        self.biases = np.zeros((1, n_neurons))
    def forward(self, inputs):
        self.output = np.dot(inputs, self.weights) + self.biases


class Activation_ReLU:
    def forward(self, inputs):
        self.output = np.maximum(0, inputs)

class Activation_Softmax:
    def forward(self, inputs):
        exp_values = np.exp(inputs - np.max(inputs, axis=1, keepdims=True))
        probabilities = exp_values / np.sum(exp_values, axis=1, keepdims=True)
        self.output = probabilities

class Loss:
    def calculate(self, output, y):
        sample_losses = self.forward(output, y)
        data_loss = np.mean(sample_losses)
        return data_loss

class Loss_CategoricalCrossentropy(Loss):
    def forward(self, y_pred, y_true):
        samples = len(y_pred)
        y_pred_clipped = np.clip(y_pred, 1e-7, 1-1e-7)

        if len(y_true.shape) == 1:
            correct_confidences = y_pred_clipped[range(samples), y_true]

        elif len(y_true.shape) == 2:
            correct_confidences = np.sum(y_pred_clipped*y_true, axis=1)

        negative_log_likelihoods = -np.log(correct_confidences)
        return negative_log_likelihoods


X, y = spiral_data(samples=100, classes=3)

dense1 = Layer_Dense(2,3)
activation1 = Activation_ReLU()

dense2 = Layer_Dense(3, 3)
activation2 = Activation_Softmax()

dense1.forward(X)
activation1.forward(dense1.output)

dense2.forward(activation1.output)
activation2.forward(dense2.output)

print(activation2.output[:5])

loss_function = Loss_CategoricalCrossentropy()
loss = loss_function.calculate(activation2.output, y)

print("Loss:", loss)```@glad night this is the code im basing it off
following video tutorial
why don't they have this error?
glad night
Theirs is positive. Now as to why, idk
lapis sequoia
there isnt a - on the y_pred_clipped in the class
stone marlin
Wait, why is the first one clipping at math.e - 7?
>>> np.clip([-10, -5, 0, 1, 5, 10, 20, 100], math.e - 7, 1 - math.e - 7)
array([-8.71828183, -8.71828183, -8.71828183, -8.71828183, -8.71828183,
       -8.71828183, -8.71828183, -8.71828183])
I think you maybe meant to do 1e-7 here?
glad night
Yeah, I just got to that part myself
glad night
stone marlin
I think you maybe meant to do `1e-7` here?
Also this
 golden iron
lapis sequoia
VSC
golden iron
lapis sequoia
VSC
Thought you'd moved to pycharm? Best IDE once you start getting serious
glad night
1e-7 is 1*10^-7, not e - 7
odd meteor
grave frost
my point is that tensor is just an array. A vector, to simplify. A collection of...
I don't have a Math major but I don't think a tensor is simply an array.
I'd say a tensor is 'something' that can be represented as a multidimensional array. So a low-rank tensor could be scalars, vectors, matrices.
But then again, I wasn't taught tensors in my linear algebra class so I might be wrong... 🤔
lapis sequoia
golden iron
Thought you'd moved to pycharm? Best IDE once you start getting serious
I am serious and I know a lot more serious people who use VSC
I guess I could try PyCharm once
stone marlin
I think you mixed up engineering notation like
>>> 1e10
10000000000.0
with Euler's number, e, which is approximately 2.7182818...
lapis sequoia
stone marlin
I think you mixed up engineering notation like
```python
>>> 1e10
10000000000....
yeah that was one of my concerns, in the videos they showed the clipping as 1e -7 which is eulers number -7
but i have math.e
which is also eulers number
I dont get it
glad night
Are you sure it's not 1 x 10 ^7
lapis sequoia
That's the main functional different
glad night
That's also 1e-7
glad night
stone marlin
I think you mixed up engineering notation like
```python
>>> 1e10
10000000000....
Engineering notation yeah
stone marlin
It's not euler's number, that's special notation called "Engineering Notation."
glad night
And on calculators
lapis sequoia
Yp_clipped = np.clip(Y_prediction, math.e - 7, 1 - math.e - 7)
lapis sequoia
stone marlin
It's not euler's number, that's special notation called "Engineering Notation."
What's Engineering notation
golden iron
Engineering notation or engineering form is a version of scientific notation in which the exponent of ten must be divisible by three (i.e., they are powers of a thousand, but written as, for example, 106 instead of 10002). As an alternative to writing powers of 10, SI prefixes can be used, which also usually provide steps of a factor of a thousa...
glad night
Do you have a scientific calculator? I think some of them use it
lapis sequoia
ah
lapis sequoia
glad night
Do you have a scientific calculator? I think some of them use it
I have one yes
I should seriously dig it up tbh
stone marlin
Yeah, so in this case, something like 4.5e-2 == 0.045. It's 4.5 * 10^-2.
The e thing here means "the first part times 10 to the power that follows the e."
lapis sequoia
    Yp_clipped = np.clip(Y_prediction, 1e - 7, 1 - 1e - 7)
                                       ^
SyntaxError: invalid decimal literal```It's honestly kind of weird and I'm not huge into using it, but it's done a lot in numeric computation so it's kind of something to remember.
lapis sequoia
this is my error when I try
stone marlin
1e-7
glad night
lapis sequoia
```
Yp_clipped = np.clip(Y_prediction, 1e - 7, 1 - 1e - 7)
...
Try without spaces
Otherwise it thinks you are trying to take the difference
I assume?
stone marlin
This is a weird syntactic sugar thing in Python. Yeah, with the space it looks for something called 1e, which it thinks is doing to be some kind of... i dunno, some sort of literal.
But without the space, it's engineering notation.
glad night
stone marlin
It's honestly kind of weird and I'm not huge into using it, but it's done a lot ...
I actually didn't know you could just use this notation with no extra functions. So I learnt a new thing
stone marlin
Haha, I'm not a huge fan of it specifically because there's a non-trivial amount of DS people who have been on my teams who don't know it.
stone marlin
But it does look a lot nicer. 1e-10 versus 10**-10. Either way, it's usually just used in boundary conditions, so people can sometimes get the gist of it by reading what it's for.
lapis sequoia
stone marlin
This is a weird syntactic sugar thing in Python. Yeah, with the space it looks ...
some decimal literal, hence the error
lapis sequoia
stone marlin
But without the space, it's engineering notation.
do you mean with
because that's how i got my error
darn engineering notation
stone marlin
Yeah, I thought I edited that sentence, haha, it is with.
lapis sequoia
neural nets have a lot of maths damn
glad night
lapis sequoia
neural nets have a lot of maths damn
Oh yeah, it's just pure maths and nothing else 😂
lapis sequoia
another issue is how if the Content_confid variable is negative then we get that error
I can solve that with exponential graph tho without losing the meaning of -
unlike abs
lapis sequoia
glad night
Oh yeah, it's just pure maths and nothing else 😂
Yeah learning it will seriously improve my maths
Picking up an edX linear algebra course aswell
intro to frontiers
glad night
lapis sequoia
Yeah learning it will seriously improve my maths
I took Neural Networks in my third year of university, so yeah 😂
glad night
lapis sequoia
I can solve that with exponential graph tho without losing the meaning of -
Not sure what you mean by this, but can it even be negative now you have the values right?
lapis sequoia
glad night
I took Neural Networks in my third year of university, so yeah 😂
Jesus
lapis sequoia
glad night
Not sure what you mean by this, but can it even be negative now you have the val...
Basically if my output is negative it gets put into negative log() for loss calculating
and then that is bad, so If it is negative I will use exponential graphing
it mentions this issue in my video series im watching
9 episodes and on the 9th
glad night
Ah I see
lapis sequoia
I may buy the book that goes along with it for 30 pounds and continue with it
so I can learn back propagation and stuff
glad night
Lemme know if you need help, I don't remember any of it, and I probably can't help you. I just want to learn it again 😂
thin palm
Anyone have any advice on what to do with the Date column for predicting the price of real estate forclosed hoomes??
lapis sequoia
glad night
Lemme know if you need help, I don't remember any of it, and I probably can't he...
Alright lmao
il ping you every time kk
hollow sentinel
how is the equation for multivariate linear regression different from linear regression?
z = w1x1 + w2x2 + ... + wnxn + b
it's a linear combination
but the equation to me looks the same to me as linear regression i thought something would be diff
stone marlin
Here, do you mean multiple regression or multivariate regression?
The tl;dr is that with multiple you have "one" z value (that is, one response variable) whereas with multivariate you have more than one.
hollow sentinel
i mean multivariate linear regression
stone marlin
Okay, for that, take all of the terms in your above equation and make them into row or column vectors.
hollow sentinel
but isn't that just linear regression too?
stone marlin
It's kind of a "vectorized" version but, yes.
hollow sentinel
i see
now i see
yi=β0+β1xi1+β2xi2+...+βpxip bc this is the formula for linear regression where Bp is a scalar and x(n) is a vector
column vector
stone marlin
ALSO, because this is a pet peeve of mine, sometimes authors will use these terms interchangeably. This seems to happen quite a bit if the authors aren't huge into stats.
Additionally, multivariate linear regression is not very popular compared to multiple linear regression. Also, the terms sound very, very similar.
hollow sentinel
yes i totally agree
i initially was confused and thought multivariate was the same as multiple linear regression
and i can see that multivariate isn't as popular now
stone marlin
There are some subtle differences between multivariate vs. just a line of multiple regressions, but unless you REALLY need multivariate, you're probably not gonna need it.
hollow sentinel
having more than one dependent variable
is essentially multivariate regression
my b i was just
curious
stone marlin
It's multiple response variables. So, kind of tldr:
- Simple Linear Regression: one Y, one X.
- Multiple Linear Regression: one Y, many X.
- Multivariate Linear Regression: many Y, many X.
glad night
Those are matrices right?
stone marlin
Yeah, it's kind of the "most general case" for this stuff.
hollow sentinel
also logistic rgression uses the same linear function notation as linear regression?
bc it is a non linear transformation of linear regression?
sorry i am kind of flooding this channel w questions
glad night
hollow sentinel
sorry i am kind of flooding this channel w questions
No it's great, please continue
I haven't thought about this stuff in years
stone marlin
Haha, here we get into the cool parts of what "linear" means. You can think of this a few ways, but a nice way might be something like:
Suppose you have a line like y = x, which is a fairly simple line. Suppose you want to have all of the positive values map to 1 and the negative values to 0 (or -1 or whatever). Then you need to transform this function to something that does that ---
hollow sentinel
a sigmoid function
stone marlin
--- so, this is exactly what we do. We transform the data to look like the sigmoid function, which makes all the positives go to 1 and the negatives to 0. The way to do this is to take the original line (which is the linear combo: b1x1 + b2x2 + ... etc.) and to pass that in to the sigmoid function, whch is
f(z) = 1 / (1 + e^{-z})
hollow sentinel
i read something in a stats textbook at one point about using transformations to make graphs easier to read
stone marlin
Yeah, it's the same sort of idea. You can think of taking the line in your hands and literally bending it into an S (well, like the sigmoid function).
hollow sentinel
did i say something funny
stone marlin
(This is sort of the reverse of what logistic regression does, but same idea. We do the inverse, then try to fit a line.)
hollow sentinel
i see
glad night
hollow sentinel
did i say something funny
I just thought it was funny because that's what he(?) was saying, I assume 😂
glad night
btw is this the log-linear model? Or is it something else that we're talking about?
stone marlin
So, there's a lot of types of regression. Polynomial regression, log regression, etc. Some are useful, some aren't. But all are approximately the same idea: do the inverse, fit the linear version, then you're good.
hollow sentinel
i'm gonna take a look at my stats textbook once i finish this prof leonard stats course
and look at the stats behind lin reg and log reg
stone marlin
I'm not gonna lie, I do not know what the log-linear model is. Haha, let me take a look.
hollow sentinel
just for funsies
glad night
stone marlin
I'm not gonna lie, I do not know what the log-linear model is. Haha, let me tak...

Quicker
I'm just reading my old lecture notes
iron basalt
stone marlin
Yeah, it's the same sort of idea. You can think of taking the line in your hand...
Quite possibly the most important idea for understanding linear algebra.
Help fund future projects: https://www.patreon.com/3blue1brown
An equally valuable form of support is to simply share some of the videos.
Home page: https://www.3blue1brown.com
Full series: http://3b1b.co/eola
Future series like this are funded by the community, through P...
hollow sentinel
aaaaah linear transformationsssss
iron basalt
(I recommend the series)
stone marlin
Huh. Oh, neat. This isn't quite the same, since we're actually using the inverse of a sigmoid (which is called the "logit" function).
glad night
stone marlin
Huh. Oh, neat. This isn't quite the same, since we're actually using the inver...
Ohhh that
stone marlin
Oh, nice, this is good, Squiggle.
glad night
stone marlin
Huh. Oh, neat. This isn't quite the same, since we're actually using the inver...
I remember the name but have no idea, I think I did that too
So funny how quickly you can forget things, if you don't practice
stone marlin
Yeah, every so often I have to go back and re-read stats books and software stuff so I remember junk, haha.
hollow sentinel
i've just been watching this nice stats series so i can ace the course i have to take this semester
and plus i have an internship rn and over the summer that expects me to use a lot of this stuff
in a weird way i'm kind of getting paid to learn lin alg, stats, calc basically on my own
it's actually going much better than i thought it would
stone marlin
Yep, stats is super important for most'a the DS landscape --- or at least the side I've been on. Lin Alg and Calc are pretty important to understanding the concepts, but stats is what's usually going to be the bulk of the stuff.
glad night
hollow sentinel
it's actually going much better than i thought it would
ey, that's good
hollow sentinel
i like calc
glad night
stone marlin
Yep, stats is super important for most'a the DS landscape --- or at least the si...
Y'all are inspiring me
hollow sentinel
i'm up to like implicit diff
i started like dec 17
but it is a lot of stats mostly calc will definitely help you with cost functions tho
lin alg matrixes, vectors, scalars, RREF
inverses
transpose
linear transformations as squiggle said
which really scares me how many people in my college are seniors in business analytics (my major) and don't know what a z-score is
 potent plinth
why
hollow sentinel
well i mean
stone marlin
Yeah, it's surprising how little math is required for jobs which depend on that kind'a stuff.
hollow sentinel
when i did my interview for cuna mutual group for ML it was a ton of stats questions
don't ask how i even got the interview as a freshman
i didn't know anything lmaooo
glad night
stone marlin
Yeah, it's surprising how little math is required for jobs which depend on that ...
Yeah, it's a little sad. The only jobs that use a lot of maths seem to be specifically research-focussed
hollow sentinel
but i mean i would say it is important to know stats
at least
stats will give you a strong foundation in this stuff
glad night
hollow sentinel
but i mean i would say it is important to know stats
Yeah, that's true. I think for the average person, they should at least know probabilties
stone marlin
Lots'a research jobs, yeah. Even DS/ML jobs, in general, don't always need it. It's one of those things where they're paying you just in case a big client comes in with a really hard problem.
hollow sentinel
for this internship i currently am doing
glad night
stone marlin
Lots'a research jobs, yeah. Even DS/ML jobs, in general, don't always _need_ it...
Do you work in DS?
hollow sentinel
i'm supposed to be training a model to tell whether or not a call is spam or "ham"
the only problem? i only have time-series data
stone marlin
I may be going into ML Engineering, but I've done DS in a few industries. I think a few people here are actively in the field.
hollow sentinel
as an independent var
glad night
stone marlin
I may be going into ML Engineering, but I've done DS in a few industries. I thi...
I want to get into it tbh, but I feel like now I need to refresh my maths skills
As well as Python 🥲
hollow sentinel
dw it won't take long to refresh that
iron basalt
stone marlin
Yeah, it's surprising how little math is required for jobs which depend on that ...
However, knowing some of the math that can be done quickly by hand on a napkin is really useful for quick sanity checks, so they probably should know them. Historically, many of the best in their field often do these small off the cuff sanity checks. It's a quick way to check if something is obviously wrong / bs.
(like z scores)
hollow sentinel
^
stone marlin
I agree, Squiggle, that's a very good point.
glad night
Nothing like getting a piece of paper and writing down some maths, I agree 😂
iron basalt
https://www.amazon.com/Art-Doing-Science-Engineering-Learning/dp/1732265178/ref=sr_1_1?keywords=the+art+of+doing+science+and+engineering&qid=1642978941&sprefix=the+art+of+doing+science+an%2Caps%2C87&sr=8-1 (recommended and relevant to previous point)

The Art of Doing Science and Engineering: Learning to Learn
hollow sentinel
fr guys i am so confused on how to create a binary classifier
with just time series data
stone marlin
It's been my experience that, sometimes, you'll be at a place and 90% of your job is just basic SQL queries and putting together very, very simple models, if anything. But then there's that 10% where they're like, "Okay, we have no idea how to do this, but here's a bunch of data. Figure out how to get value from this."
hollow sentinel
i mean how
iron basalt
(Also it's from Hamming, so...)
glad night
hollow sentinel
fr guys i am so confused on how to create a binary classifier
idk what that is 😂
hollow sentinel
stone marlin
It's been my experience that, sometimes, you'll be at a place and 90% of your jo...
that's basically what my internship is
stone marlin
We had a copy of this in the common room at my uni. :']
glad night
stone marlin
It's been my experience that, sometimes, you'll be at a place and 90% of your jo...
Ah ok
 lapis sequoia
glad night
Y'all are inspiring me
lapis sequoia
glad night
Y'all are inspiring me
learn neural networks again
glad night
iron basalt
https://www.amazon.com/Art-Doing-Science-Engineering-Learning/dp/1732265178/ref=...
Thanks for the ref
stone marlin
Time-series data. It's wild because almost every company I know uses this kind'a thing, and there are so few resources on it that are decent.
glad night
lapis sequoia
learn neural networks again
tbh that was my favourite
stone marlin
The only ones I can think of do most of the stuff in R.
hollow sentinel
my idea was somehow using that created-at column
lapis sequoia
@glad night do you know lin alg
glad night
lapis sequoia
<@!426881105816190996> do you know lin alg
ye
glad night
stone marlin
Time-series data. It's wild because almost every company I know uses this kind'...
Can you do this using SQL?
hollow sentinel
melat0nin do you mind if i dm you privately
stone marlin
You can do anything with SQL. :']
glad night
stone marlin
You can do anything with SQL. :']
lmao
stone marlin
I don't do DMs, unfortunately. Alllll public.
hollow sentinel
understood
yeah idk what to do here
i tried finding binary classifiers w time series data
stone marlin
Having said that, time series stuff is a little wonky. What are you trying to classify into two pieces, and what do you have in terms of data?
Let's see if we can all parse somethin' nice out.
hollow sentinel
i have a phone number called a "honey pot number" which are basically numbers used to collect calls
to a phone number that's blocked out completely as in the last digits are gone
whether or not it is spam
and the date it was created at
the date the call happened
stone marlin
Okay, so lemme see if I get this. We have:
- Some basically worthless ID column.
- Phone number from column. That's not censored.
- Phone number which that call was forwarded from, which IS bocked out.
- A binary column, saying if something is already blocked or not.
- Datetime col.
hollow sentinel
correct
my idea was somehow to use that datetime col to predict if it was blocked or not
stone marlin
So, the idea here is that, given SOMETHING about the forwarded phone number, we might be able to guess something about the (other) phone number being spam.
stone marlin
Well, sure, you could try that out. Perhaps spam callers call at a particular time of day, or some day of the week, or something like this.
hollow sentinel
yep
i have a creative idea
what if i could figure out area codes from these numbers
meh that would be a ton of work tho
stone marlin
That's do-able. In real life, callers which (spoof)-match your area code are high probability spam.
hollow sentinel
i can use some kind of df.iloc
with a filter
see common area codes and use a counts to see which ones appear frequently
stone marlin
You could do something like that. You could try to parse the area codes out into a new column and then groupby count.
hollow sentinel
oh yeah i think i even have the syntax for that from a corey schafer video
i can even use plot.ly
to visualize where these calls are coming from
create a map
like a heatmap
it would take a lot of parsing sure
lapis sequoia
yall like maths professionals and neural network and ML gods and I'm just sitting here trying to understand the lingo used
stone marlin
Haha, we were all once in the same position. :'] We know a little more now than we did before.
hollow sentinel
this is helping a lot this is like a quick sanity check for me
lapis sequoia
hollow sentinel
lin alg matrixes, vectors, scalars, RREF
like whhatever the hell scalars and RREF are
hollow sentinel
lapis sequoia
like whhatever the hell scalars and RREF are
oh i got you if you want to have some resources
lapis sequoia
I know matrices and vectors
lapis sequoia
hollow sentinel
oh i got you if you want to have some resources
Just curious as to what they are
and what's a tensor
iron basalt
lapis sequoia
and what's a tensor
That can only really be answered well if you have a solid grasp of linear algebra.
lapis sequoia
the series im using tells me tensors are kinda like arrays but a different type from a numpy array
hollow sentinel
a tensor is a matrix of matrices
lapis sequoia
hollow sentinel
5 is a scalar
fancy word for int i see
hollow sentinel
you can multiply 5 by an array in numpy
lapis sequoia
hollow sentinel
a tensor is a matrix of matrices
Oh lord, how many dimensions would that be
lapis sequoia
iron basalt
That can only really be answered well if you have a solid grasp of linear algebr...
Im only starting lin alg
hollow sentinel
a tensor can get really big
glad night
lapis sequoia
fancy word for int i see
int is a subset of a scalar
hollow sentinel
like huge dimensions
glad night
A scalar can also be a vector
iron basalt
lapis sequoia
Im only starting lin alg
Ok, it's the key to understanding a ton of mathematics. Its applications are really unlimited in number.
lapis sequoia
iron basalt
Ok, it's the key to understanding a ton of mathematics. Its applications are rea...
Yeah i figured it's nice to learn for neural nets and AI and ML
hollow sentinel
i would recommend trev tutor's linear algebra series as a supplemenal to gilbert strang's mit ocw course
hollow sentinel
as well as organic chem tutor videos to supplement strang's lectures
i don't like strang much
iron basalt
lapis sequoia
Yeah i figured it's nice to learn for neural nets and AI and ML
Chemistry, civil engineering, whatever, it's everywhere.
lapis sequoia
hollow sentinel
i would recommend trev tutor's linear algebra series as a supplemenal to gilbert...
im using edx university of texas lin alg intro to frontiers course
lapis sequoia
iron basalt
Chemistry, civil engineering, whatever, it's everywhere.
thats cool, big part of maths
stone marlin
The idea of scalars + vectors is covered in linalg with the notion of a "vector space" which is a bit more special than we're giving it credit for. But in this context, we can think of vectors as "direction + magnitude" and scalars as "regular ol' numbers that you can multiply vectors with".
lapis sequoia
@glad night what are all the subsets of a vector
glad night
lapis sequoia
<@!426881105816190996> what are all the subsets of a vector
Idk if this question makes sense 😂
iron basalt
lapis sequoia
thats cool, big part of maths
Yeah, after your first time going through it, I recommend going through it again with something like: https://www.amazon.com/Linear-Algebra-Right-Undergraduate-Mathematics/dp/3319110799/ref=sr_1_1?crid=D2P5OZZTP421&keywords=linear+algebra+done+right&qid=1642979972&sprefix=linear+algebra+done+right%2Caps%2C106&sr=8-1

Linear Algebra Done Right (Undergraduate Texts in Mathematics)
A second pass really helps and is worth it for this.
lapis sequoia
iron basalt
A second pass really helps and is worth it for this.
will remember
glad night
btw can I ask a Python question?
stone marlin
I'd def do Axler as a second resource, def not a first one (as you noted). I'm not even a huge fan of it, but it's an important way of thinking about LA.
lapis sequoia
stone marlin
The idea of scalars + vectors is covered in linalg with the notion of a "vector ...
So scalar is something you can manipulate vectors with
like you can multiply it by 5
hollow sentinel
exactly
you could go 5 (a scalar) *a col vector of (1,1,1) and you'd get (5,5,5)
iron basalt
stone marlin
I'd def do Axler as a second resource, def not a first one (as you noted). I'm ...
The "presenting the same information in as many different ways as possible" approach is what i'm trying to get across with that. And that book does do things a bit differently.
hollow sentinel
iron basalt
The "presenting the same information in as many different ways as possible" appr...
strang does a lot of that w dot product
stone marlin
Yeah, v reasonable. Both are fine books [strang + axler].
stone marlin
Just so that any future mathematicians who wander in here don't yell at me: we're glossing over some technical parts of vector spaces here, for simplicity. For most applications in ML, we're gonna be using real (or, at worst, complex)-valued matrices as vectors, and scalars will most likely be real (or complex, at worst).
hollow sentinel
but i am gettin better at keeping up w his book
stone marlin
But the study of vector spaces [and linear transforms] is very vast and very general.
It's one'a those things you'll learn "this is basically what it is" right now, and later when you learn the more general version you'll have an idea of why that more general version works.
lapis sequoia
hollow sentinel
you could go 5 (a scalar) *a col vector of (1,1,1) and you'd get (5,5,5)
nice
2 more questions
can you do something to a vector with a scalar other than multiply (divide it by the scalar or take away euclidean length)
stone marlin
Scalars, by definition, can only scale (that is, multiply) vectors.
lapis sequoia
and vid mentions vectors have direction and magnitude but not location, is there a name for a vector with a location
lapis sequoia
stone marlin
Scalars, by definition, can only _scale_ (that is, multiply) vectors.
ah ok
stone marlin
Remember that in this case division is multiplying by the inverse. So you can "divide" (except by 0).
lapis sequoia
so a scalar is just any number which scales (multiplies) a vector
stone marlin
Vectors are typically thought of to be centered at the origin. The study of vectors (and vector-like things) not centered there is --- if I'm recalling correctly --- affine geometry.
It doesn't come up all that much because it's fairly complicated and usually is unnecessary since what people usually want is for a vector to act on something else --- like, for it to stand for velocity for a thing that's moving in some other space.
lapis sequoia
got it
affine vector would be a name of it?
or biased vector
idk
a vector with offset position
stone marlin
Uhh, that I'm not sure of. I've not worked with affine spaces in a long, long time.
iron basalt
(I recommend the 3b1b essence of linear algebra series for a quick overview to all this)
lapis sequoia
im asking so many question cuz this is very cool
iron basalt
(affine transformations are the ones that (can) translate the origin, basically what most video game math is about)
lapis sequoia
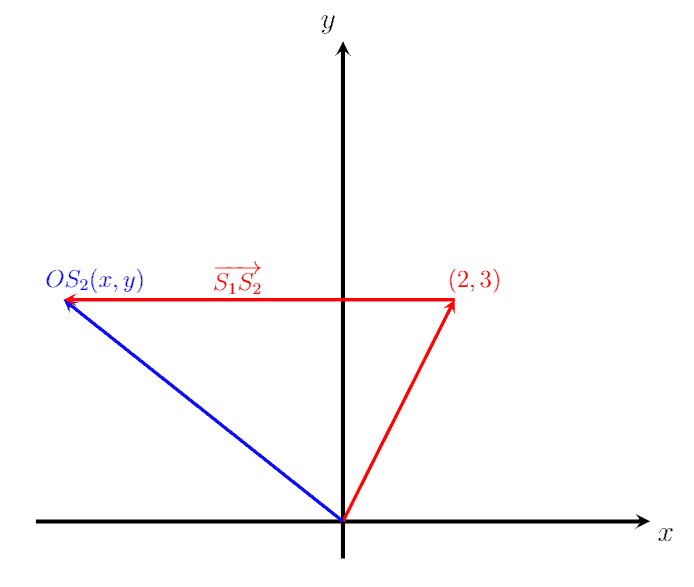
Position vector is the vector which indicates the location of a given point with respect to an arbitrary reference point say origin.
would this be a name for it
lapis sequoia
iron basalt
(affine transformations are the ones that (can) translate the origin, basically ...
oh so a location which isnt the origin
iron basalt
If X is the point set of an affine space, then every affine transformation on X can be represented as the composition of a linear transformation on X and a translation of X. Unlike a purely linear transformation, an affine transformation need not preserve the origin of the affine space. Thus, every linear transformation is affine, but not every affine transformation is linear.
Here is a concrete example of how linear algebra is used in the wild (outside of DS/ML) and how it can help you understand why it works (this is not a simple example, I wanted something more complex): https://www.youtube.com/watch?v=0me3guauqOU

Go to https://brilliant.org/Reducible/ to start free and learn more about computer science, mathematics, and a whole host of topics. First 200 members to sign up get 20% off the annual subscription!
Chapters:
00:00 Introducing JPEG and RGB Representation
2:15 Lossy Compression
3:41 What information can we get rid of?
4:36 Introducing YCbCr
6:10...
 lime leaf


