#data-science-and-ml
1 messages · Page 367 of 1
 lapis sequoia
 serene scaffold
lapis sequoia
Would anyone here be willing to take a look at my jupityr notebook and just tell...
serene scaffold
lapis sequoia
Would anyone here be willing to take a look at my jupityr notebook and just tell...
everyone's first DS project is dogshit.
lapis sequoia
great!
serene scaffold
but if you send me the link, I'll tell you what I hate most about it.
lapis sequoia
serene scaffold
everyone's first DS project is dogshit.
im trying to whip up some visualizations and sucking hard
 hexed schooner
can anyone tell me what kind of EDA we need in GAN project? and what is the purpose behind it ? is there an EDA where u stack all the images together and check whether there are some weird images or what
 ashen umbra
Not sure if this is the right channel to ask this, but does anyone here have some experience with tableau and willing to ans some questions thru dm? Would be much appreciated! TIA!
Btw i wanna dm cause i dont wanna overwhelm the chat here
 half steppe
Hey there
Anyone can tell me where to start with python, I want to learn this language for data analytics
Just a beginner who is transitioning from teaching to data science field
lapis sequoia
!resources
 arctic wedgeBOT
Resources
The Resources page on our website contains a list of hand-selected learning resources that we regularly recommend to both beginners and experts.
lapis sequoia
it's a great page made by this Discord, you can easily pick your resource based on how you like to learn
 sour shoal
Hi I need help
I just made a Neural Network for a project, It only works for inputs of 3 layer size
for some reason it does not work for 4 and above
what I mean by this is that the code runs for all sizes
except the cost function decreases a very very small amount for anythging above 3 layers
so the result is bogus
anyone have a clue why this is the case?
is the formula different depending on the number of layers used?
I would think the back propagation method stays the same
except you loop some more
I would send the code
but my GITHUB account has been suspended
sour shoal
 pastel valley
yo why do you guys use graphs on seeing the model performance
pastel valley
yo why do you guys use graphs on seeing the model performance
Well in my NN project, I have a cost function which I graph at the end to see if my NN is making better estimates as its being trained and to see after how many iterations it will take before my NN will be overfitting
does that answer your question?
 rapid pawn
peeps quick question so I have CUDA 11.5 with tensorflow setup on my windows machine and now i would like to try pytorch for the first time and all i could find on the docs is an installation option for CUDA 11.3 i would like to know if the installation process will work for 11.5 or do i need to download and install CUDA 11.3 again?

and i suppose it doesnt have a 11.5 package yet do i just install 11.3 then?
rapid pawn
nvm i just tried installing 11.3 it worked lol
 silver swallow
F
lapis sequoia
sour shoal
I just made a Neural Network for a project, It only works for inputs of 3 layer ...
Why your GitHub acc was suspended?
Sorry about that!
Did I make mistake because I used Reply? So Reply is also pinging?
 blissful schooner
Hi all
 sterile phoenix
whats the best way to learn panda and seabron (preferably video )
i ve finished a beginner python course and now ive been assigned data science tasks for an internship
serene scaffold
sterile phoenix
whats the best way to learn panda and seabron (preferably video )
you're more likely to learn by doing. try the kaggle pandas tutorial.
sterile phoenix
serene scaffold
you're more likely to learn by doing. try the kaggle pandas tutorial.
will try
but in second thought
considering my knowledge this should be doable in 3-4 days time right?
 serene scaffold
sterile phoenix
considering my knowledge this should be doable in 3-4 days time right?
serene scaffold
sterile phoenix
considering my knowledge this should be doable in 3-4 days time right?
that shouldn't take too long if you figure out how to restate what those are asking in a googleable way
then again, that might require a vocabulary that you don't currently have. which there's no shame in.
I check this channel pretty regularly, so if you get stuck I might be able to help. though I have a full time job so please don't ping unless I've already started helping with your quesiton
sterile phoenix
serene scaffold
that shouldn't take too long if you figure out how to restate what those are ask...
valid but considering its for an intership learning wont hurt me i
sterile phoenix
serene scaffold
I check this channel pretty regularly, so if you get stuck I might be able to he...
yeah appreciate it no worries
can I use jupyterlab instead of notebook even though i was advised for the latter
but i dont see any major differences
 desert oar
sterile phoenix
can I use jupyterlab instead of notebook even though i was advised for the latte...
desert oar
sterile phoenix
can I use jupyterlab instead of notebook even though i was advised for the latte...
who advised you to use notebook instead of lab? i recommend lab for new personal setups
i think the interface is nicer, and it is newer, so in the future you can expect lab to become standard
sterile phoenix
sterile phoenix
considering my knowledge this should be doable in 3-4 days time right?
by this company offering intership
but i guess makes no difference
desert oar
sterile phoenix
whats the best way to learn panda and seabron (preferably video )
i suggest not using videos to learn programming. videos are good for teaching concepts, but not good for learning how to actually write and work with code
reading software documentation is also a skill that takes practice. do not avoid practicing it
sterile phoenix
desert oar
i suggest _not_ using videos to learn programming. videos are good for teaching ...
hmm what do you suggest
sterile phoenix
sterile phoenix
considering my knowledge this should be doable in 3-4 days time right?
my main goal rn is finishing this
and afterwards id probably learn better during the intership
desert oar
sterile phoenix
and afterwards id probably learn better during the intership
that's fair. seaborn i think has good enough "user guide" documentation that you can get started there
pandas also has a couple of "user guides" that are good enough for the basics, but are not very comprehensive or detailed
that should give you more than enough material to work through
feel free to ask specific questions here, but don't forget about stackoverflow too
sterile phoenix
desert oar
that's fair. seaborn i think has good enough "user guide" documentation that you...
well that went over my head
sterile phoenix
desert oar
that should give you more than enough material to work through
thank you
sterile phoenix
desert oar
feel free to ask _specific_ questions here, but don't forget about stackoverflow...
i was just lost i ll mainly use the help channels or stckoverflow for other things mb
desert oar
sterile phoenix
well that went over my head
https://seaborn.pydata.org/tutorial/function_overview.html even this went over your head?
one tip for reading docs: it's sometimes useful to look at the code samples first, and then read the surrounding explanations
sometimes they use too many words like in this sentence:
The seaborn namespace is flat; all of the functionality is accessible at the top level. But the code itself is hierarchically structured, with modules of functions that achieve similar visualization goals through different means. Most of the docs are structured around these modules: you’ll encounter names like “relational”, “distributional”, and “categorical”.
which isn't that meaningful on its own, but once you see some code, it makes sense
 fathom lark
What python modules are supposed to be used for making ai?
serene scaffold
fathom lark
What python modules are supposed to be used for making ai?
sklearn, pytorch, tensorflow
plenty of others
lapis sequoia
Hello I need a help in python
serene scaffold
lapis sequoia
Hello I need a help in python
no one's really going to offer to help unless you ask your question
lapis sequoia

My file became damaged after appending operation but why I can't understand
My code is herehttps://paste.pythondiscord.com/ikuyeyazil.py
serene scaffold
lapis sequoia
so you opened a CSV file and appended text onto the end? try reading the CSV file into a DataFrame and concatenating them, then writing the whole thing back to file.
 austere swift
lapis sequoia
My code is herehttps://paste.pythondiscord.com/ikuyeyazil.py
austere swift
lapis sequoia
My code is herehttps://paste.pythondiscord.com/ikuyeyazil.py
the initial read_csv uses sep=';', but your to_csv doesn't have that so it's using the default , separator
lapis sequoia
austere swift
the initial `read_csv` uses `sep=';'`, but your `to_csv` doesn't have that so it...
I tried also with sep ; but not helped
lapis sequoia
serene scaffold
so you opened a CSV file and appended text onto the end? try reading the CSV fil...
I have already put it into df
df2= pd.read_csv('C:/Users/apskaita3/Desktop/Nasdaq_file/share_export.csv',sep=';',skiprows=1)
df3=df2.append(df,ignore_index=True)
df3 = df3[~df3.index.duplicated()]
#df3= df.sort_values(by=['Execution Time']
#df3.columns = df3.columns.str.replace(' ', '')
#print(df3.columns)
#print(df3.iloc[:, 1])
df3.sort_values(by=['Execution Time'], inplace=True, ascending=False)
#print(df3.columns.tolist())
df3.to_csv('C:/Users/apskaita3/Desktop/Nasdaq_file/share_export.csv', index=False)
So where problem is?
How read and .csv file to dataframe?
 lavish rune
hey, can anyone help me with a python simulation problem??
serene scaffold
Those of you who have used graph databases, which have you used? I know what the options are, but I'm interested to know what people are using in practice.
serene scaffold
lavish rune
hey, can anyone help me with a python simulation problem??
you probably won't attract any volunteers if you just state the topic of the question. go ahead and ask your whole question.
lavish rune
ok so the question is:
Using simulation. Write a Python program that takes 3 inputs. The first input is the
average speed of a bike.(V1). The second input is the average speed of an electric bike.
(V2)and the third input is the distance between start and finish. Your program must
display who will reach the finish line first and the time it takes to cover this
distance.
Example:
Enter bikes average speed(m/h):1
Enter electric bikes average speed(m/h):2
bikes position:25.02
electric bikes position:50.03
After 25.02 hour(s), electric bike reaches finish line first
 marble talon
isnt that physics
lavish rune
yes
lavish rune
no i have it this semester
 rose spade
hey guys i am studing Genetic Algorithems would it be possible for one of you guys to help me with one question
Discuss the different solutions to address the failure of simple crossover strategies(to solve the disadvantages) for the travelling salesman problem.
In particular:
why they are necessary
how they are applied
how they preserve the parental traits
what other possible methods are available
lavish rune
but i cant use math to solve it
marble talon
ok wait
 stone marlin
Re: graph databases, I've used Neo4j in the past and it was fine for what I needed it for. I tried Redis' offering, and it was, at the time, a bit lackluster but "got the job done" --- though it was very minimal. I've heard good things about Amazon Neptune, especially if you're already in the AWS env.
What're you gonna be usin' it for? Network analysis?
austere swift
lavish rune
but i cant use math to solve it
then you can't solve it
lavish rune
r u sure
stone marlin
Darsh, this isn't data science, this is regular science. You may have more luck asking in a regular help room.
lavish rune
okk I asked there to but I got no response
rose spade
is someone able to answer my questions
stone marlin
Geki, this sounds like homework, you may get more responses telling others what you've tried so far.
rose spade
no preparing for exams on 4 months
 warm raven
Hello, I have two data frames. One data frame holds the incidents, products(mapped to prod_code_name), their priorities, state, and their product IDs.
I have an output data frame with a date range, holding the product names, IDs and priorities.
I have also parsed the dates as date time values in both dataframes.
I am trying to count number of incidents open(among many other things) and I am trying to use .apply to check the conditions and then count each instance for each product at that priority on any given day. Filtering down the data frames I can for sure see potential matches. But doing a simple .unique of the created column shows and array of 0. Any Idea what’s going on here?
                                                        & (incident['Open_Month_Number'] == x['Month_Number'])
                                                        & (incident['Open_Year_Number'] == x['Year_Number'])
                                                        & (incident['prod_code_name'] == x['product_name'])
                                                        & (incident['id_map'] == x['product_id'])
                                                        & (priorityconversion(incident['Priority']) == x['Priority'])
                                                        & (
                                                            (incident['State'] == 'New') |
                                                            (incident['State'] == 'Work in Progress') |
                                                            (incident['State'] == 'Open') |
                                                            (incident['State'] == 'On hold')
)]), axis=1)```there's definitely a better way to do it than this. Also, you can't do things like (incident['Open_Month_Number'] == x['Month_Number']) & (incident['Open_Year_Number'] == x['Year_Number']) because those two are mutually exclusive.
sorry, I misread it
though there's still definitely a better way to do it.
if you show the data in a copy/pastable way (print(incident.head().to_dict('list'))), I will help.
desert oar
what is incident?
if it's a dict then this might actually be the best solution, although you should use and instead of & because these are scalar values, not arrays
oh wait, i see
yeah this is chaos
also wow those are some long lines of code
it sounds like you are looking for the equivalent of this sql:
select count(*)
from incidents, products
where
  incident.product_id = product.id
?
it's not clear what output is or how you produced it. but it does seem like you are doing things in a circuitous way
 ocean flame
Anyone in here have much experience with modeling physical systems? Such as chiller plants
 thin basin
hi, does anyone know how do I fix it?

 sleek tapir
studying andrew ngs course
rn
is kernel
how much functional analysis do we need for kernels
 quiet vault
thin basin
hi, does anyone know how do I fix it?
quiet vault
thin basin
hi, does anyone know how do I fix it?
it appears that the soup.find() function is not working. It returns the value of none which is why table now does not have a method prettify.
I'm not sure about how the find method works though
arctic wedgeBOT
:incoming_envelope: :ok_hand: applied mute to @idle obsidian until <t:1642122934:f> (9 minutes and 59 seconds) (reason: duplicates rule: sent 4 duplicated messages in 10s).
ashen umbra
Hi does anyone know when we use kmeans clustering on a transformed data (by using PCA), why does the clusters look different from the ones found from the original data?
arctic wedgeBOT
:incoming_envelope: :ok_hand: applied mute to @tidal tangle until <t:1642123381:f> (9 minutes and 59 seconds) (reason: duplicates rule: sent 4 duplicated messages in 10s).
ashen umbra
also my kmeans plot looks like this.. does it make sense?

 stuck schooner
hi, can someone help with multi index and slicing, i'm struggling to get a line working
I have this dataframe

Which have multi index (year, location_code) index
I'm trying to select row that are between 1977:1987 of following country ['FRA', 'USA', 'DEU', 'JPN']
I have tried many things, read documentation and can't seem to get going further
I would expect that to work : df.loc[ : , ['FRA', 'USA', 'DEU', 'JPN'] ]
What's wrong with it ?
serene scaffold
stuck schooner
I have this dataframe
please do print(df.head(10).to_dict('list'), df.head(10).index) so I can help
the way you've written df.loc[ : , ['FRA', 'USA', 'DEU', 'JPN'] ], : is the row indexer and ['FRA', 'USA', 'DEU', 'JPN'] is the column indexer, so it won't work.
I suspect that the solution is df.xs(level='location_code', key=['FRA', 'USA', 'DEU', 'JPN'])
stuck schooner
 serene scaffold
stuck schooner
serene scaffold
stuck schooner
I will only accept actual text.
serene scaffold
your bad?
stuck schooner
{'export_value': [167381969.0, 477319967.0, 34278856.0, 499672.0, 7979629469.0, 1491610406.0, 8270415412.0, 4830449287.0, 6374719.0, 12814715691.0], 'import_value': [250549379.0, 176272720.0, 28891049.0, 145144473.0, 81732061431.0, 3147429191.0, 3795779611.0, 3174424775.0, 40723902.0, 10695414048.0], 'ratio_imp_exp': [149.6871977889088, 36.929676566411054, 84.2824188765226, 29047.950055236237, 1024.2588549821799, 211.00879816468643, 45.895876106688604, 65.71696723000913, 638.8344647034638, 83.46196908224486]} MultiIndex([(1977, 'AFG'),
(1977, 'AGO'),
(1977, 'ALB'),
(1977, 'AND'),
(1977, 'ANS'),
(1977, 'ANT'),
(1977, 'ARE'),
(1977, 'ARG'),
(1977, 'ATG'),
(1977, 'AUS')],
names=['year', 'location_code'])
... didn't edit df to df_temp ...
serene scaffold
@stuck schooner try this
df[df.index.get_level_values('location_code').isin(['FRA', 'USA', 'DEU', 'JPN'])]
not very pretty, unfortunately.
stuck schooner
Thanks it's working
I guess I can't really do better than that (:) to plot the 5 country :
'USA' : df_temp.loc[(df_temp.index.get_level_values('location_code') == 'USA')]['ratio_imp_exp'].droplevel(level = 1),
'Chine' : df_temp.loc[(df_temp.index.get_level_values('location_code') == 'CHN')]['ratio_imp_exp'].droplevel(level = 1),
'France' : df_temp.loc[(df_temp.index.get_level_values('location_code') == 'FRA')]['ratio_imp_exp'].droplevel(level = 1),
'Allemagne' : df_temp.loc[(df_temp.index.get_level_values('location_code') == 'DEU')]['ratio_imp_exp'].droplevel(level = 1),
'Inde' : df_temp.loc[(df_temp.index.get_level_values('location_code') == 'IND')]['ratio_imp_exp'].droplevel(level = 1)
I was actually trying to find a better way to do it
serene scaffold
stuck schooner
I guess I can't really do better than that (:) to plot the 5 country :
'USA'...
this was your old solution, right?
stuck schooner
yes
serene scaffold
you can do df.loc[df.index.get_level_values('location_code').isin(['FRA', 'USA', 'DEU', 'JPN']), 'ratio_imp_exp'] to index by column as well
stuck schooner
creating a dataframe, dropping country name for axis plotting (and not have a tuple in axis) for each. Didn't find that way very nice
stuck schooner
serene scaffold
you can do `df.loc[df.index.get_level_values('location_code').isin(['FRA', 'USA'...
Right, but then how would I label them if i'm applying droplevel() to them
If i drop level

If i don't they appear as tuple

making a while with a list ['France', 'USA', ..] and ['FRA', 'USA', ...] would be the other way I guess but then that would not really help df_temp.index.get_level_values('location_code').isin(['FRA', 'USA', 'DEU', 'JPN'])
Thanks for your help anyway !
 kind rock
Hi, I keep running into an error with using keras.
import tensorflow as tf
print(tf.__version__)
This prints out 2.6.0 as it's supposed to.
But, This
mnist = tf.keras.datasets.fashion_mnist
throws ModuleNotFoundError: No module named 'keras' error.
Help, please
 spring mortar
We don't have a visualisation channel so I think this is the most appropriate channel to ask. I'm looking for a Python library that can do the following (example was done in Tableau). The main aim is to morph/grow/shrink polygon areas based on e.g. population. So in the case of the US, I believe areas like NY would grow and central areas with low population densities would shrink. What I'm looking for doesn't need to be as spectacular, I'd be okay with some kind of growing area that doesn't look as fancy to have a starting point as well.
I think it's called Gastner-Newman Cartogram (see https://www.pnas.org/content/101/20/7499, "Diffusion-based method for producing density-equalizing maps"). I can find resources like www.go-cart.io, which don't allow for the flexibility I need with the program.

 safe elk
Search for Python GIS libraries
I have also used QGIS in the past to make visualizations with geospatial data with less coding but it can be scripted with Python if you need it
spring mortar
I've tried working with fiona, shapely and geopandas. The geometric manipulations are barely a starting point since there is no way of morphing data which is the hard part. Creating hulls around polygons is rather trivial comparatively. I'll take another look in case I've missed something though.

 gentle lion
i'm trying to do linear regression with 2 outputs. However i dont know how to give those outputs to tensorflow. right now i get the error " failed to convert numpy array to a tensor (unsupported object type list"
gentle lion
If i convert the list returned in 'getRotations' to a numpy array i get the error failed to convert numpy array to a tensor ( unsupported object type ndarray)
gentle lion
I have no idea how to fix it even though it is probably easy
 frozen carbon
Hello! I am very interested in collecting data about people's opinion on AI and sentience for a school project. I would really appreciate it if you guys fill this google form! 😄

Google Docs
Hello I would be interested on your opinion on whether AI can be considered sentient or conscious.
gentle lion
    relative_path = os.path.split(path)[1]
    no_extension = relative_path[:-4]
    no_start = no_extension[12 + (no_extension[12:]).index('_') + 1:]
    return [math.sin(math.radians(int(no_start))), math.cos(math.radians(int(no_start)))]  # returns a array of 2 floats


filepaths = pd.Series(list(base_dir.glob(r'*/.jpg')), name='Filepath').astype(str)  # a pandas series of all image paths

rotations = pd.Series(filepaths.apply(lambda x: getRotations(x)),
                      name='Rotation')  # a pandas series that contains the 2 values for each image stored as array
images = pd.concat([filepaths, rotations], axis=1)  # a pandas series that concatenates the above 2

train_df, test_df = train_test_split(images, train_size=0.8, shuffle=True,
                                     random_state=1)  # split the data in test and train

train_data = train_data_generator.flow_from_dataframe(  # use the dataframe to read all the actual image
    dataframe=train_df,
    x_col='Filepath',
    y_col='Rotation',
    target_size=image_size_2d,
    batch_size=batch_size,
    subset='training',
    color_mode='rgb',
    class_mode='raw',
    shuffle=True,
    seed=42
)


val_data = train_data_generator.flow_from_dataframe(
    dataframe=train_df,
    x_col='Filepath',
    y_col='Rotation',
    target_size=image_size_2d,
    batch_size=batch_size,
    subset='validation',
    color_mode='rgb',
    class_mode='raw',
    shuffle=True,
    seed=42
)```here is my code btw, where train_data is passed as argument to model.fit (where the error occurs)
gentle lion
frozen carbon
Hello! I am very interested in collecting data about people's opinion on AI and ...
i'll fill it in
frozen carbon
Thank you so much!!!
gentle lion
use cmd 😄
 rain stone
gentle lion
use cmd 😄
rain stone
gentle lion
use cmd 😄
how to use cmd in pycharm?
rain stone
gentle lion
go to view--> tool windows --> terminal
its opening power shell
 gentle lion
np

 timber sky
Hi I am building a NN with keras and it has accuracy < 0.01%
So I assume I do something wrong:
My NN
model.add(LSTM(100, input_shape=(49,1), activation='relu'))
#model.add(Dropout(0.2))
model.add(Dense(1))
model.compile(loss='mean_squared_error', optimizer='adam', metrics=['accuracy'])
model.fit(X_train, y_train, epochs=3, batch_size=10)
My data:
see the parts from the screenshot 🙂


Nooone any idea?
gentle lion
i dont understand what you are trying to predict
and dont 99% of neural networks have an accuracy > 0.01% ?
 bold timber
Hello everyone, I've been taking a long time to learn this and I am still confused. How actually LSA works? I create this code but I don't understand why my first result is so different from the first text in the dataset?
Anyone can help to give me an explanation?
 timber sky
gentle lion
and dont 99% of neural networks have an accuracy > 0.01% ?
timber sky
gentle lion
and dont 99% of neural networks have an accuracy > 0.01% ?
really?
gentle lion
i think i'm not undestanding you
timber sky
all vids ive been watching have 50 $+
timber sky
corrected, mybad @gentle lion
timber sky
Input is sensor data, output is machine running, or not running or recovering @gentle lion
 slender sand
I don't need a tutor, but I really could use a push in the right direction... if I have a table or dataframe of stock data (let's say my columns are TICK, OPEN, CLOSE, VOLUME, PCT_CHANGE) and I want to know which features in which combinations have the largest impact on PCT_CHANGE, what method should I look into? I've used RandomForestClassifier before but only for binary outcomes.
 mint palm
i am looking for deep learning research areas.....
where should i start
i have heard about how we dont really know why NN work.....has their been progress in it?
i have also heard that we now are able to know which part NN is focussing on while training, to some extent....is it still work to be done?
desert oar
slender sand
I don't need a tutor, but I really could use a push in the right direction... if...
you can use RandomForestRegressor for a percent change
slender sand
beautiful, thanks as always 👍
desert oar
slender sand
beautiful, thanks as always 👍
note that stock price prediction usually isn't possible due to the efficient market hypothesis. you will also want to be careful with backtesting, e.g. including stocks that were delisted at some point. but if you are just practicing with the models and code i wouldn't worry about it
 tacit basin
I'm looking for resources on PySpark testing. Anyone can recommend anything?
stone marlin
I'd be into PySpark testing too --- I'm not sure how to do this besides the usual "assert" junk --- if anyone's got experience in that. Otherwise, maybe I'll spend some time trying to look into it tonight.
desert oar
the only good solution i've found is to run a pyspark cluster on your dev computer
i.e. there is no good solution
 grizzled stirrup
Hey everyone! I had someone help me write this code in Pandas:
``pattern = r"\d|."
for email in emails:
new_email = re.sub(pattern, "", email)
print(new_email)``
It is doing what I need it to do, BUT, I am needing to export the results to a .csv in Pandas. If this was a variable, all I would do is df.to_csv(index=False)
since it is a regexp and for loop, how in the world can I export the results to a .csv or dataframe?
Keep in mind I am new, just completing the foundational courses in Pandas and Automate the Boring Stuff with Python.
desert oar
grizzled stirrup
Hey everyone! I had someone help me write this code in Pandas:
``pattern = r"\d...
!code note: you can write multi-line code blocks. see below:
arctic wedgeBOT
Here's how to format Python code on Discord:
```py
print('Hello world!')
```
These are backticks, not quotes. Check this out if you can't find the backtick key.
desert oar
pattern = r"\d|\."
for email in emails:
    new_email = re.sub(pattern, "", email)
    print(new_email)
what is emails? a list?
grizzled stirrup
well actually, emails is a variable from a dataframe.
lapis sequoia
Any good/recommended tutorials to start learning how to use AI w/ python
desert oar
grizzled stirrup
well actually, emails is a variable from a dataframe.
so it's a column from a dataframe?
as in, you did something like this? emails = df['emails']
grizzled stirrup
yes! That's it
desert oar
do you want to modify the original values? or just save a new csv with only emails?
grizzled stirrup
just save the csv with only emails
desert oar
grizzled stirrup
just save the csv with only emails
note that this is not a list. it's called a Series, and it's a special pandas object
first of all, you can use pandas to do the string substitution and return a new Series object
this is usually a lot tidier and faster than looping
grizzled stirrup
ahh okay!
desert oar
https://pandas.pydata.org/docs/reference/api/pandas.Series.str.replace.html#pandas.Series.str.replace
https://pandas.pydata.org/docs/reference/api/pandas.Series.to_csv.html
new_emails = emails.str.replace(r"\d|\.", "")
new_emails.to_csv("new-emails.csv", index=False)
note the index=False option. the "index" in pandas is the array of row labels. by default, those row labels are written to the file. usually you don't want that, unless you know that you have meaningful labels. but by default, the row labels are just the row numbers
@grizzled stirrup ☝️
grizzled stirrup
desert oar
<@!168359606094004224> ☝️
You are my absolute hero buddy! Thank you so much. What you're saying makes sense, and the resources you linked are very helpful. I appreciate you taking the time to explain these things to me and be helpful
desert oar
of course, if you ask good questions you get good answers
 merry ridge
Not sure if this is relevant here, but I am running a large scale simulation and one of the parameters is asking for me to choose how many CPUs I want to use. This computer is using a CPU with 4 cores and 8 logical processors. This means that I can only set the number of CPUs to a maximum of 8 right? The reason why I ask is that it was previously set to 16 and I am confused how that is possible, unless each core has 8 logical processors and I can choose up to 32 CPUs
I feel like this should be easy to google, but I'm having trouble finding a reliable answer
To be clear, these logs do show 16 cores being properly initialized and given their own iterations
 inland galleon
merry ridge
Not sure if this is relevant here, but I am running a large scale simulation and...
inland galleon
merry ridge
Not sure if this is relevant here, but I am running a large scale simulation and...
don't they call it hyper threading? having 4 cores but 8 logical ones. This means that a single core can sort of simulate behavior of two.
merry ridge
That is part of the problem, it just asks how many CPUs which is kind of vague
inland galleon
so probably some low level coroutines, while idle on one process use it on the second one
 tidal bough
It likely just determines how many worker threads is spawned
if that's more threads than CPU threads*, that just means these extra ones won't produce a speedup
*I'm not totally sure whether one should aim for the number of physical cores or logical CPU threads (from hyperthreading), which is usually double that
merry ridge
That's helpful thank you
I noticed that running on 16 vs 8 seemed to be equally fast, that seems consistent with what you are saying
desert oar
merry ridge
Not sure if this is relevant here, but I am running a large scale simulation and...
i suspect that "number of cpus" really means "number of processes"
oh confusedreptile said that already
desert oar
tidal bough
if that's more threads than CPU threads*, that just means these extra ones won't...
it might be the case that too many processes slows things down, because of moving data around in memory
tidal bough
that's true, threads do have some overhead
inland galleon
desert oar
it might be the case that too many processes slows things down, because of movin...
makes no sense to me, why wouldn't they access similarly located data? 😛
merry ridge
I think I have a better understanding now thank you. I was getting really confused because different sites were using different terminology between logical processors, threads, cores, virtual cores etc and intel vs amd terminology being used interchangably
inland galleon
core = actual cores, threads = logical cores (processors)
inland galleon
merry ridge
I think I have a better understanding now thank you. I was getting really confus...
but usually you get better performance by implementing single threaded coroutines, unless you are doing some brute force on SQL (parallelization hints)
desert oar
inland galleon
makes no sense to me, why wouldn't they access similarly located data? 😛
threads probably would. processes might or might not. depends on if this is "python code" or e.g. C/C++ with a python wrapper
merry ridge
Oh this is much worse than that, but I don't want to get into a rant about what this job has entailed so far
inland galleon
desert oar
threads probably would. processes might or might not. depends on if this is "pyt...
I am so happy I do not have to work with C++ 😄 😂 anymore
merry ridge
I accepted this job offer 45 days ago and IT just sent me approval to have Python installed on my work machine yesterday.
For 2 weeks I was writing code in word pad
 iron basalt
merry ridge
Not sure if this is relevant here, but I am running a large scale simulation and...
iron basalt
merry ridge
Not sure if this is relevant here, but I am running a large scale simulation and...
CPUs or virtual CPUs, or cores?
merry ridge
I don't understand your question. This machine has a Intel Xeon E5-1630 v4
iron basalt
Ah, the Xeon, it's a complicated thing to program compared to most.
Intel's page says it has 4 cores, 8 threads.
desert oar
is that different from the usual intel hyperthreading?
iron basalt
Hyper threading is its own thing and only available on "Performance Cores".
There is a lot of things that matter for threaded performance when you really want to go fast. It depends on each specific machine. Each has its own optimal way of doing threading beyond obvious high level stuff like no locks.
For example, machines with many cores have multiple cores share cached memory. But with more cores they group cores into clusters that each share some memory. For best performance the threading needs to be done in a way where the parts that access similar memory need to be running in the same cluster (requires not only creating the thread, but telling it where to create it physically).
Not saying it applies to this Xeon, but there are many things like this when you want to get serious with threading. No abstraction will do.
Some libraries / drivers will try to make this work out for you. Like OpenCL, or CUDA (for GPUs).
So you can either choose to trust your library / drivers, or do it manually (spoilers: manual tends to work out better because of limited efforts put into the drivers / libs plus they don't know your specific problem).
When something like a cloud service asks you how many (virtual) CPUs you want, it's a very high level terminology / abstraction that allows for a lot of flexibility on their end, but pretty much makes it impossible for you to tell what is really happening. You can more or less only binary search your way to what the best number of vCPUs is for your problem (by observing how it does given X number of them).
Since you know what the actual hardware is in this case, you could go further.
iron basalt
merry ridge
Not sure if this is relevant here, but I am running a large scale simulation and...
So to answer this question, it does not make any sense since you are asking how many CPUs you can use on your one CPU. So what does "CPU" mean in that software?
Cloud services seem to have mixed up cores (or threads (physical or not)) with CPUs.
iron basalt
merry ridge
I think I have a better understanding now thank you. I was getting really confus...
This.
(It does not help that cores are different on GPUs and that every company tries to change the definition of "core" and "thread" to inflate their numbers and sell more product)
 simple ivy
hey all! i hvae a question- i built an object detection model and it currently takes ~5-ish hours to train, i read somewhere that changing the data from color to black and white would help reduce the training time. is it as easy as adding a filter to all the pictures? would appreciate any help here
serene scaffold
simple ivy
hey all! i hvae a question- i built an object detection model and it currently t...
first, do you understand why an image is a 3d array?
simple ivy
serene scaffold
first, do you understand why an image is a 3d array?
not entirely, i thought it was to store the rgb channels in an image
will look over some papers to understand more though 🙏
serene scaffold
simple ivy
not entirely, i thought it was to store the rgb channels in an image
one of the three dimensions is the rgb channels, right. so a grayscale image is just a 2d array, because it only has to store a number that represents how close to black a given pixel is.
so, the data representation is simpler, which I guess means there's less work the algorithm has to do.
if the image is strictly black and white, then I assume that means every element of the array would be exactly 0 or 1.
anyway, it looks like you can use this:
def rgb2gray(rgb):
    return np.dot(rgb[..., :3], [0.2989, 0.5870, 0.1140])
or this
from skimage import color
from skimage import io

img = color.rgb2gray(io.imread('image.png'))
converting it to strict black and white will be tricker as you'd have to decide which details get to be included.
simple ivy
serene scaffold
or this
```py
from skimage import color
from skimage import io
img = color.rgb2...
thx so much for the info! also i originally meant grayscale not in black and white, sorry for any confusion 
thx again @serene scaffold!
stone marlin
To add on here, because I had to do this for my job for a bit, there's a LOT of ways to turn an image to grayscale: https://www.kdnuggets.com/2019/12/convert-rgb-image-grayscale.html
In fact, some of the hyperparameters we had to tune were the amounts of red/green/blue we included in the gray-scale-ification. It was quite interesting because some values are better for humans to see pictures, but the ones which worked best for us (satellite images of crops) were no where near the best ones for us to look at, but the model loved them.
iron basalt
stone marlin
To add on here, because I had to do this for my job for a bit, there's a LOT of ...
Color spaces and color conversions is a huge rabbit hole. Especially when you have to start learning photography jargon.
lapis sequoia
Yay! Finally found ai community 😍😍
Started learning not so long
Hope I can gain a lot from here
serene scaffold
lapis sequoia
Yay! Finally found ai community 😍😍
there's a separate discord server about AI, though their goal is to maintain a space for experienced people.
lapis sequoia
Aiming to be a professional as well
serene scaffold
but yeah, you can ask questions here whenever you'd like. just make sure that you ask your question in an answerable way (don't withhold information until people volunteer themselves, use text instead of screenshots, etc.)
lapis sequoia
serene scaffold
but yeah, you can ask questions here whenever you'd like. just make sure that yo...
Sure I have quite some knowledge asking technical questions
I’m coming from a web development background.. I must confess I discovered web dev is boring when I started ai
serene scaffold
I created themes for websites when I was a teenager and the reception I got was so negative that now I never want to do web development.
 shut raven
Would this be a good channel for asking a data visualization question?
serene scaffold
@shut raven yes
shut raven
serene scaffold
<@904826407581020162> yes
Thanks, but I already got some help for my question/project.
If I have another question, I now know where to ask, ty.
Sorry for bothering
 frank acorn
I have a blank new notebook with 3 dividers
I want to use it for data science
How do i divide it?
 thick sundial
Hey guys if your hardware simply isn't up to scratch for latest stacks (e.g. pytorch with CUDA, tensorflow with CUDA) what are some other options for tinkering?
I've got an NVIDIA card that was good once but is too old now for the bleeding edge libraries.
serene scaffold
thick sundial
I've got an NVIDIA card that was good once but is too old now for the bleeding e...
if it doesn't support CUDA, it can't help you with machine learning in any way that I know of.
though NIVIDIA hasn't manufactured GPUs without CUDA for a while.
thick sundial
It supports CUDA but only up to driver version 425
Most of the new stuff I'm trying out doesn't support that far back
serene scaffold
are there older versions of those libraries that do?
 royal crest
thick sundial
It supports CUDA but only up to driver version 425
royal crest
thick sundial
It supports CUDA but only up to driver version 425
what's the source for this? i'm looking at official NVIDIA docs and i'm seeing something else entirely
for example, for cuda 11.x

and for cuda 10.x

 smoky birch
I've been trying to fine-une a program on google colab but ran out of ram space. I can't launch a jupyter notebook server so any idea on how to do a local run? I tried launching jupyter notebook on but it just keep saying
ERROR: Failed building wheel for tokenizers
Failed to build tokenizers
ERROR: Could not build wheels for tokenizers, which is required to install pyproject.toml-based projects
and idk what's wrong
thick sundial
royal crest
what's the source for this? i'm looking at official NVIDIA docs and i'm seeing s...
No I mean for my card model 425 is the highest driver that I can get
royal crest
thick sundial
No I mean for my card model 425 is the highest driver that I can get
what card is this
thick sundial
GeForce GTX 670MX
royal crest
thick sundial
GeForce GTX 670MX
this might be helpful for you

PyTorch Forums
Not necessarily, as you could install the NVIDIA driver and the compiler separately (as is apparently the case in your setup). To solve the initial error you would have to update the driver to a newer version.
the correspondence is still ongoing too
thick sundial
serene scaffold
are there older versions of those libraries that do?
Yeah probably, I might have to give that a go too
thick sundial
royal crest
the correspondence is still ongoing too
Thanks, I'll keep an eye on that
lapis sequoia
do any of you focus on specgrams?
 late shell
Hello, noob here, I'm trying to help my friend who is working on a Computer vision project. He has tons of videos of people performing some actions and want to predict what each person is doing in each frame of the video. There are like 5 categories [standing, punching, running, kicking, laying down]. He has first implemented YOLOv4 in order to get the bounding boxes (ROI) of each person and has cropped each box out form the video, now he wants to use a 3D CNN, to train what the person in the bounding box is doing. But we don't understand how to pass the input data in the CNN since each training sample will consist of multiple ROIs (region of interest/ bounding boxes) per frame. I was looking for a github repo that has already implemented this but so far, the ones I've found have only one ROI in each frame (i.e the whole frame consists of just 1 person performing some activity) unlike our case. Plz help the noobs, thanks in advance.
 odd meteor
serene scaffold
though NIVIDIA hasn't manufactured GPUs without CUDA for a while.
odd meteor
serene scaffold
though NIVIDIA hasn't manufactured GPUs without CUDA for a while.
Lowkey I'm annoyed no other company is really serious to rival CUDA. Maybe it's because my laptop isn't using Nvidia GPU... I think I'm cool with my Iris XE but I want more.
Why is only CUDA getting such grandiose preferential treatment in ML community? Anyways, that's what I wanna rant about this morning 😂
odd meteor
lapis sequoia
Yay! Finally found ai community 😍😍
Welcome 🎉🎉
 drifting mason
I have a column of items in an excel/CSV sheet, I want to google each item simultaneously with a keyword, how do I do so with python?
lapis sequoia

HotHardware
ZLUDA is a drop-in replacement for CUDA that runs on Intel GPUs with similar performance to OpenCL
thick sundial
odd meteor
Lowkey I'm annoyed no other company is really serious to rival CUDA. Maybe it's ...
Yeah I agree, I was shocked there's basically 1 manufacturer. So many things depend on having CUDA.
lapis sequoia
opencl..
lapis sequoia
drifting mason
I have a column of items in an excel/CSV sheet, I want to google each item simul...
You could read the CSV with pandas, and iterate over the dataframe, each iteration doing a google search. But you then need to aggregate the results somehow, maybe in an output xls sheet?
 wicked grove
odd meteor
Welcome 🎉🎉
wicked grove
odd meteor
Welcome 🎉🎉
VGG19 gives me an accuracy of 72 and val_accuracy of 71 just by removing the top layer and adding a dropout ,what are the different ways i can fine tune this to get 75/80?
My data dataset has 3390 images
I used epoch=50 and batcg size of 32
 somber star
I want to get into neural networks and decisions of the likes, but I can’t find any good video/ article on it, any recommendations?
wicked grove
somber star
I want to get into neural networks and decisions of the likes, but I can’t find ...
Deeplearning.ai specialization for neural networks
odd meteor
wicked grove
VGG19 gives me an accuracy of 72 and val_accuracy of 71 just by removing the top...
Whenever you get stuck training a neural network, consider some of the following:
• More layers, fewer neurons
• Play with the batch size
• Adjust the learning rate
• Early stop training
• Try a different optimizer
• Use a learning rate scheduler
• Try different dropout rates
• Add more quality data
wicked grove
odd meteor
Whenever you get stuck training a neural network, consider some of the following...
Thank you so much
How can i reduce the neurons
Also does early stop training only reduce overfitting?
odd meteor
wicked grove
Thank you so much
How can i reduce the neurons
Also does early stop training on...
Remember, number of neurons <==> number of nodes in a NN layer. Since you can set that value when building your NN architecture, you can also reduce it.
EarlyStopping is a callback that's used to prevent your model from overfitting. To the best of my knowledge that's the only thing I know it's being used for. If there's a new trick out there... I'm always happy to learn 😀
wicked grove
odd meteor
Remember, number of neurons <==> number of nodes in a NN layer. Since you can se...
The number of nodes is set like this right?ex: Conv2D(32,(3,3))
Ohhh okayy got it😁
wicked grove
wicked grove
The number of nodes is set like this right?ex: Conv2D(32,(3,3))
@odd meteor sorry,but is this how the number of nodes are changed?
lapis sequoia
Can someone guide me on how to keep the KL value the same when i am running multiple VAE model in sequence ?
odd meteor
wicked grove
<@519319496868233227> sorry,but is this how the number of nodes are changed?
Here's a brief example of ANN in TensorFlow using a Sequential model.
model = Sequential()
model.add(Dense(50, activation='relu', input_shape = (784,)))
model.add(Dense(50, activation = 'relu'))
model.add(Dense(10, activation =  'relu'))
model.add(Dense(2, activation = 'softmax'))
Then you compile your NN before training the Neural Nets.
So from the above example the input layer has 784 nodes while the 1st hidden layer has 50 nodes.
Remember number of nodes <==> Number of neurons. Now, notice how the neurons in the 3rd hidden layer was reduced from 50 to 10, yeah?
That's one of the ways to reduce the number of neurons in your NN.
wicked grove
Thank you so much i got itt! And each node takes a pixel and computes z and relu(z)?
wicked grove
odd meteor
Here's a brief example of ANN in TensorFlow using a Sequential model.
```py
mod...
And the reduction of nodes is totally dependent on us right?
odd meteor
wicked grove
And the reduction of nodes is totally dependent on us right?
Yes! It's your own prerogative to add as much hidden layers; and consequently, number of neurons, as you deem fit.
wicked grove
Got itt,thank youu😁
 wooden cosmos
Hi, I'm looking for a fast graph embedding algorithm, has someone any suggestions ? I tried node2vec, but that's so slow.
austere swift
thick sundial
It supports CUDA but only up to driver version 425
the max supported driver version isn't really what you should be paying attention to, what's more important is the compute capability (which is essentially a number that means what the gpu supports and doesn't support). iirc both pytorch and tensorflow require a minimum compute capability of 3.5
you can find the compute capability of your gpu here https://developer.nvidia.com/cuda-gpus
NVIDIA Developer
Your GPU Compute Capability Are you looking for the compute capability for your GPU, then check the tables below. NVIDIA GPUs power millions of desktops, notebooks, workstations and supercomputers around the world, accelerating computationally-intensive tasks for consumers, professionals, scientists, and researchers. Get started with CUDA and GP...
lapis sequoia
Hi everyone, I have a gym environment where there are multiple units controlled by a single agent. These units can also create new units and the units may also die. Since the number of units may vary, I am wondering how to make an action space if my Agent have to take actions for each units in a single step.
desert oar
odd meteor
Lowkey I'm annoyed no other company is really serious to rival CUDA. Maybe it's ...
Apparently it's because back when GPU stuff was getting popular for ML, AMD was struggling financially and didn't have the resources to develop something comparable
So they are now trying with their ROCm thing but i have heard it isn't quite there yet
Although apparently tf and torch do run on AMD now, but only specific cards
rapid pawn
peeps i hab question regarding the pytorch super() in their quick start example code, so i ve seen that they did py class block(nn.Module): def __init__(self, ...): super(block,self).__init__()
isnt this just the same as super().__init__() with no parameters inside? since block directly extends nn.Module
is there any reason in particular that they are doing it this way?
odd meteor
desert oar
Apparently it's because back when GPU stuff was getting popular for ML, AMD was ...
With the way Nvidia is aggressively marketing CUDA, I doubt if any other company could ever catch up. Well, a lot can still happen in the next 2 - 4 years.
odd meteor
lapis sequoia
https://hothardware.com/news/cuda-on-intel-gpus-zluda
Hmm that's an interesting development. Thanks for sharing. However, I'm not gon get my hopes up yet 😀
odd meteor
thick sundial
Yeah I agree, I was shocked there's basically 1 manufacturer. So many things dep...
There are other manufacturers bro but Nvidia's CUDA is unarguably the favourite in ML community.
iron basalt
If you are willing to program your own TF or Pytorch equivalent (with less features ofc), then you have several options. The restrictions of needing an Nvidia GPU comes mostly from wanting to use those libraries which have been built on CUDA, and rewriting all the kernels would be too annoying (would need a CUDA kernel and non CUDA kernel duplicate code). However, SYCL does exist and does solve this duplicate code issue (so when starting a new project, probably use either SYCL or OpenCL or maybe even Vulkan (although Vulkan is not on smaller devices)).
If you choose OpenCL, Pyopencl exists, and works fine. It even has its own numpy-like array type (and interfaces with numpy). It's meant to be like Cupy.
Another option is to use ML methods that do not require a GPU (such as sparse models).
(SYCL is the most CUDA-like, where it hijacks your C++ compiler so you can write kernels directly in C++)
https://sidsite.com/posts/autodiff/ For how to make your own autodiff system like Pytorch.
sterile phoenix
i dont know why im stuck here for this long
but i have a 'date' column which also containts the hour ex '2019-06-11 16:37:01.325' but i only need the date '2019-06-11' i ve been trying but to no result
 thin palm
hello Python homies
question -> When dealing with numbers in Python I must take a float and round it up to get a whole INT right? Because Machine Learning Models can't handle punctuation is this correct?
stone marlin
Give more context here, most, if not all, machine learning models can take features with float type.
thin palm
for example: here's a column named "Balance":
Balance has values like this $97,318.40
thin palm
stone marlin
Give more context here, most, if not all, machine learning models can take featu...
so: we need to clean this up.. I take away $ and ,
to get 97318.40
but do I need to take away the "." (period) that represents a decimal? Or should I round up to get whole number. such as 97318
stone marlin
# Make DF.
datetime_index = pd.date_range("2020-01-01", periods=10, freq="1min")
data = np.random.normal(size=10)
df = pd.DataFrame({"date": datetime_index, "value": data})

df["date"] = df["date"].dt.strftime("%Y-%M-%d")  # Formats the date.
df.head(2)
This might help to convert your dates.
thin palm
I hope that makes sense
stone marlin
sterile phoenix
i dont know why im stuck here for this long
Whoops, that was for you, Red.
stone marlin
thin palm
but do I need to take away the "." (period) that represents a decimal? Or should...
This is in a pandas dataframe, yeah?
thin palm
stone marlin
This is in a pandas dataframe, yeah?
yes, I was just double checking this is a legal move
because I know ML will not accept punctuation
stone marlin
Yeah, in this case, you're formatting it most likely as a string, so it won't be interpreted correctly. I'd do something like the second half of this:
import locale
locale.setlocale( locale.LC_ALL, 'en_US.UTF-8')

# Make DF with currency.
datetime_index = pd.date_range("2020-01-01", periods=10, freq="1min")
data = [locale.currency(100_000_000 * np.random.rand(), grouping=True) for _ in range(10)]
df = pd.DataFrame({"date": datetime_index, "value": data})

print(df.head(3))

# Convert the currency to float.
def currency_to_float(x: str) -> float:
    """Converts US currency ``x`` to float."""
    return float(x.replace("$", "").replace(",", ""))

df["value"] = df["value"].apply(lambda x: currency_to_float(x))
print(df.head(3))
Not the most elegant, but gets the job done.
The before-and-after outputs:
                 date           value
0 2020-01-01 00:00:00  $74,994,211.61
1 2020-01-01 00:01:00  $74,109,028.18
2 2020-01-01 00:02:00  $29,400,278.28

                 date        value
0 2020-01-01 00:00:00  74994211.61
1 2020-01-01 00:01:00  74109028.18
2 2020-01-01 00:02:00  29400278.28
The locale module has some methods for translating back and forth, but if it's just dollars, then this is fine.
thin palm
stone marlin
The locale module has some methods for translating back and forth, but if it's j...
Sweet, yeah I've done it all like this for the most part. I just really wasn't sure if the ML could intereprt the "."
so now it's in String, I need to format it into Float
stone marlin
Absolutely. Make sure that it's in float, though, otherwise it'll get messed up.
thin palm
stone marlin
Absolutely. Make sure that it's in float, though, otherwise it'll get messed up...
Thank you very much! Will make a quick function to do that now 🙂
thin palm
From start to finish?
The Sklearn modelling workflow
from sklearn import SomeModel
mdl = Model()
mdl.fit(X_train,y_train)
mdl.score(X_test,y_test)
mdl.predict(X_new)
X_train, X_test, y_train, y_test = train_test_split(X, y, test_size=0.3)
mdl = Model()
mdl.fit(X_train,y_train)
mdl.score(X_test,y_test)
mdl.predict(X_new)
1.) so using Sklearn we'd create the test and training
2.) instantiate the model
3.) fit the model our train
4.) then score it with our test
^
this is the process of creating and training
are you asking for a different tutorial?
not sure what he's doing in these photos, the way I create and train ML models is different syntax
Sure thing! Let me show you my approach
sterile phoenix
sterile phoenix
but i have a 'date' column which also containts the hour ex '2019-06-11 16:37:01...
welp i needed it for daily averages so the time gets in the way i tried split but it doesnt work with series
thin palm
I haven't used TF as much, I've used that mainly in Deep Learning. But let me show you my approach
sterile phoenix
your code created me new ones
thin palm
# Ready X and y
X = livecode_data[['GrLivArea']]
y = livecode_data['SalePrice']
# Split into Train/Test
X_train, X_test, y_train, y_test = train_test_split(X, y, test_size=0.3)```
confirm the above makes sensewhat we're doing is assuming we've cleaned our X and y for our ML model we're ready to create a model of our choice and test it yes.
once we'e split our data into 70% train and 30% test (hence the test_size=0.3)
we can then create our model. Let's say we're working with Linear Regression model
model = LinearRegression()

# Train the model on the Training data
model.fit(X_train, y_train)

# Score the model on the Testing data
model.score(X_test,y_test)```the score would then output something like .80% which is saying 80% rate that it's correct depending on our metric we use, yes?
that's the basic super easy rundown of how we create and test our ML models.
Now of course there's cross validation we can use to split our data further, we could use hyperparamters to tune our model to get the best predicted score
yes and no -> meaning your model may have different scores for each unique model
no it's telling us the score of how correct our model is
so in essence yes 80% accurate if your model is using the scoring metric 'accuracy'
there's hundres of scores, I hope that make sense
we can keep training it to improve our scores.
I wouldn't train it on a new dataset
because then you'd have to do the process of data engineering agian
the idea is to get ONE model from the best data you have and then use that model to make PREDICTIONS on newer data
that's why they'd pay you the big bucks if you can take their data and make predictions from the model you've been training 🙂
hope that makes sense, I'm offline now! Cheers mate.
stone marlin
If it's in Python, most people will either use VSCode, PyCharm, or Jupyter Notebook to mess around.
That's also fine, I think. I haven't used it, but I think that works.
Correct. But in sklearn, which is the package you use for a lot of ds stuff (that isn't Neural-Network stuff) pretty much all of the estimators/models are the same kind of deal.
You could replace that with whatever you want, depending on what the data is, but the code is essentially the same.
I'm not sure. I'm guessing an existing dataset. Lemme copy-paste a simple model I have.
serene scaffold
Has anyone made custom Series accessors before? I want to add a .set accessor, but I fear writing in in cython either wouldn't work or wouldn't be any faster.
odd meteor
iron basalt
If you are willing to program your own TF or Pytorch equivalent (with less featu...
Thanks for the detailed contribution. I've only used Colab and eGPU. I'll explore more on using OpenCL.
stone marlin
from sklearn.datasets import load_iris
from sklearn.model_selection import train_test_split
from sklearn.ensemble import RandomForestClassifier

# Get some data.  Here, we load a pre-existing dataset.
df_features, df_target = load_iris(return_X_y=True, as_frame=True)

# Create a train/test split.
x_train, x_test, y_train, y_test = train_test_split(df_features, df_target, test_size=0.33)

# Fit the classifier with training data.
rf_clf = RandomForestClassifier().fit(x_train, y_train)

# See how we did.
print(rf_clf.score(x_test, y_test))  # 0.98, so this has accuracy of 98% on the test data.
You may want to look at some "Intro to DS" videos or "Intro to Sklearn" videos, otherwise a lot of this may not make a whole lot of sense to you.
(I'm also off to do some work, so for more info you may want to ask someone else in the room. Sorry! Work calls.)
odd meteor
There's always this popular saying that goes "Break down things that are seemingly complex into small digestible bytes, if it's still complex, break it down again to even smaller digestible bytes"
Actually, I just kinda cooked up that quote now 😂
==============
Okay, let me try to add more clarity to what's going on there.
The person behind the tutorial mentioned that numeric features are infinite because to a reasonably extent they really are.
Age and Fare aren't discrete variables but continuous variables because the values they can take are infinite. Unlike, say, a discrete variable like Gender that can take 3 values.
Because Gender is a categorical variable, it's more 'meaningful' here to call .unique() method on the variable. to get male, female, non-binary as the 3 unique values.
If you attempt to do that on a continous variable like, say Fare you'll get a non-overlapping value of all the amount of fares in that column. This can output too much values, hence the reason the instructor also mentioned that it's not really important to call the unique() method on numeric features.
Remember Probability Mass Function (PMF) vs. Probability Density Function (PDF) in Statistics yeah? We can literally borrow that idea to understand this scenario.
In the next pics, the instructor defined a custom function (an input function) inside a function.
The instructor added comments in each line of the code so I believe if you take your time to study it well (and perhaps break down the code to smaller bytes when necessary) you'll fully grasp what's going on there.
======
For next time.... Please kindly consider sharing an enlarged version of the screenshots or better still, paste the code directly here. That way it will be more legible and easier for people to see without having to squint their eyes (I'm on mobile at the moment)
 mighty relic
Hi all, I am a forecaster by profession. I have been using this code at work. We have been starting to put it into production. I wanted to open it up and share it with others.
GitHub
🥄✨Time-series Benchmark methods that are Simple and Probabilistic - GitHub - alexhallam/tablespoon: 🥄✨Time-series Benchmark methods that are Simple and Probabilistic
Contributions are welcome. I want to continue to make this package robust.
stone marlin
This looks pretty cool! I have a few comments:
- You might want to include the output of the "print" methods --- I like to see what's coming out of a package before I install it myself to run the code.
- What is this package giving me that, say, the statsmodel / scipy packages are lacking? Or, as you note at the bottom, that prophet doesn't have?
mighty relic
stone marlin
This looks pretty cool! I have a few comments:
- You might want to include the...
Thanks for that!
- I will add some output to the page README. I agree that would be nice.
tablespoonprovides naive distributional forecasts to quantifying uncertainty. scipy, prophet, etc. do not provide this. I mention in the readme how important these methods are in industry. Happy to pontificate further 😉
stone marlin
Huh, I could'a sworn they did, I'm maybe remembering wrong --- or, I might be thinking of the R package.
mighty relic
Yes, it is more in the R packages like fable.
stone marlin
I agree, there is a definite need for [s]naive methods in ts prediction.
Yess, okay, that's what I'm thinking of, got'cha.
Interesting. I wonder if there would be a benefit in adding these methods to statsmodels [if you ever want to stop maintaining your own repo].
Either way, I'll try it out and see if I have anything to add! It'd be nice to not just call [S]ARIMA on this stuff over and over, haha.
mighty relic
stone marlin
Interesting. I wonder if there would be a benefit in adding these methods to st...
Same, not having to call SARIMA is nice.
That reminds me. I was frustrated once, when using AWS Forecast. They said I could call ARIMA. Then I found that they do not allow the user to parameterize ARIMA (0,0,0,)(0,1,0). They only allowed auto arima.
I wish probabilistic forecasting was embraced more all around.
Even when we use AWS forecast or sickit-garden’s quantile random forecast we only get a handful of quantiles.
We have to do things like bspline interpolation and monte carlo samples the inverse cdf. 🙁
Anyways, we have a lot of ways to convert our complex forecasting methods into distributions, tablespoon is what we use for the simple baselines.
stone marlin
I'll be honest, I don't know auto-ARIMA, and I mostly had to like, look at those AR and AR-skip charts and then grid the rest. Usually I stuck with one or two diff. That was good enough for the timeseries I had to work with! Haha.
mighty relic
I agree with you 100%
stone marlin
This is a good chance for me to expand out my knowledge of TS stuff. I've rarely used anything but basic methods for prediction so I'll check out some of this stuff. I should look at AWS Forecast, as well. I'm limited to Python and [the little bit I remember of] R. Hah.
I'll let'chu know if I have more comments on the project, I'll check it out tomorrow.
stone marlin
Please don't ping specific people, just ask the channel.
It looks like the file does not exist, according to the error message.
Then I'm not sure what the problem could be. That's what the error message says. Perhaps the path is slightly different or something. I'm a bit busy now, so someone else might be able to help out here.
desert oar
mighty relic
I wish probabilistic forecasting was embraced more all around.
Big +1 on this. So many businesses really need "statistics" and not "machine learning"
Thanks for sharing the library
mighty relic
@desert oar absolutely
 novel elbow
I wonder what is the output of !ls parent_path
 limpid cosmos
I don't think U in Users would to in uppercase until it's windows 👀 and that looks like collab
And is there some users files in linux i doubt
It's either usr or may be home....
iron basalt
desert oar
Big +1 on this. So many businesses really need "statistics" and not "machine lea...
*Machine learning is about machine learning. But what your business actually wants (usually) is statistics / forecasting, etc.
(If your goal is not to make a machine that can learn lot's of things quickly, efficiently (sample (one-shot/few-shot) and run-time), and store knowledge (this is the real holy grail of ML) in a way that it does not forget and can be used to infer things not yet observed efficiently, etc, then your business does not really want machine learning (ML is actually pretty niche relative to the demand for statistics / forecasting))
(ML is not about AI either, it's just that AI can make use of it (and can't really work without it on real world problems beyond some stuff which can be done nicely with stuff like fuzzy logic (no learning needed)))
(In the same way that AI kind of has to make use of ML, ML kind of has to make use of statistics (can't store everything perfectly))
desert oar
well-said
odd meteor
Go back to the folder where the file is in your system, copy the file path and then pass it to your Pandas' read_csv() method
bold timber
Hello everyone, I have a question about NLP. What is the type of input in fasttext? Whether the input in fasttext is each word that has been tokenized or a sentences?
desert oar
bold timber
Hello everyone, I have a question about NLP. What is the type of input in fastte...
it should be tokenized first, unless i am mis-remembering
i always used it on sequences of tokens, never on "raw" text
for example, a "word phrase" like New York should be changed to New_York first
i think internally it tokenizes the input on whitespace
bold timber
desert oar
i always used it on sequences of tokens, never on "raw" text
what's the difference between both? why they both be works?
desert oar
bold timber
what's the difference between both? why they both be works?
the first one expects that you have already processed the text into tokens
although i think in their training data they don't remove punctuation or change capital letters to lower-case. you'd have to check though
bold timber
desert oar
the first one expects that you have already processed the text into tokens
when I've been preprocessed text, which one I can choose?
desert oar
bold timber
when I've been preprocessed text, which one I can choose?
i don't understand the question, sorry
fundamentally fasttext works on "word vectors"
it does not analyze the entire document at once. it breaks the document down into words, determines a vector representation of each word, and then combines those vectors into a vector for the whole document
but again my memory might be faulty; i used it for work a couple years ago but haven't needed it since
so if you put un-processed text into fasttext, it might produce strange or not-useful "words"
bold timber
desert oar
i don't understand the question, sorry
When I've been preprocessed the text, which one of the data that put in fasttext?
 desert oar
oops i just checked the paper. in n-grams mode it does use whitespace as a character
that's how it locally approximates capturing local word order, makes sense
bold timber
I try to put both data text in fasttext like this and both keep works
 desert oar
bold timber
When I've been preprocessed the text, which one of the data that put in fasttext...
desert oar
bold timber
When I've been preprocessed the text, which one of the data that put in fasttext...
does the fasttext documentation provide any insight?
i never used the python interface
only the command line program

GitHub
Library for fast text representation and classification. - fastText/python at main · facebookresearch/fastText
bold timber
desert oar
does the fasttext documentation provide any insight?
I don't find it
bold timber
desert oar
https://github.com/facebookresearch/fastText/tree/main/python#important-preproce...
that is a model language?
desert oar
fastText will tokenize (split text into pieces) based on the following ASCII characters (bytes).
it seems like you should provide a single string
not a list of tokens
that sentence suggests that it tokenizes internally
bold timber
desert oar
> fastText will tokenize (split text into pieces) based on the following ASCII c...
that means the text should be tokenized?
desert oar
there are some example python scripts. here is one of them: https://github.com/facebookresearch/fastText/blob/main/python/doc/examples/train_supervised.py
GitHub
Library for fast text representation and classification. - fastText/train_supervised.py at main · facebookresearch/fastText
bold timber
but why both can works in fasttext? I mean, why the data that tokenized and a sentences can be works in fasttext?
desert oar
bold timber
but why both can works in fasttext? I mean, why the data that tokenized and a se...
you should be careful. "tokenizing" text just means separating it into words. it does not mean that you have to split the string
the fasttext python program appears to expect 1 string per document
do not split the string into tokens
however you should pre-process your data so that tokens are cleanly separated by whitespace
does that make sense?
 fierce quartz
I disagree, I spent a lot of time on this and I think tokenizing is the way to go. It's not clear to me why tokenizing first wouldn't work.
desert oar
fierce quartz
I disagree, I spent a lot of time on this and I think tokenizing is the way to g...
because fasttext says it tokenizes internally 🤷
bold timber
desert oar
you should be careful. "tokenizing" text just means separating it into words. it...
Oh yeah. whether it means the text should be separating or not if I want to process in fasttext?
desert oar
that said, these examples just show training from a file
@fierce quartz if you use the fasttext python api, i trust your answer 🙂
fierce quartz
desert oar
because fasttext says it tokenizes internally 🤷
but then why does it accept tokens?
desert oar
if it accepts tokens then i'm wrong
@bold timber cassandra is saying that you should separate them first. i was apparently wrong
i don't currently have a python environment set up with fasttext in it, so i can't test it myself
fierce quartz
oh, nevermind, turns out i was wrong and instead of tokenizing first you're supposed to separate the string into sentences. i was speaking from experience using the old version which was 0.5.6.
desert oar
interesting
looking over the source code, it seems like it just delegates the training to the C++ api
bold timber
desert oar
if it accepts tokens then i'm wrong
but I remember how the fasttext works. the basic works in fasttext is to tokenize every word to subwords. I think the text should be separate into fasttext. how do you think about that?
desert oar
which might explain why you don't need to tokenize first
bold timber
bold timber
but I remember how the fasttext works. the basic works in fasttext is to tokeniz...
such as "understand" can be un-under-underst-understand, right?
desert oar
bold timber
such as "understand" can be un-under-underst-understand, right?
yes, this is configurable
desert oar
bold timber
but I remember how the fasttext works. the basic works in fasttext is to tokeniz...
fasttext will separate the text for you. it splits the text using whitespace characters. this is explained in the README page that i linked
bold timber
bold timber
When I've been preprocessed the text, which one of the data that put in fasttext...
Whether better I put the data like a sentence (on the right) into fasttext model? @desert oar
desert oar
bold timber
Whether better I put the data like a sentence (on the right) into fasttext model...
try the one on the right first
i think that is what it expects
bold timber
desert oar
try the one on the right first
I've tried both recently, and they get the same result
bold timber
desert oar
i think that is what it expects
I mean, the fasttext get the same tokenize each word
 night gorge
limpid cosmos
night gorge
limpid cosmos
May be you can get in on kaggle
bold timber
Hi, I have a question again @desert oar why i still get a vocab like "a, i, is" even though I used stopwords = sw_eng?

 civic wind
Hi everyone,
I have a pandas Data frame but when I was collecting the data I made a mistake in the code instead of indexing from 0 to last item the index kept repeating from 0-29 everytime, and each row with same index are related to each other
so for example i have poems in the df and each single poem should be labeled as its index but they are now index until 29 and kept repeating
if that makes sense
any advice on how to do it fast?
 meager scroll
Hi everyone, does somebody know how to fit generalized gamma distribution to data?
 iron peak
civic wind
Hi everyone,
I have a pandas Data frame but when I was collecting the data I mad...
iron peak
civic wind
Hi everyone,
I have a pandas Data frame but when I was collecting the data I mad...
try using
df.index = [i for i in range(len(df))]
civic wind
thank for your reply @iron peak
but I have multiple verses labeled with the same number
I don't want to loose the relations
I mean I want to group the poems by there label
 umbral leaf
Hello guys i am new to python, can u people help me to convert month = February year =2018 day= 1 weekday=Sunday hour = 1 columns in a dataframe to timestamp 2018 -02-01 01:00:00
 umbral leaf
Can anyone help?.
odd meteor
umbral leaf
Can anyone help?.
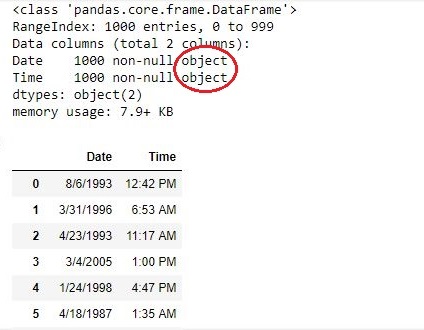
GeeksforGeeks
A Computer Science portal for geeks. It contains well written, well thought and well explained computer science and programming articles, quizzes and practice/competitive programming/company interview Questions.
 gentle lion
Yo I'm trying to predict the rotation of a chair around the Z axis. I have a big dataset of chairs with their corresponding rotation. I use linear regression for this , with as input the image and as output the sin and cos of the chair angle. I chose the sin and cos because this can be used to represent cyclic values (355 degrees is very close to zero, and after converting the angle to sin and cos, the sin and cos of 355 degrees is close to the cos and sin of 0 zegrees for example).
        model.add(Conv2D(input_shape=input_shape, filters=32, kernel_size=(3, 3), activation="relu"))
        model.add(MaxPooling2D(pool_size=(2, 2)))
        model.add(Conv2D(filters=64, kernel_size=(3, 3), activation="relu"))
        model.add(MaxPooling2D(pool_size=(2, 2)))
        model.add(Conv2D(filters=128, kernel_size=(3, 3), activation="relu"))
        model.add(MaxPooling2D(pool_size=(2, 2)))

        model.add(Flatten())
        model.add(Dropout(0.5))
model.add(Dense(units=2, activation="tanh"))```this is what my linear regression model looks like
model.compile(loss='mse', optimizer=opt) ```i use SGD with mse loss
epoch one finishes with val loss of 0.2994

the model stops after 64 epochs with val loss 0.1134

its an improvement
but the predictions are still very bad

Any ideas on how to improve this?
 nova pollen
you could artificially normalise the final layer, since (0, 1) is the same direction as (0, 0.5). that might help the model a little?
maybe one more dense layer
gentle lion
i'm not sure what you mean with (0,1) is the same direction as (0,0.5)
 earnest widget
gentle lion
i use SGD with mse loss
earnest widget
gentle lion
i use SGD with mse loss
Can you try changing the optimizer?
gentle lion
do you mean sin(0) and cos(1) represent the same direction as sin(0) and cos(0.5)? because thats not the case
gentle lion
earnest widget
Can you try changing the optimizer?
i started with adam but that one didn't seem to work properly so i switched to SGD , i'll try another one soon
earnest widget
Predictions were worse with adam?
gentle lion
the loss just never changed
it was something weird
it started at like 1.5 and just stayed the exact same after each iteration
earnest widget
Have you tried a different loss function?
Cause usually adam works quite well.
Also, maybe add a dropout layer.
For the conv layers too.
gentle lion
like after each one?
earnest widget
Second and third.
gentle lion
earnest widget
Have you tried a different loss function?
i have tried cosine similarity twice, but not with adam
earnest widget
gentle lion
```py
model.add(Conv2D(input_shape=input_shape, filters=32, kernel_size=...
You only have one dense layer?
gentle lion
jup
i think i just started with keras's MNIST dataset CNN and changed it to linear regression
earnest widget
Oh okay.
        model.add(Conv2D(input_shape=input_shape, filters=32, kernel_size=(3, 3), activation="relu"))
        model.add(Conv2D(filters=64, kernel_size=(3, 3), activation="relu"))
        model.add(MaxPooling2D(pool_size=(2, 2)))
        model.add(Dropout(0.5))
        model.add(Conv2D(filters=128, kernel_size=(3, 3), activation="relu"))
        model.add(MaxPooling2D(pool_size=(2, 2)))
        model.add(Dropout(0.5))
        model.add(Conv2D(filters=256, kernel_size=(3, 3), activation="relu"))
        model.add(MaxPooling2D(pool_size=(2, 2)))
        model.add(Dropout(0.5))

        model.add(Flatten())

        model.add(Dense(units=200, activation="relu"))
        model.add(Dropout(0.5))
        model.add(Dense(units=300, activation="relu"))
        model.add(Dropout(0.5))
Try this if you can.
nova pollen
gentle lion
i'm not sure what you mean with (0,1) is the same direction as (0,0.5)
for the (x, y) pairs, (0, 1) points in the same direction as (0, 0.5)
both of these are valid outputs by the model, but one is penalized in the y coordinate
normalising the output tuples to have magnitude 1 will fix this
also im not sure if you did this on purpose or not but taking the sine and cosine quite literally is asking the model to output an (x, y) tuple of the direction
gentle lion
nova pollen
also im not sure if you did this on purpose or not but taking the sine and cosin...
yes i used that so guessing 350 degrees where the actual rotation is 5 degrees would not result in a big loss
gentle lion
nova pollen
for the (x, y) pairs, (0, 1) points in the same direction as (0, 0.5)
so here you mean with (x,y) pair a sin of 0 and a cos of 1 right?
gentle lion
but everytime cosing is zero, sin will be -1 or 1
i dont get the part where you say it can be 0.5
i use this to visualize it sometimes

wait i might understand you
so i should make it that it cannot predict invalid combinations / transform the invalid combinations by normalising
gentle lion
nova pollen
also im not sure if you did this on purpose or not but taking the sine and cosin...
did you btw mean that this is bad in a way, or you just weren't sure if i knew what i was doing
nova pollen
nah meant like "this thing you're doing is basically this thing"
nova pollen
gentle lion
so i should make it that it cannot predict invalid combinations / transform the ...
yep
once you have the 2 outputs just scale them such that their magnitude is 1
btw i should mention
this is effectively cosine distance
gentle lion
oh so changing the loss function to that will do the same?
nova pollen
i wouldn't touch the loss function
gentle lion
nova pollen
once you have the 2 outputs just scale them such that their magnitude is 1
shouldn't it be done between the output prediction and the loss calculation? i'm not sure where you are saying that i should do it
nova pollen

Stack Overflow
I am trying to normalize a layer in my neural network using l2 normalization. I want to divide each node/element in a specific layer by its l2 norm (the square root of the sum of squared elements),...
sorry havent used keras in a bit
uhh this should be similar
essentially add a layer that normalises
make sure to get the axis right
gentle lion
alright ty i'll look into it
sterile phoenix
how am i supposed to make the dates readable

theyr readable if i change the x and y but the chart is not as understandable
 latent mantle
sterile phoenix
theyr readable if i change the x and y but the chart is not as understandable
latent mantle
sterile phoenix
theyr readable if i change the x and y but the chart is not as understandable
Try something like that to rotate xlabels
latent mantle
sterile phoenix
how am i supposed to make the dates readable
Stack Overflow
I'm trying to get a barplot to rotate it's X Labels in 45° to make them readable (as is, there's overlap).
len(genero) is 7, and len(filmes_por_genero) is 20
I'm using a MovieLens dataset and makin...
latent mantle
sterile phoenix
how am i supposed to make the dates readable
plt.figure(figsize=(12, 6)) chart = sns.barplot(x=gc.index, y=gc.genres, palette=sns.color_palette("BuGn_r", n_colors=len(genre_count))) chart.set_xticklabels(chart.get_xticklabels(), rotation=45, horizontalalignment='right') plt.show()
it says that 'DataFrame' object has no attribute 'genres
isnt that supposed to be a df?
wicked grove
hello
i was looking at a paper for finetunning
Model Platform used Image size Optimizer Mini-batch size Fine-tune Learning rate
VGG16 Anaconda 224*224 ADAM 32 32 15 1e−3````can someone pls tell me what 15 under fine tune means
gentle lion
@nova pollen i added a lambda layer in which i apply l2 normalization to the data. However, i dont know what the axis argument means and can't really find anything about it. Got a quick explanation?
 orchid ledge
Can anyone direct me to some great tutorials on numba's types and common examples? I have been struggling with the vectorize decorator signatures and accessing numpy's ndarrays.
gentle lion
gentle lion
<@314334182111182848> i added a lambda layer in which i apply l2 normalization t...
I think it should be 1 assuming 1 is the y axis
 faint cargo
thin palm
faint cargo
thin palm
any experts with unsupervised machine learning?
thin palm
If an address column has one value that's missing what we replace with that null value??
serene scaffold
thin palm
If an address column has one value that's missing what we replace with that null...
what model are you trying to train?
Ping me if you come back.
bold timber
why I no have a label after splitting?
 nova pollen
@bold timber you're printing the shape
nova pollen
gentle lion
<@314334182111182848> i added a lambda layer in which i apply l2 normalization t...
it's the axis you want to l2 normalise on
in this case it should be 1
essentially you have a tensor of shape (batch size, 2) where 2 is the coordinate tuple
we want to normalise the tuples
so axis=1
 marsh yacht

does anyone know how to fix this
im trying to convert my jupyter notebook to PDF file
bold timber
nova pollen
<@786960616664727572> you're printing the shape
this is my code but I don't know why i still no have a label


 rose pasture
Hey guys when analyzing data is it ok to remove outliers so that they don't affect the final results? For example if I am analyzing multiple ecommerce stores and trying to find their average order value, most of them have orders of 100-500$ and a few of them have orders of 500k and more. Should I remove the outliers from my analysis?
nova pollen
yes definitely
though you might want to look into where those numbers are coming from
eg, maybe most stores are reporting daily profit but those stores reported yearly profit
rose pasture
They all come from the same shop_id and the same user_id keeps buying the same amount almost every day at the same hour. Could this be either a factory making large amount of purchases or a glitch? Either way this should be removed from my analysis right?
rose pasture
nova pollen
eg, maybe most stores are reporting daily profit but those stores reported yearl...
I only have a dataset with an order on each row

something presented like that
lapis sequoia
https://mystb.in/OwnsDistributorSalad.py
I need help with detecting humans at the center of the screen using this gui
but i have no idea why the rectangle isnt drawing around the humans
thin palm
df.iloc[80]['ARV'] = 'NaN' #Set our value to null```
i'm trying to change a specific value within our column's to be "NaN" but for some reason it keeps giving me 'Commercial'? Can some one help me understand why this value will not change when I am asking it to? mild sierra
thin palm
``` df[(df.ARV) == 'COMMERCIAL'] #find location
df.iloc[80]['ARV'] = 'NaN' #Set ...
mild sierra
thin palm
``` df[(df.ARV) == 'COMMERCIAL'] #find location
df.iloc[80]['ARV'] = 'NaN' #Set ...
try
df.loc[df.ARV == "COMMERCIAL", "ARV"] = None
if youre actually trying to point at the idx/label 80 then i think
df.loc[80, "ARV"] = None
may work
depends on your df
thin palm
mild sierra
try
```py
df.loc[df.ARV == "COMMERCIAL", "ARV"] = None
```
if youre actually tr...
thank you, the first one worked
mild sierra
i reccomend looking into .iloc vs .loc more. should help you understand df access better
i use .loc a lot
stone marlin
Do any of y'all do any scheduled workflows for your models? Airflow, Prefect, etc.
I've used Airflow for a bit, but I'm interested in checking out Prefect, seein' if anyone's done anything with it.
Edit: Also, hearing about your structure for airflow/whatever jobs would be neat too. I've only started doing this since my gig last year. Works great for batch.
mild sierra
I design my own infra for this ^ but i used to use luigi
stone marlin
Nice. Any reason why luigi vs. airflow/others? Or just like it more?
mild sierra
no real reason. its what i accepted first. but then it started failing on 3.9 (or 3.8 i forget). so i just decided to do it on my own
i dont have too complicated workflows. just need custom logic wrapping my tasks and im good
stone marlin
Nice, I know little-to-nothing about Luigi, haha. Makes sense. Most of my things are basically glorified CRON jobs but I like to be able to have the UI and records and re-try efforts and not have to code all that myself.
mild sierra
if luigi is good with 3.10 ill prob try using it again
yea i hear airflow is great. i tried it for a little before sticking with luigi
thin palm
working on a machine learning model for prices of Foreclosed homes and this data I have has Date, address, and state. Is this neccesseary when feeding it into the model or can I just drop these?
stone marlin
I think airflow's pretty cool, but it def is overkill for some smaller projects, I think. But yeah, looking at this, it seems like they're pretty similar, luigi does input/output mappings and airflow does DAG stuff. so, for ez stuff pretty much the same dealio.
Pretty much all batch ETL'll look the same in either, haha.
mild sierra
thin palm
working on a machine learning model for prices of Foreclosed homes and this data...
totally depends on your requirements. id think thats decent data
stone marlin
Munj, you can either drop them if you dont think they'll be necessary (like address may not be useful for a general model, but maybe state will) but you can also encode them if you'd like to use'em.
Actually, maybe address is useful. Because zip is usually a fairly nice indicator for prop value. Hm. I dunno.
mild sierra
yea location is huge for property values
stone marlin
I was thinking like, depending on how big the dataset is, what is the appropriate level to groupby. If it's like, zillow, and it's like every house's property value, zip is fine. Even street-level.
mild sierra
and personally id never drop date
stone marlin
If it's just foreclosed homes, you might not have more than one per zip. So, maybe town. But even that might be very small.
Yeah, I always keep date, just in case, haha.
To feed into the model though, idk if date will matter so much if it's all in one year or only a few years. Anyhow, munj, tldr: it depends on what you're looking at.
thin palm
thank you both for the info, the zip is limited to one state in USA since we're looking at the specific homes. We're trying to predict the price a Bank will list foreclosed homes
and this is the columns I have:
Lender Date Address City State Zip Balance ARV EQUITY Sold
so I may have been thinking too deep into it, but I was thinking why would the date I purchase it on matter? But who knows it could be important
@stone marlin @mild sierra
mild sierra
tbh im not familiar with the domain. i actually think its super interesting but thats a good question.
thin palm
Yeah we'll see how close I can get the Sold (our Y target) accurate
mild sierra
my brain is saying date is useful
stone marlin
I'm not sure what "date" means in this case but, in general, it might be the case that if the listing was in 1980, that'd be a different sort of deal than 2020, and you might have to scale for inflation.
thin palm
yeah I think all the columns I have now are fairly useful
date means when it was bought by the bank
sorrry should've specified
stone marlin
Same dealio. If it were data from 1920 until 2020, then date is super important. If it's like, you know, 2020 to 2022, maybe not as important.
Having said that, housing prices follow a fairly weird trend, so date may be a good thing to check out, just in case.
lapis sequoia
does any one know how to use speech_rec module its not working help!
thin palm
stone marlin
Having said that, housing prices follow a fairly weird trend, so date may be a g...
Yup was starting to get on that track of thinking. Thank you very much guys 🙂
mild sierra
yea i mean last ~2 years prices have been volatile in certain areas so thats why im thinking dates are super useful. but maybe thats bias
stone marlin
No problemo, feature stuff is pret fun.
Yeah, I think my gut tells me to plot the prices by date and see if there's any general trend, but it's also hard because house prices in general ALSO vary by area significantly. Yuck.
thin palm
So then what about "Address"? How would I one hot encode this
all these addresses are unique
maybe it makes sense to drop address but keep Zip since Zip might help the model recognize zipcodes as good prices and bad prices. Good idea or???
@mild sierra @stone marlin ^
mild sierra
are you able to generate lat/lons?
 quartz silo
Hello, someone who can help me with a question about pandas
mild sierra
quartz silo
Hello, someone who can help me with a question about pandas
shoot
mild sierra
thin palm
I'l have to see if I can get that data
google has an api but im pretty sure its rate limited/billed. if youre employed and your company uses something like pcmiler that's ideal
quartz silo
@mild sierra thanks
I have a df that splits:
user_id ; country ; answer
In the user_id column several unique ids that are repeated because in the answer column it has different answers, for example
user_id ; country ; answer
1 ; UK; 10
2; AUS; 7
3; PER; 3
1; UK; prices
2; AUS; more variety,
What I want is to join in a single row the different answers that each user placed, like this:
user_id; country; answer; answer_2;answer_3; answer....
1; uk 10 ; prices; Red; etc
2; AUS; 7; more variety,; etc
3;PER;3;etc
How could I do it?
mild sierra
so almost like transposing the dataframe?
quartz silo
I would think so, the idea is to join all the users with their respective IDs and create columns for each unique data that responded and that all their data is in a single row
mild sierra
maybe look into df.pivot
if that doesn't yield what you want and your data isnt too large id just brute force it and .concat() each user_id answer
with .concat([...], axis=1) i believe
quartz silo
thanks, i will try
 hearty token
I've been using the bag of words model to train a deep learning model for QnAs what are some better ways to encode question so that the meaning of it is carried more precisely than BOW?
earnest widget
sleek tapir
is sentdex good
He’s pretty good. But if you’re beginner, check out some other channels.
sleek tapir
im not a beginner
i have or doing a stats/cs degree
ive done andrew ng
its okay
for a ultra beginner
im thinking that or
Applied Machine Learning in Python
idk
 mint vine
Python crew. I don't know where to ask for where I can find an example of training a model of some type (GPT?) to have conversations as famous historical persons.
Do you know a great online example demo that would be great as well.
lapis sequoia
I have a question regarding solving some M number of equations.
Say I have N number of variables and M number of equations.
I want to resolve them, SUCH THAT
- they ALL should have values more than or eq to 0.
- the norm should be minimum
- the sum of all of them should be 1
What have I done so far?
I have tried to resolve it using lstsq (https://docs.scipy.org/doc/scipy/reference/generated/scipy.linalg.lstsq.html#scipy-linalg-lstsq)
Issues with it: while it gives least squares, it generates minimum values in solN if required(which is expected).
Can anyone suggest me what else can I try?
Can this be resolved with LPSolver? I can add constraint that they should have positive value, tho then I'm not sure if it will try to find least squared solN.
I have asked this que in #algos-and-data-structs too since I'm not sure in which category this falls more.
 viral oak
I made an AI and it works

 warm jungle
viral oak
I made an AI and it works
warm jungle
viral oak
I made an AI and it works
Nice. (Although something that tagged everything as a cat would work well with that particular image 🙂 )
 late halo
Need a liitle bit of help.. currently I am working on a project where the challenging part is that the model should Never over predict. So it should always be predicting a little less than what it might predict. So what I tried is to modify the loss function so that whenever it over predicts the loss increases exponentially with the error. But the problem with this thing is, whenever it over predicts the gradients (plus momentum and all) shoots the parameters so far away, the ultimate result becomes much much less than optimum.
Reducing the learning rate too much doesnt improve the model at all.. increasing the learning rate slightly causes this over shooting
lapis sequoia
late halo
Reducing the learning rate too much doesnt improve the model at all.. increasing...
learning rate has different effects. Not less and more prediction, it's likely to say less accurate or more accurate prediction. why don't you reduce value of target in training?
also loss function gives loss when it's more of less than actual data, so reducing its output also implies you are playing against it when it predicts more.
late halo
lapis sequoia
learning rate has different effects. Not `less` and `more` prediction, it's like...
So how much should I reduce becomes a new challenge. I was hoping the model would figure ou t the uncertainty
lapis sequoia
late halo
So how much should I reduce becomes a new challenge. I was hoping the model woul...
depends on how less you want. why don't you ask yourself a question, say if it's predicting n, around how much do you want it to predict? it can be something like n - alpha% or something like n - alpha or something even more complex.
And then convert training target data with that function.
If you train your model less, or badly, it will not give less value, it will give you wrong value, which can be either more or less.
late halo
lapis sequoia
depends on how less you want. why don't you ask yourself a question, say if it's...
It actually changes depending on the training data
lapis sequoia
late halo
It actually changes depending on the training data
ofc it will change. see one way would be train the model with the truth you want, another way would be after model predicts, you convert them to may be less.
It's like saying that if you want more marks then me, you either don't make me learn everything(or learn badly) or you change my marks in sheet.
nova pollen
late halo
Need a liitle bit of help.. currently I am working on a project where the challe...
one option is to increase the overshoot weightage on a schedule
late halo
nova pollen
one option is to increase the overshoot weightage on a schedule
Since the losses over all the datapoints are getting accumulated, i dont really know where it is over shooting and if at all it is over shooting at all
 atomic leaf
Is it allowed to ask for help/advice here?
lapis sequoia
atomic leaf
Is it allowed to ask for help/advice here?
yes.
assuming it falls in #data-science-and-ml category
atomic leaf
Currently making a program that recognizes captcha (with pytorch), but idk how to label the captcha targets since pytorch needs tensors and the label is currently a string.
How do i go from string to a tensor that dataloader can use successfully?
lapis sequoia
When optimizing hyperparameters using validation set, is whole validation set used or just subset?
Does it make any difference if Tensorflow 2 is used for validation?
mint palm
what are some of the most top notch "image scaling, compression" architectures
nova pollen
atomic leaf
How do i go from string to a tensor that dataloader can use successfully?
the easiest solution is to do one hot encoding and pad it to a constant size, though don't expect stellar results
atomic leaf
nova pollen
the easiest solution is to do one hot encoding and pad it to a constant size, th...
Thank you ❤️
wicked grove
hello, i used k-fold cross validation to evaluate my model but i get the best accuracy only in the 5th fold
so should i now average all the accuracies or choose one fold as the model
 mild dirge
k-fold is normally meant to get the accuracy with less bias @wicked grove
It's just to check how well the model could perform, eventually you'd want to train the model on all training data
It might be that you get the best accuracy on that fold because it is the easiest test set, and not the best training set
wicked grove
mild dirge
It's just to check how well the model could perform, eventually you'd want to tr...
Assuming i dont have a test set as of now and that i get a val_accuracy and train_acc to be almost same in the last fold ,what can i do?
mild dirge
k-fold /w 5 folds means you train on 80% and test on 20% 5 times
So you do have a test set each fold
wicked grove
When i did a normal 80/20 split using sklearn's train_test_split i got an accuracy of 74 and val_acc of 72
But now the accuracy touches 81
mild dirge
but only for 1 fold?
wicked grove
mild dirge
but only for 1 fold?
2 or 3 folds
mild dirge
Shouldn't bother too much about the individual accuracies, take the averaged accuracy to get a better idea of your model performance
There also exists leave-one-out cross validation (k-fold with the same amount of folds as data points)
you wouldn't just pick the model with a correct prediction
it's just a way to check how well the model performs over all data
wicked grove
mild dirge
k-fold /w 5 folds means you train on 80% and test on 20% 5 times
Yes yes,but you told I'd have to use the entire training data eventually
So can i just use one of folds as the final or that won't be correct?
mild dirge
Why choose the model for 1 fold?
wicked grove
mild dirge
Why choose the model for 1 fold?
Because that's the one where i get the best accuracy
When the data is split that way
mild dirge
So it must be the best model?
wicked grove
mild dirge
So it must be the best model?
That was my assumption
mild dirge
mild dirge
It might be that you get the best accuracy on that fold because it is the easies...
^
wicked grove
Ah okayy
mild dirge
if you use model trained on training data of one fold, you would just throw away 20% of your data
wicked grove
Yess correct
So idk what i am supposed to do now cause i get 80% accuracy and 65% accuracy at times
wicked grove
mild dirge
if you use model trained on training data of one fold, you would just throw away...
Should i now average it out or used strafied kfold or something else
mild dirge
There's so much factors that could affect the accuracy
wicked grove
mild dirge
is the data balanced? etc
3390, yeah i do shuffle it , yupp it is balanced
mild dirge
If the data is balanced, i'm not sure why you'd suggest stratified k-fold
If you have enough data, and it's shuffled, it will likely already split them with equal class proportions in each fold
it wouldn't matter a lot
 round pollen
In machine learning, are the number of nodes fixed or can they change over time as the algorithm learns?
mild dirge
When designing a model you often try multiple network architectures, but when training the model they (often) keep the same structure/amount of nodes
Only the weights really change
 wicked grove
mild dirge
If the data is balanced, i'm not sure why you'd suggest stratified k-fold
wicked grove
mild dirge
If the data is balanced, i'm not sure why you'd suggest stratified k-fold
The data is not exactly balanced like
1 class has 1200,2nd class has 1200 and last class has 1158
round pollen
mild dirge
When designing a model you often try multiple network architectures, but when tr...
In the few places where I have seen the entire circuits changing (new "types" of nodes introducing and making connections randomly), is it machine learning or something else?
wicked grove
mild dirge
it wouldn't matter a lot
Ah okayy, how can i average these accuracies out ?
mild dirge
round pollen
In the few places where I have seen the entire circuits changing (new "types" of...
You might be referring to transfer learning, where you cut of parts of the model and put new layers on top to transfer knowledge from a really well trained model
mild dirge
wicked grove
Ah okayy, how can i average these accuracies out ?
add em up, divide by 5, it's that simple
That would be your average accuracy
round pollen
mild dirge
You might be referring to transfer learning, where you cut of parts of the model...
not that
If I send you a vid can just brush over it and tell me what category it falls into?
If you have the time, otherwise np
round pollen
round pollen
If you have the time, otherwise np
This is a report of a software project that created the conditions for evolution in an attempt to learn something about how evolution works in nature. This is for the programmer looking for ideas for interdisciplinary programming projects, or for anyone interested in how evolution and natural selection work.
GitHub: https://github.com/davidrmi...
 cerulean vapor
hi
mild dirge
round pollen
https://youtu.be/N3tRFayqVtk
genetic algorithm?
Still falls into machine learning
But this is more of a simulation, not really to find the best model or something
So not sure if it would technically be ml
think it would
round pollen
mild dirge
Still falls into machine learning
It would fall in the category of neural network though?
mild dirge
Yeah seems like it
round pollen
Ok, thanks!!
 mild dirge
You are just showing an excel sheet and shouting help
I don't know what the problem is
mild dirge
I'm not very familiair with selenium, and not sure what the problem is sorry
seems like it is not splitting on ; or something
wicked grove
mild dirge
That would be your average accuracy
Oh lol yeah thank you so much!
So i have another q,should i do the average val_accuracy or just train_acc?
mild dirge
wicked grove
Oh lol yeah thank you so much!
So i have another q,should i do the average val_...
which one represents the performance of your model best you think?
mild dirge
cerulean vapor
problem pandas not selenium
Also not super comfortable with pandas srr
the validation accuracy shows the performance on completely new data, training accuracy shows accuracy on the exact same data you trained on
wicked grove
mild dirge
which one represents the performance of your model best you think?
val_acc
wicked grove
mild dirge
the validation accuracy shows the performance on completely new data, training a...
got itt!! i get an average of 75 ,i can add a few layers and maybe improve this??
mild dirge
maybe, take a look at overfitting though

In statistics, overfitting is "the production of an analysis that corresponds too closely or exactly to a particular set of data, and may therefore fail to fit additional data or predict future observations reliably". An overfitted model is a statistical model that contains more parameters than can be justified by the data. The essence of overfi...
bold timber
nova pollen
you're still printing the shape
this is a shape in my dataset
 bold timber
nova pollen
yea
bold timber
nova pollen
yea
what do you mean? sorry i don't understand
I want to predict to the label
but I don't get a label when I splitting the data
wicked grove
wicked grove
got itt!! i get an average of 75 ,i can add a few layers and maybe improve this?...
i have another q, the validation accuracy is kinda consistent except for 1 of the splits which gives val_acc=66 ,this can be due to outliers i believe? but can i do about that
nova pollen
bold timber
but I don't get a label when I splitting the data
yea which object doesnt have a label?
wicked grove
mild dirge
https://en.wikipedia.org/wiki/Overfitting
i will check this thank you!!
bold timber
nova pollen
yea which object doesnt have a label?
the label column consist 0 and 1
 bold timber
nova pollen
yes
bold timber
nova pollen
yes
I want to predicting tweet positive and tweet negative
as a sentiment analysis
bold timber
nova pollen
.
can you explain to me what you mean? because I really don't understand
arctic wedgeBOT
:incoming_envelope: :ok_hand: applied mute to @lapis sequoia until <t:1642430546:f> (9 minutes and 59 seconds) (reason: duplicates rule: sent 4 duplicated messages in 10s).
bold timber
nova pollen
but which object do you want to have a label but dont
object of tweet column
lapis sequoia
Hello I'm stuck and I wonder if you could lend me a hand. What would be a valid way to select a row from a multi-indexed dataframe and change a column value from that particular row?
multi_indexed_df = df.set_index(['startDate', 'city']).sort_values()
multi_indexed_df.loc[(pd.to_datetime(other_df['startDate'], format='%Y-%m-%d'), other_df['city']), 'col_name'] = 1
This code doesn't throw any error but it doesn't work as I expect since it sets 'col_name' to 1 for every combination of startDate-city within other_df even if it doesn't exist.
serene scaffold
lapis sequoia
Hello I'm stuck and I wonder if you could lend me a hand. What would be a valid ...
can you do print(df.head().to_dict('list'), df.head().index) as text so I can see the data?
lapis sequoia
serene scaffold
can you do `print(df.head().to_dict('list'), df.head().index)` as text so I can ...
Yes, it's currently running the code so that it will display that, but it takes some time because it performs quite a few operations beforehand
I will paste it when it's over
serene scaffold
lapis sequoia
Yes, it's currently running the code so that it will display that, but it takes ...
I see. I guess ping me when it's ready.
I recommend doing this kind of thing in an IPython console so that you can experiment easily.
lapis sequoia
serene scaffold
I see. I guess ping me when it's ready.
I recommend doing this kind of thing in...
Yeah I will definetely follow your lead
I should start getting used to jupyter since I will be using it a lot shortly
serene scaffold
lapis sequoia
I should start getting used to jupyter since I will be using it a lot shortly
I would be careful using jupyter notebooks because they give you a false sense of reproducibility.
@lapis sequoia how much longer will it be, do you think?
lapis sequoia
I was about to paste it
serene scaffold
Yay!
lapis sequoia
{'incidences': [0,0,0,0,0], 'incidenceLevel': ['Green', 'Green', 'Green', 'Green', 'Green'], 'habitants': ['7.658', '318', '9.471', '472', '2.039'], 'province': ['Bizkaia', 'Gipuzkoa', 'Bizkaia',
'Gipuzkoa', 'Gipuzkoa'], 'PopulationDensity': ['215.26', '27.3', '587.2', '68.6', '35.97'], 'predictable_incidences': [0, 0, 0, 0, 0]}
MultiIndex([('2020-01-01', 'Abadiño'),
('2020-01-01', 'Abaltzisketa'),
('2020-01-01', 'Abanto y Ciérvana-Abanto Zierbena'),
('2020-01-01', 'Aduna'),
('2020-01-01', 'Aia')],
names=['startDate', 'cityTown'])
serene scaffold
great, one moment
so, keep in mind that your multiindex is (str, str), not (timestamp, str)
lapis sequoia
serene scaffold
so, keep in mind that your multiindex is (str, str), not (timestamp, str)
That's a hassle
serene scaffold
I would change the startDate column to a datetime before setting it as the index
anyway, you can do df.loc[('2020-01-01', 'Aia'), 'province'] = 'Catalunya'
and that would change the value in the province column for the ('2020-01-01', 'Aia') row
you have to use '2020-01-01' for the startDate key, because it's a string.
the trick is that for the row indexer, you have to put both keys in a tuple, ('2020-01-01', 'Aia')
lapis sequoia
I see that's why I doesn't work as I expect since I set a string, string instead of datetime, string multi index
serene scaffold
right, you can see if you do this
In [10]: df.index.dtypes
Out[10]:
startDate    object
cityTown     object
dtype: object
Those string could also be a dataframe column as well right?
serene scaffold
lapis sequoia
Those string could also be a dataframe column as well right?
I'm not sure what you mean
lapis sequoia
lapis sequoia
Hello I'm stuck and I wonder if you could lend me a hand. What would be a valid ...
Like so, instead of just plain strings pass in dataframe columns to multi-index key tuple
serene scaffold
lapis sequoia
Like so, instead of just plain strings pass in dataframe columns to multi-index ...
(pd.to_datetime(other_df['startDate'], format='%Y-%m-%d'), other_df['city']) these are both columns (or rather, Series), which isn't what you want.
at least, I don't think
lapis sequoia
are columns from another dataframe
serene scaffold
you pass Series if you're doing boolean indexing.
lapis sequoia
Those series contain the city and startDate values that I wanna check inside multi indexed dataframe to see if they exist so that if they exist I set 'incidences' column to 1
serene scaffold
so you want to pick rows from df where the city for that row is in other_df? you would do df.loc[df.index.get_level_values('cityTown').isin(other_df['city'])]
which is kinda ugly, but oh well 😛
I have to go but I'll probably be back later.
lapis sequoia
serene scaffold
so you want to pick rows from `df` where the city for that row is in `other_df`?...
And also it matches the startDate from the other df so it would be smth like this I believe:
df.loc[(df.index.get_level_values('startDate').isin(other_df['startDate'])) & (df.index.get_level_values('cityTown').isin(other_df['city'])), 'incidences'] = 1
Did it work?
lapis sequoia
serene scaffold
Did it work?
Performing calculations...😅
lapis sequoia
serene scaffold
Did it work?
Unfortunately it didn't work
lapis sequoia
lapis sequoia
Hello I'm stuck and I wonder if you could lend me a hand. What would be a valid ...
I got the same result with both approaches
At least now multi-index matches types
 simple geyser
Hi! i need help with figuring out how to the x axis of this distplot graph to display the axis more clearly

was hoping to get pointed towards a direction or resources that can help achieve this
 orchid kayak
I am following an article about isolating vocals from stereo using convolutional neural networks. our input is a spectogram of the stft, (shape = [513, 26]), but our output shape is only [513]. The writer mentions that our y array is the corresponding vocal spectogram for the middle frame of the mixture spectogram , not the whole.
I am confused about the nature of that. Can I write a model so that it always concentrates on the middle frame of my photo? Does the model intuitively learn how to do that? I don't understand the logic of giving the x data a full image and giving the y data a corresponding image just for a frame, and expecting the model to be able to draw conclusions from that
orchid kayak
orchid kayak
I am following an article about isolating vocals from stereo using convolutional...
In regards to what I mean

 winter mason
I'm really considering data science as a career, but I'm somewhat unsure into how the job really is. I was just wondering what I can do now at 15 to better prepare myself for this career and what is the best path (education wise) is to take
serene scaffold
winter mason
I'm really considering data science as a career, but I'm somewhat unsure into ho...
I'm not sure which degree would make it easiest to get a job, though in addition to general programming ability, you'd need to understand probability and statistics pretty well.
If you want to be a data scientist who primarily does machine learning, you would probably want to get a computer science degree and take calculus and linear algebra.
winter mason
serene scaffold
I'm not sure which degree would make it easiest to get a job, though in addition...
yeah thats a path i want to go down because i really enjoy math and I'm fairly good at it. Would I also need Calc for data science?
serene scaffold
winter mason
yeah thats a path i want to go down because i really enjoy math and I'm fairly g...
probably not as frequently as prob/stat, though I think most universities require calculus before you can take classes for the other branches of math that you'd need to know.
I had to take calc 2 (integral calculus) before I could take linear algebra or graph theory.
winter mason
oooooh so i wouldnt need it for the job but i need it to get to the math i need for the job.
serene scaffold
winter mason
oooooh so i wouldnt need it for the job but i need it to get to the math i need ...
if you're in the US, you're almost certainly not going to get a data science job without a bachelors degree
winter mason
when yeah for sure, but is an MBA also needed to advance in the data science world?
serene scaffold
like, a masters of business administration?
winter mason
serene scaffold
like, a masters of business administration?
yeah a post grad in business
serene scaffold
I wouldn't take any business classes, no.
 compact gazelle
Anyone can explain me what is clipping image for convolution image? I've googled it, I still don't understand what the idea of clipping is...
serene scaffold
most of my coworkers have scientific PhDs. A business degree isn't going to help with that.
winter mason
serene scaffold
most of my coworkers have scientific PhDs. A business degree isn't going to help...
even if you want to advance in the industry? Because I don't have plans to stay and entry level data scientist.
serene scaffold
winter mason
even if you want to advance in the industry? Because I don't have plans to stay ...
I work for a research and development non-profit. I guess I can't really speak to what the expectations are for data scientists who work for general businesses.
but my guess is that they would want you to get a graduate degree that relates to data science.
winter mason
serene scaffold
I work for a research and development non-profit. I guess I can't really speak t...
alright thank you for all your help
 median idol
Guys, which course would be better to start learning deep learning from deeplearning ai coursera course or from fast ai course?
serene scaffold
median idol
Guys, which course would be better to start learning deep learning from deeplear...
deep learning is a subset of machine learning. have you already learned machine learning fundamentals, like what models, training data, classification, precision and recall, etc. are?
median idol
serene scaffold
deep learning is a subset of machine learning. have you already learned machine ...
Yeah, i have learnt it and made projects. After I became more confident in myself decided to start learning deep learning
serene scaffold
ah. well, I haven't used either of those.
median idol
What have you used?
serene scaffold
the classes I took at university, and then the O'Reilly online library. but my company pays for that.
 static escarp
 warped turtle
I have a jupyterlab notebook that I'd like to be able to give a config file or cmdline options for inputs then have it generate an html or pdf report all from the cmdline. Is there anything that can help with this especially the parameterization or should I be using a different way about this?
merry ridge
winter mason
yeah thats a path i want to go down because i really enjoy math and I'm fairly g...
Calc is mandatory for any probability and statistics worth taking for stem. We don’t let you enroll in the Stem intro to stats course where I taught without calc I and you needed calc II before you could take intro to stats II
 crystal jewel
Hey guys
Does anyone have experience with dash?

Any idea why the double bar chart shows like that?
app.layout = html.Div(
    children=[
        html.H1('BI APP PLEZ WORK'),
        html.Br(),
        html.H3("My Visualizations"),
        html.Div(
            children=[
                dcc.Graph(
                    figure=dict(
                        data=[
                            dict(
                                x=names_of_breeds.values.tolist(),
                                y=number_of_breeds.tolist(),
                                name='Most common Breed',
                                type='bar'
                            ),
                            dict(
                                x=names_of_active_ingredients.values.tolist(),
                                y=number_of_active_ingredients.tolist(),
                                name='Most Active Ingredients',
                                type='bar'
                            )
                        ],
                        layout=dict(
                            title='Most Common Active Ingredients / Breeds'
                        )
                    ),
                    id='breed'
                )
            ]
        )
    ]
)
That's how I do it
 dawn anchor
hey guys, i need some help!! i have made a soft body material simulator, and it is heavily reliant on lists and operations to do with them, the code runs pretty slow because the calculations are huge, i was wondering if any of u have experience with running python code on GPUs specifically Nvidia, i think that running my code on my gpu would be very efficient, all the resources i have found online are super ambiguous and haven't been helpful so i thought u guys might be of some help
rose pasture
Hey guys does using groupby() in pandas automatically sort numerically or alphabetically the column it is grouped by?
 tough bolt
Hey, how do I properly assign IDs to exisiting bounding boxes in object tracking
(So I know that the bounding box in frame 1 is the same as in frame x)
Using mmdet currently. but I don't think mmdet provides bounding box IDs
serene scaffold
rose pasture
Hey guys does using groupby() in pandas automatically sort numerically or alphab...
what do you mean, sort numerically? it essentially creates one underlying DataFrame for each group, and lets you do operations on all of them that can then be aggregated.
let me experiment.
In [12]: df
Out[12]:
   0  1
0  c  1
1  c  2
2  a  3
3  b  4
4  a  5
5  b  6
6  a  7
7  d  8
8  a  9

In [13]: df.groupby(0).sum()
Out[13]:
    1
0
a  24
b  10
c   3
d   8
yes, I guess it sorts the values that are used to group.
I would have expected the order of the index to be c, a, b, d
odd meteor
simple geyser
Hi! i need help with figuring out how to the x axis of this distplot graph to di...
Have you figured it out yet? Meanwhile, I need you to add more clarity to your question
atomic leaf
Hi guys! I have a project (CAPTCHA recognition) due friday and I am lost, so if someone kind with Pytorch proficiency or alike can assist me i would be so grateful ❤️
Feel free to DM me as well
stone marlin
Isn't CAPTCHA recognition disallowed on this server?
rose pasture
serene scaffold
I would have expected the order of the index to be `c, a, b, d`
Me too I would've expected the same! Thanks for confirming it!
stone marlin
I thnk Rule 5, because it's potentially used for nefarious purposes.
But I think Stel would know more.
atomic leaf
Oof I am just doing a school project
stone marlin
I only vaguely remember that along with youtube downloading being not looked upon fondly.
atomic leaf
Thank you for reminding me tho
stone marlin
It's all good, I also am unsure, so it might be fine, who knows.
atomic leaf
Idk what to do. Do you know anyone/somewhere I can get assistance with it?
 cursive dust
sup
odd meteor
winter mason
I'm really considering data science as a career, but I'm somewhat unsure into ho...
Man you're 15 and you're already making solid plans for a future in Data Science. That's super dope 🔥🔥 🔥
When I was 15, I don't even know what I wanna do with my life. Today I'm interested in being a petrochemical engineer, the next day a computer scientist, pilot, at some point I even considered being a clergy...... At the end of the day I now found myself in Data Science field. 😀
If you can, learn python programming in depth. Then study Statistics in undergraduate course. This will get you grounded in theory and core calculations behind ML algorithms (I might be biased here but that's what worked for me) 😀
If you don't like proving equations, testing hypothesis, doing experimental design, or all those 'mathy' stuff, then consider going for computer science in undergrad. Then while doing your undergraduate studies, use those 4 years to learn data science at your own pace online.
If you fancy Msc or getting into Research, you can then go for your graduate studies in AI & Machine Learning.
I really don't have much advise to give. I'm just here to encourage you to remain steadfast in your data science journey. ✌️
stone marlin
Haha, I was waiting for Emyrs to post, just in case it was about capcha. I don't know any resources for that, yxceed, I'm sorry.
Yeah, ditto to pret much all of Emyrs stuff, re: life course. I'd recommend avoiding (or REALLY looking into) DS-specific majors in lieu of taking a standard major like Mathematics or CS or one of the other STEMs. A lot of them feel a bit gimmick-y to me, and I feel that you're in a better, more general position with one of the other majors.
Having said that, check it all out and see what'chu like. :']
odd meteor
stone marlin
Haha, I was waiting for Emyrs to post, just in case it was about capcha. I don'...
😀
odd meteor
median idol
Guys, which course would be better to start learning deep learning from deeplear...
What others may consider a 'better' introductory course to DL might be boring to you. So I'd say, Check all the 3 courses you mentioned and then settle for one. Also, don't waste time to drop any course that doesn't work for you. ✌️
atomic leaf
stone marlin
Haha, I was waiting for Emyrs to post, just in case it was about capcha. I don'...
Thanks for the response c:
stone marlin
I dig most of the Andrew Ng courses but I also feel like they're more for people who like the math parts. Some of my pals are not huge fans but the mathy ones seem more into it. Who knows.
Def doesn't feel like a "hey let's get our hands dirty in code right away" lecture style.
arctic wedgeBOT
:incoming_envelope: :ok_hand: applied mute to @brittle lava until <t:1642465338:f> (9 minutes and 59 seconds) (reason: duplicates rule: sent 4 duplicated messages in 10s).
serene scaffold
nice
winter mason
odd meteor
Man you're 15 and you're already making solid plans for a future in Data Science...
thank you mate
lapis sequoia
I have Anaconda notebooks. I install Python virtual environment, but when I import numpy it's imported normally, even I didn't install it in virtualenv
Also, I don't know if this is right, but I made requirements.txt file and I proposed on my GitHub to clone repo, make Python virtual environment and then
pip install -r requirements.txt
- is that right approach?
lapis sequoia
stone marlin
I dig most of the Andrew Ng courses but I also feel like they're more for people...
sounds like they're my style tbh
simple geyser
odd meteor
Have you figured it out yet? Meanwhile, I need you to add more clarity to your q...
how so
simple geyser
simple geyser
how so
what details would u need
simple geyser
i guess im trying to change the bins to make the data more

understandable
i was told to "please set bins as np.arange(0.5e6, 5e6, 0.1e6)" but am not sure how to do so
mint vine
I'm so exited at having found GPT-Neo just now.
Could anyone point me in the direction of a tutorial to get started creating amazing conversational bots?
lapis sequoia
 eager verge
anyone there to solve my codesignal probelm ?
eager verge
anyone there to solve my codesignal probelm ?
what have you done so far ?
eager verge
hi i have done one but test is okay for only one input
@lapis sequoia Can have a dischord call ?
so that I can share my screen ?
lapis sequoia
eager verge
<@456226577798135808> Can have a dischord call ?
not enough time
just share it here so others can look at it
lapis sequoia
use the hyve mind then 😄
lapis sequoia
I'm no genius who can solve it in 2 minutes so better to just lay it out so others can take a look