#data-science-and-ml
1 messages · Page 363 of 1
 spark apex
 austere swift
tensorrt is different than tflite
but I don't know if it works with mobile
int8 would help though
or at least fp16
spark apex
thank you so much i didn't know about this things 👍
 grave frost
I would recommend against int8 though - not all models show stability at that low precision
grave frost
fp16 should be fine - you can try fp8 if you want but that's the lowest I would recommend, especially if its going to be used in real-world applications
austere swift
a combination of int8 and fp16, where fp16 is used in locations in the model that require higher precision
grave frost
yeah, that does sound better - but I doubt there are many tools which do that out of the box, are there? I have no idea
austere swift
grave frost
yeah, that does sound better - but I doubt there are many tools which do that ou...
tensorrt does
spark apex
grave frost
fp16 should be fine - you can try fp8 if you want but that's the lowest I would ...
real world application is my main goal
i just want some way to estimate pose
grave frost
oh goody
austere swift
although upon further thought i remember that tensorrt is a nvidia package, so it likely won't work on anything without an nvidia gpu
grave frost
spark apex
real world application is my main goal
i just want some way to estimate pose
Id say just look into how much sparsification does, then go down the precision route as @austere swift described
from their claims, they were offering a 25x speedup 🤷♂️
spark apex
that would be awesome 💥
 urban lodge
I'm studying polynomial regression right now, had a doubt,
Why should the hyperparameter - lambda, be 0 in the training set?
 hazy escarp
I would like to show a neural network of a certain generation anytime on the screen using neat, anyone who could help me?
 arctic wedgeBOT
:incoming_envelope: :ok_hand: applied mute to @crimson tartan until <t:1640448784:f> (9 minutes and 59 seconds) (reason: duplicates rule: sent 4 duplicated messages in 10s).
 spring snow
Hello, I would like to make an AI bot to play a browser game such as agar.io, but I am struggling a bit to understand the approach.
I read a bit on Google about AI in games etc, but there is something I can't really seem to catch with my case, the game in itself doesn't really have a state and I would like my AI to actually make all the choices and see if it leads to victory, is this possible or should I make a list of state and let it do an action according to it ? Also since it is moving using the mouse I believe the actions are almost infinite ? So I'm a bit struggling to understand how I can do it.
Thanks in advance for any insights or resources which could help me thanks.
hazy escarp
spring snow
Hello, I would like to make an AI bot to play a browser game such as agar.io, bu...
first of all the actions are not infinite, there is just a lot of them (calculated using pi), so that answers the second question. Now for the first one, could you explain it a bit better please im not really sure i understand it correctly, please tag me when you reply
spring snow
First of all thanks for helping, for the actions you mean I can define something like 360 actions each representing 1 degree difference ?
And for my second question here is an image

After I chose a move, I can't know if that move was good or bad. So how should I do ? Check after each game if all the moves lead to victory or lose, or make an algorithm to know if a move was good depending on certain parameters ?
spring snow
hazy escarp
first of all the actions are not infinite, there is just a lot of them (calculat...
And if I understood this is the difference between reinforcement learning and deep learning right ?
hazy escarp
spring snow
And if I understood this is the difference between reinforcement learning and de...
yep
hazy escarp
spring snow
First of all thanks for helping, for the actions you mean I can define something...
depends on what exactly you are aiming for
my approach for this exact thing would be this:
- check the game and take all the stuff like my size, enemys size, my pos, enemys pos etc
- i would process the data by comparing it (basicly if im bigger or not)
- if im bigger and therefore can eat him, i would make the bot go his direction, if im not able to eat him, i would go away from him
and of do that for every one player that is in the game with me
or you could do a deep/rein learning
spring snow
Thanks for all the insights,
I would rather not do the point 3 because then it might not play very good
because for examples some times it is better to stall for instance
hazy escarp
that is true
spring snow
So if I want the AI "to think by itself" I should check deep learning ?
But then I still need to give it a reward when doing actions no ?
hazy escarp
deep q probably
hazy escarp
spring snow
But then I still need to give it a reward when doing actions no ?
yep
if you are making a deep q learning AI you have to figure out some stuff before you start
which are what are you going to reward them for, what are the inputs and outputs(those being the four control keys that i could possibly "press")
wanna send a cool vid bout deep Q using NEAT? I learned how it works using that
hazy escarp
well its actually a series
not long tho
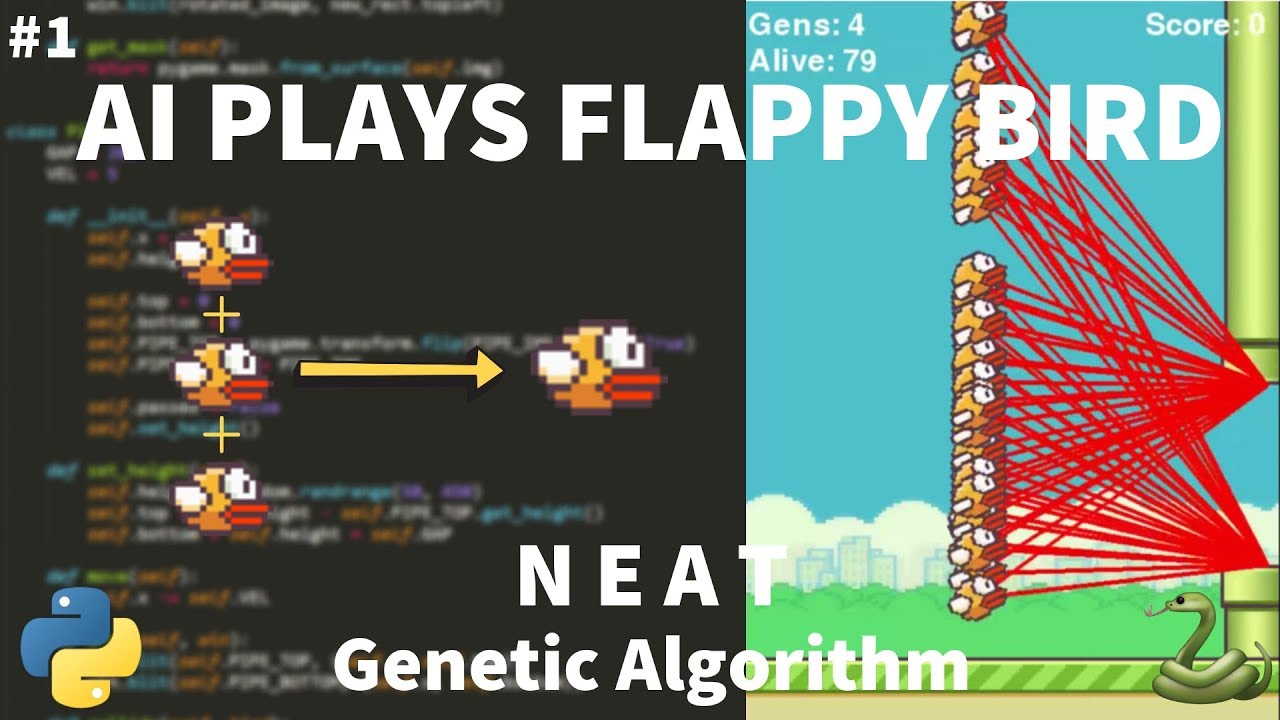
Lean how to program an AI to play the game of flappy bird using python and the module neat python. We will start by building a version of flappy bird using pygame and end by implementing the evolutionary neat algorithm to play the game.
Get a free $20 credit when you sign up at this link: https://www.linode.com/techwithtim
Thanks to Linode for...
myself i would say that is probably the best NEAT tutorial out there
spring snow
thanks a lot
 mint crown
Hello there, I'm an Unity game dev, kinda, and while trying the ml-agents I decided to literally learn it. Where is the place to learn it for games? I just made some way with Datacamp but I want to hear your advice.
 serene scaffold
mint crown
Hello there, I'm an Unity game dev, kinda, and while trying the ml-agents I deci...
serene scaffold
mint crown
Hello there, I'm an Unity game dev, kinda, and while trying the ml-agents I deci...
I think game agents usually use reenforcement learning. Have you looked into that?
mint crown
The concept is actually the same so I know what to learn and may add image recognition in the future If I want to extend it to other games
Datacamp just doesn't feel like it's the right place so far
arctic wedgeBOT
Hey @stark talon!
It looks like you tried to attach a Python file - please use a code-pasting service such as https://paste.pythondiscord.com
 inland zephyr
hello
i try to convert several object dtypes from a dataframe, but when i reprint the dataframe, it still give a object data type instead string
stringcols = data.select_dtypes(include='object').columns.values.tolist()
data[stringcols] = data[stringcols].apply(str)
this is the code i use
the problem why i need to convert all object datatype to string is i want to convert an object into datetime like this
1985-12-15T17:00:00.000+00:00
but since it still a object, it give me a assertion error when parsing it
 odd meteor
mint crown
Hello there, I'm an Unity game dev, kinda, and while trying the ml-agents I deci...
odd meteor
mint crown
Hello there, I'm an Unity game dev, kinda, and while trying the ml-agents I deci...
Is there Reinforcement Learning course on DataCamp?
odd meteor
inland zephyr
i try to convert several object dtypes from a dataframe, but when i reprint the ...
'string' is same as 'object' datatype in Pandas
odd meteor
inland zephyr
the problem why i need to convert all object datatype to string is i want to con...
Why not convert it directly to datetime? datetime is a datatype on its own.
 tough bolt
Has anyone here worked Human Pose Estimation?
If so, what exactly is the difference between bottom up and top down. And why does Top Down work that much better ?
inland zephyr
odd meteor
Why not convert it directly to datetime? datetime is a datatype on its own.
this is the date format i found 1985-12-15T17:00:00.000+00:00
when i run this to parse it to datetime
data_no_null_gender['bod'] = pd.to_datetime(data_no_null_gender['bod'],"%Y-%m-%dT%H:%M:%S%f%z")
it gives error
arctic wedgeBOT
Hey @plush leaf!
It looks like you tried to attach file type(s) that we do not allow (.ipynb). We currently allow the following file types: .gif, .jpg, .jpeg, .mov, .mp4, .mpg, .png, .mp3, .wav, .ogg, .webm, .webp, .flac, .m4a, .csv, .json.
Feel free to ask in #community-meta if you think this is a mistake.
 trim cedar
inland zephyr
this is the date format i found ```1985-12-15T17:00:00.000+00:00```
when i run t...
trim cedar
inland zephyr
this is the date format i found ```1985-12-15T17:00:00.000+00:00```
when i run t...
Hi, the pd.to_datetime() takes the format="your date format string" utc=True for your desired format. But this 'format' parameter is for matching input string and it does not format the output. For output, utc=True will give you the format you mentioned before.
 bold timber
When I have the data like this then I want to cluster the data. Whether I should remove the same data with drop_duplicates or what?
 serene scaffold
bold timber
When I have the data like this then I want to cluster the data. Whether I should...
serene scaffold
bold timber
When I have the data like this then I want to cluster the data. Whether I should...
You're going to cluster it with, for example, sklearn.cluster.KMeans? You would have to represent each row as a vector (all elements numeric), in which case identical rows would just be another instance of the same point in vector space. I'm not sure what effect this has, if any, on the k-means algorithm.
I don't believe kmeans takes the size of the clusters its creating into account, so it probably doesn't matter.
bold timber
serene scaffold
I don't believe kmeans takes the size of the clusters its creating into account,...
I want to use KPrototype for clustering because KMeans is doesn't work for categorical data. But I am so confused when I have the same data like that it should be removed the same value or not. I think in this case I should be to remove the same value with 'drop_duplicates()'
How do you think?
 safe elk
What does each entry represent if it is relevant in some msnner like each of the duplicste mean something like a visit of person in a clinic then maybe collapse it so that its distinct then count the instances of the duplicates in a new column as new feature as times visited ... if data is dirty then clean it and delete duplucates ...i dont know the backstory so you should decide
Unless you can give us an idea as to what each row mean... what does cnt mean what is it counting maybe you might need to add the cnt data across duplicates or not
 signal mango
Hello guys I'm new to python, but I've been steadily studying and grinding for weeks now. I'm loving the experience.
I came about the question which I'm trying my hands on and it has continually been a pain to solve can someone help out....
I want to write a python code that takes a list of n integers (n>= 3) and outputs a new list of n integers where the elements of the new list at any given index are the sum of the elements in the previous two indexes of the original list.
i.) The first number is replaced by the sum of the last two elements of the original list.
ii.) The second number is replaced by the sum of the first and last elements of the original list.
iii.) The third number is replaced by the sum of the first two elements in the original list.
iv) the fourth number is replaced by the sum of the second and third numbers on the original list...etc
Example input :
[3, 4, 5, 8, 9]
Example output:
[17, 12, 7, 9, 13]
Can anyone care to help a beginner out please
I think a for loop should do the trick but I must be missing something because I'm getting the wrong output
signal mango
 prime hearth
This can go in help channel
prime hearth
This can go in help channel
Alright, thanks, I'll drop the question there.
prime hearth
You did good job in writing first, the pseudo code should follow a pattern and be simple; if it not simple then code wont be simple and be complicated and can get stuck
Np
signal mango
prime hearth
You did good job in writing first, the pseudo code should follow a pattern and b...
I'm beginning to appreciate that, simplicity is very important
 stark talon
Yeah it makes code easier to understand and nice to look at
arctic wedgeBOT
:incoming_envelope: :ok_hand: applied mute to @tiny jungle until <t:1640536276:f> (9 minutes and 59 seconds) (reason: duplicates rule: sent 4 duplicated messages in 10s).
bold timber
how to plot this data into countplot when in the x-axis is the value of the name?

 rose pasture
Hi guys is a new macbook air enough for studying data science and doing a few projects?
serene scaffold
rose pasture
Hi guys is a new macbook air enough for studying data science and doing a few pr...
From what I understand, MacBook airs don't have very much memory, though you can use Google colab as needed.
rose pasture
serene scaffold
From what I understand, MacBook airs don't have very much memory, though you can...
What else would you recommend? And sorry i don’t understand what you mean by a Google colab
serene scaffold
rose pasture
What else would you recommend? And sorry i don’t understand what you mean by a G...
Google colab is an online environment for data science programming that's hosted by Google.
Data science programs can often require a lot of memory or require a GPU to be reasonably fast.
What computer you get is up to personal taste and your budget. If you don't need a computer that's especially small and your budget allows it, I would get a more powerful one than a MacBook air.
 earnest siren
anyone knows why it is syntax error?

 lapis sequoia
earnest siren
anyone knows why it is syntax error?
lapis sequoia
earnest siren
anyone knows why it is syntax error?
you mispelled np.asarray wrong its np.array
lapis sequoia
earnest siren
its basically np.array but has additional features
oh
 vague moon
I'm working on object detection with Tenserflow and am trying to install python 3.6 because of some dependency issues I am having, as well as for a seperate tutorial. I've spent all day on this. I'm trying to use conda install to install the python version. The first time I tried this installing python 3.8 and it worked just fine, but now when I try to install 3.6 I get Solving environment: failed with initial frozen solve. Retrying with flexible solve. Solving environment: failed with repodata from current_repodata.json, will retry with next repodata source. Collecting package metadata (repodata.json): done Solving environment: failed with initial frozen solve. Retrying with flexible solve. Solving environment: \ Found conflicts! Looking for incompatible packages. I have tried uninstalling and reinstalling anaconda as well, several times.
serene scaffold
vague moon
I'm working on object detection with Tenserflow and am trying to install python ...
Python 3.6 is nearly deprecated. Why are you trying to use it?
vague moon
a tutorial mainly
serene scaffold
Is there not a more recent tutorial?
vague moon
yes
but I'm not doing those ones at the moment, Im just wanting to install python 3.6 for a long udemy tutorial I got a while ago so I run into minimal trouble
rose pasture
serene scaffold
Google colab is an online environment for data science programming that's hosted...
Thank you
 cedar brook
earnest siren
anyone knows why it is syntax error?
cedar brook
earnest siren
anyone knows why it is syntax error?
You can't add two items at a time in comprehension.
austere swift
earnest siren
anyone knows why it is syntax error?
if you're trying to add the two items as a tuple you should put parenthesis around them, but you can't put multiple items in at a time in a comprehension
austere swift
vague moon
I'm working on object detection with Tenserflow and am trying to install python ...
in conda if you want to use a different python version you need to make a new environment
while you theoretically should be able to just do conda install python=3.6, the solver always has issues with it in my experience
so its better to just make a new environment
vague moon
Thanks a ton, seems to work.
lapis sequoia
Hello two weeks ago I ask for advice related to a proper algorithm that solves a referee asignment to matches use case. You told me to use linear optimization programming to do that and now that I have the dataset with the different features I'm struggling a lot to create an objective function to minimize and set up constrains and boundaries that I have to pass in to the algorithm in order to work. I know the constrains and objective but I don't know how to create a function that numerically represents those constrains and objective
I feel like I need to extract the decision variables before diving into the creation of the objective function
 still mountain
Hi, where are these 'cached' modules located for miniconda?

I need to reset them, as a rogue module has installed many versions of another module
still mountain
Incase it helps anyone, the rogue module is trdg
and the caches are shared with other installations, in the local appdata folder (windows)
 desert oar
@still mountain note that this is the pip cache, it has nothing to do with conda
 swift yoke
Anyone can help me with Tesseract?
@desert oar Any experience with Tesseract and openCV?
desert oar
none
swift yoke
I'm absolute beginner. And I don't know how to pass in On screen instead of images to process
In Tesseract or Opencv.
And I don't know how to use Loops , Define Functions , E.t.c 😩 😩 😩 😩 😩
lapis sequoia
!resource
arctic wedgeBOT
Resources
The Resources page on our website contains a list of hand-selected learning resources that we regularly recommend to both beginners and experts.
 torn hull
hey anyone up?
I need some idea of ml project that is suitable for mechanical engineering
I mean related to mechanical engineering
odd meteor
torn hull
I mean related to mechanical engineering
Start by gathering a Mechanical Engineering related dataset. Then the type of data you have would determine the kind of project you can work on
 stone marlin
Here's some that are on the kaggle website: https://www.kaggle.com/search?q=mechanical+engineering+in%3Adatasets
 hoary wigeon
Does anyone have any tutorial regarding how to build an OCR from scratch in deep learning ?
 teal mortar
why we need to multiply 2/m and not 1/m to calculate partial derivatives of the cost function?

 tidal bough
teal mortar
why we need to multiply 2/m and not 1/m to calculate partial derivatives of the ...
tidal bough
teal mortar
why we need to multiply 2/m and not 1/m to calculate partial derivatives of the ...
The 2 arises when you differentiate the square.
Since the derivative of (...)^2 is 2(...) * d(...)/dx
teal mortar
tidal bough
Since the derivative of `(...)^2` is `2(...) * d(...)/dx`
thanks, forgot about that!
 pastel valley
what methods to use in comparing 2 cnn models? like comparing which one is the best ?
 cloud fiber
any pytorchvision users ?
 upbeat prism
Hello,
I use pyTorch and I want to train on the GPU. I usually got around 60% usage but now I only have about 35%. I refactored the code and I didn't really take into account any bottlenecks so far. First goal was to get it working.
Now there are two bottlenecks I guess could be the issue here:
- FileIO
- CPU <=> GPU communication
My input file is 16GB. Reading from it isn't buffered (at least not by me, I guess the HF file driver might buffer a bit here, not sure). I didn't think a lot about point 2. when writing the code.
Now pyTorch let's you define a dataset and a dataloader class and there you have to define a function getitme(index). You can provide a stride to the dataloader, so if you would do next(iter(mydataloader)) you'd get "stride" amount of items.
What I currently do is:
    def __getitem__(self, i):
        sample = self.samples[i]
        label = self.labels[i]

        if label == 1:
            label = [1.0, 0.0] # noise + signal
        else:
            label = [0.0, 1.0] # pure noise

        label = torch.tensor(label, device=self.device)
        sample = torch.tensor(sample, device=self.device)

        return sample.unsqueeze(0), label.unsqueeze(0)
Note that HDF overloads the [] operator, so self.samples[i] as well as self.labels[i] is actually file IO. (at least, that's the worst case. I assumed that the file driver creates a buffer here but that's just a guess.) Let's assume there is no buffer. So each call to getitem() equals 2 fileIOs.
I then tranform the labels.
I then put it into a tensor and send it to the GPU.
I then return that.
Any idea how I can improve that? What I currently try to do is:
Allocate ~3gb of memory. On each call to getitem() check if there's something in the buffer, if so, take it. If not, fill buffer again. Thus reducing FileIO.
But I'd still be stuck with the CPU/GPU communication. How could I reduce that? Can I somehow just send the whole 3gb at once to the GPU?
 meager ridge
pastel valley
what methods to use in comparing 2 cnn models? like comparing which one is the b...
meager ridge
pastel valley
what methods to use in comparing 2 cnn models? like comparing which one is the b...
it depend what you want compare. the easiest way is to compare the error rates of the whole models, but if you want compare on what features the models classify you can use saliency maps.
 worn stratus
Hello - I realise I'm asking somewhat in vain, but does anyone have an example of a large Dash app architected somewhat well? I'm forced to use Dash for something that should really just be a traditional web app, and it's getting very messy - and I see no real clear path to organising things neatly
serene scaffold
worn stratus
Hello - I realise I'm asking somewhat in vain, but does anyone have an example o...
What is Dash?
worn stratus
Dash is a "low-code" python framework mostly used by data scientists to give people quick and dirty access to graphs
made by plotly
web framework I should have said*
 lucid hornet
I take it work is forcing you to use Dash?
lucid hornet
Sounds like it. (also good to see you again)
I'll start poking around
worn stratus
yeah - good to see you again as well
lucid hornet
https://realpython.com/python-dash/
https://avocado-analytics.herokuapp.com/
There are those.... still trying to find a real example of where they're used
worn stratus
my problem is that I'm using it for a fairly atypical usecase. I'm using it for what's pretty much just a standard web app with multiple pages and whatnot, so I can't figure out a way to sensibly split my application up into multiple files - yet alone into multiple cohesive modules. I've just hundreds of lines of callbacks and layout mixed together horribly
lucid hornet
https://awesomeopensource.com/projects/plotly-dash/python3 Ooo, found this as well.
worn stratus
ah - that looks useful
lucid hornet
And if that's the case, you could look at Flask projects as an example as well
If the structure is the main bit that's got you stuck
serene scaffold
This should probably continue in #web-development, if I'm understanding correctly.
lucid hornet
Fair
worn stratus
probably - I asked here mostly because Dash is a tool primarily used for Data Science, but this usecase is mostly web devvy
Although - I think I've found what I wanted from Hemlock's last link, so there's not really all that much to continue with
arctic wedgeBOT
:incoming_envelope: :ok_hand: applied mute to @balmy bane until <t:1640620469:f> (9 minutes and 59 seconds) (reason: duplicates rule: sent 4 duplicated messages in 10s).
upbeat prism
lol, I'm such an idiot. Me here benchmarking the shit out of my implementation until I remember, that I set the batch size to something stupidly low like 3 when I was debugging something before christmas. :p
 limber hemlock
hello! is there people working with Google colab? the computing power is higher than any 'normal' computer at home?
 zenith nova
I have previously used it because it provided access to unique proprietary nvidia API's that I did not have access to otherwise
 calm thicket
it depends how much you pay
 ember canyon
how can i use the face_recognition library to compare faces with a bathc of images (for example compare one face/image with 30 other faces/images)
limber hemlock
calm thicket
it depends how much you pay
arf
too bad
cause it says 1gb ram so not so much
 bronze skiff
upbeat prism
lol, I'm such an idiot. Me here benchmarking the shit out of my implementation u...
bronze skiff
upbeat prism
lol, I'm such an idiot. Me here benchmarking the shit out of my implementation u...
that'll do it
are you also loading to pin memory directly?
that tends to lower the cpu memory -> gpu mem transfer
pastel valley
meager ridge
it depend what you want compare. the easiest way is to compare the error rates o...
i want to see which model is most reliable or accurate
i will create 2 identical model and train them using 2 dataset one applied with geometric transformations, and the other one applied color manipulation on data augmentation part
what do you recommend i can use to assess which one is the best?
 hollow berry
Hey
I'm new to data science
I'm looking for AI-Synthesized Sound.
can someone point in correct recourses.
*resources
bold timber
how to determine an epsilon value in DBSCAN?
safe elk
hollow berry
Hey
I'm new to data science
I'm looking for AI-Synthesized Sound.
can someone p...
Like a Text to speech engine? Or music generator? What subset of sounds
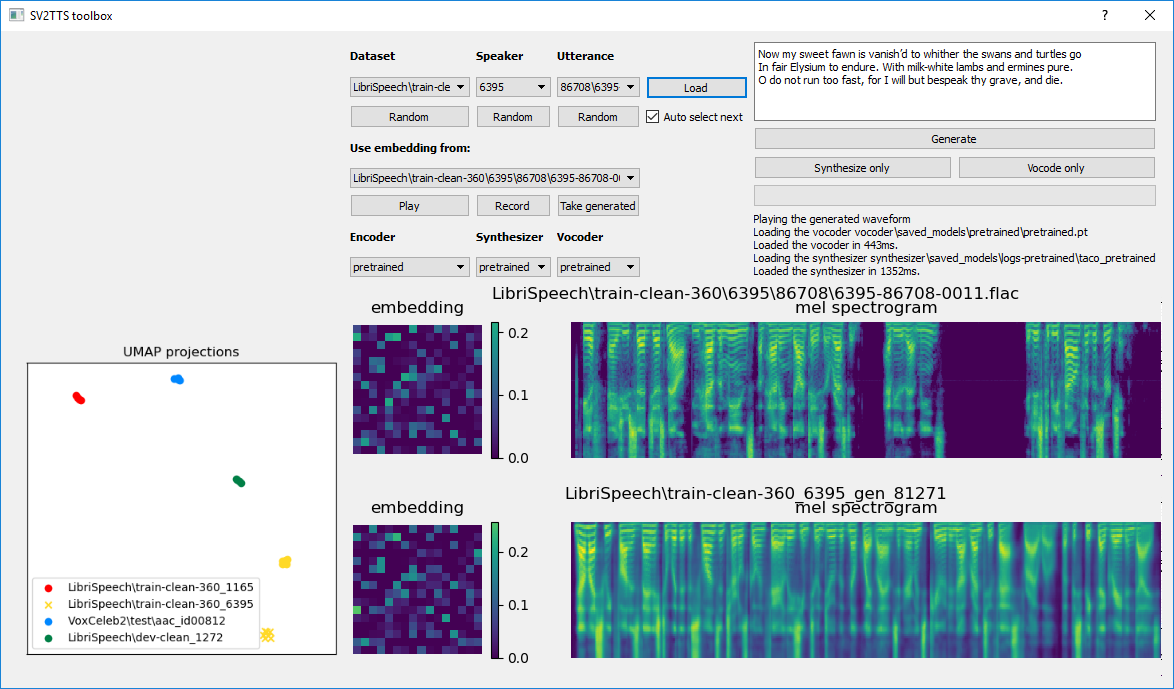
GitHub
Clone a voice in 5 seconds to generate arbitrary speech in real-time - GitHub - CorentinJ/Real-Time-Voice-Cloning: Clone a voice in 5 seconds to generate arbitrary speech in real-time
Lol clone a voice from some recording of someone else probably bad = deep fake as they call it in media
odd meteor
bold timber
how to determine an epsilon value in DBSCAN?
To the best of my knowledge, there's categorically no rule of thumb out there that states how to determine the epsilon value.
It's a hyperparameter so, just try out different values of epsilon and see which works best for your clustering.
hollow berry
safe elk
Like a Text to speech engine? Or music generator? What subset of sounds
Natural sound. Like rain fall, water fall, etc
safe elk
hollow berry
Natural sound. Like rain fall, water fall, etc
Most projects in this space are abour voice synthesis... few music synthesis... as for synthesizing some arbitary natural sound there must be a reason to go through that effort otherwise a sound recording will suffice
So if i was a teaxher i will ask why and what are the applications of that proje ct
hollow berry
I want to make new sound with the help of existing sounds with the help of AI to post on YouTube and other places.
 spice mountain
I am trying to understand the training in Double DQN.
Is this a correct diagram over this training?
Verbal explanation:
We use the online network to calculate the best greedy policy/action.
We then select this action's Q-value from the target network.
The loss function is some distance function between the maximum Q-estimate from our online network and the selected action from the target network's Q-estimate times gamma plus the reward.

Please tag me with an answer
stone marlin
This one's a long-shot, but anyone done any Topological Data Analysis? No specific questions, just curious. It's cool, but also feels not super approachable since most things assume you already know algebraic topology.
 rough mountain
So I want to make a GAN to generate spaceships for a video game. In the video game these spaceships are built of tiles.
I ideally would want to one hot encode it, but I would need a 50 long one hot encoding for each pixel in the image....
Any ideas?
 arctic crown
I am making a personal assistant named Jarvis and I was wondering if it was possible to add emotions to it using ml
serene scaffold
arctic crown
I am making a personal assistant named Jarvis and I was wondering if it was poss...
emotions, in what sense? Is this a voice assistant?
If so, there's two sides to the problem: determining what emotion to use, and synthesizing the voice in such a way that reflects that emotion.
rough mountain
arctic crown
I am making a personal assistant named Jarvis and I was wondering if it was poss...
That would be extremely difficult.
as while you can say what emotion a human is feeling with ML, you can't extract the emotion for a training set.
serene scaffold
rough mountain
as while you can say what emotion a human is feeling with ML, you can't extract ...
there are datasets of emotive speech.
rough mountain
serene scaffold
there are datasets of emotive speech.
Yes for emotion recognition, but it would be hard to get the AI to copy the tone of their voice without copying the words.
it would almost be easier to hard code
arctic crown
serene scaffold
emotions, in what sense? Is this a voice assistant?
Yea
serene scaffold
rough mountain
Yes for emotion recognition, but it would be hard to get the AI to copy the tone...
how are you so sure?
rough mountain
serene scaffold
how are you so sure?
I would love to be proved wrong, but I see no way you could.
arctic crown
Oh also I wanted to know how can I train my own tts voice like which ml algo should I use
serene scaffold
rough mountain
I would love to be proved wrong, but I see no way you could.
I've read papers about creating synthetic voices for emotive speech. It's an area under active development.
rough mountain
serene scaffold
I've read papers about creating synthetic voices for emotive speech. It's an are...
so I was right, I said it would be very hard 😛
not impossible
serene scaffold

rough mountain
rough mountain
So I want to make a GAN to generate spaceships for a video game. In the video ga...
BTW, you have any ideas how to approach this?
serene scaffold
I think you can use this? https://github.com/Rayhane-mamah/Tacotron-2

GitHub
DeepMind's Tacotron-2 Tensorflow implementation. Contribute to Rayhane-mamah/Tacotron-2 development by creating an account on GitHub.
still mountain
desert oar
<@!843269747565920267> note that this is the _pip_ cache, it has nothing to do w...
I thought a feature of conda was to be seperate from other 'environments', which included modules, versions and the cache. Thank you for teaching me something new 🙂 (In my head it still makes sense in the future if they make a 'pip cache' for conda)
stone marlin
I asked my ex-coworker (who does something similar, but not exactly the same as emotional ai things --- it's for a Chinese company, and it's more of a "formality" type thing) and he pret much said, "There's a lot of new stuff, not a lot is vetted and a lot is very specific." But he noted, "Start with MFCC to start learning this stuff." So I'm passing on that knowledge, I guess, here. Seems like an okay starting place for general speech recognition / production. http://www.practicalcryptography.com/miscellaneous/machine-learning/guide-mel-frequency-cepstral-coefficients-mfccs/
I don't think this solves the emotional AI problem, but it's kind of neat if y'all haven't heard of it. (I didn't, and I think it's kind'a neat, at least.)
 quasi rock
Hi guys
is anyone familiar with the lablab library for python? I think it's called matpoltlib
I need help with an issue
arctic wedgeBOT
:incoming_envelope: :ok_hand: applied mute to @shut echo until <t:1640643512:f> (9 minutes and 59 seconds) (reason: duplicates rule: sent 4 duplicated messages in 10s).
arctic crown
I wanted to know how can I train my own tts voice like which ml algo should I use
arctic wedgeBOT
Hey @plush leaf!
It looks like you tried to attach file type(s) that we do not allow (.ipynb). We currently allow the following file types: .gif, .jpg, .jpeg, .mov, .mp4, .mpg, .png, .mp3, .wav, .ogg, .webm, .webp, .flac, .m4a, .csv, .json.
Feel free to ask in #community-meta if you think this is a mistake.
desert oar
still mountain
I thought a feature of conda was to be seperate from other 'environments', which...
That is correct about conda! However pip itself just uses the same cache directory regardless of where or how it's installed. that's because items in the cache should be uniquely identified by their names so they should never conflict with each other
serene scaffold
arctic crown
I wanted to know how can I train my own tts voice like which ml algo should I us...
I already suggested that you use tacotron. there's also fastspeech. https://github.com/ming024/FastSpeech2

GitHub
An implementation of Microsoft's "FastSpeech 2: Fast and High-Quality End-to-End Text to Speech" - GitHub - ming024/FastSpeech2: An implementation of Microsoft's &...
bronze skiff
stone marlin
This one's a long-shot, but anyone done any Topological Data Analysis? No speci...
what about it
stone marlin
No specific questions, just curious. I haven't really heard anyone usin' it recently besides the Stanford lab, and I was gonna dip my toes into it again.
meager ridge
pastel valley
i want to see which model is most reliable or accurate
i will create 2 identica...
In this case, only the error rate would actually make sense, but you are not comparing different models here, but different data sets. so basically only different variants of the preprocessing of a data set.
bronze skiff
stone marlin
No specific questions, just curious. I haven't really heard anyone usin' it rec...
UMAP is a very commonly used unsupervised technique that is heavily inspired by topological ideas
stone marlin
I've gott'a read the paper for that, I haven't heard about it. When I got out of grad school people were still doing Persistent Homology, so that's pret much all I know about the field anymore.
upbeat prism
bronze skiff
are you also loading to pin memory directly?
No, not yet.
cloud fiber
Anyone use resnet50+fpn?
 plucky sparrow
I'm building a cv2 project that reads OR code.
I'm getting an error. Can you guys look into it?
cv2.line(image, tuple(points[i][0]), tuple(points[nextPointIndex][0]), (255, 0, 0), 5)
cv2.error: OpenCV(4.5.4) :-1: error: (-5:Bad argument) in function 'line'
> Overload resolution failed:
> - Can't parse 'pt1'. Sequence item with index 0 has a wrong type
> - Can't parse 'pt1'. Sequence item with index 0 has a wrong type``` austere swift
plucky sparrow
I'm building a cv2 project that reads OR code.
I'm getting an error. Can you guy...
austere swift
plucky sparrow
I'm building a cv2 project that reads OR code.
I'm getting an error. Can you guy...
what is contained in points?
 lone drum
My code this way

I am trying to get specific date data from dataframe but I am getting empty dataframe

Ping me when replying
odd meteor
You'd have to train your model to be able to do that while leveraging Transfer Learning.
Explore how to use spaCy to detect similarities in semantics. Additionally, explore this as well https://www.sbert.net/docs/pretrained_models.html
 frank quiver
can reinforcement learning be used to understand the eating habits and tell whether he will have an allergy or not?
quasi rock
import matplotlib.pyplot as plt
import time
import os

bssid_list = []
sig_str_list = []
for i in range(0,5):


    stream = os.popen("netsh wlan show interfaces")
    output = stream.read()
    for item in output.split("\n"):
        if "BSSID" in item:
            # print (item.strip())
            c_bssid = (item.split(": ",1)[1])
        if "Signal" in item:
            # print (item.strip())

            c_signal_str = item.split(": ",1)[1]
            c_signal_str = int(c_signal_str.rstrip("% "))
    bssid_list.append(c_bssid)
    sig_str_list.append(c_signal_str)
    print(bssid_list)
    print(sig_str_list)


    time.sleep(1)

plt.plot(bssid_list,sig_str_list,"ro")
plt.ylim([0,100])
plt.show()
Hi everyone. I've reached a bit of a roadblock with my python code. I'm trying to make a program that gets the BSSID of the access point i'm connected to as well as its signal strength, and plot this data on a graph using MATLAB's matplotlib library. However, I've realised in order for this graph to make any sense I also need to plot it against the time elapsed in seconds. How am I supposed to plot 3 sets of data on a 2 dimensional graph?

The x axis is the BSSID
The y axis is the RSSI
I need to plot the time on the x axis, and then group the time based on the current BSSID. The BSSID will change as i move around
Please could someone help me? Tag me here if you need me to clarify anything
 iron basalt
quasi rock
Hi everyone. I've reached a bit of a roadblock with my python code. I'm trying t...
iron basalt
quasi rock
Hi everyone. I've reached a bit of a roadblock with my python code. I'm trying t...
Why not use a 3D plot?
tidal bough
It's technically another library: https://matplotlib.org/stable/tutorials/toolkits/mplot3d.html
That said, another choice would be to represent, say, the signal strength not with position, but something else.
For example, by size/color of the points.
Then 2d would be enough - time horizontally and BSSID vertically, say.
bold timber
I was so confused about the difference between the Silhouette score and elbow method analysis. If they give a different result of the number of clusters, which one should I choose?
 gray tartan
hi, if someone has experience with jupyter notebooks :
I'm trying to execute javascript in it and get the result in python, but smh i can't access IPython from the javascript side
i'm using jupyterlite
 fast drum

Click Here for more : http://tiny.cc/th7auz
#Python #DetectingDDoSAttack #DDoS #KNN #SVM #RandomForest #GassainNaiveBayes
This is an existing solution for detecting DDoS attacks.
Distributed denial of service (DDoS) attacks is a subclass of denial of service (DoS) attacks. A DDoS attack involves multiple connected online devices, collectively k...
 warm copper
when i train a simple model in keras, the cpu and gpu is at full utilization at the start but after it complete half of total epochs, it drops to 10-20% on both cpu and gpu but the model is still running. why does this happen? shouldn't the usage be at high until the end?
quasi rock
tidal bough
It's technically another library: https://matplotlib.org/stable/tutorials/toolki...
Thank you, I'll look into the 3D graph
upbeat prism
Okay, so I made a few basic changes and now reach 77% load on my gpu. The nice thing is, that the load isn't as batch_size dependend as before. 🙂 Before I had huge batch sizes, like 1024, now I can get the 77% with 64.
And here's why I think that's nice: Apprently a smaller batch size = more accuracy. But why is this? I always viewed batching as a purely programming thing but if it actually influences accuracy, there must be some math behind it.
quasi rock
tidal bough
That said, another choice would be to represent, say, the signal strength not wi...
Would you know how I could achieve this, like have signal strength as a colour spectrum?
upbeat prism
warm copper
when i train a simple model in keras, the cpu and gpu is at full utilization at ...
Does the loss change once it reaches the epoch from which it only is 10-20% load?
warm copper
upbeat prism
Does the loss change once it reaches the epoch from which it only is 10-20% load...
I googled a bit and came to the conclusion that it was vscode not printing the epoch progress fast enough, when i run on native jupyter notebook, everything works fine and i can see the gpu/cpu being utilized until model finishes
upbeat prism
@warm copper ah, yeah I have no idea about all those things. I use top and gpustat and just run everything in my terminal. I guess you are on windows? If so, you could check CPU load using the task manager and the gpustat tool is available for python so I guess would work for windows too.
Anyway, what you could do is add a counter and only print e.g. the 30th epoch instead of each epoch.
Maybe vscode will display it correctly then.
warm copper
upbeat prism
<@!906706991072825424> ah, yeah I have no idea about all those things. I use top...
I’m on mac, while training, activity monitor shows that the gpu and cpu r in fact in use, as for the vscode issue, i’ve found it to be better to hook up colab to local runtime or just use jupyter notebook. Seems more reliable as vscode w jupyter crashes randomly.
upbeat prism
@warm copper Sure, can't comment on it since I never use notebooks. Glad it works 👍
warm copper
upbeat prism
<@!906706991072825424> Sure, can't comment on it since I never use notebooks. Gl...
Thanks, what’s ur setup like now? Are you an IDE person?
upbeat prism
warm copper
Thanks, what’s ur setup like now? Are you an IDE person?
I'm on a linux system. I use neovim (a terminal based text editor). I then run everything with the python interpreter (i.e. I open a terminal and type python myscript.py). That's basically the setup for most things I do. It needs a lot of getting used to and I also started with IDE's when I started coding but I simply like this setup better. It just fits my general system and workflows better. E.g. I use i3wm instead of a desktop environment and I also use a ton of terminal based applications.
In the end just use whatever you like. I have no idea what most python people use since I'm no python pro myself yet. 🙂 I guess most run what you run.
warm copper
upbeat prism
I'm on a linux system. I use neovim (a terminal based text editor). I then run e...
Oh that sounds interesting, i’ve seen some neovim setups in youtube and would love to try it out but i just have a few questions. How do you select multiple lines for deletion? Closest i know would be ctrl+k for line deletion
upbeat prism
warm copper
Oh that sounds interesting, i’ve seen some neovim setups in youtube and would lo...
haha handling neovim needs ton of getting used to. Since you basically don't use your mouse. Most beginner start to move with the arrows, which leads to you being very slow. One way: You can select if you press v or and then move with h,j,k,l. Then you can cut it, copy it etc. But again, it really needs a lot of work and if you don't like it it's probably too much of a hassle haha. I basically just watched some video, did some basic setup and started with a bunch of commands and I keep adding more stuff to make me more provicient in using it.
warm copper
upbeat prism
haha handling neovim needs ton of getting used to. Since you basically don't use...
I did not know about the hjklv thing! Will check out some guides later! Thanks for the info! 😁
 brave sand
cv2.error: OpenCV(4.5.4) /tmp/pip-req-build-th1mncc2/opencv/modules/dnn/src/tensorflow/tf_importer.cpp:2711: error: (-2:Unspecified error) Input layer not found: Preprocessor/mul/x in function 'connect' any idea why I'm getting this error? I'm working on an image detection in real time stream
 lament hornet
Anyone know why my y values are all clumped together like this?

import matplotlib.pyplot as plt
import matplotlib.colors as colours
import time
import os
sig_str_test = [20,40,30,10,70,80,90,35,40,20]
bssid_list_test = ["bssid1","bssid1","bssid1","bssid1","bssid2","bssid2","bssid2","bssid3","bssid3","bssid3"]
bssid_list = []
sig_str_list = []
for i in range(0,10):


    stream = os.popen("netsh wlan show interfaces")
    output = stream.read()
    for item in output.split("\n"):
        if "BSSID" in item:
            # print (item.strip())
            c_bssid = (item.split(": ",1)[1])
        if "Signal" in item:
            # print (item.strip())

            c_signal_str = item.split(": ",1)[1]
            c_signal_str = int(c_signal_str.rstrip("% "))
    bssid_list.append(c_bssid)
    sig_str_list.append(c_signal_str)
    print(bssid_list)
    print(sig_str_list)

    time.sleep(1)

norm = colours.Normalize(vmin=0,vmax=100)
cmap = "RdYlGn"
plt.scatter(range(0,10),bssid_list_test,c=sig_str_test, cmap = cmap, norm = norm)
plt.ylim([0,100])

for x,y in zip(range(0,10),bssid_list_test):
    label = str(sig_str_test[x]) + "%"
    plt.annotate(label,
                 (x,y),
                 textcoords = "offset points",
                 xytext = (0,10),
                 ha = "center")


plt.show()
because you set the ylim to 0,100 but your data is all much smaller than 100
desert oar
i think maybe you swapped the bssid list and sig list variables by accident
lament hornet
that's vestigial code from when I was measuring the signal strength on the y axis
i forgot I changed the y axis to be the BSSID name
🤦♂️
thank you based salt rock lamp
brave sand
desert oar
i think maybe you swapped the bssid list and sig list variables by accident
can you help me?
pastel valley
meager ridge
In this case, only the error rate would actually make sense, but you are not com...
yes and i want to compare the models trained with different data preprocessing and analyze why is the one better than the other or which one is the best? and you mentioned i can use error rate? how?
bronze skiff
upbeat prism
Okay, so I made a few basic changes and now reach 77% load on my gpu. The nice t...
batching isn't purely a programming concern-- in stochastic gradient descent, the larger the batch size, the smaller the variance of the gradients
conversely, small batch sizes have larger noise, which empirically is thought to improve generalization performance
the intuitiom being that the local minima that generalizes in deep neural nets tend to be the flat ones, i.e. are noise resilient
upbeat prism
bronze skiff
batching isn't purely a programming concern-- in stochastic gradient descent, th...
thanks for pointing out where the batch size comes into play. Good time to refresh some theory behind everything.
upbeat prism
bronze skiff
conversely, small batch sizes have larger noise, which empirically is thought to...
yeah that sounds very familiar. I think we discussed that in the lecture I took last year.
 quaint carbon
anyone know a good platform for deep learning and the like
 balmy ermine
Hello. I have a Computer Vision related question, for those who are interested and have the time.
The project is basically this: given an image of a vehicle and the feed of a surveillance camera, detect the presense of that vehicle in the area of the camera. So, my first thought was to use an image similarity algorithm to detect the vehicle from the feed. I have researched a bit and found algorithms like SIFT, SURF, ORB Similarity, etc.. and of course, Siamese Networks. Now my concern is that all of these algorithms require the two images to be pretty much identical in order to work correctly, right? What would happen if the camera caputered the vehicles from mulitple different angles? Will these algorithms work properly, or is there a better solution?
The other solution I thought of is to use -- say -- YOLO to train it to recognise the vehicles models and then use that to see if the two vehicles match, but I feel like this would not generalise well at all, since I would need to retrain the model and collect enough data everytime I find a car model that the algorithm has not seen before.
Also, If the solution is Siamese Neural Nets, from my understanding, SNNs require few images to learn the features, but they still require more than one image. Would augmenting that one image produce satisfactory results, or do I need multiple pictures of the same vehicle?
PS: I have already implemented a detection algorithm to extract/crop the vehicles.
TLDR; I want to detect if two vehicles in two different images are the same. Taking into consideration that these two vehichles might comes from images taken from different angles.
Examples of two images (two Volkswagen Passat 2021s) that quite represent the problem are attached below.


 atomic pecan
upbeat prism
Hello,
I use pyTorch and I want to train on the GPU. I usually got around 60% u...
atomic pecan
upbeat prism
Hello,
I use pyTorch and I want to train on the GPU. I usually got around 60% u...
heres my take on that ; readability in mind :
def __getitem__(self, index):
    return [
        torch.tensor(data, device = self.device).unsqueeze(0)
        for data in [
            self.samples[index],
            [float(self.labels[index] == 1),
             float(self.labels[index] != 1),
             ],
            ]
        ]
 honest narwhal
Hello
I have a uni project which requires me to make a time series forecast for the seasonal changes in the bacterial distribution of the human gut microbiome
I only have limited data though
Monthly records for 2 years (so 24 rows)
I've already watched a couple tutorials about time series forecasting in python however in the examples that were shown the the forecast was for a single value
In my case I need to predict the distribution in percentile values
This is the data that I have
odd meteor
bold timber
I was so confused about the difference between the Silhouette score and elbow me...
Elbow method is just one of the ways to know the number of clusters present in your dataset. KMeans can't magically know the number of clusters, so we usually implore the help of elbow plot to infer the number of clusters present in the dataset.
Apparently, Silhouette analysis can also be used to infer the number of clusters present in a dataset, however, I'm not familiar with that. I'm pretty sure it's mostly used to measure the accuracy of a clustering technique.
More so, Silhouette score and Elbow plot doesn't necessarily have to give same score.
Elbow plot is the widely used approach. However, when I'm not too pressed for time, I tend to validate result gotten from elbow plot with a dendrogram.
If you're not familiar with dendrogram, you might wanna explore agglomerative hierarchical clustering. You'll find it super interesting ; I hope so. 😀
 bold timber
odd meteor
Elbow method is just one of the ways to know the number of clusters present in y...
bold timber
odd meteor
Elbow method is just one of the ways to know the number of clusters present in y...
Yes, I know about Agglomerative Clustering. But, I am still curious about how to determine using Silhouette score or elbow analysis haha
but thank you for the answer👍
odd meteor
upbeat prism
Okay, so I made a few basic changes and now reach 77% load on my gpu. The nice t...
Batching isn't a purely programming thing. In fact, these two twins epoch and batch_size when not set properly, can make your model exude shrimp energy even if it's ordinarily destined to be a Thanos 😁
 orchid kayak
Hi, I am working with audio data (mainly doing Fourier transformers) and I've recently come across this sentence in an article
"Since our input data is real, we can work with one half of the STFT (the why is out of the scope of this post…) while keeping the DC component (not a requirement)..."
Does anybody have an idea of the reasoning behind this, and / or can link to a place which can explain?
Thanks!
lapis sequoia
why doesn't this work
if reaction.emoji == ['8️⃣', "7️⃣", "6️⃣", "5️⃣", "4️⃣", "3️⃣", "2️⃣", "1️⃣", "0️⃣"]:
nvm
                            reason = ""
                            while reason == "":
                                if reaction.emoji == "0️⃣":
                                    reason = "Other"
                                    break
                                elif reaction.emoji == "1️⃣":
                                    reason = "Too short application \ poorly explained"
                                    break
                                elif reaction.emoji == "2️⃣":
                                    reason = "Lack of hours on Unturned \ inexperienced"
                                    break
                                elif reaction.emoji == "3️⃣":
                                    reason = "Bad english \ grammar"
                                elif reaction.emoji == "4️⃣":
                                    reason = "Inactivity \ Lack of hours on ICE RP"
                                elif reaction.emoji == "5️⃣":
                                    reason = "Too many incorrect answers"
                                elif reaction.emoji == "6️⃣":
                                    reason = "Lack of developer skills"
                                elif reaction.emoji == "7️⃣":
                                    reason = "Cannot be trusted \ too many bans"
                                elif reaction.emoji == "8️⃣":
                                    reason = "Troll application"
                            embed.add_field(name="Reason for denial", value=reason, inline=True)
                            await chl2.send(content=None, embed=embed)
discord.errors.HTTPException: 400 Bad Request (error code: 50035): Invalid Form Body
In embed.fields.0.value: This field is required
error
whats wrong in this
 calm walrus
can anyone help me create an ai to play flappy bird? im using this github repository https://github.com/chncyhn/flappybird-qlearning-bot , but this creates their own game, while i want to use a bot for a game that is already online like flappybird.io
I think I would have to set the pixel coordinates, and take screenshots of the game? but not sure how to do that if anyone knows how that would be much appreciated
GitHub
Flappy Bird Bot using Reinforcement Learning. Contribute to chncyhn/flappybird-qlearning-bot development by creating an account on GitHub.
lapis sequoia
fuck wrong channel
 lethal tinsel
Can someone help me to understand this piece of code?
The idea is here that "a" represents sediment that is transported / displaced downhill along the gradient "delta". Can someone explain me how this code works? Why wx and wy is modified through fns and why they're multiplied with "a"?
def displace(a, delta):
  fns = {
      -1: lambda x: -x,
      0: lambda x: 1 - np.abs(x),
      1: lambda x: x,
  }
  result = np.zeros_like(a)
  for dx in range(-1, 2):
    wx = np.maximum(fns[dx](delta.real), 0.0)
    for dy in range(-1, 2):
      wy = np.maximum(fns[dy](delta.imag), 0.0)
      result += np.roll(np.roll(wx * wy * a, dy, axis=0), dx, axis=1)

  return result
So if I want to train a neural network to detect a water bottle from a birds eye view, how should I start?
I searched up a water bottle cap dataset but I couldn't find any
Do I have to create my own? And do I have to train my own neural network to classify it was a water bottle cap?
 quiet vault
You should start by learning the basics on computer vision and object detection if you have not done so. Once you are done with that, you should create your own dataset. It seems pretty complicated to get the images for the dataset on this specific problem. The labeling should be easy but very time consuming when using tools such as Roboflow. Once you have your own dataset you can train your own model. I recommend using model structures that have proven to work well. A good one for real time object detection is YOLO
@brave sand
brave sand
quiet vault
You should start by learning the basics on computer vision and object detection ...
I have already learned the basics of computer vision, and did basic object detection with my webcam
would YOLO recognize water bottle caps from a birds eye view?
quiet vault
Hmmm
Actually no they cannot
Sorry for the bad suggestion

To get the data you could use a drone with a camera and take pictures of a scenery with bottlecaps
And label them using Roboflow
Would take a lot of time but I think it is a good safe option to get good data
 marsh yacht
can anyone explain to me whats the difference between SVM and logistic regression
serene scaffold
@marsh yacht logistic regression is part of a lot of algorithms, so it's hard to say what "the difference" is
marsh yacht
they both have the same idea
marsh yacht
serene scaffold
<@706728092949020713> logistic regression is part of a lot of algorithms, so it'...
but like in terms of model idea making
whats the difference
serene scaffold
@marsh yacht I believe that the algorithm for creating a SVM involves linear regression. The point of a support vector machine is finding the hyperplain that separates instances of different classes.
Don't let "hyperplain" trip you up. It's just a generalization of a boundary line/curve but for any number of dimensions.
marsh yacht
serene scaffold
Don't let "hyperplain" trip you up. It's just a generalization of a boundary lin...
oh i see
thank you i get it now
 sonic finch
more of a general question: Does anyone know of any good resources (books, modules, etc.) that combine Pandas with econometrics? I just finished an econo course this semester and used to use pandas frequently, but was hoping to do a refresher that combines the two
brave sand
quiet vault
Would take a lot of time but I think it is a good safe option to get good data
alright will do. how many images do I need? and once I'm done labeling them, how do I train the test data? could I just follow the pytorch examples?
 mossy stratus
How do I fix this?
RuntimeError: CUDA out of memory. Tried to allocate 110.00 MiB (GPU 0; 8.00 GiB total capacity; 5.37 GiB already allocated; 0 bytes free; 5.54 GiB reserved in total by PyTorch) If reserved memory is >> allocated memory try setting max_split_size_mb to avoid fragmentation. See documentation for Memory Management and PYTORCH_CUDA_ALLOC_CONF
Windows 11, nvidia 3060 TI 8GB
(the problem may be other programs using the gpu, but how do I stop all of them and keep them stopped?)
serene scaffold
mossy stratus
How do I fix this?
`RuntimeError: CUDA out of memory. Tried to allocate 110.00 M...
do you understand what the error message is telling you?
lament hornet
Hey guys, anyone free to help me? I'm completely stuck on this error message
import matplotlib.pyplot as plt
import matplotlib.colors as colours
import time
import os
#library imports

# sig_str_test = [20,40,30,10,70,80,90,35,40,20]
# bssid_list_test = ["bssid1","bssid1","bssid1","bssid1","bssid2","bssid2","bssid2","bssid3","bssid3","bssid3"]
#test lists for debugging


#list definition

test_time_limit = range(0,10)
#debug timelimit - needs to be reworked as program needs to run infinitely until stopped


def get_wifi_data(start_msg = "Gathering Data, please wait."):
    bssid_list = []
    sig_str_list = []
    c_bssid = ""
    c_signal_str = ""
    for i in test_time_limit:

        print(start_msg)
        stream = os.popen("netsh wlan show interfaces")
        output = stream.read()
        for item in output.split("\n"):
            if "BSSID" in item:
                # print (item.strip())
                c_bssid = (item.split(": ",1)[1])
            if "Signal" in item:
                # print (item.strip())

                c_signal_str = item.split(": ",1)[1]
                c_signal_str = int(c_signal_str.rstrip("% "))
        bssid_list.append(c_bssid)
        sig_str_list.append(c_signal_str)
        # print(bssid_list)
        # print(sig_str_list)
        start_msg = start_msg + "."
        time.sleep(1)

    return (bssid_list,sig_str_list)

def create_graph(wifi_data):

    norm = colours.Normalize(vmin=0,vmax=100)
    cmap = "RdYlGn"


    plt.scatter((test_time_limit),wifi_data[0],c=wifi_data[1], cmap = cmap, norm = norm)

    plt.xlabel("Time Elapsed (Seconds)")
    plt.ylabel("BSSID")

    for x,y in zip(wifi_data[0],wifi_data[1]):

        label = y

        plt.annotate(label,
                     (x,y),
                     textcoords = "offset points",
                     xytext = (0,10),
                     ha = "center")

    cbar = plt.colorbar()
    cbar.set_label("RSSI (%)")

    plt.show()

if __name__ == "__main__":
    create_graph(get_wifi_data())
ConversionError: Failed to convert value(s) to axis units: '22:b0:01:af:4a:77'
<Figure size 432x288 with 2 Axes>
serene scaffold
lament hornet
ConversionError: Failed to convert value(s) to axis units: '22:b0:01:af:4a:77'
...
Please show the whole error message.
!traceback
arctic wedgeBOT
Please provide the full traceback for your exception in order to help us identify your issue.
A full traceback could look like:
Traceback (most recent call last):
    File "tiny", line 3, in
        do_something()
    File "tiny", line 2, in do_something
        a = 6 / b
ZeroDivisionError: division by zero
The best way to read your traceback is bottom to top.
• Identify the exception raised (in this case ZeroDivisionError)
• Make note of the line number (in this case 2), and navigate there in your program.
• Try to understand why the error occurred (in this case because b is 0).
To read more about exceptions and errors, please refer to the PyDis Wiki or the official Python tutorial.
lament hornet
it's a long one
serene scaffold
!paste
arctic wedgeBOT
Pasting large amounts of code
If your code is too long to fit in a codeblock in discord, you can paste your code here:
https://paste.pythondiscord.com/
After pasting your code, save it by clicking the floppy disk icon in the top right, or by typing ctrl + S. After doing that, the URL should change. Copy the URL and post it here so others can see it.
serene scaffold
mossy stratus
How do I fix this?
`RuntimeError: CUDA out of memory. Tried to allocate 110.00 M...
what other programs might be using the GPU?
lament hornet
mossy stratus
serene scaffold
what other programs might be using the GPU?
most likely is firefox
but I don't know how to temporarily stop it from using the GPU
serene scaffold
@mossy stratus you can check GPU usage in Task Manager. You can also turn off hardware acceleration in the Firefox settings.
mossy stratus
serene scaffold
<@!777197767461568514> you can check GPU usage in Task Manager. You can also tur...
how?
serene scaffold
mossy stratus
how?
I think you can figure out how to do both of those things
brave sand
hi, does anyone have any experience creating a custom dataset?
mossy stratus
the first is the one I don't know how
serene scaffold
mossy stratus
the first is the one I don't know how
if you go to task manager on windows, GPU is one of the columns
lament hornet
serene scaffold
!paste
I figured it out. I changed a variable I shouldn't have
mossy stratus
serene scaffold
if you go to task manager on windows, GPU is one of the columns
it says it isn't now, but I still get this:
GPU 0; 8.00 GiB total capacity; 5.50 GiB already allocated; 0 bytes free; 5.53 GiB reserved in total by PyTorch (it even says there's 8GB and that it's only using 5.5)
 blazing haven
does anyone here know how to program a python AI bot to play a codebreaker game ( a game where a random 4 digit code is generated and the user enters theirs guess and information they are given in return is which digits they've guessed correctly and which digits they have guessed correctly but In the wrong place). I have built the game and am able to store information such as username and guesses in a separate text file to plot later. Now, I'm just looking for a bot that can learn to play this game.
mossy stratus
serene scaffold
what other programs might be using the GPU?
turns out the actual problem is "fragmentation", do you know how to fix it with pytorch?
serene scaffold
mossy stratus
turns out the actual problem is "fragmentation", do you know how to fix it with ...
your original error message said If reserved memory is >> allocated memory try setting max_split_size_mb to avoid fragmentation. See documentation for Memory Management and PYTORCH_CUDA_ALLOC_CONF
mossy stratus
yes, that's the reason why it can't use all the VRAM
but I don't know how to fix it
serene scaffold
mossy stratus
yes, that's the reason why it can't use all the VRAM
Here are the instructions. However, they're a bit cryptic, so I'll try to help you understand them.
The behavior of caching allocator can be controlled via environment variable PYTORCH_CUDA_ALLOC_CONF. The format is PYTORCH_CUDA_ALLOC_CONF=<option>:<value>,<option2><value2>... Available options:

max_split_size_mb prevents the allocator from splitting blocks larger than this size (in MB). This can help prevent fragmentation and may allow some borderline workloads to complete without running out of memory. Performance cost can range from ‘zero’ to ‘substatial’ depending on allocation patterns. Default value is unlimited, i.e. all blocks can be split. The memory_stats() and memory_summary() methods are useful for tuning. This option should be used as a last resort for a workload that is aborting due to ‘out of memory’ and showing a large amount of inactive split blocks.
Environment variables are stored in os.environ, which is a dict.
!e
import os
print(os.environ)
@serene scaffold :white_check_mark: Your eval job has completed with return code 0.
environ({'LANG': 'en_US.UTF-8', 'OMP_NUM_THREADS': '5', 'OPENBLAS_NUM_THREADS': '5', 'MKL_NUM_THREADS': '5', 'VECLIB_MAXIMUM_THREADS': '5', 'NUMEXPR_NUM_THREADS': '5', 'PYTHONPATH': '/snekbox/user_base/lib/python3.10/site-packages', 'PYTHONIOENCODING': 'utf-8:strict', 'LC_CTYPE': 'C.UTF-8'})
Actually, it might be something you have to do at the command line
PYTORCH_CUDA_ALLOC_CONF=<option>:<value> python your_program.py
looks like the two are the same.
mossy stratus
thanks
mossy stratus
serene scaffold
```bash
PYTORCH_CUDA_ALLOC_CONF=<option>:<value> python your_program.py
```
os.environ['PYTORCH_CUDA_ALLOC_CONF'] = "max_split_size_mb:25"
this should work, right? (environment variables don't work on windows the same way as linux, so I don't know how to set them from command line)
serene scaffold
mossy stratus
```py
os.environ['PYTORCH_CUDA_ALLOC_CONF'] = "max_split_size_mb:25"
```
this sh...
I was able to set them from the command line on windows using git bash.
Yes that looks right.
mossy stratus
serene scaffold
I was able to set them from the command line on windows using git bash.
Yes tha...
setting that didn't actually fix it
same exact error, just different numbers
rough mountain
I have a game cosmoteer. In that game you build spaceships and battle them. I've trained a GAN to create the spaceships. I want it to improve past the human level of input. I was wondering the best way to train generative networks to win at video games? A pool with self play?
mossy stratus
serene scaffold
I was able to set them from the command line on windows using git bash.
Yes tha...
I figured out what I need to do, but not how to do it.
I get this from nvidia-smi:
|    0   N/A  N/A      1452    C+G   Insufficient Permissions        N/A      |
|    0   N/A  N/A      3264    C+G   ...wekyb3d8bbwe\Video.UI.exe    N/A      |
|    0   N/A  N/A      6644    C+G   ...e\Current\LogiOverlay.exe    N/A      |
|    0   N/A  N/A      9888    C+G   ...qxf38zg5c\Skype\Skype.exe    N/A      |
|    0   N/A  N/A     12724    C+G   ..._dt26b99r8h8gj\RtkUWP.exe    N/A      |
|    0   N/A  N/A     14792    C+G   ...\PowerToys.FancyZones.exe    N/A      |
|    0   N/A  N/A     15592    C+G   ...icrosoft VS Code\Code.exe    N/A      |
|    0   N/A  N/A     17832    C+G   ...ekyb3d8bbwe\HxOutlook.exe    N/A      |
|    0   N/A  N/A     21592    C+G   ...8wekyb3d8bbwe\GameBar.exe    N/A      |
|    0   N/A  N/A     22364    C+G   ...n1h2txyewy\SearchHost.exe    N/A      |
|    0   N/A  N/A     26128    C+G   ...054.62\msedgewebview2.exe    N/A      |
|    0   N/A  N/A     29220    C+G   ...054.62\msedgewebview2.exe    N/A      |
|    0   N/A  N/A     32908    C+G   ...artMenuExperienceHost.exe    N/A      |
|    0   N/A  N/A     34148    C+G   ...lPanel\SystemSettings.exe    N/A      |
|    0   N/A  N/A     34728    C+G   ...2txyewy\TextInputHost.exe    N/A      |
|    0   N/A  N/A     34748    C+G   ...y\ShellExperienceHost.exe    N/A      |
|    0   N/A  N/A     37648    C+G   ...perience\NVIDIA Share.exe    N/A      |
|    0   N/A  N/A     38156    C+G   C:\Windows\explorer.exe         N/A      |
```and I need to end all of these, but `nvidia-smi --gpu-reset` gives this error: `Invalid combination of input arguments. Please run 'nvidia-smi -h' for help.`
Is there an easy way to end all GPU processes?So I have a dataset with 6 input variables and 2 output variables
How do I organize this to fit in a neural network?
 eager cliff
hi! I am a little confused in this case: If I have a class MyClass() and then I initialize a1 = MyClass(model_path = "x"), a2 = MyClass(model_path="y"). If I train the a1 model, does it affect a2 model? Thanks
arctic crown
please help
how can i make my ai assistant copy my habits?
suppose i set alarm straight for 5 days to ring at 7am, i want the program to set an alarm at that same time on the 6th day, in case if i forget to set it yourself?
stone marlin
- Haven't you asked this question like, a bunch of days in a row?
- This may not even be reasonable: weekend vs weekday alarm settings, for example.
- We have no idea what your alarm is, how it could integrate with your AI assistant, what your AI assistant is written in (probably python, but...?), how you're running it, and so forth.
 stray quest
I have a very basic python question to anyone who might know. Is there a way to access a Pandas dataframe using the column store in a list?
I have a list of column names I want to turn to dummy variables
dummy_column_list....
In this list is a list of column names that I want to turn to dummy variables....
Is there an easy way to access the column in the dataframe using the values in the list?
stone marlin
You mean dummies like this [one-hot encoding]? https://datagy.io/pandas-get-dummies/
stray quest
Yep! Exactly!
But I want to do this with dozens of columns...
I have all of the column names stored in a list
stone marlin
https://pandas.pydata.org/docs/reference/api/pandas.get_dummies.html Looks like get_dummies takes an array-like. I'll try a toy example.
d = {
    "c1": np.random.choice(["a", "b", "c"], 20),
    "c2": np.random.choice(["AA", "BB", "CC"], 20),
    "c3": np.random.choice(["xX", "yY", "zZ"], 20),
}

one_hot_encode_cols = ["c1", "c3"]
df = pd.DataFrame(d)  # The dataframe with the above categorical vals.
pd.get_dummies(df[one_hot_encode_cols])  # New dataframe, all dummies.
I dunno if this is what you mean, but you can get dummies from a bunch of cols this way.
All but the last line are making a fake df up.
stray quest
OMG! I think that's it
Thank you so much!!
My mind was set on having to create a loop and go through each element of the list separately....
bleh lol!
stone marlin
Luckily, a lott'a things in pandas are able to work on entire dataframes, so there's a good chance you can do a bunch of stuff at once.
stray quest
Yeah I've been learning that
Slowly but surely...
It's nice
Python and R don't like loops, LOL
desert oar
it's a natural consequence of being relatively "slow" dynamically-typed languages
stone marlin
Yeah, except np + pd stuff is usually written in something nice, so it's easier to vectorize.
desert oar
the tradeoff is that it encourages fairly concise "vectorized" code, that might hew a little closer to how you'd express things mathematically
right: the c code inside numpy is quite ugly, but it's in service to letting you write fairly tidy code in python
well maybe not ugly, but certainly dense, and the actual math you are trying to do would be quite obfuscated if you had to write out all your matrix multiplications that way
stray quest
C is both beautiful and ugly IMO
stone marlin
Yeah, it took a little while to "get used to" writing in numpy/pandas vs writing vanilla Python.
stray quest
Pandas and numpy are actually my first exposure to python 😩
desert oar
arguably it might help if you spend some time with a language where the array stuff isn't quite so "bolted on", such as julia or R or even matlab/octave
for example pandas heavily borrows from R
(although it deviates in a few important places, especially the "index" system)
stray quest
I used R for a project and really liked it
stone marlin
I was about to say --- I went to an entire talk by Wes McK about how different pandas is from the ideas he took from R.
desert oar
was that talk recorded? i'd be interested to hear it
does he mention things like dplyr and data.table?
stone marlin
I'dunno, lemme look for it. The gist was: he was working in finance, I believe, and he needed something "like" R but for Python.
desert oar
it's really interesting to see how the two library ecosystems have diverged, almost entirely for "cultural" reasons and nothing to do with performance or scalability
e.g. hadley wickham famously disliked row labels
whereas pandas aggressively embraced row labels
stone marlin
Yeah, the latter half is him discussing the "tidy-data" revolution in R, and how that differs from what Python is doing (which is nothing). R with "tidy" packages are opinionated, Python is currently not.
stray quest
this is a python discord and hopefully I'm not breaking any rules, but I personally like tidyverse better than pandas...
It's just that Python can do so much more, and I don't want to deal with the switching cost....
stray quest
desert oar
it's really interesting to see how the two library ecosystems have diverged, alm...
Oh!
desert oar
i doubt that pandas can do more, but there are good reasons to stick with python
stone marlin
Wickham also has very, very strong feelings about how data should be accessed, how grammars of data should work, etc.
stray quest
desert oar
it's really interesting to see how the two library ecosystems have diverged, alm...
This is neat!
desert oar
yes, wickham's stuff is all extremely opinionated
stone marlin
Tidyverse is totally fine. But it is, as we noted, opinionated. That's totally fine though, since people wind up writing code which "everyone" can understand, and there's fewer ways to do the same thing.
desert oar
meh, well that's where my opinions differ from wickham's 🙂
stray quest
desert oar
i doubt that pandas can do _more_, but there are good reasons to stick with pyth...
Sorry I was probably unclear.. I'm super tired right now... I mean non DS and AI stuff like web scrapping and automating stuff... I think those can be done using R but there are far fewer resources....
desert oar
what i do like about dplyr is that it is kind of a living organism: he is willing to add new functions and deprecate old ones (perhaps indefinitely) in pursuit of nicer and nicer apis
stray quest
dplyr is so clean
desert oar
stray quest
Sorry I was probably unclear.. I'm super tired right now... I mean non DS and AI...
yes, this is valid. and one big reason why i personally switched to using python "at work", because i could do everything in 1 language
particularly text processing, which i was doing a lot of, and which r particularly sucks at (and which python is pretty good at)
stone marlin
I hated writing R for any kind of software dev or model-making because: R is not a language which is easy to do OOP in (yes, yes, R6 exists, but...), and to be able to dockerize R models takes a SIGNIFICANT amount of pre-reqs and space. We whine about Python pre-reqs and so forth, but having dealt with both of them w/rt building pipelines and containers, Python is like, one file that barely needs to be messed with. There are so many workarounds to make R work nicely, it's ridic.
stray quest
Pandas is like df[['column']].stuff.... LOL
desert oar
stone marlin
I hated writing R for any kind of software dev or model-making because: R is not...
i am curious, why OOP in particular was the obstacle?
stone marlin
Well, I guess I could also say data-oriented programming, etc., any kind of larger structured architecture.
stray quest
stone marlin
I hated writing R for any kind of software dev or model-making because: R is not...
I'm nowhere near this level yet
desert oar
general-purpose software dev in R seems like an awkward proposition due to the idea that everything is a vector
i know some people like jared lander have in the past advocated for using r as a general-purpose language
much respect to him but i don't agree
stray quest
I think Wickham has written a book on this...
stone marlin
It's an extremely awkward position. The team I worked for made software for another DS team, and they wrote primarily in R. The engine, therefore, was also written in R. (It was eventually ported to Python, but it was started in R). Trying to write software in R is a nightmare.
desert oar
i think his book is somewhat out-of-date now, even with respect to his own libraries
 stone marlin
But that's not what R is made for. If you need quick EDA, nice plots, or some fast calculations, R is amazing.
safe elk
desert oar
(although it deviates in a few important places, especially the "index" system)
I have used both Matlab and R and numpy of course and I agree
desert oar
stone marlin
It's an extremely awkward position. The team I worked for made software for ano...
rpy2 is pretty sweet though. i can't speak for productionizing r models because i've never done it, but i have had pretty good experiences calling r functions from python with rpy2
what are some workarounds you needed to productionize r?
stray quest
stone marlin
It's an extremely awkward position. The team I worked for made software for ano...
That's the thing, if I did ONLY data analytics I would use R...
I do 90% data analytics, but I might want to do something else, maybe someday..
safe elk
desert oar
particularly text processing, which i was doing a lot of, and which r particular...
Yep python good at text processing
desert oar
stray quest
https://www.amazon.com/Advanced-Second-Chapman-Hall-CRC/dp/0815384572
🙂
if there are new editions, they are probably up-to-date
stone marlin
But IMO, EDA now is so fluid you can do it on either Python or R (this was NOT true until a few years ago when Pandas was young). The remainder --- creating containers, apis, etc., for it --- is very, very annoying to do in R. Very, very annoying.
desert oar
i agree bigtime. also matplotlib has tremendously improved its usability and documentation recently
not to mention seaborn
safe elk
desert oar
i know some people like jared lander have in the past advocated for using r as a...
I agree lol
 violet mulch
hey
desert oar
and the recent development of good quality time series libraries in python
stray quest
Seaborn over matplotlib is a godsend
violet mulch
im trying to do linear regression with 2 features
stone marlin
I hate matplotlib, but it's nice for a quick plot. Seaborn rules, and I'm big into Altair these days --- it borrows some of the grammar of graph stuff from R and is in Vega. But, you know.
violet mulch
violet mulch
im trying to do linear regression with 2 features
import matplotlib.pyplot as plt

def gradient_descent(x0, x1, x2, y):
    theta0 = theta1 = theta2 = 0
    iterations = 100
    n = len(x1)
    learning_rate = 0.000001

    for i in range(iterations):
        theta0_gradient = theta1_gradient = theta2_gradient = 0.0

        for i in range(n):
            theta0_gradient += x0[i] * (y[i] - (theta0_gradient * x0[i] + theta0_gradient * x1[i] + theta0_gradient * x2[i]))
            theta1_gradient += x1[i] * (y[i] - (theta0_gradient * x0[i] + theta0_gradient * x1[i] + theta0_gradient * x2[i]))
            theta2_gradient += x2[i] * (y[i] - (theta0_gradient * x0[i] + theta0_gradient * x1[i] + theta0_gradient * x2[i]))

        theta0_gradient *= -(2 / n)
        theta1_gradient *= -(2 / n)
        theta2_gradient *= -(2 / n)

        theta0 -= learning_rate * theta0_gradient
        theta1 -= learning_rate * theta1_gradient
        theta2 -= learning_rate * theta2_gradient

        print(f'theta0:{theta0} theta1:{theta1} theta2:{theta2}')

    return theta0, theta1, theta2

def main():
    df = pd.read_csv('cleaned_car.csv')

    x2 = df['kms_driven'].to_list()
    x1 = df['year'].to_list()
    x0 = [1 for i in range(len(x1))]
    y = df['Price'].to_list()

    theta0, theta1, theta2 = gradient_descent(x0, x1, x2, y)

if __name__=="__main__":
main()||```ggplot is too "high level" for a lot of cases, and lattice is fine but kind of clunky
stone marlin
!code
arctic wedgeBOT
Here's how to format Python code on Discord:
```py
print('Hello world!')
```
These are backticks, not quotes. Check this out if you can't find the backtick key.
arctic wedgeBOT
Pasting large amounts of code
If your code is too long to fit in a codeblock in discord, you can paste your code here:
https://paste.pythondiscord.com/
After pasting your code, save it by clicking the floppy disk icon in the top right, or by typing ctrl + S. After doing that, the URL should change. Copy the URL and post it here so others can see it.
desert oar
!code @violet mulch can you please edit your message and put your code inside a code block? read below:
violet mulch
violet mulch
```import pandas as pd
import matplotlib.pyplot as plt
def gradient_descent(x0,...
where x1 and x2 are the features x0 is list of 1s
violet mulch
desert oar
!code <@!774228231267024917> can you please edit your message and put your code ...
what
safe elk
stone marlin
But IMO, EDA now is so fluid you can do it on either Python or R (this was NOT t...
Lol i never tried a few of what you listed in R since i dont want to be annoyed
desert oar
read here @violet mulch : #data-science-and-ml message
violet mulch
done
desert oar
@stone marlin i actually think the matplotlib system is an excellent balance of low-level access with high-level interfaces and reasonably good defaults. it's a shame the docs are still a bit hard to navigate and there are some ugly "convenience" interfaces left over from when people wanted it to be matlab-like
stone marlin
Re: productionizing R. Depending on what you need to do to productionize, R is kind of gross. Serving R models can be somewhat strange depending on the API you're pushing the data into, and to get R Server working nicely with some things (even fairly small simple models) it sometimes requires some weird dependencies which are not well-maintained.
violet mulch
violet mulch
```import pandas as pd
import matplotlib.pyplot as plt
def gradient_descent(x0,...
here x1 x2 are the features. i do gradient descent and get theta0 and theta1 theta2 as nan
safe elk
desert oar
<@!199950202252165120> i actually think the matplotlib system is an excellent ba...
Yeah i have that impression too
stone marlin
There's some very specific things we needed to do to make it work, but the gist is like, you want to be able to say: "Okay, I made a model. Put this in a docker, feed it data, get the output." The docker problem is the hard part, and it really has no reason to be so frustrating.
violet mulch
violet mulch
here x1 x2 are the features. i do gradient descent and get theta0 and theta1 the...
worked fine with 1 feature
desert oar
stone marlin
Re: productionizing R. Depending on what you need to do to productionize, R is ...
interesting.. i would have imagined you just install R in a docker image, invoke some kind of basic HTTP server with Rscript, and off you go
stone marlin
Well, you don't want to install all of R Studio all the time, esp including the tidyverse --- that's including BLAS which is like a gig right there.
desert oar
of course not rstudio! but don't you need blas for numpy anyway?
deps are deps 🤷♂️
conda envs with tensorflow et al are also easily 1-2 gb
desert oar
violet mulch
worked fine with 1 feature
it helps if you explain what went wrong in the 2-feature version. maybe it would be easier if you used our paste site, because your code is kind of long.
!paste
arctic wedgeBOT
Pasting large amounts of code
If your code is too long to fit in a codeblock in discord, you can paste your code here:
https://paste.pythondiscord.com/
After pasting your code, save it by clicking the floppy disk icon in the top right, or by typing ctrl + S. After doing that, the URL should change. Copy the URL and post it here so others can see it.
stone marlin
That's probably true, so I'm unsure how BLAS used to take up 1gig for our R images but Python was around 800mb total. I'm unsure, to be honest.
I'm also trying to see --- I remember having to do two libraries loaded from github and not from CRAN, which meant our docker stuff needed to have access to that. But I think that might'a just been a weird thing that we needed to do for some workaround, and not a real issue.
violet mulch
violet mulch
violet mulch
https://paste.pythondiscord.com/esubasimul.apache
I am using two features years and kms_driven to predict the price of used cars..
but values of theta0 thta1 theta2 after gradient_descent is nan
desert oar
stone marlin
That's probably true, so I'm unsure how BLAS used to take up 1gig for our R imag...
that's a good question
stone marlin
It's maybe also the case that Rocker (the people who host the R docker images) got better --- their images used to not be "ehhhh". I'm also reading here (https://mdneuzerling.com/post/deploying-r-models-with-mlflow-and-docker/) that you can use it with MLFlow now, which was not a possibility before.
desert oar
re: github, you would probably need the devtools package
stone marlin
Yes, this was when devtools had a major upgrade and everything broke everywhere. I don't remember why we had to go down to github for some packages.
violet mulch
violet mulch
but values of theta0 thta1 theta2 after gradient_descent is nan
it worked when i did it with 1 feature area to predict price of house
desert oar
violet mulch
but values of theta0 thta1 theta2 after gradient_descent is nan
are there any missing values (often represented as nan) in the data?
and can you show us the correctly-working 1-feature code? just for comparison
stone marlin
We required low-level devtools installs with cleaning since our R images were upwards of 8 - 10 gigs each, and that was not maintainable.
desert oar
that's bonkers
stone marlin
Having said that, this was four years ago --- ecosystems change pretty quickly! We were experimenting with multi-stage installs at the end, which might have helped.
desert oar
i've never seen that ever
violet mulch
desert oar
are there any missing values (often represented as `nan`) in the data?
no there isnt
safe elk
Smells fishy indeed
stone marlin
Either way, both R and Python are cool to work on. I prefer deploying stuff with Python, but that's my dealio.
And matplotlib is fine --- until you need to make some significant customizations. :'''']
desert oar
heh
stone marlin
ggplot2 rules though.
desert oar
at least, it helps if you know the underlying data model (which i'm sure you do)
the whole Artist and Axes business
violet mulch
desert oar
and can you show us the correctly-working 1-feature code? just for comparison
desert oar
before i learned that, matplotlib was an impenetrable mess
stone marlin
Yeah, that was a port from the old Matlab plotting system, I believe.
safe elk
Yep
violet mulch
violet mulch
https://paste.pythondiscord.com/eyoduvuvad.apache
this one worked with
area,price
2600,550000
2750,556000
2500,556500
3000,565000
3200,610000
3300,623000
3600,680000
4000,725000
stone marlin
Haha, so those of us who knew Matlab were fairly familiar with that style of graphing. :'] I still hate it sometimes though. Haha.
safe elk
I used matlab lol so if was ok
desert oar
it's a good system imo, but the docs were really not useful when i first learned it (version 1.x i believe)
stone marlin
Y'all are making me miss R, though. Maybe I ought to go back and see how things "really" are now, so that my biases aren't too great.
desert oar
i used matlab a couple times but never did any plotting
violet mulch
violet mulch
this one worked with
 stone marlin
IIRC, John Hunter did the original port, and after he passed, there was a grad student or two who worked on it and tried to make a lot of the docs better. I don't remember who told me this, so take this with a grain of salt.
iron basalt
desert oar
it's a natural consequence of being relatively "slow" dynamically-typed language...
I recommend trying pypy.
desert oar
the issue (as with most "big" libraries) is that there is no overview of the docs
there are some tutorials, and then bam reference material
iron basalt
Unless there is some specific lib you need that for some reason it can't use.
desert oar
there's no guide to concepts and structure of the system
stone marlin
Or even numba now is pretty good.
iron basalt
I use pypy as my default.
desert oar
iron basalt
I recommend trying pypy.
i am a big pypy advocate as well
iron basalt
Pypy you just go, nothing to worry about like numba or others.
stone marlin
Really? Is pypy better than it was like, 6 years ago? I remember struggling to get any of the scientific libraries working on it.
desert oar
but yeah for most data science things i stick to cpython + numba
stone marlin
Yeah, I stick with cpython + numba as well.
desert oar
yes pypy is quite a bit better but still scientific libraries on pypy aren't as likely to work
iron basalt
It only does not work with some libs like Panda3D because Panda3D does its own special stuff for generating bindings and stuff.
(But in the case of Panda3D you can just write the fast parts easily in C++ and it will create bindings)
desert oar
numpy broke all pypy installs for a while because they did bad dependency pinning 🙂
stone marlin
The only time I used pypy was to do a django app, iirc, and there was a thing I had to do with numpy and it took me like a month to try to unravel what was wrong.
iron basalt
Yeah, it's never really pypy's fault if it does not work.
desert oar
specifically, they did something weird such that you couldn't install numpy as a pep 517 build dep under pypy 3.7
desert oar
whether or not it's pypy's fault doesn't matter really. for a web server i would definitely consider benchmarking pypy
iron basalt
The only downside is that pypy gives a static half second extra startup time no matter the script, but IMO a small price to pay.
desert oar
for a cli, maybe but it depends on startup time vs longer term running time
like a big text processing ETL thing? yeah pypy seems great
but i'm not about to suggest putting it into production serving ML stuff
stone marlin
That seems strange. What's the drawback? Why isn't the "standard" python Pypy?
Oh, is it one of those spark "startup time is ridic, so you better have pret large data" things?
desert oar
because the standard python is the one that guido van rossum wrote, which is cpython
iron basalt
if you need fast startup time (the script itself is short), then you can tell pypy to actually run without JIT --no-jit I think. Then it's just like cpython.
Pypy is pretty much the same as cpython. Some of the subtle differences are actually bug fixes that still exist in cpython.
IMO pypy should become the new standard.
Or nuitka, but nuitka needs a lot more time, it's like how pypy was in the early days.
desert oar
violet mulch
area,price
2600,550000
2750,556000
2500,556500
3000,565000
3200,610000
3300,6230...
can you give an example of data that produces the nans?
i'm pretty optimistic about pypy as well
in my benchmarks, numba still beats pretty much anything else for numerical array stuff
including cython
iron basalt
Pypy has been around long enough at this point, it's mostly just being scared in the don't change it if it works kind of way.
desert oar
(not very scientific benchmarks but i get consistent results)
but if i want to do something like process 10 GB of text, pypy is absolutely the right tool for the job
better than perl at any rate
stone marlin
Yeah, maybe I'll test it out. I'm reluctant to dive too deeply into things which aren't "standards" (even if it's a dumb standard) because if you're leading a team you sort of want everyone using the "most stable / most reliable / most google-able" thing. So, even though some piece of tech might be awesome, we still are going to be a bit behind because of the risk/reward of running into a dead-end or unsolvable problem.
iron basalt
Numba can beat pypy and all that, but my main issue is that sometimes JIT time is very long and it has issues which pypy has started to fix like slow run times on large functions (JIT for all langs struggles with single functions that are very long).
 iron basalt
But the big win with Numba is GPU and multithreaded CPU.
desert oar
violet mulch
can you re-post this as text, not a screenshot? i can't copy and paste from this. use a code block
desert oar
iron basalt
Numba can beat pypy and all that, but my main issue is that sometimes JIT time i...
i'd rather switch to julia anyway 😉
but i am big +1 on pypy finally getting serious industry adoption for web servers and other such tasks
stone marlin
Yeah, numba is awesome. Along with Dask, it gets rid of pret much all my small-to-medium-sized data problems.
desert oar
will be interesting to see if graalpython manages to get any traction
oracle bad, but graal very very cool
stone marlin
For big data problems, I'm not gonna be using Python, haha.
desert oar
until you end up using pyspark 😛
iron basalt
desert oar
i'd rather switch to julia anyway 😉
Julia for me is like almost good. But too many things about it bug me and feel like they are there just to appease matlab and R users, which IMO are terrible languages that happen to have a huge library of many features and so they stick around. Don't tell them I wrote this.
violet mulch
desert oar
can you re-post this as _text_, not a screenshot? i can't copy and paste from th...
,name,company,year,Price,kms_driven,fuel_type
0,Hyundai Santro Xing,Hyundai,2007,80000,45000,Petrol
1,Mahindra Jeep CL550,Mahindra,2006,425000,40,Diesel
2,Hyundai Grand i10,Hyundai,2014,325000,28000,Petrol
3,Ford EcoSport Titanium,Ford,2014,575000,36000,Diesel
4,Ford Figo,Ford,2012,175000,41000,Diesel
5,Hyundai Eon,Hyundai,2013,190000,25000,Petrol
6,Ford EcoSport Ambiente,Ford,2016,830000,24530,Diesel
7,Maruti Suzuki Alto,Maruti,2015,250000,60000,Petrol
8,Skoda Fabia Classic,Skoda,2010,182000,60000,Petrol
9,Maruti Suzuki Stingray,Maruti,2015,315000,30000,Petrol
10,Hyundai Elite i20,Hyundai,2014,415000,32000,Petrol
11,Mahindra Scorpio SLE,Mahindra,2015,320000,48660,Diesel
12,Hyundai Santro Xing,Hyundai,2007,80000,45000,Petrol
stone marlin
I dunno why, but I always forget Pyspark is in Python, haha, I always use it so separate from my scripts that I think of it as its own thing.
violet mulch
violet mulch
,name,company,year,Price,kms_driven,fuel_type
0,Hyundai Santro Xing,Hyundai,2007...
year is x1 and kms_driven is x2 y is price
iron basalt
I like the cheat solution of making a python that is more like Julia (pypy + numpy, etc (python is flexible enough with its operator overloading, etc)).
violet mulch
violet mulch
year is x1 and kms_driven is x2 y is price
desert oar
iron basalt
Julia for me is like almost good. But too many things about it bug me and feel l...
you missed the conversation about how we all miss R
stone marlin
Julia's an okay language. If you write Julia and find a Julia shop, great. It's possible the marketshare in DS for Julia will go up, but I very rarely see anyone "in need of" Julia, and I very rarely see people doing EDA in Julia. I dunno why.
desert oar
it's definitely a momentum problem. python is a local maximum
step size is low, people are busy and risk averse
stone marlin
But, like anything, DS follows trends. R was so hot for a while, now Python is really hot, and a few years ago Scala was suppost'a be the "python killer". Who knows.
desert oar
was R ever hot? idk
scala was never an anything killer, although it does seem like it was a good match for the big data ecosystem
stone marlin
Before Pandas, R was the DS tool of choice (in my field, at least!).
desert oar
ok, that's true
but DS was barely "a thing" at that time
certainly not like it is today
stone marlin
Right, and most of the people coming into DS were, surprise, academics who, surprise, either used R or Matlab in college.
iron basalt
The big issue is hiring. Though, IMO, if you are pretty comfortable with programming and DS you should be able to do whatever, R, Matlab, Julia, Python, etc.
With maybe a week getting oriented.
stone marlin
Haha, so it was wild. But now-a-days, hiring for DS isn't really even about people who can model --- they need to be able to program a bit too, do data viz, etc.
desert oar
indeed. julia is still in the phase of "one person on our team likes to mess around with it but we haven't put it into prod yet"
stone marlin
^^ This 100%.
At the companies I've been at, DS is often like, a few "hard" projects and a lot of pipelining or ETL or whatever. So, it's useful when a DS person also knows how to do software. If they know Python, even better, because it's so general we can build whatever and it's extremely readable (I don't find R readable for software, even after I spent like 3 years on it). So, maybe that's also why Python pegged its way into there: it's so easy to just hook up Python to anything else that the team is using and construct things around it.
desert oar
a few "hard" projects and a lot of pipelining or ETL or whatever
my experience is the same
stone marlin
Compare this with C++ which has a MUCH higher learning curve or Java which --- well, you know.
iron basalt
Python's biggest advantage is that many bindings to C libraries were made for it, so it became the new universal scripting language, the new BASIC.
stone marlin
(Nothing against these languages --- I mean from a hiring perspective, you're going to see more DS people who know Python well vs. C++ / Java well.)
safe elk
stone marlin
Compare this with C++ which has a MUCH higher learning curve or Java which --- w...
Prefer C# to java lol
desert oar
50% of the value is unfucking data, 40% of the value is solving one or two really hard problems, 10% of the value is making dashboards
iron basalt
There is a C binding for everything, from DS, to web, to video editing, to robotics, etc, etc.
stone marlin
Haha, I took up Unity to learn C#, and I love that language --- I dunno if I'd ever want to code in it for a job, but it's pretty fun!
safe elk
stone marlin
Haha, I took up Unity to learn C#, and I love that language --- I dunno if I'd e...
Yeah its fun
stone marlin
Making dashboards pretty is a skill not enough people tell DS entry-level people about, haha.
desert oar
fair enough, but i generally don't make mine pretty
i remember one of my first big "successes" at a job was literally a heatmap of correlations in a shiny app
iron basalt
And the second huge advantage is it's easy to get into. You just make a new file and go. No learning about compilers and linkers and weird old stuff, build systems (at least not for when starting out).
stone marlin
Yeah, the learning curve for Python is much lower --- that's kind of what I was bumbling around above, haha --- that many other languages, with the ability to hook into other things if necessary later. :']
iron basalt
*And also boring standard syntax / nothing too crazy, which is what you want.
stone marlin
Haha, well --- yes, and this is a double-edged sword, because some people write really lazy and gross Python. Some of my team probably hated me, but I required passing pylint, flake8 (there are differences!), mypy, and have coverage of 80% or more. Also, required docs AND required typehints.
I was prob the worst for some of those teammates but that code looked great.
desert oar
@violet mulch i am not getting NaN values, but i am seeing ridiculously large theta magnitudes, on the order of 1e60
iron basalt
Some other languages have this now too in terms of being easier to get into like Go. Older languages have this thing were they tend to require you to read a chapter before doing anything.
(Before even running anything)
Which was a devoluition from the old BASIC days.
eager cliff
hi! I am a little confused in this case: If I have a class MyClass() and then I initialize a1 = MyClass(), a2 = MyClass(). If I train the a1 model, does it affect a2 model? Thanks
desert oar
eager cliff
hi! I am a little confused in this case: If I have a class MyClass() and then I ...
no, every instance of MyClass is fitted separately
here a1 and a2 are two different instances
iron basalt
(The easiest of all was like old C64, you boot into the interpreter, although learning resources were more limited back then, the C64 manual was still excellent)
safe elk
iron basalt
Some other languages have this now too in terms of being easier to get into like...
Lol in high school we had GWbasic it was in the 80s the prompt thou was intimidating at first then once you get the hang of it ...it was fun
eager cliff
desert oar
no, every instance of `MyClass` is fitted separately
oh thank you. you are so nice
desert oar
i am not sure if this is exactly your problem @violet mulch, but it looks like you used theta0_gradient for every coefficient, instead of theta1_gradient and theta2_gradient
            theta0_gradient += x0[i] * (y[i] - (theta0_gradient * x0[i] + theta0_gradient * x1[i] + theta0_gradient * x2[i]))
            theta1_gradient += x1[i] * (y[i] - (theta0_gradient * x0[i] + theta0_gradient * x1[i] + theta0_gradient * x2[i]))
            theta2_gradient += x2[i] * (y[i] - (theta0_gradient * x0[i] + theta0_gradient * x1[i] + theta0_gradient * x2[i]))
that said, i question why you are doing this in a for loop. because these are arrays and you can do vectorized operations
stone marlin
We had qBasic, that was my first language. :'] I'm old, but I'm not as old as some'a y'all! :'''] haha.
safe elk
stone marlin
We had qBasic, that was my first language. :'] I'm old, but I'm not as old as ...
Im probably older or close but i remember qbasic as well
safe elk
iron basalt
Some other languages have this now too in terms of being easier to get into like...
Pascal was clean too and friendly but more structured than basic
stone marlin
I honestly didn't program at all (except as a little kid with my dad) until I graduated from grad school and learned Python. I was trained in math, I didn't know anything about coding. I tried C++ and failed miserably and hated it. Then I tried Python and I was like, "Wow, okay, I get this now."
iron basalt
safe elk
Pascal was clean too and friendly but more structured than basic
Yeah, Pascal did so many things right. I have my copy of algorithms + data structures = programs book here. Probably the best programming book ever written.
stone marlin
I do not think of myself as a great developer, which is perhaps, subconsciously, why I require my team (and myself) to be so anal about clean code. :'''] Hm.
safe elk
Nobody using it now i guess but in my time Pascal was the language taught in my Uni
iron basalt
safe elk
Nobody using it now i guess but in my time Pascal was the language taught in my ...
There are better successors. LIke Modula. Many new systems programming languages are taking great inspiration from it too.
stone marlin
I do not know Pascal, but we do still use FORTRAN for weather-based data things. I have no idea why. All the tooling was written in FORTRAN. I dunno.
desert oar
apparently newer versions of fortran are pretty usable
safe elk
stone marlin
I do not know Pascal, but we do still use FORTRAN for weather-based data things....
I have seen some fortran code myself in an ocean wave modelling package
stone marlin
It is v nice to see people who are so passionate about, like, language design and architecture and the like. I do not care much about it --- I do what works for me, and then I'm like, "Eh, good enough." I fall much more on the "i like these math parts" side of things, so I'm v glad there are people who complement that.
iron basalt
FORTRAN does multi dimensional array stuff well (think numpy). But it's compiled like C.
Choosing precision and such.
stone marlin
Like, if someone code-critiques me and is like, "Hey, you need to do X because the CPU can take advantage of..." I'm like, sweet, okay, yeah, let's do it. I'm glad they know that stuff because I absolutely do not want to dig into things like that. Haha.
iron basalt
stone marlin
I honestly didn't program at all (except as a little kid with my dad) until I gr...
The trick is to have a safe space and a wild space. You can do this many ways. One is to have both C code and Python code and have them interop. People that really know what they are doing can code stuff in C and expose it to the python side which is much more forgiving. On the wild side, coding guidelines still apply, but it's important to be more flexible with them since design patterns are not so much a rule as a very loose guide for advanced programmers. On the safe side, you just want stuff to be safe and understandable, sort of an insulation layer. This is not to insult anyone on the safe side. It's the reality of having many people work on a project of differing levels of experience that may be moving in and out of the company (gets worse the larger to company). Some languages were designed explicitly to solve this problem, like Go, which tries to remain safe while still allowing for decently fast code. Another path to take is that of Rust, in which the compiler enforces stuff.
stone marlin
I strongly agree with this. I think it's extremely important to have your "safe side" because not everyone who is coming into software / ds these days has spent their entire life (or even any time at all) programming.
iron basalt
Yea it can be priorities, job reasons, whatever. It just is what it is, and it's important to know that tools have been made for this (like Go, etc).
stone marlin
Yeah, legit. I've heard of both Rust and Go, but I've only done a bit in Go and I've done nothing in Rust. It was fairly user-friendly to step into Go, which was nice.
iron basalt
C + Python is right now my personal favorite. Although I really appreciate Go (also + C) and if the project is very large I prefer it (for static typing and such).
stone marlin
The more I do type-hinting in Python (for readability, I know it doesn't do anything for speed, haha) the more I appreciate static typing.
iron basalt
Dynamic typing gives you runtime errors that would normally be compile time errors. Moving compile time errors to runtime is not something I want on a large supposedly stable project.
stone marlin
Yeah, this is mitigated a little bit with mypy, but I do agree it's not perfect.
Mypy + type hints have saved me a lot of headaches, though.
iron basalt
(Although not all static typed systems are equal, C for example is a nightmare in that it's not really type safe, like arrays are not a thing, only pointers (and so I need to make a bunch of types to wrap it all, etc))
(Pascal is A+)
 muted furnace
I'm in a for loop, and for some reason this df.at[nRow, 'traitTags'] = new_list works until it hits index 8. I then get a KeyError: 8. But I know for a fact there is a row at that index and I can access it with iloc. Any help?
(In pandas)
stone marlin
I literally did not know until this moment that dataframes had a .at accessor.
Johnny, you might wanna paste a bit more code / maybe the contents of like df.head().
!paste
arctic wedgeBOT
Pasting large amounts of code
If your code is too long to fit in a codeblock in discord, you can paste your code here:
https://paste.pythondiscord.com/
After pasting your code, save it by clicking the floppy disk icon in the top right, or by typing ctrl + S. After doing that, the URL should change. Copy the URL and post it here so others can see it.
muted furnace
Ok, give me a second. I was testing a lot of stuff and the notebook is a mess
safe elk
stone marlin
Yeah, legit. I've heard of both Rust and Go, but I've only done a bit in Go and...
Heard some are doing DS with go
stone marlin
Also, you might want to restart the notebook and re-run things, just in case something weird happened and something got accidentally overwritten. I do this a lot.
Really? I haven't heard much about DS + Go, my previous job had all its stuff in Go from the dev side so that's how I poked at it. That's cool though, it's a neat language.
Wait, what's the diff between loc and at for Pandas?
>>> data = np.random.normal(size=(10, 3))
>>> df = pd.DataFrame.from_records(data, columns=["c1", "c2", "c3"])
>>> print(df.at[2, "c1"])
0.25696741925031297
>>> print(df.loc[2, "c1"])
0.25696741925031297
Am I missing something or is one sugar for the other or something?
safe elk
 stone marlin
I guess maybe loc is a more general at? I dunno, hm. Weird.
Huh, also this article I googled before: https://datascience.eu/computer-programming/golang/

GoLang is an easy and straightforward language for Machine Learning and other applications. If you want to create your first ML project, this article will help you understand the language.
Pretty neat. Maybe I'll poke back into it, but prob only if my next job pays me for it. :'] haha.
desert oar
stone marlin
I literally did not know until this moment that dataframes had a `.at` accessor.
there is .iat too, although apparently it's on the fence for deprecation
i try to use .at and .iat whenever i know for sure that i am accessing a scalar value
stone marlin
Oh, interesting. Yeah, I legit never heard of it before. TIL.
desert oar
it helps make the code visually distinct from "subsetting" and helps reduce the chance of putting in the wrong type of thing
stone marlin
Yeah, I can see the appeal. Kind of also reads nicer too.
warm copper
currently learning tensorflow, and in the first video, a linear classifier model was used with tf.estimator.LinearClassifier, however, after i read up more about it and looking at the tensorflow docs, it seems like this is is a 'legacy' feature back in tf v1? since i'm doing tfv2 now should i use keras instead?
 young raft

I use this YouTube channel to learn data science
- https://t.co/vzKuhVHhWF
- https://t.co/Ju8MTLfy5a
- https://t.co/ZmKiLTVwKR
- https://t.co/331oWinHhy
- https://t.co/13p9IfMVzp
- https://t.co/siI6OuKvWC
- https://t.co/dZ8VE8Hg3e
Drop yours❤
#DataScience #DataAnalytics

 Twitter
·
Twitter
·
 gusty vessel
guys
i need some insight on going about making a machine learning model
ohk so lets say we have a dataset already existing (from kaggle), traffic involving vehicles passing through junctions and roads. the data that we recieve are number of cars at the particular junctions at a certain time. so i need to make a prediction of one car route from a ----> b. i want to find the most optimal route in real time traffic for this car
given that we can detect real time traffic at each junction
i need to make a model to do this
** i thought i should start with a model that deals with shortest route using the roads, and later update routes based on traffic **
odd meteor
brave sand
hi, does anyone have any experience creating a custom dataset?
I think we've all at some point created a custom dataset no matter how small the sample size of our observation might be.
-
You could use the conventional approach of designing a survey instrument. Depending on the kind of data you wanna collect. We have Google forms and other cool tools these days
-
Use GANs. If you have a small dataset, you could use GANs to generate more dataset to populate the one you've got already.
brave sand
odd meteor
I think we've all at some point created a custom dataset no matter how small the...
my dataset I have to generate are water bottle caps
do I just keep taking pictures of water bottle caps
odd meteor
brave sand
do I just keep taking pictures of water bottle caps
If you feel you've taken enough reasonable number of bottle caps images, then use GANs to generate more of such pics (that's if you're not in love with stress 😀 )
You can just Google how to use GANs to generate more images.
 delicate sphinx
Does anyone know how I can fix this? I searched it up but it seems that it's really only with a .gather() function which I don't use, I use the Dataset.map() functions quite a bit to build my input/outputs so I imagine that natively uses .gather() but I'm not sure what I can do to fix it?
c:\users\me\appdata\local\programs\python\python39\lib\site-packages\tensorflow\python\framework\indexed_slices.py:448: UserWarning: Converting sparse IndexedSlices(IndexedSlices(indices=Tensor("gradient_tape/Model/lstm/RaggedToTensor/boolean_mask_1/GatherV2:0", shape=(None,), dtype=int32), values=Tensor("gradient_tape/Model/lstm/RaggedToTensor/boolean_mask/GatherV2:0", shape=(None, 32), dtype=float32), dense_shape=Tensor("gradient_tape/Model/lstm/RaggedToTensor/Shape:0", shape=(2,), dtype=int32))) to a dense Tensor of unknown shape. This may consume a large amount of memory.
  warnings.warn(
A potential solve is posed by https://stackoverflow.com/questions/35892412/tensorflow-dense-gradient-explanation. However I don't seem to understand how I can do this?

Stack Overflow
I recently implemented a model and when I ran it I received this warning:
UserWarning: Converting sparse IndexedSlices to a dense Tensor of unknown shape.
This may consume a large amount of memor...
delicate sphinx
brave sand
my dataset I have to generate are water bottle caps
On top of what Emyrs said, you can always use over-sampling to increase the amount of samples you use, and you can use different rotations/change the quality of the same image (and many other transformations including changing colours) so that it can create them from different angles too, but doing this can cause overfitting so you need to make sure it doesn't just learn the bottlecaps you use.
Tensorflow has its own tutorial on GANs to increase samples in a dataset
brave sand
once I take a ton of pictures, do I manually label them?
delicate sphinx
Yeah you probably would have to
depends how simple your task is
what do you want the model to predict
 forest ledge
hello everyone, does anyone have by any chance a flutter app that predicts the age and the gender using TensorFlow lite?
lament hornet
Super weird error going on on my pyplot graph
    norm = colours.Normalize(vmin=0,vmax=100)
    cmap = "RdYlGn"


    plt.scatter((test_time_limit),wifi_data[0],c=wifi_data[1], cmap = cmap, norm = norm)

    plt.xlabel("Time Elapsed (Seconds)")
    plt.ylabel("BSSID")

    for x,y in zip(test_time_limit,wifi_data[1]):
        print(y)
        label = str(y) + "%"

        plt.annotate(label,
                     (x,y),
                     textcoords = "offset points",
                     xytext = (0,0),
                     ha = "center")

    cbar = plt.colorbar()
    cbar.set_label("RSSI (%)")

    plt.show()

wifi_data[1] is a list of intergers, they're supposed to be labelling the scatter graph dots
but for some reason, they're not. anyone got any suggestions?
 raven estuary
Lst:[]🔥
lament hornet
Nevermind, I figured it out
serene scaffold
@lapis sequoia you're asking people to write the solution for you? Is this data science related?
serene scaffold
@lapis sequoia we don't hand out exact solutions here. Please ask in a help channel. See #❓|how-to-get-help
 amber lark
import numpy as np
import pandas as pd
from tensorflow import keras
from tensorflow.keras.models import Sequential
from tensorflow.keras.optimizers import Adam
from tensorflow.keras.layers import Dense
from sklearn.utils import shuffle
from sklearn.preprocessing import MinMaxScaler
data = pd.read_csv('Training set.csv')

train_data = np.array([data["Weight"], data["Height"]])
data['Sex'].replace("Male", 0, inplace=True)
data['Sex'].replace("Female", 1, inplace=True)
y_train = np.array(data["Sex"])
w_data = train_data[0]
h_data = train_data[1]
train_data = []
for w, h in zip(w_data, h_data):
    train_data.append([w, h])
train_data = np.array(train_data)
train_data, y_train = shuffle(train_data, y_train)
print(data["Sex"])
model = Sequential([
    Dense(units=16, input_shape=(2,), activation='relu'),
    Dense(units=32, activation='relu'),
    Dense(units=1, activation='softmax')
    ])

model.summary()
scaler = MinMaxScaler(feature_range=(0,1))
scaled_train_data = scaler.fit_transform(train_data.reshape(-1,2))
print(scaled_train_data)
model.compile(optimizer=Adam(learning_rate=0.0001), loss='mse', metrics=['accuracy'])
model.fit(x=scaled_train_data, y=y_train, validation_split=0.1, batch_size=32, epochs=30, verbose=2, shuffle=True)```
Why isn't it working
The model isn't really training
Even thought it should
warm copper
what loss function is used in tf.estimator.linearclassifer?
 frozen oyster
Hi
 silver mauve
can someone help me with #help-carrot?
stone marlin
Any of y'all contribute to Open Source stuff? It's one of the last "impostor syndrome" things I have, so I'm going to force myself to do it in 2022. I'm interested to see if any of y'all do it too!
[Posting in ds-and-ai since I'd like to contribute to some Pandas // ML libraries, and I'm interested in other libraries related to DS/ML.]
serene scaffold
stone marlin
Any of y'all contribute to Open Source stuff? It's one of the last "impostor sy...
The only big name library I've contributed to is spaCy. Most of the open source I've done is open-sourcing the code associated with my own research, and the mod tools here on this server.
desert oar
Big established projects can be difficult to contribute to, because there's a lot of code to learn your way around
contributing documentation improvements might be lower hanging fruit
stone marlin
Yep, I'm going to be going for documentation + type-hinting first. To learn my way around it. There's a ton of "good first issues", so I'm gonna focus on that and not get intimidated right off the bat.
serene scaffold
that book looks fine to me. What do you mean by "get to know the code more"?
It looks like this book is intended to help you learn how neural networks work. Whether or not that's "theory" is a matter of how you define stuff.
No; if you're not willing to put in the time, that can't be helped.
There are interesting topics other than deep learning and AI.
 tender sequoia
so you basically like the idea of learning about this topic, but don't actually like the topic
if that's the case, another source isn't going to change that. find something you don't need to convince yourself you like?
serene scaffold
Which aspects do you like?
Arrays (which matrices and vectors both are) are an important part of machine learning, so that's great. But activation functions are an inherent part of neural networks, so if you're not willing to learn about them, it's game over.
 atomic tide
If you want to get stuck in, check out some of the AI challenges at https://www.codingame.com
Although there will come a time where you have to tackle learning the boring stuff.
I mean if you want practical problems to solve.
With actual code.
And actually, it could motivate learning the theory.
The nice thing is, as long as it works, you don't have to use any particular technique. You could implement a neural net, or you could hard-code heuristics using lots of if statements.
 broken zenith
hey all, I'm looking at https://plotly.com/python/3d-mesh/ as a possible solution to plot stacked cubes in 3d, I understand how to derive the 8 vertices of the cube to place them in x, y and z but then plotly also has the concept of triangular faces, (i, j, k), but I don't understand those numbers at all, what's the formula to derive them? Could I skip them altogether? This is the code:
    go.Mesh3d(
        # 8 vertices of a cube
        x=[0, 0, 1, 1, 0, 0, 1, 1],
        y=[0, 1, 1, 0, 0, 1, 1, 0],
        z=[0, 0, 0, 0, 1, 1, 1, 1],
        colorbar_title='z',
        colorscale=[[0, 'gold'],
                    [0.5, 'mediumturquoise'],
                    [1, 'magenta']],
        # Intensity of each vertex, which will be interpolated and color-coded
        intensity = np.linspace(0, 1, 8, endpoint=True),
        # i, j and k give the vertices of triangles
        i = [7, 0, 0, 0, 4, 4, 6, 6, 4, 0, 3, 2],
        j = [3, 4, 1, 2, 5, 6, 5, 2, 0, 1, 6, 3],
        k = [0, 7, 2, 3, 6, 7, 1, 1, 5, 5, 7, 6],
        name='y',
        showscale=True
    )
]) ```
How to make 3D Mesh Plots
safe elk
stone marlin
Any of y'all contribute to Open Source stuff? It's one of the last "impostor sy...
I havent done that too yet
safe elk
broken zenith
hey all, I'm looking at https://plotly.com/python/3d-mesh/ as a possible solutio...
Triangular faces are used to define surfaces... from the vertices
These define planes of which you can compute normals to determine shading for 3D effect or hide or show depending where it is in 3d space
 kind hedge
this link gives me ideas on some cool things you could do with AI/ML https://s3-us-west-1.amazonaws.com/vocs/map.html#
safe elk
I have attempted a pure python 3d rendering engine and actually done hidden surface removal using triangular faces plus shading for 3D effect .. its math heavy. Was just a fun side project
I havent placed that on github thou yet
Not for commericial use if ever i post these things done better on the gpu
broken zenith
safe elk
I have attempted a pure python 3d rendering engine and actually done hidden surf...
for real. the math is intense, lots of things to keep track of. I think matplotlib is ill-suited for the job and the only remaining option I know of is plotly, but the example I have you is a single cube, I want to stack around 3k cubes
safe elk
I made my own matlib lol
safe elk
I cant do that with my lib since i rasterize and output to windows BMP of which i know the format well and used as a video buffer of sorts ..i was only able to make a icosahedron and a disco ball lol
Ah the bitmap code was also pure python lol
broken zenith
cool
well you know more than me lol
I'm thinking this would be easier in something like Blender or unity
safe elk
I have calculus and linear algebra books that i used in making that lol
Yeah Unity great
Make VRchat worlds and code in Udon its friendly
Then manipulate the 3D in 3D space lol
raven estuary
What I mutable and immutable in python
serene scaffold
raven estuary
What I mutable and immutable in python
This isn't a data science question. See #❓|how-to-get-help
 carmine inlet
Hello, Can anyone suggest me, where can I get pre-trained (Yolo series) model specifically trained for Person detection?
vague moon
Hey, I am having some trouble updating the config file for tensorflow object-detection. I keep getting the error that module 'tensorflow' has no attribute 'gfile.' I've went tried going into the config file and turning tf.gfile.GFile into tf.io.gfile.GFile, I've tried changing import tensorflow.compat.v1 as tf to import tensorflow.compat.v1 as tf, and I've tried running the tf_upgrade_v2 script, and sadly none have worked.
 celest heath
hi, i come across this statement:
val_loss starts increasing, val_acc also increases: This could be case of overfitting or diverse probability values in cases where softmax is being used in output layer
could someone explain diverse probability values to me in simpler terms
 loud elbow
I am trying to run this project https://github.com/swz30/MPRNet, after following all the steps, trying to denoise an image results in a RuntimeError: cuDNN error: CUDNN_STATUS_EXECUTION_FAILED , using a pre-trained model on windows rtx2070maxq, not too sure how to resolve this. any help would be appreciated, thank you, haven't done ML before.
using this command provided in the example slightly modified python demo.py --task Denoising --input_dir ./input/ --result_dir ./output/
odd meteor
celest heath
hi, i come across this statement:
val_loss starts increasing, val_acc also incre...
I believe there's an error in the statement. Validation loss and Validation accuracy of a model cannot both be increasing at same time. It's either validation loss decreases which ultimately will warrant Validation accuracy to increase (or vice versa)
So in the case where there's an overfitting, what usually happens is, the validation loss tends to be very much higher than the train set loss.
You'll have the case of diverse probability when you're working on a multiclass classification. The output of a multiclass classification is a probability of each class being predicted as the true value. We use softmax activation function in the last layer of a multiclass classification in neural networks.
Meanwhile, if we had a binary class, we would normally use sigmoid activation function. Thus making our prediction be either 0 or 1 (this output isn't a probability although it can somewhat be considered as one if we look at it in this lens
P(X) > 0.5 == 1 P(X) < = 0.5 == 0
 smoky peak
hello, i have a problem that, i want to run a model with logit, and want the coef non-nagtive and ascending in the coef list. but i cannot find it in scipy. can you help me~ thanks
 inner pebble
Hi everyone, I have a pandas dataframe and I'd like to score all the values for each variables according to their position relatively to the deciles of each one of them.
Basic example here, the Score deciles tabs are scored by variables according to the decile positions of each individuals

I am wondering if there is any sci module to perform it without having to write a for loop and multiple if statements or list comprehension.
ahhh pandas can do it, I was looking specifically in numpy and scipy
https://www.geeksforgeeks.org/finding-the-quantile-and-decile-ranks-of-a-pandas-dataframe-column/
GeeksforGeeks
A Computer Science portal for geeks. It contains well written, well thought and well explained computer science and programming articles, quizzes and practice/competitive programming/company interview Questions.
 clever pivot
heyy i have a question, does anyone know of a mobile inference library for decision tree models
lapis sequoia
inner pebble
ahhh pandas can do it, I was looking specifically in numpy and scipy
https://www...
well when it is about dataframe you are anyways using pandas.
serene scaffold
inner pebble
Are you just dividing the whole thing by 10?
inner pebble
no it s just that here I did it manually and choose 10 individuals with multiple of 10 so it seems that it s divided by 10
The solution is :
df_radarchart = df_favorite_countries.copy()
for e in df_radarchart.loc[:, 'Internet users (%)': 'employment (%)'].columns:
    df_radarchart[e]= pd.qcut(df_radarchart[e],q = 6, labels = False)
If finally choose 6 quantiles
smoky peak
clever pivot
heyy i have a question, does anyone know of a mobile inference library for decis...
scikit-learn
Decision Trees (DTs) are a non-parametric supervised learning method used for classification and regression. The goal is to create a model that predicts the value of a target variable by learning s...
does this work for you
 sullen hull
def sig_fig(num, s_f):
    return round(num, s_f - int(math.floor(math.log10(abs(num)))) - 1)
I took this of stackoverflow to find a number num to s_f significant figures
But can someone please explain how it actually works
tidal bough
looks like s_f - int(math.floor(math.log10(abs(num)))) - 1 converts the significant digits into digits after the decimal point, by estimating the number's magnitude
 odd patio
Give me any basic ml project with python please
orchid kayak
Technically speaking, if I load a sound signal which is silent the array should be filled with zeros, right?
safe elk
Depends on how audio volume is scaled if it ia 0 to 100 a low volume that is inaudibe could be present as 1 etc
 ocean swallow
what kind of algorithm should I be looking if I want to match the images if only they are just slightly moved or the only difference is because one is slightly blurrier/interpolated
I have some almost exact same brochure images but there is like tiny difference between them pixelwise. Most image hashing algorithm can't see that difference.
But there is also the problem some numbers are different on them and that means it is a different image
e.g.


what I tried is dhash, average hash, wehler hash, color hash and crop hash
safe elk
I could apply a xor of the pixels if the images are of the same size and the diff will appear ...same color vanish
If image is alike its all zero
ocean swallow
but there is the problem of them appearing slightly moved too 😦
safe elk
Ah yeah
ocean swallow
I think this is a dead end
ocean swallow
I will try to resize the image with interpolation that just remove the pixels and then apply image hashing
ocean swallow
safe elk
Looks like a german ad
yeah trying to read kaufland brochures lol. I am making a database from hand flyer products.
I think I will have to find a, good hash size threshold
but still looking people with better understanding on the subject
safe elk
So a dhash is a difference hash... i theory it should have worked well if thresholds are set
A hash thou is a greatly diminished representation of the original ...the bits that represent the imqge can be 128 bits so there is loss and hence they might not see what we can
Try to check what the hashing algo are doing.. they probably gray scale etc
 pastel crow
hi guys - I'm struggling creating a set of training images. 
I've extracted tons of GLTF files, which I want to render in a certain state (-> generate screenshots for image detection / modeling). I've been browsing the web for a solution, and everyone just uses blender. Maybe someone has input?
Issue at hand:
- I can investigate the 3d mesh with its texture material in blender, in all its animation states
- I'm aiming for a solution to load the files, put the mesh+texture in a scene where I rotate the model (or camera) to take screenshots of its animation frames at varying angles.
 hearty token
I'm trying to develop a system where the bot retrains itself with newly obtained information. By using pytorch, do i have to start the training anew whenever i get new information or is there an efficient way to acknowledge the new data and adjust as such?
serene scaffold
hearty token
I'm trying to develop a system where the bot retrains itself with newly obtained...
you can set the model back to training mode and forward the new instance through the network.
whether or not that's an effective way to keep the model up to date with new information, I don't know.
hearty token
serene scaffold
you can set the model back to training mode and forward the new instance through...
oh so i'd retrain with all the data i've used before with the appendage of the new info
serene scaffold
hearty token
oh so i'd retrain with all the data i've used before with the appendage of the n...
no. you would just forward the one new training instance through the existing network
safe elk
pastel crow
hi guys - I'm struggling creating a set of training images. <:lemon_angrysad:817...
Blender has a Python API you could investigate it and see if the stuff listed can be scripted.. its also free
hearty token
serene scaffold
no. you would just forward the one new training instance through the existing ne...
So I would create a new optimizer and by using something like cross entropy loss, I could just forward the new data into the model and do the usual backwards propagation stuff through it? i.e.
    model: LoadedNeuralNet
    criterion: CrossEntropyLoss
    optimizer: Adam
    for ...:
       ...
       outputs = model(words)
       loss = criterion(outputs, labels)
       optimizer.zero_grad()
       loss.backward()
       loss = loss.item()
optimizer.step()```considering that this is an already trained neural network
serene scaffold
hearty token
So I would create a new optimizer and by using something like cross entropy loss...
right. I'm suggesting that you just adjust the weights based on the one instance. Not starting over.
hearty token
seems like a nice way to do it, at least comparably to restarting the training
okay I'll try this thank you
orchid kayak
when loading audio as a time series, what do the numbers represent? Is it the amplitude at each sample?
lapis sequoia
guys i need an implementation of Close Algo in python any help ??? PLZ
serene scaffold
lapis sequoia
guys i need an implementation of Close Algo in python any help ??? PLZ
What have you tried?
 solar yew
Hey guys, I'm fairly new to ML trying to do a project before beginning the class in uni, however I have no idea how I can add additional independent variables in NLP. Trying to see if more features results in better accuracy
want to add a numerical and a binary variable but cant find anything online about this
if someone could point me in the right direction that would be super helpful 🙂
serene scaffold
solar yew
Hey guys, I'm fairly new to ML trying to do a project before beginning the class...
additional independent variables in NLP. "NLP" is a pretty broad set of problems and techniques intended to solve them. What are you trying to do?
solar yew
oh sorry didnt really clarify, I am trying to determine between real and fake amazon reviews
currently using a TF-IDF vectoriser and then a naive bayes classifier
bronze skiff
solar yew
Hey guys, I'm fairly new to ML trying to do a project before beginning the class...
you have to be a bit careful about this
depending on your metric, a more complex model will always increase the value of the metric
this is why cross-validation is such an important step in these things
solar yew
yeah ive employed a fairly basic split but i understand that increasing the variables may result in some overfitting
but cross validation techniques id definitely like to explore!
lapis sequoia
serene scaffold
What have you tried?
i had a data set i wanted to apply Close Algorithm on that one
 elfin jungle
has anyone worked with bigML and their lisp flatline formula?
 forest canyon
How can I use SQLAlchemy Session to insert a Pandas dataframe into my postgres db? I used to_sql as a test and it works, but to_sql is going to be slow and I want to use a session and also specify a schema. This is what I have and works, but I want to move onto using a Session. What is going to be the quickest way? I am going to change my DF to read from a csv once I have it working with session.
import pandas as pd
from sqlalchemy import create_engine
from sqlalchemy.orm import Session

engine = create_engine('postgresql://postgres:secret@10.0.10.25:5432/sheepdb')
data = [['title', 'body', 'gregory', '12/30/2021', '', '', 1]]
df = pd.DataFrame(data,columns=['title', 'body', 'add_user', 'add_date', 'edit_user', 'edit_date', 'category_id'])
df.to_sql('jdb_sheep', engine)
 gray shoal
Hi. So i started making a series on Neural Networks. If anyone is interested here's the link. All types of feedback are appreciated. https://www.youtube.com/watch?v=-eWBJg-eeVU&list=PLOOysmT5PG7XUsgWwg0qnv3ErVjHhU1-_

In this beginner-friendly video, we start to tackle how we can make neural networks from scratch in python. If you're interested in machine learning, deep learning or in general how machines "learn" but don't know how to program then this is the perfect series for you. This video covers the perceptron, weights, biases, activations functions and ...
inner pebble
Hi again guys, I have an opened question for all of you.
Let s say we work in a company that has an ERP based on one or several relational databases.
We have to create insights with the data creating some automatic analysis, dashboards and ML model and so we need in time or at least regular batch extractions from the databases.
How would you proceed? I think several solutions are possible. Could you please send what you have in mind?
 foggy fern
Hi everyone I am trying to do this emcee sampler: https://emcee.readthedocs.io/en/stable/user/sampler/
but for some reason i cant get the parameter chain

 fleet wedge
Hi. Have you ever heard about reinforcement learning?
Do you have any actuall tutorials, webpages or books about it?
vague moon
Hey, I am trying to use Tensorflow but keep getting the error that module 'tensorflow' has no attribute 'gfile.' I've tried going into the config file and turning tf.gfile.GFile into tf.io.gfile.GFile, I've tried changing import tensorflow as tf to import tensorflow.compat.v1 as tf, and I've tried running the tf_upgrade_v2 script, and sadly none have worked.
lapis sequoia
CAN anyone tell me what's the diffrence between Apriori algorithme and Close Algorithme ? In number of results ?
which one gives us better AND PRECISE results
 fresh vortex
is there a reference list for regex for pandas? (also does pandas just use standard regex?)
stone marlin
I'm pretty sure pandas uses the same regex that re uses in Python. https://docs.python.org/3/library/re.html The docs are pretty okay, but if you've never seen regex you might wanna google a tutorial.
fresh vortex
needed exactly that, thanks!
 vale wedge
hello, just wanna asking how can i overcome this error?

what need i do? asking for help from anyone
vale wedge
ModuleNotFoundError Traceback (most recent call last)
<ipython-input-194-1178363410e1> in <module>
----> 1 from app.models import model
ModuleNotFoundError: No module named 'app'
vale wedge
forest canyon
You need to import it here or define it in models.py. So if it is defined in mod...
i already add this one
forest canyon
You really have a model just called model?
serene scaffold
forest canyon
You really have a model just called model?
that's not uncommon
forest canyon
serene scaffold
that's not uncommon
I'm just establishing a baseline.
 forest canyon
@vale wedge I'd make sure it truly is called model and make sure it is imported correctly. It says it isn't defined because it doesn't see it.
forest canyon
vale wedge
I can't exactly say.
vale wedge
so how you want me to show that my model is called model?
do i need to screenshot anything?
serene scaffold
vale wedge
hello, just wanna asking how can i overcome this error?
the error message simply means that model has never been assigned any meaning. If there's a statement that looks like model = ... in a different code cell, you must not have run it.
it might also be that model is something you're supposed to import, which is what @forest canyon is thinking. If that's the case, you didn't import it.
serene scaffold
vale wedge
do i need to screenshot anything?
I might be able to continue helping, but I won't read any subsequent screenshots of code. I'll only look at text.
vale wedge
but somehow i got an error stated that no module named 'app'
forest canyon
serene scaffold
the error message simply means that `model` has never been assigned any meaning....
I'm thinking it looks like a copy and paste issue maybe. And it may not be called "model". If it is, then yeah import it.
vale wedge
serene scaffold
I might be able to continue helping, but I won't read any subsequent screenshots...
owh i see, understand
serene scaffold
vale wedge
but somehow i got an error stated that no module named 'app'
Ignore the part about importing from app. Where did you expect the word model to start meaning something?
somewhere in your code, is there an import statement that includes the word model, or is there an assignment statement that includes the word model?
not including from app.models import model -- delete that.
forest canyon
I didn't mean that literally btw ^^ @vale wedge
vale wedge
serene scaffold
somewhere in your code, is there an import statement that includes the word `mod...
okay wait
forest canyon
If you don't have anything named "model" try the dtree just to see
vale wedge
forest canyon
I didn't mean that literally btw ^^ <@!773065030131777588>
thats okay
vale wedge
forest canyon
If you don't have anything named "model" try the dtree just to see

yah i got the output
forest canyon
Cool so you're good?
vale wedge
yah man im good
forest canyon
Awesome
vale wedge
forest canyon
If you don't have anything named "model" try the dtree just to see
but maybe i just stick with this one
anyway, thankyou @forest canyon @serene scaffold
you help me fix this errror, really appreciate it!
arctic wedgeBOT
@swift night Please don't try to ping @everyone or @here. Your message has been removed. If you believe this was a mistake, please let staff know!
 undone mirage
howdy
I'm starting to learn python to hopefully join the Data science field this year
super nervous but hype
hope to get to know a few people here
vague moon
Yo same, howdy brother
undone mirage
vague moon
Yo same, howdy brother
what's up brother! what's your background and how far are you in?
vague moon
19, highschool graduate not in college because I want to teach myself. So far I've taught myself how to use pandas and machine learning algorithms, nueral networks, and now I'm working on object detection with Tensorflow. I also taught myself how to make exe's and to use tkinter so I can send my stuff to my friends who don't code.
you?
I also learned OpenCV but forget about it because it just made me want to learn tensorflow
undone mirage
vague moon
19, highschool graduate not in college because I want to teach myself. So far I'...
how long did it take you to get there? I'm just now starting man, I got my degree in mathematics and a minor in business administration, been running my own small business for a while but wanting to get a stable career in data science or MLE so I'm gonna transition careers, I installed PyCharm, followed a few youtube tutorials, and that's about as far as I've gotten, it's hard learning this stuff without proper structure
iron basalt
undone mirage
how long did it take you to get there? I'm just now starting man, I got my degre...
With a degree in mathematics you should be pretty well setup for it.
(That's usually the barrier to entry)
I recommend picking some book just for structure. Even if it's not a great book you will know what to look up.
lapis sequoia
I'm trying to adapt https://github.com/PabloMSanAla/fabada/blob/master/fabada/__init__.py and i think the formula has some issues but the author isn't really present much of the time.
GitHub
Fully Adaptive Bayesian Algorithm for Data Analysis (FABADA) is a new approach of noise reduction methods. In this repository is shown the package developed for this new method based on \citepaper....
they responded to an email

GitHub
Fully Adaptive Bayesian Algorithm for Data Analysis (FABADA) is a new approach of noise reduction methods. In this repository is shown the package developed for this new method based on \citepaper....
my adaptation attempts to implement it for radio processing and utilizes numba acceleration
i fully re-implemented scipy.stats.chi2.pdf using only numpy and numba acceleratables to cut down the per cycle time, and worked to make it work in realtime(on a four core intel, although im willing to believe i could get better performance with more work)
vague moon
undone mirage
how long did it take you to get there? I'm just now starting man, I got my degre...
it took a few months but i slacked at the beginning so I'd like to say a couple
I used Udemy to learn machine learning and nueral networks to get a basis then I've been using youtube and personal research since
I have a AI udemy course as well that I make my way through when I am waiting for things to download or have machine learning to process.
undone mirage
iron basalt
I recommend picking some book just for structure. Even if it's not a great book ...
thanks for the idea, I'll look up some good books on data science, got any recommendations for where to start?
undone mirage
vague moon
I have a AI udemy course as well that I make my way through when I am waiting fo...
that's awesome man, I'll have to get on the Udemy/Coursery grind here, it's awesome that there's all the resources in the world to get into this stuff, structure and your daily habits are the only thing to figure out
 abstract iris
Hi, I have been using pyautogui forever, and regarding the recent update to python it always had said there is an error importing the module. I have tried to pip install it, and it says requirements already satisfied, and I get in a loop. I was wondering if something has changed and what I can do different so I can make some ai once again.
Thanks,
Isaac
 glossy flower
Hey folks 😄
I was wondering if someone could help me with a error I'm facing with my RML model
I initialised action_space as spaces.MultiDiscrete([3,10]) & when I add it to the model I get this
 serene scaffold
glossy flower
I was wondering if someone could help me with a error I'm facing with my RML mod...
serene scaffold
glossy flower
I was wondering if someone could help me with a error I'm facing with my RML mod...
It looks like whatever value you passed for actions is the wrong type and it just took a while for that to blow up.
It looks like it needs to be an int.
what is MultiDiscrete?
 tawny wyvern
Anyone have any beginner friendly ml projects I could do? Kinda bored of going through tutorial upon tutorial and want a project to work on
serene scaffold
tawny wyvern
Anyone have any beginner friendly ml projects I could do? Kinda bored of going t...
what area of ML are you interested in?
tawny wyvern
Well I eventually wanna get into neural networks and ai, but rn I have experience in things like regression and clustering algorithms
And also am decent at basic data manipulation and visualization, and understand the general workflow of what to do given a project
serene scaffold
tawny wyvern
Well I eventually wanna get into neural networks and ai, but rn I have experienc...
machine learning is part of AI. and deep learning is part of machine learning.
tawny wyvern
Well then I have no clue ;-;
serene scaffold
But there are different problem domains for AI
tawny wyvern
Meaning?
serene scaffold
like, computer vision, natural language processing, robotics
tawny wyvern
Oh also it doesn’t necessarily have to be some project I can complete quickly or with my current knowledge, I wouldn’t mind something longer that means I have to learn some new things
tawny wyvern
serene scaffold
like, computer vision, natural language processing, robotics
Computer vision seems interesting, got any project ideas for that?
serene scaffold
tawny wyvern
Computer vision seems interesting, got any project ideas for that?
you can make a classifier for hand-written numbers
tawny wyvern
So like: I write for example, the number 5 on a piece of paper, and it would then return 5 in a digitilized form?
serene scaffold
tawny wyvern
So like: I write for example, the number 5 on a piece of paper, and it would the...
yes
tawny wyvern
That actually seems fairly cool, with room to maybe expand into letters and such
Will work on that, thanks!
serene scaffold
@tawny wyvern it's a popular first project for image classification, and neural networks in general. See here: https://en.wikipedia.org/wiki/MNIST_database
The MNIST database (Modified National Institute of Standards and Technology database) is a large database of handwritten digits that is commonly used for training various image processing systems. The database is also widely used for training and testing in the field of machine learning. It was created by "re-mixing" the samples from NIST's orig...
glossy flower
serene scaffold
what is `MultiDiscrete`?
I'm using it for a trading bot
action_space = spaces.MultiDiscrete([3,10])
the 3 defines what initial action, buy,sell, hold
the 10 defines 10 different "strengths" so to say of that particular action.
I think I'm explaining that correctly 😂 I may be off with it though
serene scaffold
glossy flower
I'm using it for a trading bot
action_space = spaces.MultiDiscrete([3,10])
the...
Well, build_model apparently needs for that value to be an int. I can't speculate beyond that without seeing the code that defines build_model.
I won't look at any subsequent screenshots of code, so please copy and paste the actual text.
glossy flower
tawny wyvern
Anyone have any beginner friendly ml projects I could do? Kinda bored of going t...
have you got any experience with gym? If not here's a pretty good custom environment walkthrough 😄
https://github.com/nicknochnack/OpenAI-Reinforcement-Learning-with-Custom-Environment/blob/main/OpenAI Custom Environment Reinforcement Learning.ipynb?fbclid=IwAR3_e9hsDkj-kyrZq4L_Lqiwpc7SaO6CLJzUY5DOHAqTipCHqcJZG9haZOc
GitHub
This code accompanies the YouTube tutorial where we build a custom OpenAI environment for reinforcement learning. - OpenAI-Reinforcement-Learning-with-Custom-Environment/OpenAI Custom Environment ...
glossy flower
serene scaffold
Well, `build_model` apparently needs for that value to be an `int`. I can't spec...
def build_model(states,actions):
model=Sequential()
model.add(Dense(24,activation="relu",input_shape=states))
model.add(Dense(24,activation="relu"))
model.add(Dense(actions,activation="linear"))
return model
serene scaffold
glossy flower
def build_model(states,actions):
model=Sequential()
model.add(Dense(24,a...
Yes, so actions needs to be an int.
What int it needs to be, I'm not sure.
glossy flower
no problem 🙂 cheers anyways
austere swift
why do people do stuff like this (rhetorical question)
 hearty token
To construct a network is there a way to determine the amount of hidden neurons if and ins and outs are known?
safe elk
serene scaffold
you can make a classifier for hand-written numbers
Seen some people do nsfw pic classifiers lol
desert oar
lapis sequoia
i fully re-implemented scipy.stats.chi2.pdf using only numpy and numba accelerat...
have you open-sourced this? seems like it might be useful to other people
desert oar
austere swift
why do people do stuff like this (rhetorical question)
possible options:
- superstition from other languages, where doing things like this is a better idea (not sure what that would be)
- consistency. maybe you have designed some kind of higher-level interface that uses functions, and in this particular case the implementation is trivial, but in other cases it's not, but you want to be consistent in the higher-level interface that you provide
lapis sequoia
it would be useful if people did things for me too
unfortunantly, i cannot really get any help @desert oar
@numba.jit(numba.float64(numba.float64,numba.int32))
def chi2_pdf_call(x: float ,df: int):
    ## chi2.pdf(x, df) = 1 / (2*gamma(df/2)) * (x/2)**(df/2-1) * exp(-x/2)
    gammar = (2. * math.lgamma(df / 2.))
    gammaz = ((df / 2.) - 1.)
    gamman = (x / 2)
    gammas = (numpy.sign(gamman) * ((numpy.abs(gamman)) ** gammaz))
    gammaq =  numpy.exp(-x / 2)
    gammaa =  1. / gammar

    pdf = gammaa * gammas * gammaq
    return pdf #where the call to scipy.stats.chi2.pdf requires 60ms and is a cpython primitive, this requires 1ms or less to complete.
What is a robust way to calculate the effectiveness of a neural network? Sometimes low loss models are hyperfitted and only does well with the training data, but then high loss models are underfitted. Is there a magic number in between - or is there a better way to calculate effectiveness rather than loss?
serene scaffold
hearty token
What is a robust way to calculate the effectiveness of a neural network? Sometim...
wouldn't you cross validate or do a train-test split?
and then do something like the f1 score if it's a classification model?
hearty token
okay, yes it is a classification model, do you know if i could do any of this built-in using pytorch*
I meant pytorch not python 😂
serene scaffold
hearty token
okay, yes it is a classification model, do you know if i could do any of this bu...
!docs sklearn.metrics
arctic wedgeBOT
The sklearn.metrics module includes score functions, performance metrics and pairwise metrics and distance computations...
serene scaffold
usually you'd use this
hearty token
Is sk learn another machine learning framework?
serene scaffold
hearty token
Is sk learn another machine learning framework?
sort of? it has a lot of general purpose machine learning tools, but it's not the same as pytorch
hearty token
Alright I'll look more into it thank you
austere swift
desert oar
possible options:
1) superstition from other languages, where doing things like ...
actually the second option would make sense here, this was in a script from openai's glide model, and in that script theres a bunch of other layers that are implemented as functions, so consistency would make sense here
arctic wedgeBOT
glide_text2im/nn.py line 39
def linear(*args, **kwargs):```no, that problem is the objective if hyperparameter tuning (which is testing a bunch of hyperparameters to get the optimal accuracy)
safe elk
lapis sequoia
unfortunantly, i cannot really get any help <@!389497659087650836>
It maybe because you are doing cutting edge stuff lol
lapis sequoia
it isnt
 sleek folio
hello how do i get the image from a webpage via python
like for example in discord.com the image that pops up in the embed well i want its url

Discord
Discord is the easiest way to talk over voice, video, and text. Talk, chat, hang out, and stay close with your friends and communities.
https://discord.com/assets/652f40427e1f5186ad54836074898279.png
this
 tender hearth
 brisk sage
Hello there,
I have two datasets, one with nerve signal amplitudes and another with the animal species the amplitudes were taken from. Now I'm trying to establish if the species has an influence on the amplitude level. Since I have no background in data science whatsoever, I tested for normal distribution with shapiro-wilks and since it wasn't a normal distribution, I used the wilcoxon signed rank test. The only problem is, that it won't work since one dataset contains float and the other strings. Is there any way to test that?
from scipy.stats import wilcoxon
>>> data1.head()
0 1.2778
1 0.9412
2 0.8182
3 1.0000
>>> data2.head()
0 Pig
1 Pig
2 Pig
3 Pig
# Resulting in:
>>> TypeError: unsupported operand type(s) for -: 'float' and 'str'```
I thought about something like `data2.replace("Pig", 1)` and it works then, but I'm guessing that falsified the results polar sky
Hi guys I need help with something really simple concerning the CRSIP DM methodology.in my data preparation i have made the cleaning and groupping and filtering on my features but then after modelling i have dropped features using the feature importance of catboost. my question is how am i gonna explain in the data preparation phase that in the first iteration i made some cleaning but after the modelling i did feature dropping of the features i already cleaned
safe elk
Its an iterative process so it means things can change between iterations as you refine both the level you understand the business problem you want to solve and perhaps your approach to solving it. If you determined later after spending some time that some feature isnt required then there is no reason to keep them in. Iterative practices are also common and gaining traction in traditional software dev. Not everything can be pre planned and anticipated so doing quick cycles in which we test our assumptions and adjust our solutions as needed is better in most cases
grave frost
desert oar
possible options:
1) superstition from other languages, where doing things like ...
honestly, I would prefer that in-case I need to make a change to the Linear block and want it to apply everywhere
plus IMO it looks much neater
grave frost
brisk sage
Hello there,
I have two datasets, one with nerve signal amplitudes and another w...
no, you'd be fine - its just encoding categorical variables
 winter tendon
Is there any website where I can get dataset of random images?
 gaunt garden
Does anyone know how to use python for ml
brisk sage
grave frost
no, you'd be fine - its just encoding categorical variables
So if I have more than one species and replace Species1: 1, Species2: 2, Species 3: 3 etc, that still wouldn't falsify the outcome?
grave frost
brisk sage
So if I have more than one species and replace `Species1: 1, Species2: 2, Specie...
nope, its merely converting it to a different form - as long as you store the keys to values, it shouldn't matter
brisk sage
That is odd. I made a workaround like so:
spec = sheet["Species"].replace("Pig", 1).replace("Cattle", 2)
for i in all_amps.columns:
    print(wilcoxon(all_amps[i], spec))

temp = all_amps.copy()
temp["Species"] = sheet["Species"]
groups = temp.groupby("Species")
pig = groups.get_group("Pig")
cattle = groups.get_group("Cattle")

for c in pig.columns.tolist()[:-1]:
    print(wilcoxon(pig[c], cattle[c]))```

Which tells me p < 0.001 in the former and Non-significant in the latter case(all_amps contains all amplitudes to a given time)
 raw vigil
does anyone know whats conext awareness model?
 sour spindle
Hey i am making a stock predictor and i am wondering if it was ok to use the output from testing and use a post processing function which make the testing accuracy go from .53 to .79?