#data-science-and-ml
1 messages · Page 360 of 1
 lone drum
 serene scaffold
lone drum
<@253696366952316929>
See this way I want output
serene scaffold
lone drum
<@253696366952316929>
See this way I want output
If you can get as far as having a Series of strings that look like 04/03/2017, I can show you how to drop the leading zeros with a regular expression
lone drum
serene scaffold
If you can get as far as having a Series of strings that look like `04/03/2017`,...
Yes I need help on this
Please help me in tgis
serene scaffold
lone drum
Yes I need help on this
What does pd.to_datetime(new_df.date1).dt.strftime('%b/%d/%Y') look like if you print it? Please copy and paste the result as text and I'll be happy to continue helping.
You would need to do print(pd.to_datetime(new_df.date1).dt.strftime('%b/%d/%Y'))
Not knowing what that looks like exactly, my best guess is that this is the solution:
pd.to_datetime(new_df.date1).dt.strftime('%b/%d/%Y').str.replace(r'0(\d)/', r'\1/', regex=True)
The trick is to have a regular expression that matches one zero, one digit (could be zero), and a slash, and replace it with just the second digit and the slash.
This has the effect of droping leading zeros.
lone drum
serene scaffold
What does `pd.to_datetime(new_df.date1).dt.strftime('%b/%d/%Y')` look like if yo...
When I do
print(pd.to_datetime(new_df.date1).dt.strftime('%b/%d/%Y'))``` i get0 Apr/01/2017
1 Apr/02/2017
2 Apr/03/2017
3 Apr/04/2017
4 Apr/05/2017
329 Feb/24/2018
330 Feb/25/2018
331 Feb/26/2018
332 Feb/27/2018
333 Feb/28/2018
Name: date1, Length: 334, dtype: object
When I use this then I get invalid character in identifier errod
serene scaffold
lone drum
When I do
```python
print(pd.to_datetime(new_df.date1).dt.strftime('%b/%d/%Y'))`...
use %m to get the month number, not %b. Here are the docs for the format codes: https://docs.python.org/3/library/datetime.html#strftime-and-strptime-format-codes
serene scaffold
lone drum
When I use this then I get invalid character in identifier errod
what version of Python are you using?
lone drum
serene scaffold
what version of Python are you using?
3.8.8
lone drum
serene scaffold
use `%m` to get the month number, not `%b`. Here are the docs for the format cod...
When I do
new_df.date1 = pd.to_datetime(new_df.date1).dt.strftime('%m/%d/%Y')``` i getThank you for providing more context. Next time, please give the code and the error message in one message so that I have everything I need to see when I react to the ping.
lone drum
Current output from above code

 pseudo wren
my laptop died.
lone drum
But leading zero from month and day are not removed
@serene scaffold do u get my current issue
serene scaffold
lone drum
<@253696366952316929> do u get my current issue
No; it works when I do it.
In [13]: pd.Series(['10/09/2017', '06/12/2017'])
Out[13]:
0    10/09/2017
1    06/12/2017
dtype: object

In [14]: s = _

In [15]: s.str.replace(r'0(\d)/', r'\1/', regex=True)
Out[15]:
0    10/9/2017
1    6/12/2017
dtype: object
pd.to_datetime(new_df.date1).dt.strftime('%b/%d/%Y') is not a complete solution. You also need the regular expression part.
pd.to_datetime(new_df.date1).dt.strftime('%b/%d/%Y').str.replace(r'0(\d)/', r'\1/', regex=True)
This worked
ThNksss
serene scaffold
You are welcome! Do you understand why this works?
lone drum
Yes
lone drum
serene scaffold
`pd.to_datetime(new_df.date1).dt.strftime('%b/%d/%Y')` is not a complete solutio...
Now I. Am trying to separate one month data without using resample
How I can try this?
serene scaffold
@lone drum I am going to sleep now. But you should not have converted the datetime column to a string column if you wanted to do that.
You can group by month with datetime. That's not as easily done for strings.
 errant path
 stone marlin
Howdy, data-enthusiasts. I'm new on the server, but I've been doin' python+data for a while. That's it, I just wanted to say hello. :']
 plain verge
stone marlin
Howdy, data-enthusiasts. I'm new on the server, but I've been doin' python+data...
plain verge
stone marlin
Howdy, data-enthusiasts. I'm new on the server, but I've been doin' python+data...
hi, welcome 🙂
 onyx mica
Looking for advice, kinda new to ML, and for a bigger personal project im trying to make, im looking for basic object recognition in images to get the count of defined objects in that image, so kinda wondering what i should be looking at/diving into to, to learn to do that.
stone marlin
Your project has, for example, an image where you need to count the number of distinct cats, for example? And you wanna sort of work up to that? Just making sure I understand.
onyx mica
ya
stone marlin
Cool, what sort of object rec have you done so far, if any?
onyx mica
looked a bit into sift
stone marlin
Okay, cool. There's two paths for this, one where you learn the theory and one where you just plug stuff in to existing libraries. For the latter, I'm not exactly sure, I've not used SIFT for work.
For the former, IMO it's nice to know about basic image processing + NN stuff before jumping into object recog. There's a "Neptune" article called Image Processing in Python: Algorithms, Tools, and Methods You Should Know that seems to be pretty good --- I dunno if we're allowed to link things, so you can google this if you'd like. That should give you a pretty solid foundation into what is happening during image recog and the things that might make it fail, make it hard, etc.
(I'm not a pro at image recog, so others might have better advice here.)
onyx mica
thank you
 novel raven
how do you make your own cascade ?
stone marlin
Cascade classifiers? Or something else?
novel raven
stone marlin
Cascade classifiers? Or something else?
yes cascade classifier
stone marlin
I'm not sure I've seen that in sklearn, but we've used https://scikit-learn.org/stable/auto_examples/multioutput/plot_classifier_chain_yeast.html for multilabel with some pretty good success. I'm not sure if this will apply to your problem. Maybe someone else here will know more.

scikit-learn
Example of using classifier chain on a multilabel dataset. For this example we will use the yeast dataset which contains 2417 datapoints each with 103 features and 14 possible labels. Each data poi...
 tender hearth
Had a thought - biological evolution is just hyperparameter search
stone marlin
It does feel, when looking at epigenetics data, that sometimes things are surrounding a local minima and then plunge down, causing some mutation. I'm far from an expert on this though!
tender hearth
stone marlin
It does feel, when looking at epigenetics data, that sometimes things are surrou...
Are you replying to me?
stone marlin
Yeah, maybe that's not what you meant, though.
novel raven
stone marlin
I'm not sure I've seen that in sklearn, but we've used https://scikit-learn.org/...
aight ty
what is ensemble
stone marlin
Ensemble Models are where you have more than one model and you combine them to get a (hopefully) better result.
novel raven
stone marlin
Ensemble Models are where you have more than one model and you combine them to g...
got it faster than ever ty
tender hearth
stone marlin
Yeah, maybe that's not what you meant, though.
The metaphor only makes sense if you can extend your definition of "hyperparameter" to include model architecture though
I also guess that's why having tons of children became an evolutionary advantage
Because the search tree ends when it encounters an unoptimal hyperparameter configuration, it makes sense to expand the tree width as much as possible
 terse frigate
hi guys
 iron basalt
tender hearth
Had a thought - biological evolution is just hyperparameter search
iron basalt
tender hearth
Had a thought - biological evolution is just hyperparameter search
It works well because it's massively parallel and genetic algorithms (and other algorithms) are more or less limited by the complexity of their environment. Reality is very complex, which is why any virtual stuff never comes close to the real stuff and one of the reasons why simulation of a robot and training a genetic algorithm does not transfer to reality.
Also the genetic algorithm is generating another agent which can adapt on the fly and make use of previous knowledge from other agents, etc. It's a lot all combined that makes it work so well IRL.
tender hearth
Elements of Statistical Learning is a good one
terse frigate
for beginners?
stone marlin
What maths have you completed? ESL (Elements of Statistical Learning) is the standard right now, afaik, but it's a bit heavy on math.
stone marlin
Calculus + Statistics?
terse frigate
stone marlin
What maths have you completed? ESL (Elements of Statistical Learning) is the st...
it's okay I'm willing to work and learn
iron basalt
(Also any robot with AGI would have to play catch up with millions of years of evolution in a very complex dynamic environment, good luck with that)
tender hearth
Evolution is very inefficient though, don't you think
i.e. millions of years of evolution is not the same as a million years of simulated learning
stone marlin
You can try out Elements of Statistical Learning [I can't link a PDF here, but google "elements of statistical learning pdf", it's free].
Two other books which are a bit more beginner friendly that I like are: Data Smart by John Foreman (this uses Excel to do some DS stuff, and it's honestly a good intro to data analysis + science imo). Ah, the other book I like is out of print, but I've heard good things about "Introduction to Machine Learning with Python: A Guide for Data Scientists".
tender hearth
terse frigate
it's okay I'm willing to work and learn
BTW, since NNs (neural networks) are quite popular now, NNFS is a very good introductory book to them
iron basalt
Yeah, but in order to simulate something as complex as reality it would run slower than reality.
tender hearth
NNFS = Neural Networks From Scratch
tender hearth
iron basalt
Yeah, but in order to simulate something as complex as reality it would run slow...
We can simulate reality smarter though
Look at all the tricks game developers have been doing to speed up rendering
terse frigate
and I've never seen a community this helpful
stone marlin
NNs are pretty fun. I've used them at work like --- once. Haha.
Haha, well, I hope you enjoy your ML/AI learning. :']
terse frigate
thank you so much you guys
stone marlin
No problem!
tender hearth
terse frigate
and I've never seen a community this helpful
<3 Thanks for the comment, we strive to make it very helpful
iron basalt
I recommend spending some time with physics engines to get an idea of how many lightyears away we are from something remotely close to reality.
Let alone even run in real-time! (and you need much faster than real-time)
tender hearth
iron basalt
I recommend spending some time with physics engines to get an idea of how many l...
I wonder what would be faster - scale up current NNs such that they effectively become AGIs (assuming that works), or make an effective scan of the brain and figure out how it works
iron basalt
Basically, genetic algorithms are OP, but the computation required is not really feasible for reality stuff. Games / simulations? Sure.
tender hearth
If the brain depends on physical phenomena that we cannot model cleanly with maths we're fucked sort of
iron basalt
There may be a bit of a cheat though. That's running a genetic algorithm in a simplified simulation which generates the models and then put those models on actual robots. The models require real-time online few-shot learning, etc (all hard unsolved problems), but they could learn to fill in the gaps. Not a terrible idea IMO.
Basically bootstrapping the AI from simulation.
This is an idea that I have tried. The simulation part works, but the real problem is other things in the actual robot part / reality part. Ofc the genetic algorithm can always be improved.
tender hearth
Are you familiar with the "Rising sea of AI" graphic?
I can't seem to find it on Google right now
Google only gives me applications of AI to climate change I guess
iron basalt
Humans and other animals do things that they make look easy, like learning arbitrary length sequences, that can be out of order, learned online one-shot and compressed so well that we can recall a crazy number of things like it's nothing.
Plus it's not the sequence learning you may be used to from deep learning. Here the sequence depends on previous actions taken (feedback loop).
Control theory and other things come into play.
novel raven
what happens if u make a model which can encode data ??
tender hearth
What do you mean by "encode"
iron basalt
An encoder?
novel raven
like for eg the way discord tokens are built
bit-encoding or similar
im not so sure about encoding
what knowledge do you require for encoding ?
tender hearth
I'm not sure what you mean tbh
Also, I forgot how Discord account tokens are generated
 sleek dust
Hey guys, I was wondering if you could advise me on my AI project, I'm attempting to make a very simple Q and A type predictive answering bot with machine learning, what libraries/tutorials should I get started with?
novel raven
tender hearth
I'm not sure what you mean tbh
something un-crackable
iron basalt
Why are you trying to encode and what are you encoding. Also what encoded format?
tender hearth
So encryption?
iron basalt
Yeah that's encryption then. One way encoding that you can't decode without the key.
tender hearth
sleek dust
Hey guys, I was wondering if you could advise me on my AI project, I'm attemptin...
Take a look at this
PyTorch is a deep learning framework, they have tutorials for basic stuff like this as well
novel raven
what if u encode biometric data in a way only ai can understand and then u also give the oxygen levels & other stuff and make a model that can predict if the person is alive/in well condition and then uses itself (that model) to encode the data & only it can decode it ?
tender hearth
I really don't understand you
novel raven
um
tender hearth
Where is the encoding/decoding happening, and why is it useful
novel raven
for the private data of person
sleek dust
tender hearth
PyTorch is a deep learning framework, they have tutorials for basic stuff like t...
Nice! Thank you
novel raven
its happening within the device
sleek dust
I was wondering, what are the differences between pytorch and tensor flow?
iron basalt
novel raven
what if u encode biometric data in a way only ai can understand and then u also ...
That's just worse encryption, probably. The key is basically the model's weights then.
tender hearth
That just sounds like encryption and an SVM
novel raven
iron basalt
That's just worse encryption, probably. The key is basically the model's weights...
which can be maintained ?
how can apple detect if a person is alive ?
iron basalt
It's really just encryption, but from an ML POV.
novel raven
yes
tender hearth
sleek dust
I was wondering, what are the differences between pytorch and tensor flow?
Well, they both accomplish the same things. The difference is in their philosophies
In terms of practicality, TensorFlow has more support for deployment in production environments
iron basalt
The POV does not add much though. Other than noticing that the hidden states of ML models are borderline encryption due to being hard to interpret depending on the model.
sleek dust
tender hearth
In terms of practicality, TensorFlow has more support for deployment in producti...
Yeah i've had experiences using tensorflow, there are wayyy more tutorials on it than pytorch
okay I guess i'll try pytorch, apparently it utiizes parallilism in training
iron basalt
The thing is that actual encryption is designed to avoid issues for the encrypted state, while with ML it's just a side effect (that would be preferred to not exist).
sleek dust
Is that so, weird this article about the differences mentioned only about pytorch having parallelism
tender hearth
Can you share the article? Perhaps they mean something else and you just interpreted it wrongly
sleek dust

Built In
The pros and cons of using PyTorch or TensorFlow for deep learning in Python projects.
Perhaps they mean it's easier to do parallelism in pytorch, (point 2 distributed training)
tender hearth
sleek dust
https://builtin.com/data-science/pytorch-vs-tensorflow
Hm - I don't think they mean parallel training, but parallel I/O
TensorFlow has parallel I/O as well
sleek dust
What does it mean for an AI framework to have parallel IO?
tender hearth
Oh nevermind they mean parallel training across multiple devices
IIRC they added nice APIs for multi-device training recently to Keras
I can't find a version number on that article
sleek dust
Oh, wait, like training on different computers at the same time
sleek dust
Oh well, i probably won't use that
tender hearth
Distributed training = centralized multi-device training
Federated learning = decentralized multi-device learning
sleek dust
Ahh I see
tender hearth
sleek dust
What does it mean for an AI framework to have parallel IO?
It means it can asynchronously fetch input data
sleek dust
As in, after training the model, It can asynchronously fetch the input data (a question) for a return value (an answer)?
tender hearth
If you're not sure about what that means, here's a crash course on it from a Python point of view https://realpython.com/async-io-python/
This tutorial will give you a firm grasp of Python’s approach to async IO, which is a concurrent programming design that has received dedicated support in Python, evolving rapidly from Python 3.4 through 3.7 (and probably beyond).
sleek dust
I definitely need that thanks
tender hearth
sleek dust
As in, after training the model, It can asynchronously fetch the input data (a q...
In all training processes
For machine learning systems to work, you typically need a high volume of data
Fetching data one at a time is very slow and inefficient
Typically, what programmers do instead is use asynchronous I/O, which allows the CPU to handle multiple input/output operations at "the same time"
If you do it one at a time, you're wasting CPU time just waiting for your internet or for your hard drive
sleek dust
Gotchu, I think I'm starting to get this
I'm gonna start reading and writing now, thanks!
tender hearth
No problem! Feel free to ping if you have any follow up questions
iron basalt
Async IO is not parallelism AFAIK. It's basically just not waiting for the IO operation to complete before doing more CPU work.
tender hearth
Yep
iron basalt
Waiting for the IO to first complete the entire time would be a huge waste.
Since the IO is probably much much slower.
Imagine sending a message to a server to ask it for some data. It takes 10 seconds for some reason for it to get there. Now in your code you wait for a response and you end up waiting 20 seconds total. Instead, while the message is being sent you can do other work and check back in later to see if you got a response.
 sleek tapir
hi im struggling to download scikit learn on mac os
my ones intel btw
 devout sail
People who work in ML, do you have some testing methodology?
For example, I have code which trains a NN, then I make several commits to add some feature or whatnot, and then when I try to train again I find out that it degraded in some way. Do you have some CI process to catch it right away? some methods to mitigate the problem? or do you just go back several commits and try to find the problem.
Because unlike with "ordinary" programs where you have unit testing etc., making sure that the network still trains correctly can take a very long time
lone drum
my dataframe this way

after the highlighted row in nf_date when new date came or change then in expiry column put the date according to month
for e.g. in this case this is 4th month data so expiry date will be of 4th month and so on
 pastel valley
yo
lone drum
so in later case i want to shift rows upwrds when new date cames ping me when replying
 lone drum
this highlighted row will came in that place where date changes

 plush leaf
Hi, I need your help. I want to build a car park system with the usage of the shortest path to park the car in an empty area by machine learning. It will be written by python. I try to find some example codes, tutorials, and so on related with that but I couldn't. Can you send me them via DM if you have any idea? I'm looking forward to waiting for your response as early as possible.
 gray tartan
to anyone who worked with google analytics :
I'm querying data from the reporting api (universal analytics), for a specific view, and I have different values than on the website
whether it is from code, or from the GA doc tools themselves
weirdest thing is the data i get from the API is the one i see in the GUI but for another property (a GA4 one)
does anyone know from where it can come? and how to get the right data ?
 obtuse stratus
Hi, I have a question about Searching Algorithm, especially in contingencies game(such as space invader) where the agent doesn't know the actions of the opponent but there is a set of its actions. So beside Expectimax Algorithm, are there other algorithms to deal with that ?. Tks in advance.
 arctic wedgeBOT
:incoming_envelope: :ok_hand: applied mute to @rose quail until <t:1639406262:f> (9 minutes and 59 seconds) (reason: duplicates rule: sent 4 duplicated messages in 10s).
 loud cave
obtuse stratus
Hi, I have a question about **Searching Algorithm**, especially in contingencies...
loud cave
obtuse stratus
Hi, I have a question about **Searching Algorithm**, especially in contingencies...
You mean that you know the possible set of actions the opponent could take, but you don't get to see their actual moves?
terse frigate
tender hearth
No problem! Feel free to ping if you have any follow up questions
what is parallelism?
serene scaffold
You're more likely to get help if you pick a specific question that you're especially unsure about, since reading and verifying each question is a lot to ask. Though it's nice if someone has time to do that.
I suspect it would take longer than that.
obtuse stratus
loud cave
You mean that you know the possible set of actions the opponent could take, but ...
Yeah, that's what I meant
 agile cobalt
Is there some way to do something similar to "zip", with pandas groupby?
I have df.groupby("target_date").last().cumsum(), which gives me the sum of each [last] day 'aimed' at target_date, but I must get the sum of the [last] days, the sum of the [last-1] days and so on.
edit; ping on reply, if any|ever
 boreal loom
anyone familiar with optuna?
 modest mulch
Hiya, I've got a question, any one knows how would we be able to highlight texts in an image? well when I say highlight I pretty much mean i'd be able to seperate the background from the texts, to eventually be able to change th background colour to whatever I want, and the text colour to whatever I want.
If I knew that the text would always be black, I guess a simple binary thresholding would have worked.
But this isn't always the case.
without going into the ocr thing obviously )
pseudo wren
Right now I am trying to initialize a data set in Colab but it appears to be too large. I made a pie graph that is basically unreadable. How can I make it so that my values are readable? I’m working on implementing two other graphs, but sometimes I get error messages stating they’re unable to be used due to the volume of the information.

Photo for reference
stone marlin
You've got a LOT of unique values here, it may be worth either aggregating the values in some way, binning in some way, or --- well, I dunno what you're trying to do here, but it seems like there are a LOT of these with just a single entry. You may want to exclude those.
It looks like, from the little bit of data above, that these are manual entries. You may want to look at them and parse out some of the keywords or something as well. But tldr, you've got a lot of unique values that repeat v infrequently.
loud cave
boreal loom
anyone familiar with optuna?
I am somewhat familiar with it
boreal loom
loud cave
I am somewhat familiar with it
is there a way to not average of n folds and just find it for one run
    cv_scores = np.empty(5)
    for idx, (train_idx, test_idx) in enumerate(cv.split(X, y)):

        X_train, X_test = X.iloc[train_idx], X.iloc[test_idx]
        y_train, y_test = y[train_idx], y[test_idx]
        model = lgb.LGBMRegressor(**param_grid)
        model.fit(
            X_train,
            y_train,
            eval_set=[(X_test, y_test)],
            eval_metric = "rmse",
            verbose= 50,
            early_stopping_rounds=100,
        )
        preds = model.predict(X_test)
cv_scores[idx] = mean_squared_error(y_test, preds)```I knew someone who worked on a problem like that. One example was 'blind monopoly', where you were playing a game of monopoly but couldn't see what the opponent was doing. If you landed on one of his properties you'd still have to pay though. He used a bayesian inference algorithm, particle filtering, to do it. I don't know exactly how relevant it is to what you're doing. I'm pretty sure he open sourced it on github though, Ill see if I can find it
stone marlin
When you say "Not average it for N folds", do you mean that you don't want to do CV? Or something else? Oh, or you want to find a single score for one of the folds?
boreal loom
Probably one of the folds
But as a second solution i guess i would have to not do a cv and just do a test_train_split
Does the stratifiedkfold split in equal parts?
stone marlin
For the latter, you could totally do that. For the former, aren't the individual cv_scores going to be contained in that list? I'm not sure why you'd need them, but I think they are contained there, iirc.
Stratified K-Folds is like K-folds, but the problem with K-folds is that sometimes you'll get, you know, 90% 0 and 10% 1 targets or maybe 50% 0 and 50% 1 targets --- it's hard to know how the target will be represented as a percentage. For example, you may have almost no positive cases or you may have a bunch in that CV split, which can cause the average to tank. Usually this is not so drastic, but, you know, sometimes ---
Stratified will, instead, say, "I want the same percentage of all of the samples w/ whatever target."
This is especially important for imbalanced data, for example.
pseudo wren
stone marlin
It looks like, from the little bit of data above, that these are manual entries....
Yeah :/ I did drop some from the list but it didn’t improve things too too much. I’m unsure of how much I can drop while keeping the integrity of the information.
boreal loom
So there should not be a cv fold
stone marlin
Well, you can do regression with CV, that's not too bad. But it might be the case that you're doing something you didn't mean to. :']
boreal loom
yeah thats sad part
stone marlin
pseudo wren
Yeah :/ I did drop some from the list but it didn’t improve things too too much....
If you're using free-form data (like it looks like you are) it's difficult to cut down things that way. In that case, a pie-chart is not going to give you any information regardless: there are far too many things. You may want to look at, say, the top ten or twenty things in a frequency table or something, depending on the task you've got for yourself.
pseudo wren
I don’t remember the syntax for cutting until the top 20 values
My dataframe is about gpu architecture and quality
 uneven flame
Hi! anybody has experience with this dataset:
https://github.com/Angtian/OccludedPASCAL3D
I am unable to download the data or images both on my pc and on google colab.
Also I'm confused about how to use the annotations to train this data. But First need to be able to download the data ^_^
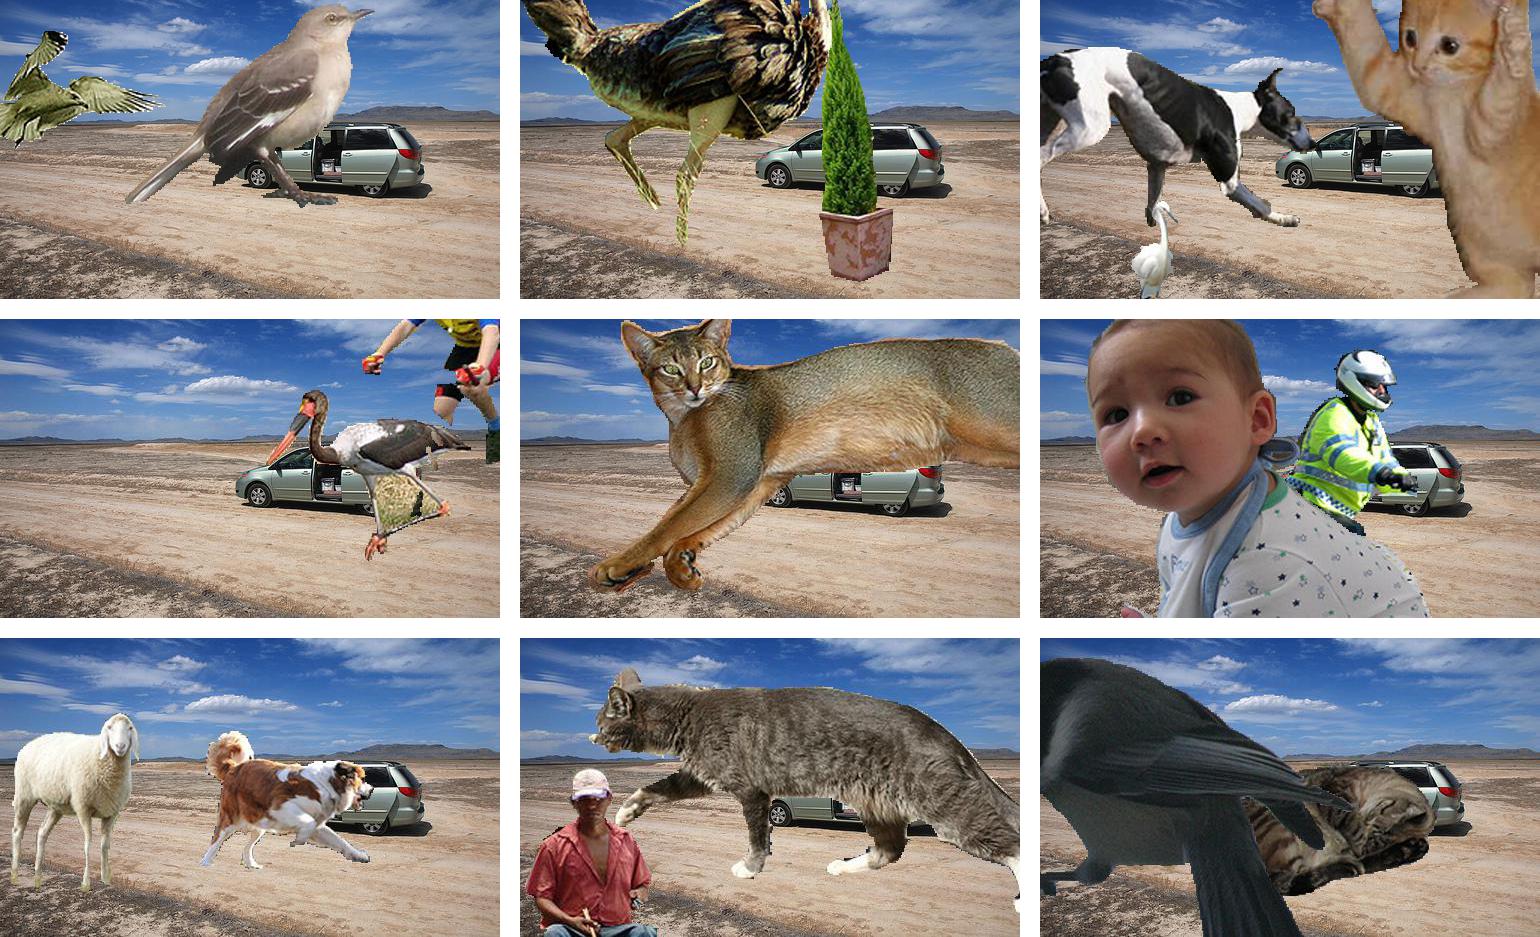
GitHub
The OccludedPASCAL3D+ is a dataset generated via superimposing occluder to PASCAL3D+ dataset for multiple computer vision tasks. - GitHub - Angtian/OccludedPASCAL3D: The OccludedPASCAL3D+ is a data...
boreal loom
this dataset seems like a nightmare
uneven flame
uneven flame
Hi! anybody has experience with this dataset:
https://github.com/Angtian/Occlude...
this is supposed to be the code to download this
 boreal loom
    model = lgb.LGBMRegressor(**param_grid)
    model.fit(
        X_train,
        y_train,
        eval_set=[(X_test, y_test)],
        eval_metric = "rmse",
        verbose= 50,
        early_stopping_rounds=100,
)``` @stone marlin this is better dont you think?@uneven flame doesnt work?
uneven flame
and it's supposed to create a images folder but it did not create one
boreal loom
seems to have downloaded fine
paste the code here
imma check it on collab real fast
uneven flame
!git clone https://github.com/Angtian/OccludedPASCAL3D.git
!chmod +x /content/OccludedPASCAL3D/download_FG_and_BG.sh
 stone marlin
If that's what you want, it looks good to me!
uneven flame
i'm looking for the images and annotations folders
 uneven flame
```!chmod +x /content/OccludedPASCAL3D/download_FG_and_BG.sh```
uneven flame
uneven flame
```!chmod +x /content/OccludedPASCAL3D/download_FG_and_BG.sh```
which we are supposed to get after running this code
 arctic crown
on a graph can you plot a tensor?
 wise cliff
anyone knows when tensorflow will support python 3.10?
uneven flame
arctic crown
on a graph can you plot a tensor?
u can evaluate the tensor to get a numpy array using an open session. Once you get that you have to get rid of the extra dimension by doing something like np_array=np_array[:,:,0]
Then you can use matplotlib and do an imshow(np_array) by default it will aply a colormap to it and normalize it.
If you want a binary you can do binary_array=(np_array>0.5).astype("int") then you can do a final imshow(binary_array)
arctic crown
uneven flame
u can evaluate the tensor to get a numpy array using an open session. Once you g...
what would you see if you were to plot a 4-dimensional graph?
uneven flame
arctic crown
what would you see if you were to plot a 4-dimensional graph?
3d map with a heat map showing the 4th dimension ig
that can be done with matplotlib
arctic crown
so it would be x,y,z and what would be the other dimension?
modest mulch
That's the thing, I don't want to actually "read" the text. I just want to binarize the image, as in make the text black and background white, this would allow me to adjust the colour of the background and the text seperarely however I want, since I know their pixel intensities. (Text would be black and background would be white)
uneven flame
arctic crown
so it would be x,y,z and what would be the other dimension?
sth like this. x,y,z and 4th dim as a heatmap ranging from -2.0(black) to 2.0(white)
 modest mulch
That's the thing, I don't want to actually "read" the text. I just want to binar...
modest mulch
modest mulch
That's the thing, I don't want to actually "read" the text. I just want to binar...
@olive jackal Do you have any idea how this might be done?
arctic crown
uneven flame
sth like this. x,y,z and 4th dim as a heatmap ranging from -2.0(black) to 2.0(wh...
yea im confused
modest mulch
Also one more question please, anyone knows how do I transform colours of an image to "warmer" ones? just like what happens when we enable the eye comfort mode on phones and laptops.
uneven flame
modest mulch
Also one more question please, anyone knows how do I transform colours of an ima...
increase the pixel values in the R channel and reduce the pixel values of the B channel
u can search up how to apply warming filters to images
using CV or sth
modest mulch
Oh alright, sound. Thank you man.
uneven flame
uneven flame
```!chmod +x /content/OccludedPASCAL3D/download_FG_and_BG.sh```
it's working now. i was running a shell script on colab the wrong way, here goes the right way-
!/content/OccludedPASCAL3D/download_FG.sh```@uneven flame Do you have any idea how this might be done mate? or can it even be done?
uneven flame
modest mulch
That's the thing, I don't want to actually "read" the text. I just want to binar...
u can convert your RGB image to grayscale
and then play around with the contrast or exposure
uneven flame
modest mulch
<@!509403906963406860> Do you have any idea how this might be done mate? or can ...
u can also try to perform a Contrast Stretching which essentially makes the darks go darker and the lights go lighter so your grayscale image will have a transformation like this pic-
 modest mulch
uneven flame
u can also try to perform a Contrast Stretching which essentially makes the dark...
modest mulch
uneven flame
u can also try to perform a Contrast Stretching which essentially makes the dark...
Oh this sounds helpful. Thank you man!
uneven flame
Anytime!
arctic crown
how do dimensions work in tensorflow?
serene scaffold
arctic crown
how do dimensions work in tensorflow?
This question is too vague to answer. Tensorflow doesn't do one specific thing.
It is roughly the same as asking "How do numbers work in Python?" and the answer is "depends on what you are doing" or "the same way they work in math".
 rigid zodiac
Hi every one, I have a question when converting image file to array. My image has a grey color scheme, and my array contain of { [ 255,255,255] .....................[255,255,255]} is it because of its color of else?
arctic crown
serene scaffold
It is roughly the same as asking "How do numbers work in Python?" and the answer...
but i dont get how you can plot 6 dimensions on a graph?
serene scaffold
arctic crown
but i dont get how you can plot 6 dimensions on a graph?
If this is a data visualization question, that is not part of tensorflow.
It's not possible to visualize more than three dimensions, so you have to slice up to three dimensions and just visualize that. But you can use more than one visualization to get a sense of what it's like in all the dimensions.
arctic crown
ah ty
serene scaffold
To give you an example, if you wanted to visualize three-dimensional data in two dimensions, you can take a bunch of two-dimensional cross sections
it's fundamentally the same thing in higher dimensions, but our three-dimensional minds can't imagine anything higher than that.
uneven flame
rigid zodiac
Hi every one, I have a question when converting image file to array. My image ha...
maybe because your image has the black pixels(value=0) and white pixels(value=255) alternatively making it look gray.
When i say alternatively, i mean maybe one row all black pixels, other all white pixels and repeat. or maybe alternating columns. Or maybe other combinations. This is a way u can make fully gray images.
But this is usually how grayscale images are-
 rigid zodiac
uneven flame
maybe because your image has the black pixels(value=0) and white pixels(value=25...
rigid zodiac
uneven flame
maybe because your image has the black pixels(value=0) and white pixels(value=25...
Thank you, that's what I suspect, I' trying to plot it with RGB color scheme but I dont know how. I use cm.gist_rainbow to plot the data in 2d pixel
rigid zodiac
uneven flame
maybe because your image has the black pixels(value=0) and white pixels(value=25...
I still encounter the same issue. with this new color scheme, it has the same issue with array

 uneven flame
i'm not sure what's going on here, prolly because Idk what the input image was. And what was your target. Also don't u have to normalize the data or sth?
rigid zodiac
uneven flame
i'm not sure what's going on here, prolly because Idk what the input image was. ...
oh yeah may be that was it. Thank you for your suggestion.
uneven flame
Anytime!
pseudo wren
So I’m using colab now, and I started my data frame on a different computer
I restarted the run time
And suddenly nothing works
It’s saying it’s not defined
Is this a common issue with colab
Could it be because I’m not on the same local machine
Fixed it
 tough bolt
Has anyone here worked with HigherHRNET?
Or possibly Pose Estimation?
uneven flame
pseudo wren
Is this a common issue with colab
usually starts working again after running all cells
 upbeat prism
Can I open the same HDf file in parallel several times on the same communicator?
 upbeat dove
Conv2D requires a 4D tensor when I only have a 3D one. I'm assuming this is because I'm using a grayscale image. How do I get around this?
pseudo wren
uneven flame
usually starts working again after running all cells
I can’t get my bar graph to work


Sorry the one above is a scatter plot
This is the bar graph
 velvet spoke
I need a practical usage of tf. custom_gradients. it is more better in paper implementation
pseudo wren
uneven flame
looks like you're passing floats as parameters
Hm
I’m trying the other way as well but still not working
I don’t get what I’m doing wrong :/
stone marlin
I think you need a "df" before your tags? Right now you're passing in a list of one value (the col name) into the X and Y coords.
 frank torrent
Hi, is there a reason why sometimes tutorials are able to train extremely faster as opposed to when I run the code myself? I am copying tutorial code exactly and have testing running it on my own pc, and on google colabs GPU and TPU
stone marlin
Training time should vary a bit. If you're finding a significant difference between tutorial stuff vs your stuff, it's almost certainly GPU / CPU / cluster specs. Especially if they're setting a random seed number.
stone marlin
I'm attempting to recreate some of the plots in [https://otexts.com/fpp3/] in matplotlib and altair, and I'm jealous that R users just get some of these fancy plots in their ggplot. :'] Haha.
iron basalt
stone marlin
I'm attempting to recreate some of the plots in [https://otexts.com/fpp3/] in ma...
stone marlin
Yeah, I've worked a bit with plotnine before (and the other ggplot-type port) and I remember not loving it, but that's certainly an option.
I don't really love the syntax of ggplot, but I do love a GOG-type system. Altair is the only one I've found that gets close to that, but there's prob more out since I actively needed them like last year.
iron basalt
stone marlin
Huh! I never heard of this one before, I'll check it out. Looks pretty cool!
It doesn't seem to have a whole lot of documentation on a higher-level API from OGL. Have you used this one before? I'm not sure how it's differing from calling OpenGL kind'a from scratch.
iron basalt
It has its own OpenGL wrapper, but also more on top of that.
If you want you can use the lower level API to make very custom stuff.
stone marlin
Huh, okay, interesting. Yeah, I see that "Gloo" is this wrapper to OpenGL. I'm not sure if this is gonna cover my grammar-of-graphics need, but it's definitely an interesting thing to look into, esp if I'll need to graph a ton of data.
iron basalt
Currently, the main subpackages are:

    app: integrates an event system and offers a unified interface on top of many window backends (Qt4, wx, glfw, jupyter notebook, and others). Relatively stable API.
    gloo: a Pythonic, object-oriented interface to OpenGL. Relatively stable API.
    scene: this is the system underlying our upcoming high level visualization interfaces. Under heavy development and still experimental, it contains several modules.
        Visuals are graphical abstractions representing 2D shapes, 3D meshes, text, etc.
        Transforms implement 2D/3D transformations implemented on both CPU and GPU.
        Shaders implements a shader composition system for plumbing together snippets of GLSL code.
        The scene graph tracks all objects within a transformation graph.
    plot: high-level plotting interfaces.
Another option if you just need to some nice 2D plots and not really anything too crazy: https://github.com/hoffstadt/DearPyGui

GitHub
Dear PyGui: A fast and powerful Graphical User Interface Toolkit for Python with minimal dependencies - GitHub - hoffstadt/DearPyGui: Dear PyGui: A fast and powerful Graphical User Interface Toolki...
stone marlin
Oh! I was reading about this before, it's sort of like the "Shiny" of Python. I definitely am gonna dive into this one.
iron basalt
(I usually use dearpygui for all GUI related things in python most of the time, unless I really can't)
(Then I use something more complex game-engine-like such as vispy, panda3d, etc)
stone marlin
Huh, yeah, I don't usually do any GUI work in Python, but this would be a nice thing to know.
obtuse stratus
loud cave
I knew someone who worked on a problem like that. One example was 'blind monopol...
Thank you very much. Wish you like your name 😄

 calm thicket
the "$" doesn't make sense in a number, you'll have to get rid of that somehow
also, in the future, please just copy and paste it, don't use your phone to take a picture
pseudo wren
calm thicket
the "$" doesn't make sense in a number, you'll have to get rid of that somehow
This is my question
What method is best for converting it
calm thicket
slice it off ig
 lapis sequoia
does anyone have experience making a covid 19 dashboard
and is good with libraries like plotly and implementing them into dash
 wicked grove
serene scaffold
it's fundamentally the same thing in higher dimensions, but our three-dimensiona...
wicked grove
serene scaffold
it's fundamentally the same thing in higher dimensions, but our three-dimensiona...
Hello,sorry to ping
I wanted to know if this is a good tutorial for tensorflow
https://youtu.be/tPYj3fFJGjk

Learn how to use TensorFlow 2.0 in this full tutorial course for beginners. This course is designed for Python programmers looking to enhance their knowledge and skills in machine learning and artificial intelligence.
Throughout the 8 modules in this course you will learn about fundamental concepts and methods in ML & AI like core learning alg...
pseudo wren
Not slicing
pseudo wren
I’m still trying to figure out how to convert it to string form
upbeat dove
.
arctic crown
when training why is the final output like (0.5%,0.6%) and not like (50%,60%)?
serene scaffold
wicked grove
Hello,sorry to ping
I wanted to know if this is a good tutorial for tensorflow ...
Idk
 hearty token
Will using Cython with Tenorflow or PyTorch have a gain in performance?
 proven sigil
I'm facing issue using R package in python
serene scaffold
hearty token
Will using Cython with Tenorflow or PyTorch have a gain in performance?
Probably not
proven sigil
I'm facing issue using R package in python
I've installed the package from R CLI and importing in python using rpy2
from rpy2.robjects.packages import importr
importr('RCIT')
But still getting this error when I try to use it
model_pc = cdt.causality.graph.PC()
# graph_pc = model_pc.predict(df)
graph_pc = model_pc.predict(df, skeleton)
R Package (k)pcalg/RCIT is not available. RCIT has to be installed from https://github.com/Diviyan-Kalainathan/RCIT
Traceback (most recent call last):
  File "/usr/local/lib/python3.7/site-packages/cdt/causality/graph/PC.py", line 176, in __init__
    raise ImportError("R Package (k)pcalg/RCIT is not available. "
ImportError: R Package (k)pcalg/RCIT is not available. RCIT has to be installed from https://github.com/Diviyan-Kalainathan/RCIT
welp okay, are they written in c/cpp interally?
serene scaffold
hearty token
welp okay, are they written in c/cpp interally?
yes, so all the heavy lifting is being done in c/++ anyway
hearty token
Yeah okay I see
serene scaffold
if you're leveraging them appropriately, it's not likely that the pure Python part of your code is expensive enough for you to benefit from cython.
You might benefit from numba.
hearty token
So numba can help the training/processing faster?
serene scaffold
hearty token
So numba can help the training/processing faster?
it can JIT compile specific functions. Whether or not that makes all of training and processing faster depends on a lot.
I wonder though, are you training on a CPU? Because if that's the case, no number of optimizations will come close to using a GPU.
hearty token
I'll be using on a GPU, no CUDA though
serene scaffold
I'm pretty sure CUDA is the way to do ML computation on a GPU and that you're out of luck if the GPU that you have does not support CUDA
hearty token
aw man, well I might not be able to leverage numba in that sense since I don't really have any intensive numpying
serene scaffold
what GPU do you have, anyway?
hearty token
I'm using a nvdia GTX 1650
iron basalt
serene scaffold
I'm pretty sure CUDA is *the* way to do ML computation on a GPU and that you're ...
There are others. I use OpenCL, because I need it to run on more than just a GPU for example.
serene scaffold
hearty token
I'm using a nvdia GTX 1650

NVIDIA Developer Forums
Hi all, I would like to know if GeForce 1650 is CUDA-Enabled. In this link https://developer.nvidia.com/cuda-gpus it doesn’t appear but could someone confirm me? Thank you very much.
iron basalt
PyOpenCL is pretty ok, designed to be similar to PyCUDA.
serene scaffold
I would check how you installed pytorch/tensorflow
 austere swift
unless your gpu is either not made by nvidia or very old, it has cuda support
iron basalt
It probably does support CUDA, when you install the SDK it can tell you.
austere swift
with conda you can install cuda through the cudatoolkit package from the conda-forge channel
there are other limitations with CUDA support (namely the compute capability of the gpu), however I'm pretty sure every gpu that has the pascal architecture or later is widely supported by most frameworks
(which the 1650 does)
hearty token
awesome, the article says the GPU has a compute capability of 7.5
probably not too bad
iron basalt
Probably faster than the CPU by a lot still. Unless you have a very high core count modern CPU.
austere swift
serene scaffold
it can JIT compile specific functions. Whether or not that makes all of training...
PyTorch and TensorFlow also have their own JIT compile forms (torch.jit and tf.function respectively) that work better with those packages rather than using numba
hearty token
Yep, I don't have a CPU that could overpower a GPU
austere swift
hearty token
awesome, the article says the GPU has a compute capability of 7.5
most require >3.5
serene scaffold
austere swift
PyTorch and TensorFlow also have their own JIT compile forms (`torch.jit` and `t...
Cool 
hearty token
austere swift
most require >3.5
mhm okay, I'll probably not be able to train this on an integrated graphics card
I have this laptop lying around the house which has quite the low specs, I wonder if i can utilize it
austere swift
@hearty token https://www.tensorflow.org/install/gpu theres some more info on gpu support for tensorflow

TensorFlow
hearty token
thanks mate, I'll check that out
 reef dock
If I have a dataframe column that stores a list of timestamps in each row, how can I return a subtraction of last element of the list and first element of the list?
iron basalt
iron basalt
There are others. I use OpenCL, because I need it to run on more than just a GPU...
Pytorch also has ROCm now but it's beta technically.
(Which is for AMD GPUs and could save you some money for price/performance)
(OpenCL is not used by Pytorch nor TF, but OpenCL works on CPU, GPU, FPGA, etc (recommend pyopencl rather than directly using it, since pyopencl gives you numpy integration and numpy-like arrays))
(https://github.com/CNugteren/CLBlast for OpenCL BLAS (has python bindings) is also an option)

GitHub
Tuned OpenCL BLAS. Contribute to CNugteren/CLBlast development by creating an account on GitHub.
austere swift
iron basalt
Pytorch also has ROCm now but it's beta technically.
yeah AMD is really trying to push their gpus into the data center space to try to take down nvidia's control of the gpu compute market, and for the most part it's working very well (AMDs current most powerful GPUs beat out nvidia's almost 2.5x in fp32 performance), the main issue is just their software optimizations aren't as far as nvidia's
iron basalt
austere swift
yeah AMD is really trying to push their gpus into the data center space to try t...
Yeah it's why I also still use stuff like CLBLast, but also im used to GPU programming so I can just make my own kernels. I also have my own automatic differentiation library that's very pytorch-like (but OpenCL).
Most of the work is in getting those GPU kernels, the rest is not so bad, so if you want to make your own pytorch / numpy, I recommend it.
Pretty fun.
austere swift
I'm not really as familiar with low level gpu kernel stuff (i've made a couple but just for basic operations to mess around and learn) but for the most part I just use pytorch with nvidia gpus and it works well for me
iron basalt
The creator of CLBlast actually has this pretty nice write up on how to make a faster matrix multiply kernel in OpenCL: https://cnugteren.github.io/tutorial/pages/page1.html
I recommend it if you want to get into that and making fast (at least decently fast) kernels.
Do note that on Nvidia GPUs you are often locked out of a lot of the functionality. You either need to use Nvidia's proprietary stuff or switch to something more open like AMD's stuff.
Because of this your kernels will not be as fast as they could be.
But also the listed performances by Nvidia and AMD are both theoretical and don't happen in practice (like not even half).
Also both boost their numbers by doing a bunch of wonky things like changing the definition of "core" to boost the total "core" count on the box.
(Which makes comparing them to each other very hard without insider knowledge)
arctic crown
what do we do with feature_columns
hearty token
What kind of data generalizations and preparations should I take when training for a contextual chatbot? The current one I've trained does really good on specific tags and does terrible on some, and I'm not sure what's wrong (any videos/articles would be great)
 boreal summit
Can someone please help me with this short TFX code.

GitHub
This Repo contains practice projects. Contribute to ORUNSOLU/Practice development by creating an account on GitHub.
novel raven
Can anyone explain me this, I haven't seen that : being used that way before. Reasons why python is harder than js & java

But I don't have a problem in learning new things
 rotund lantern
I want to start learning AI. (I know till intermediate python)
novel raven
Why is machine learning in python so fkin harder than any other language
rotund lantern
can anyone tell me any resources?
novel raven
Tensorflow should be nice for beginners ig, it went somewhat easy on me
novel raven
FreeCodeCamp yt vid
Tensorflow python docs are deadly when you don't know how to navigate between topics
hearty token
Does the arrangement of the sentence in a bag of words matter? i.e.
['hi ', 'hey ', 'how you are ', 'is anyon there ', 'hello ', 'good day ', 'bye ', 'later you see ', 'goodby ', 'cya ', "now go i 'll have to ", 'nice a have day ']``` this is when i translated the bags of words into sentences of stemmed words which the bag of words are [ 0 1 0 0 0 1 ] a binary representation of the word my sentences have in respect to all the words , they are in shuffeled orderIt does not
hearty token
proven sigil
It does not
Oh okay
I suppose the question then would be what matters? What are some things I should pay attention to get the most out of this
serene scaffold
novel raven
Why is machine learning in python so fkin harder than any other language
You were doing machine learning in Java, and you were finding that easy?
iron basalt
novel raven
Can anyone explain me this, I haven't seen that `:` being used that way before. ...

Stack Overflow
I need a good explanation (references are a plus) on Python's slice notation.
To me, this notation needs a bit of picking up.
It looks extremely powerful, but I haven't quite got my head around...
Python's slicing syntax.
Also exists in other languages, very useful.
X[:, i] -> X[slice(None, None), i]
>>> import numpy as np
>>> X = np.arange(9).reshape((3, 3))
>>> X
array([[0, 1, 2],
       [3, 4, 5],
       [6, 7, 8]])
>>> X[:, 1]
array([1, 4, 7])
>>> X[:, 2]
array([2, 5, 8])
>>> X[1, :]
array([3, 4, 5])
>>>
(row, col)
[:, 1] - "All rows of column 1" (so the column vector)
novel raven
serene scaffold
You were doing machine learning in Java, and you were finding that easy?
Javascript (tensorflow.js) library may not be as mature but it is something from which u can train text based, array based models and use it for prediction I learnt machine learning in JS only to understand the concept, in py sklearn looks hard to me, keras & tensorflow is not as difficult but it still looks pretty heavy with such long function names. I haven't really gotten into java yet but it seems similar to python to me just verbose with hard names and very less machine learning resources
And image models too in js and more
But now I'm learning in python, numpy (which is an array lib iirc) looks hard tensorflow is not as such difficult
novel raven
iron basalt
Python's slicing syntax.
Tysm I understood what slicing is but not where I will be using it in actual projects
Ohh nvm I get it
hearty token
In this specific neural net with pytorch:
class NeuralNet(nn.Module):
def __init__(self, input_size, hidden_size, output_size, all_words, tags):
super().__init__()
self.all_words = all_words
self.tags = tags
self.l1 = nn.Linear(input_size, hidden_size)
self.l2 = nn.Linear(hidden_size, hidden_size)
self.l3 = nn.Linear(hidden_size, hidden_size)
self.l4 = nn.Linear(hidden_size, output_size)``` would the number of hidden layers be 2 considering l1 and l4 are input and output layers? delicate sphinx
<TENSORFLOW>
How can I reduce input sizes creating an issue? I've got a multi-pipeline input with question of length 32 and image of 36 arrays of 2048 (36,2048). So I can't simply put one image and question as input as the data cardinality is wrong (32,36). This would also suggest that the only reason it works to train is because it uses more than 1 question for each image (i.e. 32 from first question and 4 from next question to match the images 36)
arctic crown
what are linear_estimator?
 steel mauve
<pandas/dask>
I'm new to pandas and I ran into a weird issue. I have dask dataframe loaded from a large multi-file CSV and I'm running an .apply on it to calculate two new int64 columns. I use result_type='expand' so the end result is a 2-col dataframe that I want to merge back on the original. The problem is that at some point the indexing of the result DF switches from the expected row numbering (0, 1, 2...) to having the entire row of the original DF as a tuple in the index - so I have a DF that is halfway indexed with row number and afterwards it's tuples. The kicker is that this same thing didn't happen earlier. Any idea what the problem could be?
upbeat prism
Anyone knows if HDF5 resp. h5py supports buffering so I minimize file IO? IN fact I use the parallel mpio file driver, so maybe that would be an issue.
arctic wedgeBOT
:incoming_envelope: :ok_hand: applied mute to @velvet cedar until <t:1639505488:f> (9 minutes and 59 seconds) (reason: duplicates rule: sent 4 duplicated messages in 10s).
lapis sequoia
hello, are there any AI and machine learning books
which are good to begin learning ML and AI
serene scaffold
There's "Data Science from Scratch"
lapis sequoia
is that machine learning tho?
serene scaffold
Depends on where you draw the line.
lapis sequoia
how closely is ML and AI linked in with data science
because I don't like data science, I just want to do machine learning
serene scaffold
lapis sequoia
because I don't like data science, I just want to do machine learning
How can you say that you don't like data science until you know what the distinction between the three are?
Data science is a superset of machine learning and the book I've suggested goes over fundamentals you will need for machine learning like linear algebra and probability/statistics. Are those topics you are interested in?
boreal loom
Anyone familiar as to how I can add weight decay to my RMSProp?
boreal loom
lapis sequoia
because I don't like data science, I just want to do machine learning
Thats a hot take , since ML is a tool thats used for data science, its like saying i want to do calculus without learning linear algebra
If you learn ML then where are you gonna apply it? to JSONs with 20 lines?
There are AI subsets that do not rely on data, but thats because they generate their own data for the most part
ML and AI are tools used to help with data processing
The current iterations that is
In the past not so much and I suspect also in the future to not be the main part
But for now thats how it is
By past, I mean that people did not have the wealth of data we have in mind, but they were designed with that in mind, to acommodate for the increase in data, now was that deliberate? I dont know, but thats why ml and ai has taken off, its literally in the first class of every uni/programme about dsc
 grave frost
lapis sequoia
because I don't like data science, I just want to do machine learning
grave frost
lapis sequoia
because I don't like data science, I just want to do machine learning
oh, if you mean you would like doing research/ discovering new techniques and ways to reach AGI then that's a different path
I dislike data science in general too. If research is where you wanna go, then I recommend you simply start with what you find interesting and dive in
as soon as you encounter stuff you don't understand - google it, read up about it and ask questions (There are plenty of other Discord servers which serve for more technical AI/ML questions)
iron basalt
lapis sequoia
which are good to begin learning ML and AI
ML there is some good resources. AI not so much because AI means different things to different people. ML is a bit more specific.
You can learn a bunch of ML tools, but to make an AI will require your personal creativity and depends on what you are trying to make.
Also if it somehow involves robotics then you have entire other fields of knowledge required.
grave frost
oh hey @iron basalt how's the biologically inspired approaches working out? or did you switch to another topic?
iron basalt
grave frost
oh hey <@!119925597395877889> how's the biologically inspired approaches working...
It's going well, but as usual we found something better and are working on that. I can tell you that we now use grid cells.
 odd meteor
lapis sequoia
because I don't like data science, I just want to do machine learning
odd meteor
lapis sequoia
because I don't like data science, I just want to do machine learning
😂 If you really like ML you have no option than to like Data Science. Can you really do ML without data science?
iron basalt
We also got a new fancy robotic arm that we are applying the grid cell based method to.
grave frost
iron basalt
It's going well, but as usual we found something better and are working on that....
Ahh - I stopped in the biologically inspired train since it was too complicated to start off with (though the long term plan is to get back into understanding it 😉). The lack of breakthroughs are discouraging...
grave frost
odd meteor
😂 If you really like ML you have no option than to like Data Science. Can you r...
technically yes, you can
iron basalt
grave frost
Ahh - I stopped in the biologically inspired train since it was too complicated ...
I recommend starting with simple to implement algorithms that are powerful and biologically inspired such as adaptive resonance theory based methods. Self organizing feature maps are pretty similar to biological stuff too and also very simple yet powerful, you can do so many unexpected things with them.
SOMs are one of my favorite things in ML.
grave frost
iron basalt
I recommend starting with simple to implement algorithms that are powerful and b...
indeed, but the lack of scalability makes them bad candidates for advancements
unfortunately, they are the only ones.
Even if we might be able to get to AGI with DL, ASI would require the biological cortical column to be mapped. My naive hope, perhaps an AGI might just accelerate bio-inspired research
odd meteor
boreal loom
Anyone familiar as to how I can add weight decay to my RMSProp?
Just add the parameter in your code. For example, Let's say, I'm using Adam optimizer to minimise my loss function, I could add the weight_decay parameter to apply L2-regularization in the network built with PyTorch
Optimizer = optim.Adam(net.parameters(), lr = 3e-4, weight_decay = 0.0001)
My Optimization function is Adam, yours is RMSprop, substitute that in the above code.
iron basalt
grave frost
Even if we might be able to get to AGI with DL, ASI *would* require the biologic...
Creating a cortical column that works is kind of what we do. It may not be the actual real-life thing, but if it works, it works. So given all the information we currently have we come up with ideas and just try them.
grave frost
However, in the long run I hope I can become proficient in both DL and Hawkins' approach - because that's the intersection where any innovation would lie
iron basalt
You can also just use the main themes as a guide too if you want to go even more loose with it.
grave frost
iron basalt
Creating a cortical column that works is kind of what we do. It may not be the a...
I know this is a short sighted statement, but they can't be really effectively used in real-life scenarios
iron basalt
For example sparsity.
Those main ideas let you section out / cut off a huge chunk of possibilities.
grave frost
yep, sparsity is a growing ideal in DL space. but that's not really gonna get to AGI
iron basalt
Not by itself, but it let's you know where to look.
grave frost
go even more loose with it.
that's the trouble - It's not really important for me right now seeing where I am; but I am kinda confused how much the balance should be 🤔
iron basalt
grave frost
> go even more loose with it.
that's the trouble - It's not really important fo...
You should still know DL well and what is happening in the DS world, etc.
The rest nobody can really answer for you. It's the multi-arm bandit problem of research in general.
odd meteor
grave frost
technically yes, you can
Well, in a way tho... All thanks to scikit-learn and other useful libraries. Although, I've never seen anyone who skipped High school and jumped straight to Graduate School 😅
grave frost
iron basalt
The rest nobody can really answer for you. It's the multi-arm bandit problem of ...
Well, all there is to just learn 🙂
any handy beginner-friendly resources you prefer for SOMs?
grave frost
odd meteor
Well, in a way tho... All thanks to scikit-learn and other useful libraries. Alt...
Although, I've never seen anyone who skipped High school and jumped straight to Graduate School
?
Oh no, I just meant ML does not necessarily = data
iron basalt
grave frost
Well, all there is to just learn 🙂
any handy beginner-friendly resources you pr...
It's so simple wikipedia has the whole algorithm explained: https://en.wikipedia.org/wiki/Self-organizing_map

A self-organizing map (SOM) or self-organizing feature map (SOFM) is an unsupervised machine learning technique used to produce a low-dimensional (typically two-dimensional) representation of a higher dimensional data set while preserving the topological structure of the data. For example, a data set with p variables measured in n observations c...
But it has many many uses and biological stuff behaves a lot like it.
grave frost
Hmm...what about the more powerful stuff? 😉
iron basalt
Did you read through Jeff's papers on grid cells and combining them with sensory input?
Well, actually, if you use SOMs correctly, then just that alone can do so many things.
You just need to be creative with them: https://diego.codes/post/som-tsp/
Something you really want to learn is dealing with sequence learning. Both from DL and other.
One of the keys to coming up with something new is just already knowing a bunch of stuff. Which is why you just need to learn all kinds of things (from DL and other stuff like SOMs).
Implement all of them and then try them out so you know the issues with each and also the different applications.
Then at some point, and this is key, you have to try out some new idea even if it seems dumb. You can't be afraid of failure or you won't be able to be creative.
A lot of the things I make go nowhere, but that's what it's like when you are in uncharted waters.
iron basalt
iron basalt
Then at some point, and this is key, you have to try out some new idea even if i...
Your new ideas will generally become more informed and eventually a lot of the ideas will work, but you then need to go the next step which is the "break through" that generalizes ideas from the previous ones and extracts the essence of those ideas and pushes them to the max.
*Or somehow involves not doing what any of those ideas had in common (going off in a different direction completely)
iron basalt
grave frost
Hmm...what about the more powerful stuff? 😉
And that is how you get the more powerful stuff.
 split spindle
hey guys, I'm trying to do a stock predictor and I kind of just followed a youtube video for it, however its giving me some problems with tensorflow, I'm not sure if any of you can help but if you can, that would be greatly appreciated https://paste.pythondiscord.com/ukarevakot.py
this is the error I get
 lapis sequoia
i'm just gonna buy data science from scratch 2nd edition
seems good
nice introduction into data science and ML
iron basalt
lapis sequoia
nice introduction into data science and ML
For ML I still recommend: https://www.amazon.com/Pattern-Recognition-Learning-Information-Statistics/dp/0387310738

Pattern Recognition and Machine Learning (Information Science and Statistics)
 inner basin
I need help using the seaborne library to graph a multiline line plot. Can anyone please help
iron basalt
That book assumes you know some math though. You will need linear algebra and calculus minimum.
It does a quick review on probability and such.
 novel acorn
Hello everyone, I have a little doubt with Pandas
I'm trying to merge two datasets (one where I have the customer ID for a kind of customer) and another where I have all the info of the year (including their customers ID).
I want to join/merge based on this Customer ID column because I want to create a model based on this kind of customer (called FF).
How can I do that join?
I'm trying to do a .merge using a left join and on id, but I'm not getting the info on the other dataframe
I mean, I want to filter the big datased based on the IDS of the little dataset
odd meteor
This should get the job done
df1.merge(df2, on = 'customer_ID', how ='left' )
But you said you've tried the same code and for some reason it didn't work, why not try 'outer' merge etc to see if gives what you need.
novel acorn
It's not working, my big dataset has 279k rows and the ids one has 3.7k rows
I wanna filter based on these ids and I tried just that code, but it didn't work 😦
data_2018.merge(ff_id, on="Account ID", how="left")
this is what I tried, even tried switching the order of the dfs and the how, but I'm just getting one or the other, not the data filtered
odd meteor
novel acorn
It's not working, my big dataset has 279k rows and the ids one has 3.7k rows
I ...
Merge can still work here. Since what you're interested in is AuB, Outer join should get the job done.
Another option is to use the conventional concatenate method on Pandas, only this time, you'll be concatenating both Dataframe row wise.
pd.concat([df1, df2], axis=0)
novel acorn
I'll try that, thank you!
novel acorn
lmao, already found why, the data gathering has some extra characters, but at least now I know why merge wasn't working hahahahhaa
novel acorn
Hey, so I have another doubt but this time with Pandas and how to modify some data:
I have this set of data in a column (serie):
0 0011I000009IHfbQAG
1 0011I00000FmN6lQAF
2 0011I00000FmN70QAF
3 0011I00000Fp4jbQAB
4 0011I00000Fpv4IQAR
I want to delete the last 3 letters/characters of each row. For example, for row 0 I want to delete QAG, for row 1 I want to delete QAF.
How can I do that? I tried splitting it as using lists but I would need a loop for that and iirc loops and dataframes are not a good match, which other way could I use?
For example, the way I thought was this: data_2018["Account ID"][0][:-3] and this was the result:
'0011I000009IHfbQAG' ----> '0011I000009IHfb'
But I'd have to loop through all the data which could take a long long time. Is there a more time-friendly way where no loops are involved?
serene scaffold
@novel acorn pretend the name of the column is col. You just do col.str[:-3]
And that will give you a new column where the last three characters of each string are sliced off.
novel acorn
my god, thank you so much, it worked
 charred umbra
does anyone here know anything about the Mish activation function?
serene scaffold
novel acorn
my god, thank you so much, it worked
you are welcome 💚
serene scaffold
charred umbra
does anyone here know anything about the Mish activation function?
if you have a question, try giving enough information that someone can start answering it right away. None of us know what you're trying to do about Mish activation functions yet.
charred umbra
serene scaffold
if you have a question, try giving enough information that someone can start ans...
Im only curious on its capabilities relative to swish and relu
proven sigil
Is there any causal discovery libraries available for python?
lone drum
My code this way
I want to remove rows which has time more than 15:28:00
Ping me when replying

This code is not giving me expected output
lone drum
Can anyone help me in this?
 ripe forge
lone drum
My code this way
I want to remove rows which has time more than `15:28:00`
Ping ...
ripe forge
lone drum
My code this way
I want to remove rows which has time more than `15:28:00`
Ping ...
You say remove rows with time "more than" that time, but you use inequality. That checks if time not equal to. Use greater than or less than comparison if you want to compare. Secondly, you're comparing against a string, instead of having a datetime object. That's going to be wrong too. You need to fix both issues, the datatype and the comparison
lone drum
ripe forge
You say remove rows with time "more than" that time, but you use inequality. Tha...
bnf_time_only column type is object
And
Same for nf_time_only
ripe forge
Yep, so convert them
Strings will not behave correctly for comparisons, if you want the meaning of time for comparison, then they need to be datetime
(well, to be fair, we sometimes "get away" with using strings because strings sort lexically ..(like alphabetically) and time formats end up being in sync with lexical sorts)
odd meteor
lone drum
My code this way
I want to remove rows which has time more than `15:28:00`
Ping ...
You'd have to first convert the date column from object type to datetime object. Then rewrite your code appropriately
sleek tapir
which machine learning course is the best
im willing to pay
if its good
pls dont say andrew ng
because it isnt
 gray shadow
lol i am doing andrew ng course right now, is it not good for beginners ?
upbeat prism
hi
what % of peak performance can I expect to get on my GPU when running e.g. pytorch?
loud cave
It depends on the model and data. Sometimes getting high utilization can be a challenge
lapis sequoia
Hi evryone, I'm on a text mining python project for some companies and I want to know (automatically in python) if each company have an official website. Any ideas how to do that ? Thank you 🙂
upbeat prism
loud cave
It depends on the model and data. Sometimes getting high utilization can be a ch...
so gettign 60% isn't suprising?It wouldn't surprise me on a "cpu cluster".
loud cave
upbeat prism
so gettign 60% isn't suprising?It wouldn't surprise me on a "cpu cluster".
Right, I wouldn't be surprised by 60%
upbeat prism
lapis sequoia
Hi evryone, I'm on a text mining python project for some companies and I want to...
You just want to collect text from the homepage? If so, use something like scrapy, a web crawler?
upbeat prism
loud cave
Right, I wouldn't be surprised by 60%
ok thanks. First time using cuda and I'm on arch - you never know if you fucked up any configs or whatever haha 😄
lapis sequoia
upbeat prism
You just want to collect text from the homepage? If so, use something like scrap...
yes, but I don't know yet the companies' websites (official).
that's what I want to find autmoatically. For example I want to find the official website of AIRBUS via Python
loud cave
I guess something like this would have what you want, but it looks like they want you to pay for it https://opencorporates.com/info/our-data/
lapis sequoia
Thnak you !
 lilac iris
whats a lightweight and fast ai library I can use? I was initially using pytorch but right now im trying out scikit-learn, but im open to other options
what my goal is to train a model on a dataset of some text and then generate similar text
loud cave
Probably deep learning is your best choice for that goal, I wouldn't consider pytorch or tensorflow to be lightweight but it is what it is
lilac iris
hmm, out of those deep learning libraries, which do you consider the (a) lightness of the actual library (b) speed at which library runs (c) easiest to implement
loud cave
For (A) I don't think either is very light. Probably similar in complexity. However tensorflow does subsume Keras which is decently simple to use. So for that reason I'd go with TF. For (B) it is probably hopelessly slow to use either one unless you have a GPU, and the power of your GPU is the main factor in determining speed. For (C) I'd say TF is easiest to implement throguh keras
lilac iris
hmm, im mainly going to be running off of cpu
loud cave
is using a cloud service like AWS/azure an option?
you could set up your model/data pipeline on CPU and test that everything works, then switch to a GPU instance to do the real training
lilac iris
loud cave
is using a cloud service like AWS/azure an option?
im fine on training on a gpu but it would be nice if i can run the model on a cpu
loud cave
Ah, I should have made that distinction. So you should be okay to just make predictions/generate text on a CPU after training it. That part isn't as expensive computationally
unless you need to generate tons and tons of output
lilac iris
nah its just generating a sentence or two
i guess ill check out keras, if i face any issues ill ask here
 median linden
lilac iris
im fine on training on a gpu but it would be nice if i can run the model on a cp...
median linden
lilac iris
im fine on training on a gpu but it would be nice if i can run the model on a cp...
Have you looked into tensorflow and google collab?
upbeat prism
so I currently train a neural network on my gpu, the input file is 8gb. somehwo the systems memory (16gb) is being used 100%. I can't see how anything would accumulate that much memory since trainign is an iterative process which doesn't use much memory.
I'm trying to figure out if it's normal for pytorch to use so much memory.
it seems the memory consumption is based on the input size, which I can't see. I mean sure, we send the memory to the GPU which of course needs system memory - but not 16gb.
So to sum it up: Assuming my DataSets and the other code isn't written in a bad way that just clutters the memory, what memory usage can I expect from pytroch when trained on cuda?
serene scaffold
upbeat prism
so I currently train a neural network on my gpu, the input file is 8gb. somehwo...
so you data is 8 GB, and your GPU has 16 GB. But how much memory does the network itself take up?
upbeat prism
serene scaffold
so you data is 8 GB, and your GPU has 16 GB. But how much memory does the networ...
My data is 8GB, my system mem is 16 GB, my GPU has 4 GB. I use HDF to read data from my file whereas I use the default driver (currently reading about the driver, I just assume it let's me buffer).
@serene scaffold No idea how much memory the network uses. What do you mean?
I trained it before on smaller data, I can't see why memory consumption would scale with input size.
serene scaffold
upbeat prism
<@!253696366952316929> No idea how much memory the network uses. What do you mea...
the weights of the network take up memory as well. But if you're doing this on the GPU, then 4 GB is how much memory you really have to work with.
have you confirmed that the computation is actually being done on the GPU?
upbeat prism
serene scaffold
the weights of the network take up memory as well. But if you're doing this on t...
- Of course, the GPU memory is fine. My issue is the system memory for some reason.
- No idea how much the weights take up, a few kb probably. It's ab unch of numbers no?
upbeat prism
serene scaffold
have you confirmed that the computation is actually being done on the GPU?
gpustat shows 60% workload
serene scaffold
hmm interesting
upbeat prism
also it simply is way faster
serene scaffold
I guess I'd have to see the code to guess  sorry I'm not being helpful here.
also, how much of your RAM were you using before? Because if you have the whole input file open, the rest of what your system is doing might be fighting for the other 50%.
upbeat prism
There is basically zero external load on my system. The system runs arch and I simply ssh into it. There isn't even a desktop environment. It literally does nothing other than training the network and the usual OS stuff 😄
I never run out of memory and the only difference is: I never used such a big input file. But the input size for the network doesn't change, I simply have way more measurements.
serene scaffold
are you telling me
you use arch ||btw||?
upbeat prism
yes why?
serene scaffold
it's a maymay
upbeat prism
What does maymay mean?
serene scaffold
meme but pronounced wrong
serene scaffold
 upbeat prism
but anyway, the issue should be with my code and probably how I feed my network stuff.
serene scaffold
||What we call Arch is actually GNU-Arch-Linux||
upbeat prism
ah yeah, gnu the weirdos with their cult leader
You know, even if HDF would read the whole file, I'd still not see how that should lead to 16gb of memory usage. hmm
What exactly happens when I send data to the GPU using pyTorch's tensor::to()? I guess it takes the data, sends it to the gpu and then clears the buffer/memory it allocated to send it?
serene scaffold
upbeat prism
What exactly happens when I send data to the GPU using pyTorch's tensor::to()? I...
sounds right to me. Once you move a tensor to the GPU, you can't do any calculations between it and a tensor on the CPU. But some handle has to remain on the CPU so that knowledge of it isn't lost to the interpreter.
upbeat prism
serene scaffold
sounds right to me. Once you move a tensor to the GPU, you can't do any calculat...
DO you have a link describing those "handles"? BUt in the end, I guess that'd just be some kind of map no. Nothing that uses that much memory.
Maybe I just do a stupid thing with python (I'm not very used to python).
odd meteor
sleek tapir
pls dont say andrew ng
Why do you think Andrew Ng course isn't? 😀
odd meteor
gray shadow
lol i am doing andrew ng course right now, is it not good for beginners ?
Keep at it, so long as it works for you. Not everyone particularly finds it interesting when they started their ML journey.
odd meteor
upbeat prism
so I currently train a neural network on my gpu, the input file is 8gb. somehwo...
I'm guessing your laptop is using Nvidia graphics card. Have you tried to leverage CUDA?
Not that I exactly have tried it, but it's also an option for people who's using Nvidia powered GPU.
My laptop uses Intel Iris XE GPU so I don't have first hand experience on how CUDA works 'cos I don't have Nvidia GPU.
My GPU however, performs better than most Nvidia GPUs (especially MX450)
lilac iris
loud cave
Probably deep learning is your best choice for that goal, I wouldn't consider py...
is scikit-learn not good for that?
upbeat prism
So I think my issue is with my Dataset/DataLoader. If I do this:
        # Get dataset containing training and evaluation data.
        train_eval_dataset = Dataset('../data/training_set.hdf5', device=device)

        # Make a 80/20 split for training/eval data
        k = len(train_eval_dataset)
        train_indices = np.arange(0, int(k * 0.8), dtype='int')
        eval_indices = np.arange(int(k * 0.8), k, dtype='int')
        TrainDS = torch.utils.data.Subset(train_eval_dataset, train_indices)
        EvalDS = torch.utils.data.Subset(train_eval_dataset, eval_indices)

        # Get Dataloaders
        TrainDL = torch.utils.data.DataLoader(TrainDS, batch_size=batch_size, shuffle=False)
        ValidDL = torch.utils.data.DataLoader(EvalDS, batch_size=batch_size, shuffle=False)

        print("START")
        for i in range(100):
            print("start: ", i)
            for i_batch, (samples, labels) in enumerate(TrainDL):
                pass
            print("stop: ", i)
        print("STOP")
it keeps on accumulating memory. In general I don't expect my reading of data to use that much memory but more importantly I don't see a reason it would keep on using memory even after the first iteration on the outer loop. Anyway, it basically means two things
1.) I don't understand the file driver of hdf5
2.) I do something wrong
It's probably both. So here's my Dataset class:
class Dataset(torch.utils.data.Dataset):
    def __init__(self, filename, device='cuda:0'):
        self.device = device

        # Init file
        self.file = h5py.File(filename, 'r')

        # Init first
        self.samples = self.file['samples']
        self.labels = self.file['samples_labels']

    def __len__(self):
        return len(self.samples)

    def __getitem__(self, i):
        sample = self.samples[i]
        label = self.labels[i]

        if label == 1:
            label = [1.0, 0.0]  # noise + signal
        else:
            label = [0.0, 1.0] # pure noise

        label = torch.tensor(label, device=self.device)
        sample = torch.tensor(sample, device=self.device)

        return sample.unsqueeze(0), label.unsqueeze(0)
Now I can't see anything obvious I would do wrong, like e.g. appending stuff to some variable over and over again. So I opened a python repl and tried:
import h5py

file = h5py.File(filename, 'r')
samples = file['samples']

>>> for i in range(100):
...     for i in range(len(samples)):
...             x = samples[i]
which is basically what the code above does. And this drains my memory. The question is: Why?
upbeat prism
odd meteor
I'm guessing your laptop is using Nvidia graphics card. Have you tried to levera...
Ye I use cuda, I don't train on the cpu 🙂
upbeat prism
lilac iris
what my goal is to train a model on a dataset of some text and then generate sim...
https://edu.epfl.ch/coursebook/en/deep-learning-for-natural-language-processing-EE-608 no idea if good, maybe that helps you. Sounds like you wanna do some nlp.
The Deep Learning for NLP course provides an overview of neural network based methods applied to text. The focus is on models particularly suited to the properties of human language, such as categorical, unbounded, and structured representations, and very large input and output vocabularies.
 boreal escarp
Hey if there is someone who understands French and who is good in python, can you pm ? Really need someone to help me understand my project thanks!
upbeat prism
I found the issue
it was, of course, a god damn f*** memory leak in the exact version I used.
serene scaffold
boreal escarp
Hey if there is someone who understands French and who is good in python, can yo...
There's not enough information here. Why do you need someone who knows French? What does "good at python" actually mean in terms of what you need that person to do?
boreal escarp
serene scaffold
There's not enough information here. Why do you need someone who knows French? W...
I need someone who knows French because my project is in French. Someone who is “good at python” because I am in an intro to python class who needs help with my project 😦
serene scaffold
boreal escarp
I need someone who knows French because my project is in French. Someone who is ...
You have to say what the project is about.
boreal escarp
serene scaffold
You have to say what the project is about.
Ohh it’s related to Conway’s game of life
serene scaffold
boreal escarp
Ohh it’s related to Conway’s game of life
Sounds off-topic for this channel. Try asking in a general help channel; see #❓|how-to-get-help.
Remember: give enough information so that people can start answering it right away. If they have to interview you to figure out what you need, they're likely to look past your question.
boreal escarp
Ohh okay thank you!
modest mulch
Hi, I've got a question, what's the difference between using RNN for time series training, and stacking the inputs up to lag k and training a standard MLP on them? Is it just the fact that when using RNN we don't need to specify the lag (aka how many time stamps we need to look back)?
So the rnn kinda learns this on its own?
@serene scaffold could you explain this to me mate?
 hybrid mica
I do not really understand the purpose of clustering. The computer program identifies the clusters, but what is the dependent variable?
 bold timber
When I apply this function into dataset as a df.text = df.text.apply(clean_data) whether I should use tokenizer=word_tokenize in the Pipeline too?
 lapis sequoia
hybrid mica
I do not really understand the purpose of clustering. The computer program ident...
lapis sequoia
hybrid mica
I do not really understand the purpose of clustering. The computer program ident...
It helps me to remember an example that perfectly represents the purpose behind clustering, which is market segmentation in a company that sells certain products. Most likely they will segment their customers according to parameters such as age, etc... offering different ads, discounts on products of interest etc... for each segment
bold timber
?
loud cave
hybrid mica
I do not really understand the purpose of clustering. The computer program ident...
It (usually) is an unsupervised learning method, which means that there isn't a dependent variable. Data points are grouped together based on similarity
You can use it for multiple purposes. You could use it for data exploration and finding patterns within a dataset. You could use it as part of feature representation. You could perform classification by assigning a point to a cluster, then using the majority class of the cluster as the classification, etc.
odd meteor
hybrid mica
I do not really understand the purpose of clustering. The computer program ident...
That's one of the major reasons why clustering algorithms is categorised as Unsupervised Learning.
When your dataset doesn't have a label (a.k.a dependent variable) == It falls under Unsupervised Learning.
Now let me give you an example.
Imagine, you're organising end of the year party in your company, and a secret santa volunteered to provide free customized Tees for all employees and employers as well.
Now, the secret santa kept to his words and shipped the Tees to your office. But he didn't categorically state how many sizes that are available.
Bear in mind, Tees sizes can range from S, M, L, XL, XXL etc...
Now, in this kinda scenario, how would you easily tell how many sizes of Tees that's available? Of course without having to start sorting them one after the other (the essence of ML is to make our life easier and not to make our job such a drudge right?)
So here, the algorithm you'd use to really get a quick look on how many sizes of Tees therein would be any of your favourite Clustering algorithms (KMeans, DBSCAN, Agglomerative Hierarchical Clustering + Dendrogram, t-SNE, etc)
After applying clustering algorithm, you'll be able to know how many clusters of Tee sizes that secret Santa produced.
Ohh, Tee = 👚
lapis sequoia
Hello I have a use case and I wonder if you could show a bit of light regarding the algorithm that would fit to showcase the problem solving since I'm relatively new to ML. The use case is referee assignment to matches taking into account different features like availability, hometown, etc... I was thinking about Reinforcement Learning, but I think that a Supervised Learning algorithm could work as well since I have the expected output from several datasets. Any existing model/algorithm that would be ideal for this?
loud cave
lapis sequoia
Hello I have a use case and I wonder if you could show a bit of light regarding ...
Collaborative filtering might be appropriate. It's used a lot in recommendation systems
I guess you could also just use an optimization method like linear programming, depending on how you are able to formulate the problem
sleek tapir
odd meteor
Why do you think Andrew Ng course isn't? 😀
andrew ngs course have a lot of problems most notablythe math there is too simplified to my liking
im a stats/cs major
lapis sequoia
loud cave
I guess you could also just use an optimization method like linear programming, ...
Yeah I saw heuristic optimization algorithms as well which might be interesting
loud cave
There's also an algorithm called belief propagation that is good at solving bipartite graph matching problems, which is another formulation you might be able to use
How many referees are required per match?
Is it just one to one or multple per match?
odd meteor
sleek tapir
andrew ngs course have a lot of problems most notablythe math there is too simpl...
Oh, you'd rather the math therein are more complex / more intense bearing in mind the targeted audience aren't exactly PhD fellows ? 😀 😂
Well, I have a couple of friends who 💯 love and understand Andrew Ng's course when they first started learning ML. My experience was entirely different.
I have a major in Statistics myself, and I can't say I 100% find Andrew Ng's course so interesting when I started. Not because the math was too simple or anything (even, there's little maths there... It's mostly Statistical equations that are plenty there) but because he was using Octave to code and I wasn't interested in deviating from Python. Oh and I struggled to understand some concepts as well (He won't fail to remind you not to worry if you don't understand what he's teaching 😂😂)
I usually tell people that's trying to get into Data Science this, "there's no shame in dropping any material that doesn't work for you"
I dropped Andrew Ng's ML course and moved to Udemy. And I never regretted that decision.
PS: Andrew Ng's ML course is a great course for beginners. But not every beginner will find it interesting. You'd however later come to appreciate the course after you've become more comfortable in ML 😃
 sleek tapir
odd meteor
Oh, you'd rather the math therein are more complex / more intense bearing in min...
sleek tapir
odd meteor
Oh, you'd rather the math therein are more complex / more intense bearing in min...
tats a problem if u do stats u will like wtf is this course
loud cave
i think machine learning overall is less rigorous/principled than statistics
odd meteor
loud cave
i think machine learning overall is less rigorous/principled than statistics
I agree with you.
Also, we have libraries and frameworks like scikit-learn, scipy, TensorFlow etc that makes our life easier...
If not... 😂 😂
Imagine coding everything from scratch without using all those libraries and framework.
lapis sequoia
loud cave
There's also an algorithm called belief propagation that is good at solving bipa...
Two referees per match
loud cave
lapis sequoia
Two referees per match
I think linear programming would be a fine way to solve it. Can you think of a function that could represent how well suited a referee is for a match?
lapis sequoia
I barely know the features that I will have since they didn't provide the datasets yet. Maybe once I have the data that I will be working on I'm able to define a function. For now I'm just guessing...😅
bold timber
bold timber
When I apply this function into dataset as a df.text = df.text.apply(clean_data)...
anyone can help me about this?
lapis sequoia
Thank you very much btw, I will probably head back to u once I have the data which might be more convenient instead of just guessing
sleek tapir
odd meteor
I agree with you.
Also, we have libraries and frameworks like scikit-learn, sc...
is macbook intel i5 enough for ml
thinking of getting a new pc
as well
note im a student
as well
doing math/cs
so tensorflow is probably beyond me at this point
loud cave
lapis sequoia
Thank you very much btw, I will probably head back to u once I have the data whi...
I would have to check a reference to know the exact formulation. But the basic idea is that you will have a set of 'decision variables', 'x_ij that can be either 0 or 1, and those represent the assignment of a referee to a game. So you will have one decision variable per referee per game.
You will also have a cost or score associated with each decision variable. c*x_ij. This is the suitability function I asked above, evaluated for each referee and for each game.
The objective is to maximize (or minimize) the score, subject to the constraints that (1) a referee can only be assigned to one match and (2) each match must have exactly two referees.
If you wanted to get an early start on an implementation, you could use scipy https://docs.scipy.org/doc/scipy/reference/generated/scipy.optimize.linprog.html
odd meteor
sleek tapir
is macbook intel i5 enough for ml
I'm not a Mac guy. I love my Windows regardless (I know some people will smirk but idc lol)
Okay, Idk the properties of your Mac. But any PC with at least 8GB Ram is good to go. If your PC has a GPU, then that's even gonna be more sweet.
sleek tapir
o i thought u guys need a lot of power and memory for ml
odd meteor
sleek tapir
o i thought u guys need a lot of power and memory for ml
The higher the compute power of your PC the better your ML experience.
sleek tapir
its not important for UG student
is research thesis important in ds btw
back to the pt which ml course do u recommend
tats offers you the code
obviously but its mathematical in nature
not to the point of ESLII or CS229
devout sail
Hey, is there a way in matplotlib to plot a line but have discrete data points in the X axis?
For example I have 0.1, 1, 10, but I don't want it to scale
loud cave
would a bar chart or histogram work?
devout sail
Hmm a bar chart might be ok, but I'm wondering if I can keep it as a line
loud cave
sleek tapir
o i thought u guys need a lot of power and memory for ml
there are low memory/compute methods that you can use. but for stuff like deep learning you pretty much have to have a gpu and to do heavy stuff you need multiple/very expensive ones
odd meteor
The minimum PC requirement I'll recommend is 8GB Ram, but if you can afford a 16GB or 32GB Ram Pc, that's perfect!
If your pocket tells you the truth and you decide to take it a notch higher, then ensure your new PC has a graphics card (GPU). Currently, Nvidia's GPU is many people's favourite in ML ecosystem - - probably because of the possibility CUDA affords its users.
PS: My Laptop uses Iris XE GPU and I'm fine with it.
loud cave
with vowpal wabbit you can train with cpu on billion scale data
loud cave
it also depends on the size of the data
sleek tapir
got it in primary school
so i need to calculate
i want to build one next yr
still ahve 2 yrs of uni to go
loud cave
mine last a long time. i still have a desktop pc i got as an undergraduate back in 2007
sleek tapir
loud cave
mine last a long time. i still have a desktop pc i got as an undergraduate back ...
r u still using it
for ur ds work
loud cave
nope. i bought a used gaming laptop and i use that now. because it has nvidia gpu
devout sail
loud cave
would a bar chart or histogram work?
How would I do it with a bar chart? since it still scales if I just throw in the numbers
loud cave
devout sail
How would I do it with a bar chart? since it still scales if I just throw in the...
I was thinking of vertical bars. So the horizontal spacing is uniform and the height of the bars is the 'y' value, right?
loud cave
lilac iris
is scikit-learn not good for that?
Probably not for text generation. I guess it depends on the specifics but as far as I know deep learning is the best performing method for that
sleek tapir
is cs50ai a good course
boreal loom
I have an issue and I think I have hit the maximum of my knowledge. I am at a Kaggle competition on recognizing 40k images of 80 different foods. I have scored a 73% by using a Dense201 and retraining it from the start and then ensembling 5 of them to reach it. The first team is at 79% but i have no idea how they do it. I am using keras image datagen to augment my images and perform a 20% split on my set. Added a global average2d pooling layer before my Relu. No matter what I do, my model starts overfiting hard at 69%, every time, tried resnet, still the same, tried vgg, the same, anyone have any tips
Or anyone familiar with image recognition who can maybe give a hand as to how i can get unstuck
 inland zephyr
I have few question about pandas replace a nan with certain value. I have calculate the median of each pax age and want to fill the nan age with that data


When i using pd.query syntax to replace the nan:
train.query("(Sex=='male') and (Survived == 0)")['Age'].replace(np.nan,29)
train.query("(Sex== 'male') and (Survived == 1)")['Age'].replace(np.nan,28)
train.query("(Sex=='female') and (Survived == 0)")['Age'].replace(np.nan,24.5)
train.query("(Sex=='female') and (Survived == 1)")['Age'].replace(np.nan,28)
it never change the nan and still exist
boreal loom
train.query("(Sex=='male') and (Survived == 0)")['Age'].replace(np.nan,29, inplace =True) @inland zephyr
loud cave
boreal loom
I have an issue and I think I have hit the maximum of my knowledge. I am at a Ka...
Did you try changing parameters like learning rate, batch size, etc? How about regularization?
boreal loom
Most of these networks have batch norm already built in
inland zephyr
boreal loom
```train.query("(Sex=='male') and (Survived == 0)")['Age'].replace(np.nan,29, in...
still the same, and giving SettingWithCopyWarning
boreal loom
Learning rate i have played around with, but it should not have that much of an impact
Use loc @inland zephyr
I think its because your query is a tad confusing
Give this a try, maybe it will help pd.options.mode.chained_assignment = None
I think loc will solve it though
It has to do with how pandas operate by creating views or copies
And it gets confused when you do it the way you do
inland zephyr
nvm
i got it
train.loc[((train["Sex"]=="male") & (train["Survived"] == 0)& np.isnan(train["Age"])),'Age']=29
rigid zodiac
What did i do to deserve this tag????
lapis sequoia
rigid zodiac
What did i do to deserve this tag????
lol, do you know howt o use matplotlib.animate?
rigid zodiac
You know, you are not suppose to tag ppl that is not online man. Idk have you try stack overflow yet??? I didnt do anything with animate yet
lapis sequoia
ight sounds good
 red hornet
any chance someone knows how to perform an additive gaussian mutation? The closest thing I can find is a shrink mutation, so I'm gonna try and implement my own version of that for now
but if anyone knows anything I'll take whatever advice I can get :D
odd meteor
boreal loom
I have an issue and I think I have hit the maximum of my knowledge. I am at a Ka...
Find out if model stacking is a thing in deep neural nets (I'm guessing it is... I've not done it yet but try to see if it's a possibility)... If pretrained model is available and allowed in the Competition, then try using that to improve your accuracy score.
arctic wedgeBOT
@hearty bloom Please don't try to ping @everyone or @here. Your message has been removed. If you believe this was a mistake, please let staff know!
 devout knot
does anyone know how one would do EDA for a set of images with masks?
Some details:
-I have 14k 512x512 RGB .jpgs
-each with a corresponding 512x512 grayscale .png mask which are the annotations (or targets in this case I suppose)
I want to be able to answer questions like - what percentage of each photo belongs to each class. Would I just process each of the grayscale images for where pixel values are 1 (scaled down from 255), sum that up for each photo and divide by the total pixel area of the dataset?
These tasks are in support of an instance segmentation project -- classifying each pixel of an image as belonging to mask class or not. I'm having a hard time finding resources for this kind of application.
lone drum
Hello
I am trying to get last Wednesday of a month based on current date
My code in else block

My current output
I am getting previous month last Wednesday but I want current month last Wednesday

Ping me when replying
 keen forum
lone drum
My code in else block
keen forum
lone drum
My code in else block
Use Winkey+G/Print Screen/Snipping tool or just post the source in a code block with ```your code here```
Hey guys, I'm looking for GPU acceleration for some sparse linear algebra - what resources would you recommend?
iron basalt
keen forum
Hey guys, I'm looking for GPU acceleration for some sparse linear algebra - what...
Sparse x Dense, Dense x Sparse, Sparse x Sparse?
keen forum
iron basalt
Sparse x Dense, Dense x Sparse, Sparse x Sparse?
Sparse x Dense, most likely
My application is I'm trying to do a big spring mass simulation. So, many (~10^6) particles connected with springs represented by an adjacency matrix - I'm hoping that I can do something a bit more clever than iterating over individual edges and summing forces like this.
iron basalt
This is not so much of an ML question as it is simulation. You are better off doing the entire algorithm on the GPU by writing custom shaders.
Are you trying to plot a graph / network via a spring mass simulation?
keen forum
iron basalt
Are you trying to plot a graph / network via a spring mass simulation?
I'm not trying to plot anything just yet, right now I'm just trying to get timesteps in my simulation faster by using a GPU.
The final goal is to compute displacement of the particles from their starting point and then this will be rendered, but I can do this just using blender.
iron basalt
You could try using pytorch's tensors. While it's meant for ML you can just use it for whatever linear algebra.
But the fast solution involves just a bunch of custom shader code.
keen forum
iron basalt
But the fast solution involves just a bunch of custom shader code.
Do you have any specific recommendations for this?
lone drum
!pastebin
arctic wedgeBOT
Pasting large amounts of code
If your code is too long to fit in a codeblock in discord, you can paste your code here:
https://paste.pythondiscord.com/
After pasting your code, save it by clicking the floppy disk icon in the top right, or by typing ctrl + S. After doing that, the URL should change. Copy the URL and post it here so others can see it.
lone drum
My code https://paste.pythondiscord.com/cicaceroqe.py @keen forum please xheck
iron basalt
Since you are not actually displaying any graphics and only computing you just want some compute shaders. If you have an Nvidia GPU, pycuda or pyopencl. If you have an AMD GPU or other, pyopencl (also works on CPU). Other options exist such as Kompute.
keen forum
Yep, yep. Give me a second.
lone drum
Just ping me when u reply
keen forum
iron basalt
Since you are not actually displaying any graphics and only computing you just w...
Okay, this is great thanks. Hopefully I'll have a nice lovely render that I can show - it involves "hearing the homology" of a manifold - weird stuff.
lone drum
I have a dataframe in which i have dates. I want to take each date from nf_date column and get last thursday of that month if last thursday date is not present in nf_date column then take last wednesday date (which is previous of last thursday) of that month. After getting the last thursday or wednesday date i want to append that date in current dataframe in new column name expiry. @keen forum please check this also
iron basalt
(pyopencl was designed to be like pycuda, so if you learn either you can learn the other)
keen forum
lone drum
I have a dataframe in which i have dates. I want to take each date from nf_date ...
Lol, pick one.
 inner pebble
Hi friends,
I m blocked since 30mn on something, can't believe I can't find the solution.
Pandas: let s say 2 columns 300 lines,
One column : Name
One column: Description
50 unique names values, different descriptions for each.
I d like to groupby names and add in a new columns a string that mentions all the descriptions found for a name reference
Can t succeed doing this easily.
Have to loop and join and .copy and stuff.
I am pretty sure there s a pandas method to do it or something light
Could you please help?
hybrid mica
where can i find datasets to practice machine learning regression/classification?

 polar acorn
hybrid mica
where can i find datasets to practice machine learning regression/classification...
polar acorn
hybrid mica
where can i find datasets to practice machine learning regression/classification...
kaggle?
polar acorn
 warped rapids
Like this
polar acorn
inner pebble
Hi friends,
I m blocked since 30mn on something, can't believe I can't find the ...
warped rapids
Like this
polar acorn
inner pebble
Hi friends,
I m blocked since 30mn on something, can't believe I can't find the ...
Not entirely sure what you mean but something like this maybe?
df = pd.DataFrame({'name': ["a", "b", "a"], 'descr': ["div", "random", "text"]})
s = df.groupby("name")["descr"].apply(lambda x: " ".join(x))
df["all_descr"]  = s[df.name].values
Yes, but if I now use that, it gets rid of my parabolic line
Without vlines

With vlines
 polar acorn
Look at your y coordinates here. You can still see the curve its just tiny and at the bottom in the second plot. Set y min and max accordingly in your vlines.
polar acorn
Can you paste your code?
warped rapids
Yes
        mae_fused = float(mae_fused)
        mae_fused = (mae_fused / 100)
        n = (331796 * mae_fused) / 10
        u = p * n
        o = math.sqrt(u * (1-p) * p)
        o = int(o)
        x = np.linspace(u - 3*o, u + 3*o)
        # plt.clf()
        # plt.xlabel('X axis represents the value', color='pink')
        # plt.ylabel('Y axis represents the frequency', color='pink')
        # plt.title('Mae', color='pink')
        # plt.xticks(np.arange(min(x), max(x+1), o))
        # plt.plot(x, stats.norm.pdf(x, u, o), color='pink')
        fig, (ax1) = plt.subplots(1)
        fig.suptitle('Mae', color='white')
        ax1.spines['bottom'].set_color('white')
        ax1.spines['top'].set_color('white')
        ax1.spines['right'].set_color('white')
        ax1.spines['left'].set_color('white')
        ax1.tick_params(axis='x', colors='white')
        ax1.tick_params(axis='y', colors='white')
        ax1.vlines(x, u, u, colors='white', linestyles='solid')
        ax1.plot(x, stats.norm.pdf(x, u, o), color='pink')
        plt.savefig('static/images/reclaimMae/plot' + str(i) + '.png', transparent=True)
return render_template('index.html' , urlShow='static/images/reclaimMae/plot' + str(i) + '.png')```Any idea?
 mighty spoke
Hi how do I find the corresponding x value from a data frame given a y value?
polar acorn
warped rapids
Yes
Yes as i said, the y_min and y_max for the v lines are wrong. This line ax1.vlines(x, u, u, colors='white', linestyles='solid') Should be replaced with something like this ax1.vlines(x, 0, 0.002, colors='white', linestyles='solid').
I found 0.002 by looking at this plot ax1.plot(x, stats.norm.pdf(x, u, o), color='pink') and noting the largest and smallest y values.
polar acorn
Ah I see now, hold on
 polar acorn
In that case you should use ax1.vlines(x, 0, stats.norm.pdf(x, u, o), colors='white', linestyles='solid')
warped rapids
I see
polar acorn
The number of lines are controlled by your x variable. If you want fewer lines replace it with a list with fewer x coordinates.
warped rapids
The number of lines should correspondent with the x values
I will try something
Hmm I thought of replacing the x variable with the o variable

It's now putting lines at every plot i think
lapis sequoia
Hey guys!! Can someone help me in how can I plot such a graph?

I Used matplotlib, line graph and did the fill. That looks like this.
 serene scaffold
lapis sequoia
Hey guys!! Can someone help me in how can I plot such a graph?
serene scaffold
lapis sequoia
Hey guys!! Can someone help me in how can I plot such a graph?
The Python Graph Gallery
A collection of stacked area chart examples made with Python, coming with explanation and reproducible code
lapis sequoia
serene scaffold
https://www.python-graph-gallery.com/stacked-area-plot/
Perfect!!! this is exactly what i was looking for. Thanks so much!! 🙂 cheers man!
 fast pawn
guys, i'm data science fresher. and I have been trying out some projects on my own. And whatever I do, I'm always getting terrible RMSE or even r2 and even accuracy. Should i put those in my resume or just hide em?
loud cave
why do you think the evaluation measures are terrible?
 loud cave
what do you mean by show the points?
 topaz spruce
show x in x axis
 teal mortar
a stupid question, can a string for example 'BC 350' parsed into pandas datetime format?
topaz spruce
loud cave
what do you mean by show the points?
[ -0.88, 0.12, 0.92, 1.62, 2.62, 3.72, 4.72, 6.02, 7.62
for example these are x values
these should show up in the x axis
loud cave
You want to restrict the range of the x axis to those points? or you want them to be marked on the axis?
topaz spruce
mark them on x axis
warped rapids
Any idea on how to fix floating plot?
 lone drum
hello my code https://paste.pythondiscord.com/haqohoguba.lua here
i am appending a value to dataframe but i am not getting an expected output as i want
can anyone look into this
I have a dataframe in which i have dates. I want to take each date from nf_date column and get last thursday of that month if last thursday date is not present in nf_date column then take last wednesday date (which is previous of last thursday) of that month. After getting the last thursday or wednesday date i want to append that date in current dataframe in new column name expiry.
ping me when replying
in my dataframe i am getting last month output in first month
when i use break statement then it worked fine
but for one year data i am getting last month date as entire year date
my code checks if last thursday date is present in my data then it takes that date otherwise it takes last wednesday which previous of last thursday date is will take
but when i check for single month data then it work fine nut for one year data it takes last year date as one year date
fast pawn
loud cave
why do you think the evaluation measures are terrible?
I tired to predict the next 5min closing price of stock using sentimental analysis of a news headline and all metrics were just horrible, with high RMSE, negative r2.
warped rapids
warped rapids
Any idea on how to fix floating plot?
Anyone any idea?
rigid zodiac
Hi everyone, Have yall try to combine the image into a big mess yet? if so, can you teach me ? (PS: I have 5863 images that I want to combine it into one big file)
warped rapids
warped rapids
Anyone any idea?
Fixed it
lone drum
lone drum
hello my code https://paste.pythondiscord.com/haqohoguba.lua here
hello stelercus i need small help , can u please look into above issue ? actually i tried my best to solve but need some assistance in it
serene scaffold
@lone drum can you put the CSV of the data in the paste bin?
lone drum
serene scaffold
<@!680099760836968475> can you put the CSV of the data in the paste bin?
actually csv file is too large
serene scaffold
lone drum
actually csv file is too large
just post enough rows so that I can replicate the problem and solve it
lone drum
serene scaffold
just post enough rows so that I can replicate the problem and solve it
sure just give me a min
lone drum
serene scaffold
<@!680099760836968475> can you put the CSV of the data in the paste bin?
https://paste.pythondiscord.com/toguzolepa.apache please check csv data here
serene scaffold
lone drum
https://paste.pythondiscord.com/toguzolepa.apache please check csv data here
CSV means comma-separated values. This data isn't consistently delimited.
So, I can't use it without manually adding commas.
lone drum
wait i share u csv with small amount of rows
serene scaffold
lone drum
wait i share u csv with small amount of rows
what you posted is fine except that it's not consistently delimited.
using to_csv would accomplish this.
As I'm at work, I can wait up to two more minutes for the data in a usable format.
upbeat prism
How do you call the dataset which gets split into train and validation set?
serene scaffold
@lone drum sorry one moment
upbeat prism
I don't wanna call it measurements or samples.
lone drum
sure ping me when u back @serene scaffold
 potent cairn
hello, im trying to apply sklearn's GridsearchCV on a KNN classifier, with different parameters
i cant for the life of me figure out how to make a scorer that will choose the best parameters based on the best average f1 score
anyone able to help?

this is what im working with so far
serene scaffold
@lone drum
In [69]: pd.concat({'year': df['bnf_datetime'].dt.year, 'month': df['bnf_datetime'].dt.month, 'weekday': df['bnf_datetime'].dt.weekday}, axis=1).drop_duplicates(subset=['month', 'year'], keep='last')
Out[69]:
      year  month  weekday
0     2018      5        3
133   2018      6        6
505   2018      7        1
710   2018      8        4
772   2018      9        0
2904  2018      3        1
there would be a bit more to it, actually
lone drum
okay
serene scaffold
the goal is to organize the data so that you have the year, month, and weekday, sorted by time
and then you drop duplicate (year, month) rows, keeping whichever one comes last for weekday.
lone drum
see i want to get last thursday date of month and check it in current month or not if it does not exisys then it will check for last wednesday of month near to last thursday
i want to get that date and apppend to last column which will be new column as expiry
do u get my point ? @serene scaffold
serene scaffold
@lone drum is it really possible to truly know the mind of another?
lone drum
serene scaffold
<@680099760836968475> is it really possible to truly know the mind of another?
means ?
upbeat prism
What's a good name for a class to hold functions like train() evaluate() and other functions that are used in your training loo (loop over epochs).
Maybe:
NeuralModel::NeuralNetwork
NeuralModel::train()
NeuralModel::evaluate()
NeuralModel::getState()
NeuralModel::setState()
?
bit of an abuse of the term model though isnt it
serene scaffold
upbeat prism
What's a good name for a class to hold functions like train() evaluate() and oth...
are you talking about a class or a module?
you don't really make getters and setters in Python.
upbeat prism
serene scaffold
are you talking about a class or a module?
class, module is stand alone no? I don't want to share my code.
lone drum
serene scaffold
<@680099760836968475> is it really possible to truly know the mind of another?
hi stelercus can u please clear the point what u are trying to say ?
serene scaffold
upbeat prism
class, module is stand alone no? I don't want to share my code.
don't want to share your code in what sense
upbeat prism
serene scaffold
don't want to share your code in what sense
it's simpyl inteded to work in the given enivornment and not in some other project.
serene scaffold
lone drum
hi stelercus can u please clear the point what u are trying to say ?
I was making a facetious joke.
upbeat prism
I put classes into files becuase I hate 2k lines in a file.
upbeat prism
serene scaffold
I was making a facetious joke.
Was that one of your maymayies?
serene scaffold
upbeat prism
Was that one of your maymayies?
no
lone drum
serene scaffold
I was making a facetious joke.
can u please look into my issue also ?
serene scaffold
upbeat prism
Maybe:
NeuralModel::NeuralNetwork
NeuralModel::train()
NeuralModel::evaluate()
...
if I make a module that is just a container for one class, I usually name it a lower_camel_case verison of the name of the class
NeuralModel -> neural_model.py
upbeat prism
serene scaffold
if I make a module that is just a container for one class, I usually name it a l...
I didn't mean naming convention, that's another topic. Just a name for a class that looks like this
NeuralModel::NeuralNetwork
NeuralModel::train()
NeuralModel::evaluate()
NeuralModel::getState()
NeuralModel::setState()
or something similar (I know, no getters and setters in python, it's just habit)
serene scaffold
upbeat prism
I didn't mean naming convention, that's another topic. Just a name for a class t...
getters and setters cause me to foam at the mouth
serene scaffold
lone drum
can u please look into my issue also ?
still working on it
lone drum
serene scaffold
still working on it
okay just ping me
upbeat prism
serene scaffold
getters and setters cause me to foam at the mouth
I suggest you go to a doctor 😮
lone drum
but do u get my point ? what i am trying to do ?
u can get from if else condition also
 honest crag
hello I would like to create a correlation circle and I would like to know if you would have any indications to give me so that I can filter the display according to a minimal cosine in order not to overload my correlation circle
serene scaffold
lone drum
okay just ping me
In [71]: date = df['bnf_datetime']

In [73]: days = pd.concat({'month': date.dt.month, 'day': date.dt.weekday}, axis=1)
Out[73]:
      month  day
0         5    3
1         6    6
2         6    6
3         6    6
4         6    6
...     ...  ...
2900      3    0
2901      3    0
2902      3    1
2903      3    1
2904      3    1

[2905 rows x 2 columns]

In [74]: wed, thurs = 2, 3

In [77]: desired = days[days['day'].isin((wed, thurs))].drop_duplicates(keep='last')
Out[77]:
      month  day
0         5    3
1922      3    2
2167      3    3

In [79]: df.loc[desired.index]
this keeps the last Thursday or Wednesday (whichever comes last) in a given month.
lone drum
see i want to take last thursday date and chek wether that date is exists in current data or not otherwise it will take previous day which is wednesday
serene scaffold
lone drum
see i want to take last thursday date and chek wether that date is exists in cur...
this already does that.
it doesn't keep Thursdays that aren't there because they, well, are not there.
lone drum
serene scaffold
this already does that.
can u make one column at end expiry to check which date it shows
serene scaffold
lone drum
can u make one column at end `expiry` to check which date it shows
you just have to modify days = pd.concat({'month': date.dt.month, 'day': date.dt.weekday}, axis=1) to include expiry: ... in the dict.
upbeat prism
I think I go with this "layout"
Any criticism?
from torch import nn

from src.neuralModel import neuralModel

class NeuralNetwork():
    def __init__(self, loss_fn, optimizer, TrainDL, EvalDL, weights = None):
        self.model = neuralModel(weights)
        self.loss_fn = loss_fn
        self.optimizer = optimizer

    def train():
        pass

    def evaluate():
        pass
if neuralModel is a class, you might want to name it NeuralModel.
what is NeuralNetwork as compared to neuralModel? And why did you import torch.nn?
also, having train as a method of the network/model is fine, but the function that evaluates a model is usually separate.
upbeat prism
the class is called NeuralModel that's just a typo.
the import torch.nn is there because I did somethign idfferent. can be ignored.
serene scaffold
you evaluate it in terms of its predictions. I don't see a predict method here.
upbeat prism
serene scaffold
you evaluate it in terms of its predictions. I don't see a predict method here.
self.model(input data) will give you a prediction. That's just pyTorch. I figured I could just basically do that:
Network = NeuralNetwork(pass stuff)
y_pred = Network.model(inputs)
I mean, I could add a method with a better name and just pass the inputs around.
True, you could argument that evaluation isn't part of a neural network. I could make a evaluator class for that.
from torch import nn

class NeuralNetwork(nn.Module):
    def __init__(self, weights = None):
        super().__init__()
        pass

    def forward(self, inputs):
        pass
the evaluator doesn't necessarily need to be a class. evaluators are often functions.
if you want to be consistent with the sklearn api, there's usually a predict method.
upbeat prism
serene scaffold
the evaluator doesn't necessarily need to be a class. evaluators are often funct...
That's not an argument against it though. I try to make my main file as minimal as possible. I dislike it having 1k lines+.
Why do I want to be consistent with sklern api? Does it follow some standard?
serene scaffold
upbeat prism
That's not an argument against it though. I try to make my main file as minimal ...
if you want your main file to be as minimal as possible, that's an argument against making the evaluator a class. Keep in mind that I am using the Python definition of "class". I am not referring to modules.
Whether or not you want to be consistent with the sklearn api is up to you. I'm reading a book about pytorch currently and am learning the conventions there.
upbeat prism
let me quickly google so we actually talk about the same thing
serene scaffold
a class is something that you can make instances of and a module is basically a .py file.
Java, for example, conflates classes and modules.
Python does not.
upbeat prism
@serene scaffold Do people make modules that contain functions?
serene scaffold
upbeat prism
<@!253696366952316929> Do people make modules that contain functions?
yes
upbeat prism
but in general I meant that i make a file called Evaluator.py and put my evluation coe inside it. In this case, that might be in deed a function only (or several)
serene scaffold
strictly speaking, every single function in all of Python is in a module.
@upbeat prism here's a module I made with four different evaluators. (a folder with modules in it is also a module. ) https://github.com/swfarnsworth/bratlib/tree/v1.0.0/bratlib/calculators
GitHub
Parsing and representation of annotated corpora for natural language processing in the BRAT format. - bratlib/bratlib/calculators at v1.0.0 · swfarnsworth/bratlib
upbeat prism
Yeah so my main goal is to just give it structure. Use OOP features if it somehow helps me and use files to orgnaize things. Simply because I don't want to have 10 classes 500 functions in one file.
 arctic dawn
serene scaffold
<@!211756283584446475> here's a module I made with four different evaluators. (a...
arctic dawn
serene scaffold
<@!211756283584446475> here's a module I made with four different evaluators. (a...
aight mate he looks like you
serene scaffold
arctic dawn
aight mate he looks like you
he is/I am
serene scaffold
upbeat prism
Yeah so my main goal is to just give it structure. Use OOP features if it someho...
OOP isn't the only way to achieve DRYness
upbeat prism
serene scaffold
OOP isn't the only way to achieve DRYness
ah thanks, I was just thinking of how the hell it was called.
Yeah of course, I actually try to not use OOP if I don't actually need objects. In fact think what I do is already a bit too much.
Anyway, I'll iterate over the code from time to time and improve it to meet better standards. I still lack a lot of "how to python" knowledge.
thanks for the input
serene scaffold
upbeat prism
thanks for the input
you are welcome 💚
upbeat prism
So while for some things I do, like my DataSets, OOP actually makes sense (I store a state, provide an iterator yada yada), the same isn't really true for training/evaluation.
So I guess it would be more correct to make a module train.py, evaluate.py which just contain the functions and a module with a class neuralNetwork.py and use those inside my main file.
Does that sound okay? Is there a styleguide for such things?
serene scaffold
upbeat prism
So while for some things I do, like my DataSets, OOP actually makes sense (I sto...
I'm not really sure. I would do whatever makes the most sense to you, keeping in mind things like source control
upbeat prism
serene scaffold
I'm not really sure. I would do whatever makes the most sense to you, keeping in...
But ok, thanks.
And another question. Sometimes your training will suck and it won't do much for some time and then get better and probably after some times it'll get worse. Now how many epochs should one wait for improvement before accepting that the current way is maybe the wrong way?
rigid zodiac
Hi Everyone, I'm working on combine all of the image array into one big array within For -loop. However, It keep turn into list for some reason.
loud cave
you want numpy arrays instead?
rigid zodiac
yes, I have like 5k image in a folder. I can create a loop to convert it into array. But i just cant combine it
loud cave
maybe better to use methods likenp.vstack or np.concat
rigid zodiac
within a loop?
loud cave
you may be able to replace the loop with one of those methods
rigid zodiac
but without a loop, I cant figure out how to convert all those image into array
loud cave
Can you share a snippet of code?
serene scaffold
unless you have a specific variable for every array you want to concatenate, they must exist in an iterable of some kind, and you should be able to pass that to one of the two functions.
rigid zodiac
serene scaffold
unless you have a specific variable for every array you want to concatenate, the...
for 1 image its dimension is (288,432,3)
I understand that layer will change. Just like the mnist data, but idk how
loud cave
In that snippet x_train is a list. When you call x_train.extend(df) it adds every element of df to x_train. I'm not sure what happens when you call list extend with a numpy array but it probably converts it to a list first.
serene scaffold
loud cave
In that snippet x_train is a list. When you call `x_train.extend(df)` it adds ev...
they define x_train as []
rigid zodiac
loud cave
In that snippet x_train is a list. When you call `x_train.extend(df)` it adds ev...
then just np.asarray right? I just tweet it a bit and it has (1457856,432,3)
loud cave
I guess you could change that line to x_train.append(df). Then after the loop x_Train will be a list of arrays. You could convert it to an array of arrays with x_train = np.array(x_train). Or try vstack/concat as referenced above
rigid zodiac
holy shit, it must be it then.... Man yall are the best. thank you so much
 gusty anvil
howdy folks
can anyone here help me to capture network requests with python'
I tried everything 😦
loud cave
Maybe in #networks you will find what you seek? Or are you working on a data science project around network requests?
gusty anvil
maybe the latter right?
I'm trying to scrape data

I guess it should be simple
but I've been trying for a couple of days without any proper solution
bold timber
Why I get an error when I want to use 'f1 score' for scoring the model?

when I use 'accuracy' for scoring, it has well
loud cave
Hard to tell without the full call stack. But I guess the set of values between y_test and predicted aren't the same
 dim trail
Hi guys!! could anyone help me out?
I have all these Dfs, I want to merge them all iteratively, creating at each step a new DF and then merging it with the next. Do you guys have an idea how to do that?
 loud cave
Do they all contain the same columns? It looks like they don't. So are you saying you want to merge DF1 and DF2 together to create DF3?
dim trail
no the first df with the second df merged are DF1, then DF1 with the next df is DF2 and so on
bold timber
loud cave
Hard to tell without the full call stack. But I guess the set of values between ...
But why do different types of scoring model get different results?
dim trail
and I want a Final DF with all columns in the same DF, (matching the boolean values)
loud cave
bold timber
But why do different types of scoring model get different results?
Maybe accuracy is able to run without crashing because it only checks whether predicted equals ground truth. A metric like F1 has to know true positive, true negative, etc. It depends how sklearn implemented the metrics
bold timber
loud cave
Maybe accuracy is able to run without crashing because it only checks whether pr...
The dataset explain true label is 4825 and false label is 747. What should I choose for scoring the model?
loud cave
It's not that the metric is inappropriate
The problem is something is wrong with the data that's being passed to it
bold timber
I thought it is slightly balanced, but I just to try use f1 score
loud cave
what is model.score in randomizedsearchcv?
I never used that class
when you create a randomizedsearchcv and pass it scoring='f1, does model.score basically become a wrapper around sklearn.metrics.f1_score?
If that's true then the problem is that you're calling model.score(x_test, y_test
you need to do something like
y_pred = model.predict(x_test)
score = model.score(y_pred, y_test)
that is calculating all of estimator and parameter in the pipeline
like this
 loud cave
so when you call model.score(x_test, y_yest) it calls the pipeline and predict using x_test?
bold timber
loud cave
so when you call `model.score(x_test, y_yest)` it calls the pipeline and predict...
yes, every calculation has been calculated in pipeline

 latent tendon
Hi
I need some help with my k means implementation
I am trying to printmy cluster assignments
class K_Means: #Step 2
    def init(self, k=3, tol=0.001, max_iterations=100):
        self.k = k
        self.tol = tol
        self.max_iterations = max_iterations

    def fit(self,data): #Step 3
        self.centroids = {}
        for i in range(self.k):
            self.centroids[i] = data[i]
        for i in range(self.max_iterations):
            self.classify = {}
            for i in range(self.k):
                self.classify[i] = []

            for features in data: #Step 4
                distances = [np.linalg.norm(features-self.centroids[centroid]) for centroid in self.centroids]
                classify = distances.index(min(distances))
                self.classify[classify].append(features)

            prev_centroids = dict(self.centroids) #Step 5

            for classification in self.classify:
                self.centroids[classification] = np.average(self.classify[classification],axis=0)

            optimized = True #Step 6
            for c in self.centroids:
                original_centroid = prev_centroids[c]
                current_centroid = self.centroids[c]
                if np.sum((current_centroid-original_centroid)/original_centroid100.0) > self.tol:
                    print(np.sum((current_centroid-original_centroid)/original_centroid*100.0))
                    optimized = False

            if optimized: #Step 7
                break

    def predict(self,data): #Step 8
        distances = [np.linalg.norm(data-self.centroids[centroid]) for centroid in self.centroids]
        classification = distances.index(min(distances))
return classification ```clf.fit(X)
for centroid in clf.centroids:
plt.scatter(clf.centroids[centroid][0], clf.centroids[centroid][1],
marker="x", color="g", s=30)
for classification in clf.classify:
color = colors[classification]
for features in clf.classify[classification]:
plt.scatter(features[0], features[1], marker="o", color=color, s=30)
plt.show() ```This is my code above ^
rigid zodiac
latent tendon
I need some help with my k means implementation
can you paste it in this
arctic wedgeBOT
Pasting large amounts of code
If your code is too long to fit in a codeblock in discord, you can paste your code here:
https://paste.pythondiscord.com/
After pasting your code, save it by clicking the floppy disk icon in the top right, or by typing ctrl + S. After doing that, the URL should change. Copy the URL and post it here so others can see it.
 hasty nimbus
Hi, I would like to get some help .
I have an array like this (sample)..
import numpy as np

arr = np.array([[0.045, 0.531, 0.53],
                [0.968, 0.051, 0.013],
                [0.653, 0.304, 0.332],
                [0.065, 0.123, 0.033],
                [0.035, 0.328, 0.333],
                [0.065, 0.330, 0.333]],np.float32)

print("before\n")
print(arr)
arr_sum = np.array(arr.sum(axis=0),dtype=np.float32)
arr = arr / arr_sum

print("\nafter\n")
print(arr)

print("\nsums\n")
print(np.array(arr.sum(axis=0),dtype=np.float32))
@rigid zodiac done
hasty nimbus
hasty nimbus
Hi, I would like to get some help .
I have an array like this (sample)..
```p...
This one gives an output like this:
before
[[0.045 0.531 0.53 ]
[0.968 0.051 0.013]
[0.653 0.304 0.332]
[0.065 0.123 0.033]
[0.035 0.328 0.333]
[0.065 0.33 0.333]]
after
[[0.02457674 0.31853628 0.33672175]
[0.5286729 0.03059388 0.00825921]
[0.35663575 0.1823635 0.21092758]
[0.03549973 0.07378524 0.02096569]
[0.01911524 0.19676064 0.21156292]
[0.03549973 0.19796039 0.21156292]]
sums
[1. 0.99999994 1.0000001 ]
where the actual sum has to be precisely 1 (sum of probabilities)
[1. 1. 1.]
This is what happens when using the float32, but only if it the initial array values are of float32 type, I could move forward for the model training..
latent tendon
@rigid zodiac Do I press the save button yh
hasty nimbus
hasty nimbus
This one gives an output like this:
before
[[0.045 0.531 0.53 ]
[0.968 0.051 ...
any help is appreciated, thanks
 subtle breach
hi all! I need kde subplotting code help..
do i ask in any help group?
'''
c = df2.charges.values
d = df2.region
Set the dimensions of the plot
widthInInches = 10
heightInInches = 4
plt.figure( figsize=(widthInInches, heightInInches) )
Draw histograms and KDEs on the diagonal usin
#if( int(versionStrParts[1]) < 11 ):
Use the older, now-deprectaed form
ax = sns.distplot(c,
kde_kws={"label": "Kernel Density", "color" : "black"},
hist_kws={"label": "Histogram", "color" : 'lightsteelblue'}
# )
#else:
Use the more recent for
ax = sns.kdeplot(c, color="black", label="Kernel Density")
ax.set_ylim(0,)
ax.set_xlim(0,)
sns.histplot(c, stat="density", bins=50, color = "lightsteelblue", label="Histogram" )
ax = sns.kdeplot(c, color="green", label="Kernel Density")
ax.set_ylim(0,)
ax.set_xlim(0,)
sns.histplot(c, stat="density", bins=50, color = "lightsteelblue", label="Histogram" )
''
trying to make that into 4 different subplots > region is one column with 4 different regions in hence need charges for the diff regions...?
hasty nimbus
fig, axes = plt.subplots(ncols=2,nrows=2,figsize=(10,4))
sns.your_plot_type(plot value, ax=axes[0][0])
sns.your_plot_type(plot value, ax=axes[0][1])
sns.your_plot_type(plot value, ax=axes[1][0])
sns.your_plot_type(plot value, ax=axes[1][1])
can u try this and check out
subtle breach
what do i put for plot value?
hasty nimbus
the same thing that you want to plot..
subtle breach
so basically
hasty nimbus
try adding the axis only..
subtle breach
region column has 4 diff regions: southeast, southwest etc etc
hasty nimbus
it might have to work
subtle breach
and i need to plot values for each one..
that basically just plots the summation of all charges, doesnt filter if i put df[charges] in plot value
Stack Overflow
I am simply! trying to plot either 4 graphs (subplots) of KDE or 1 with 4 lines..
I have two columns (well actually more in df but these ones im interested in for now)
Region: Charges:
southea...
hasty nimbus
subtle breach
https://stackoverflow.com/questions/70382844/how-to-subplot-multiple-kde-distrib...
so you are not trying to plot four graphs on same plot?